Abstract
Thiophosphate compounds have attracted much attention in coordination chemistry, but their deep adsorption mechanism remains underexplored as flotation collectors. The flotation performance and adsorption mechanism of a novel (dibutoxy-thiophosphorylsulfanyl)-acetic acid (CDDP) chelating collector on azurite surfaces were studied by micro-flotation tests, zeta potential measurements, and Fourier transform infrared (FTIR), X-ray photoelectron spectroscopy (XPS) and field emission scanning electron microscopy (FE-SEM) analysis. The micro-flotation results indicated that CDDP exhibited superior collecting performances to direct flotation recovery of azurite and floated over 91.44% of azurite at pH 7. For sodium isopentyl xanthate (NaIX) and Benzohydroxamic acid (BHA) collectors, the addition of Na2S still did not show good collection performance. The results of zeta potential, FTIR, XPS and FE-SEM measurements, all confirmed that CDDP showed a better affinity to azurite surfaces than NaIX and BHA. Furthermore, XPS and FE-SEM provided obvious evidence that CDDP could easily react with Cu2+ sites on azurite surfaces. Using the density functional theory (DFT) method, the collection capacity of azurite was CDDP > BHA > NaIX, which exactly matched the micro-flotation results. In addition, this study provided an atomic-scale understanding of the structure–property relationship of CDDP as chelating agents for copper mineral flotation.
1. Introduction
With the industrial depletion of high-grade copper sulfide resources increasing, the recovery and utilization of copper oxide ore have gradually become a substitute for copper resources [1,2]. Froth flotation is an economic separation technique which has been widely used in the copper mining industry to recover copper minerals from gangue minerals. In froth flotation, copper oxide minerals, such as malachite (Cu2CO3 (OH)2), chrysocolla ((Cu,Al)2H2Si2O5(OH)4·nH2O) and azurite (Cu3(CO3)2(OH)2), have abundant hydroxyl groups. Thus, it is hard to form hydrophobic groups that exhibit weaker floatability in pulp than copper sulfide minerals [3,4].
Two main flotation methods are applied in the flotation of copper oxide, which is direct flotation and sulfidization. Feng reported that excessive vulcanizing agent could decrease the flotation effect of malachite in the slurry system of xanthate as a collector, which proved excessive sulfidization existed in the sulphidizing flotation [5]. Cai further concluded that the excessive sulfiding agents enhanced the crystal copper sulfide-forming onto the azurite surface, but the generated massive copper sulfide colloid inhibited xanthates adsorption onto azurite mineral surfaces, thus the recovery of azurite decreased sharply [6]. Therefore, choosing the direct flotation process for copper oxide ore is an alternative.
Traditional sulfide copper collectors do not respond well to copper oxide minerals, mainly because they are not effective in changing their highly hydrophilic surfaces into hydrophobic ones [2,7,8]. Chelating reagents have been generally regarded as alternative collectors in view of their particular characteristics and selective complex metal ions and have been widely exploited for the direct flotation of copper oxide minerals [9,10,11], such as oximes [12,13,14,15,16], hydroxamic acids [17,18,19,20], phosphonic acids [21] and azolethione compounds [1,22], which exhibit a strong specific affinity to copper oxide minerals. Although the above reagents are very valuable for collecting metal oxides from ore, their industrial application has not been commercially applied; the reason for this is that copper concentrate has poor performance, high cost and environmental concerns. Tijsseling found that dithiophosphate collectors achieved more success with the highest recovery of sulfide minerals and copper oxides after oxide sulfidization than xanthate, phosphorodithioate and thiocarbamate collectors [23]. Liu studied the structure–reactivity relationship of thiophosphorus acids as flotation collectors with sulfide minerals by the DFT method [24]. The theoretical results tested the thiophosphoruse with a strong affinity to mineral surfaces. Based on the previous studies [25,26], S-carboxymethyl-O, O′-dibutyl dithiophosphate (CMDTP) exhibited strong adsorption and selectivity for malachite in calcite or quartz; however, Cu2+ ions could activate calcite for its adsorption onto a calcite surface, and then Na2S was needed to eliminate the negative effect of Cu2+ ions released from malachite. Thiophosphate compounds have attracted much attention in copper mineral flotation, but their deep adsorption mechanism remains underexplored as flotation collectors.
Furthermore, most studies on chelating collectors proposed the hydrophobic mechanism of malachite surfaces, but rarely discussed its effect on azurite surfaces. Azurite is one of the most important copper oxide minerals, along with malachite and chalcopyrite, which is used to produce copper concentrate, arts and crafts materials, pigments, etc. [27]. Azurite, a monoclinic mineral, is often associated with malachite in the oxidation zone of copper deposits. As is well known, azurite has similar compositions and, like malachite, hardly floats without any treatment [28].
In response to the aforementioned problems, this study aimed to synthesize a novel thiophosphate compounds collector with functional groups for the direct flotation of azurite. The flotation performance and adsorption mechanism of a (dibutoxy-thiophosphorylsulfanyl)-acetic acid (CDDP) chelating collector on an azurite surface was studied by micro-flotation experiments, zeta potential measurements, FTIR, XPS analysis, FE-SEM and DFT.
2. Materials and Methods
2.1. Materials and Reagents
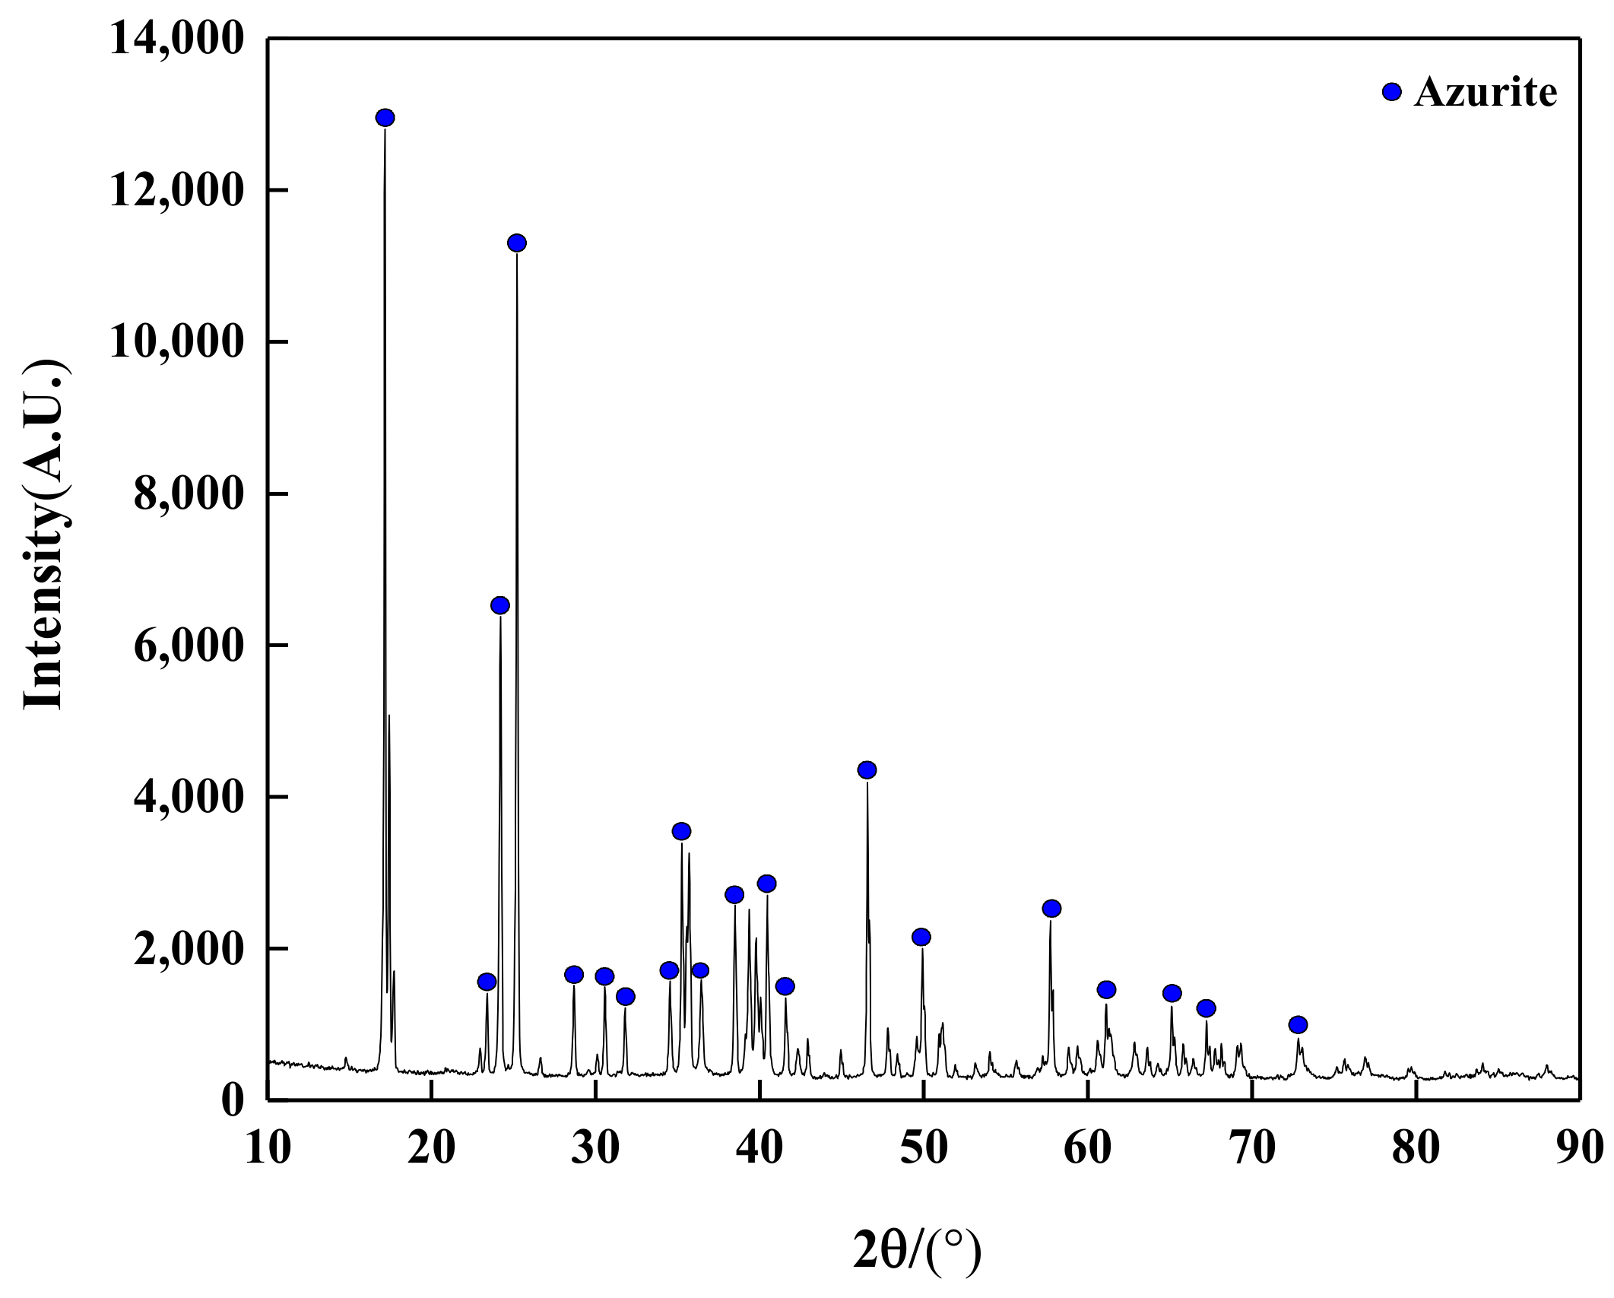
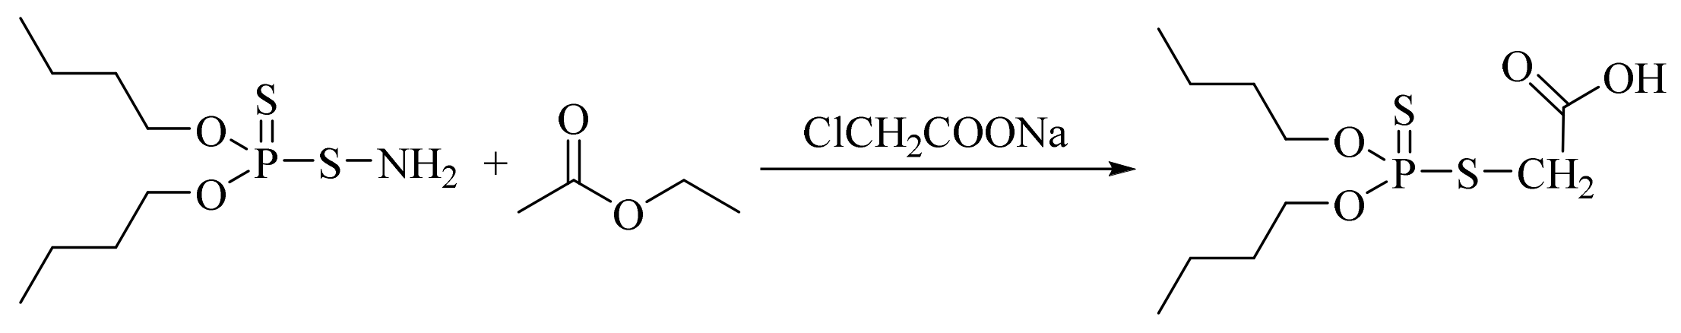
The X-ray diffraction (XRD) pattern of azurite is shown in Figure 1, and the chemical analysis results are shown in Table 1. The purity of azurite was 98%. The powdered samples were prepared as follows: each sample was first crushed with a hammer, the gangue was manually selected and crushed in an agate mortar, and the crushed sample was screened to obtain 44~74 μm particles. Additionally, 44~74 μm fractions of azurite were used in the micro-flotation experiment. Fractions with sizes less than 5 μm were prepared for zeta potential, FTIR and XPS measurements. Powdered pure azurite samples were collected from the Laos mine, China. Sodium isoamyl xanthate (NaIX) and benz hydroxamic acid (BHA) were used as the flotation collectors, and sodium sulfide (Na2S) was applied as the sulfurizing agent. Hydrochloric acid and sodium hydroxide were used as the pH regulator in flotation and zeta potential measurements. Methyl isobutyl methanol (MIBC) was used as a frother. Deionized water was used in the preparation of the solutions for all experiments. CDDP was synthesized in our laboratory as following the route listed in Scheme 1.
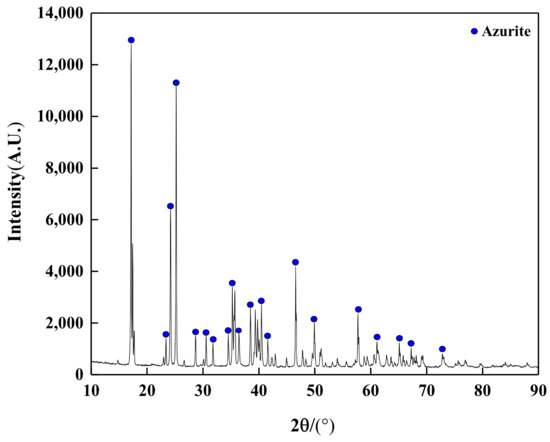
Figure 1.
XRD pattern of the azurite samples.

Table 1.
Chemical composition of the pure azurite mineral.

Scheme 1.
Synthetic route of CDDP.
2.2. Micro-Flotation Tests
The micro-flotation experiments were performed in the 40 mL XFG5-35 flotation machine with a spindle speed of 1750 r/min. Before each micro-flotation test, 2.0 g azurite samples were put into a 100 mL beaker containing 60 mL water and purified by ultrasonic for 3 min. Then, the sample was transferred into the flotation machine cell with deionized water and stirred for 1 min. Step by step, the pH regulator, collectors and frother (MIBC) were added to the solution with stirring times of 2 min, 3 min and 1 min, respectively. Afterwards, the flotation product was collected for 3 min after turning on the inflation switch. According to the process flow in Figure 2, the tests were repeated five times. At last, the flotation concentrates and tailings were dried and weighed to calculate the flotation recovery.
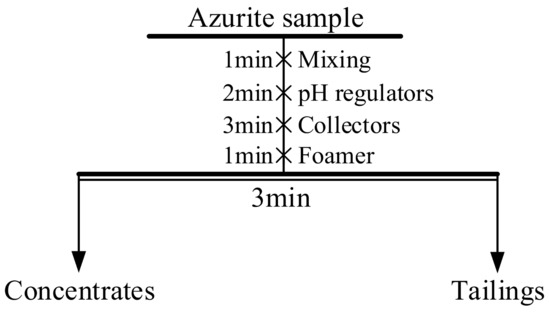
Figure 2.
Flowsheets of flotation experiments of pure azurite mineral.
2.3. Zeta Potential Measurements
Malvern Zetasizer Nano ZS90 was used to measure the zeta potential of azurite. The mineral samples (0.05 g, −5 μm) were introduced into 50 mL Potassium chloride (KCl) (5 × 10⁻³ mol/L) background solutions in the absence and presence of collectors for each test. The pH value above the solution was adjusted with certain dilute hydrochloric acid (HCL) or Sodium hydroxide (NaOH) solutions. Then, NaIX solutions were added and caused to react in the beaker by stirring for 5 min. After setting for 5 min, the suspension samples were placed in the electrophoresis tank for zeta potential measurement. The results were measured three times independently, and the average value was recorded as the final potential value of azurite samples with a typical variation of ±5 mV.
2.4. FT-IR Experiments
A Nicolet IS50 series FT-IR spectrometer was utilized to characterize the infrared spectrum of each sample using the Potassium bromide (KBr) disks technique in the 3000–500 cm−l and 4000–500 cm−l region. Azurite (1.00 g, −5 μm) particles and deionized water (100 mL) were mixed in a beaker (250 mL) and the pH value was adjusted by using a specific concentration of HCL or NaOH. The CDDP was added to the pulp suspension and stirred for 30 min at 25 °C. After filtering the solution, the precipitate was collected and rinsed three times using distilled water, then dried in a vacuum drying oven at 35 °C for 24 h.
2.5. XPS Analysis
XPS analysis was performed on a PHI5000 Versa Probe II spectrometer (PHI5000, ULVAC-PHI, Japan, Kanagawa-ken) with a monochromatic Al Kα X-ray source. Azurite (2.0 g, 44–74 μm) particles and deionized water (40 mL) were added by stirring for 1 min and the pH value was adjusted using HCL and NaOH. CDDP (2 × 10⁻⁴ mol/L) was mixed with the solutions and stirred with a magnetic stirrer (500 rpm) for 30 min at room temperature. Then the samples were filtered to obtain the solid material. The obtained solid samples were thoroughly rinsed with deionized water and vacuum dried at 40 °C.
2.6. FESEM-EDS Analysis
Along with 2 g of azurite powder, 40 mL of deionized water was put into a 50 mL beaker. The pH was adjusted to 7 with a specific concentration of hydrochloric acid or sodium hydroxide, the collector CDDP was added and stirred at 25 °C for 30 min, and the mixture was then filtered. The filtered minerals were washed with deionized water 3 times, and dried in a vacuum drying oven. After drying, a certain number of samples were taken into the sample chamber and after the vacuum was drawn, the samples’ surfaces were scanned with a fine-focused electron beam. Time excitation generated a physical signal to modulate the imaging, displayed the surface micro-topography of the material and selected a specific area for surface micro-area component analysis, to achieve a one-to-one correspondence between the micro-area topography analysis and the chemical composition analysis. The microstructure of the mineral surface was characterized by the Zeiss Gemini 300 field emission environmental scanning electron microscope, and the energy spectrum analysis was performed by the OXFORD Xplore 30 energy spectrometer (Oxford Instruments, Oxford, UK).
2.7. Density Functional Theory (DFT) Calculations
In this study, all simulations and calculations were performed using the CASTEP module in Materials Studio 8.0. Firstly, we optimized the azurite unit cell model, cut the surface of the optimized mineral unit cell, established a super unit cell and a vacuum layer and obtained the energy Es of the mineral crystal face model after geometrically optimizing the established surface. Secondly, we constructed a model of agent and obtained the energy Es of the agent after geometric optimization. The optimized agents were placed on the optimized mineral crystal surface, the initial adsorption model of the pharmaceuticals on the mineral surface was established and the optimal final adsorption state of the pharmaceuticals was obtained by optimization, and the total energy Ea after adsorption was obtained. Finally, calculated the adsorption energy of the agent ∆E, ∆E = Ea–Es–Ec [29]. The positive and negative values of the adsorption energy ∆E can be used to measure the stability of the adsorption system. The more negative the value, the more stable the adsorption of the system. If the value is zero or positive, the adsorption of the system is more difficult to occur.
3. Results and Discussion
3.1. Flotation Behavior
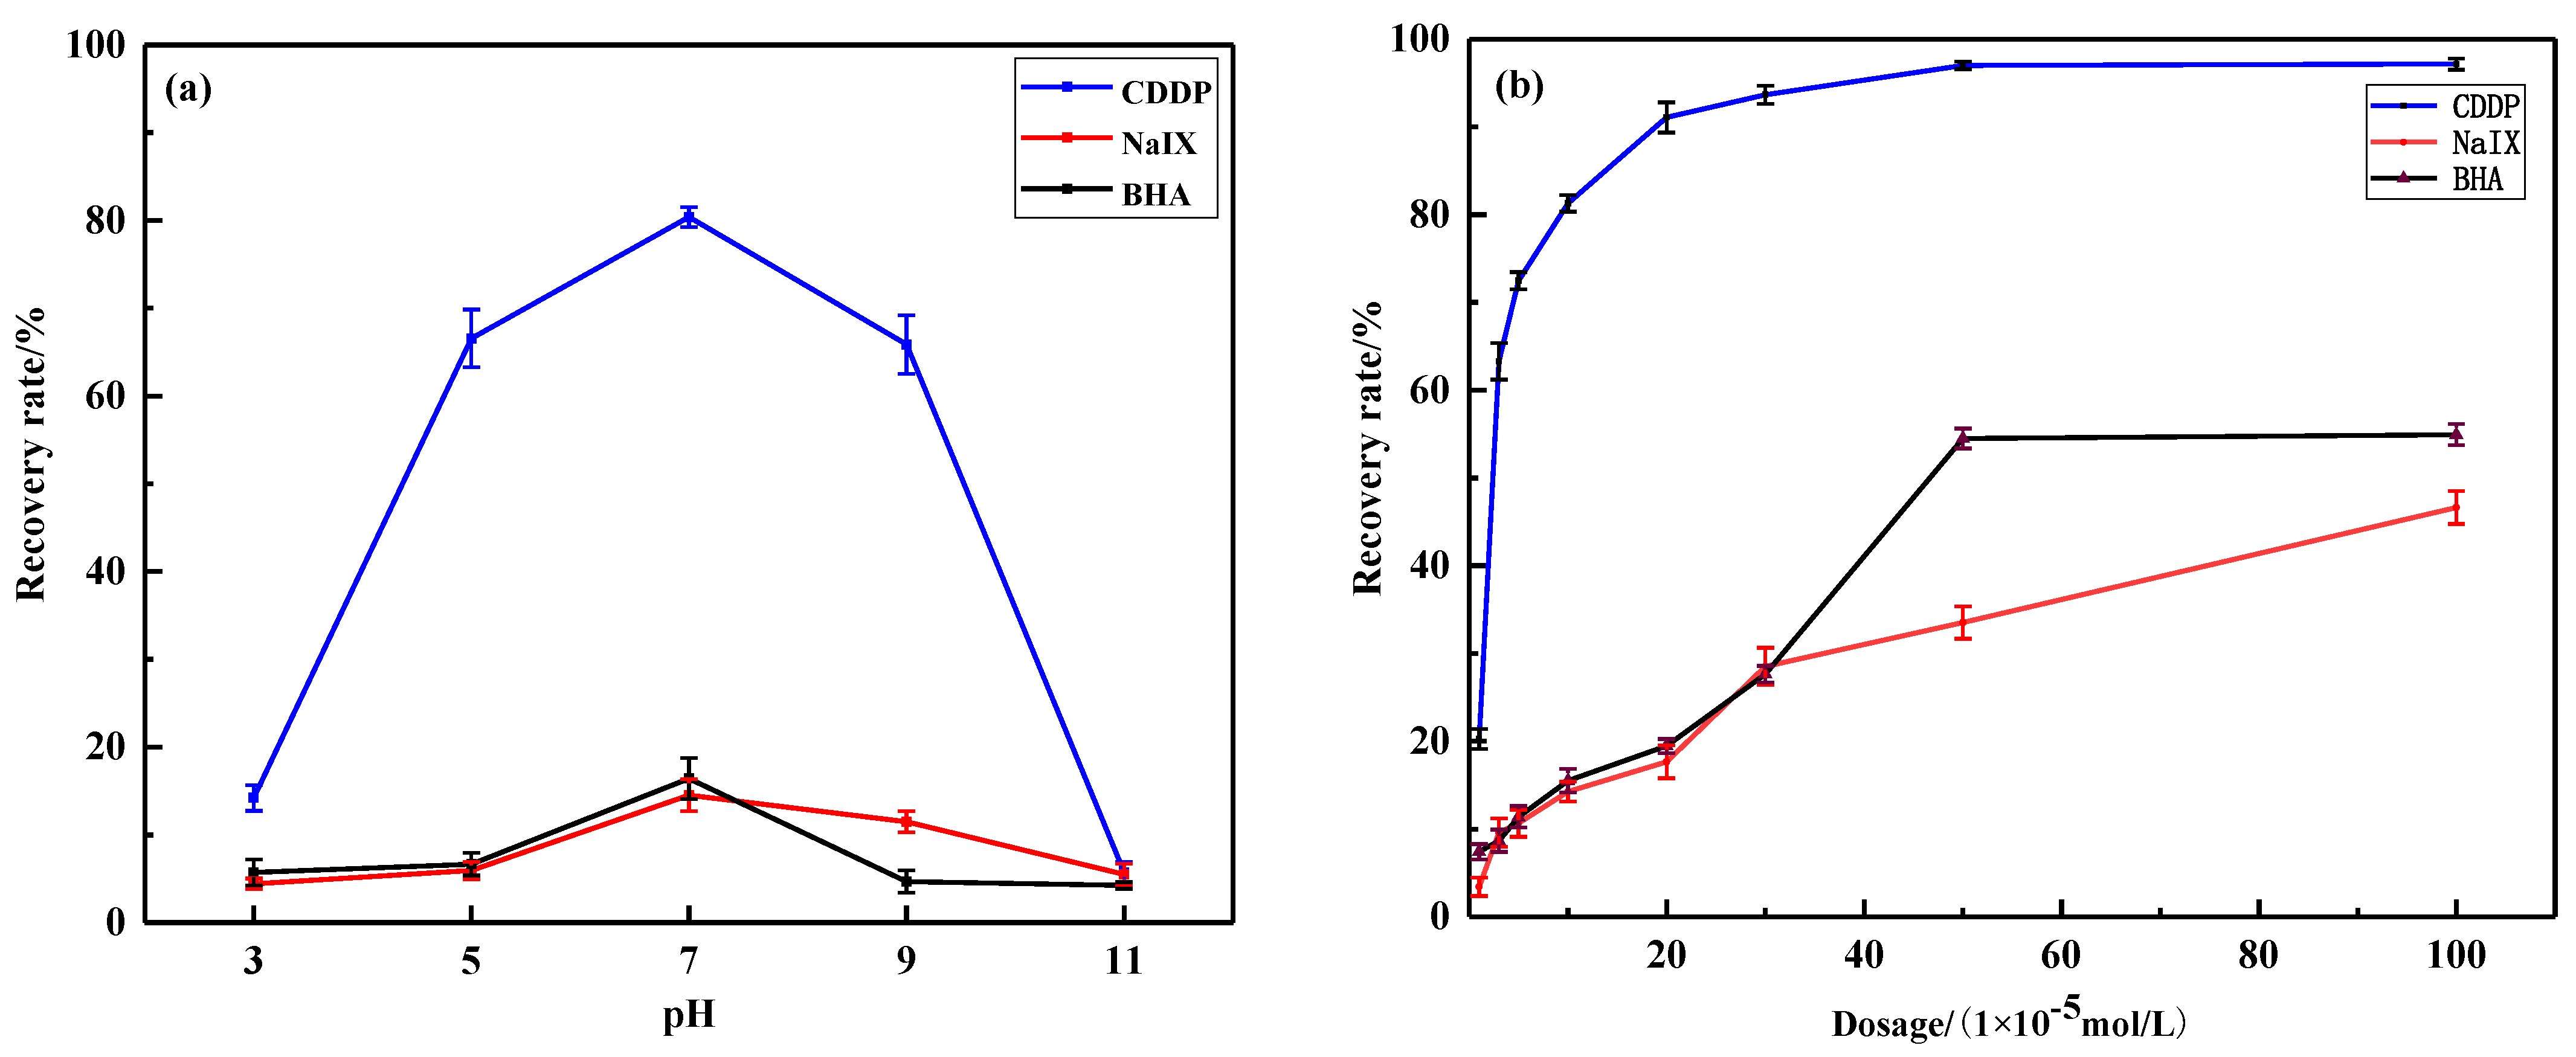
CDDP was used as a collector for azurite pure mineral flotation at a concentration of 1 × 10⁻⁴ mol/L. The results of azurite flotation as a function of pH values are shown in Figure 3a. It presents the variation of pH values from 3 to 11 when CDDP was used as a collector for flotation. The flotation recovery of azurite showed an increasing trend from pH 3 to 7, and the increase in pulp pH from 7 to 11 decreased the recovery rate of azurite insignificantly. At the pH of 7, the recovery rate reached 80.40%. Figure 3b reveals the result of the flotation recovery of azurite at different CDDP concentrations, ranging from 1 × 10⁻⁵ mol/L to 1 × 10⁻³ mol/L. As the concentration of CDDP increased from 1 × 10⁻⁴ mol/L to 3 × 10⁻⁴ mol/L, the azurite flotation recovery rose from 80.40 to 93.67% and then remained stable as the CDDP concentration increased. However, in the same conditions, NaIX and BHA collectors did not show good collecting ability at the optimal pH value and maximum dosage.
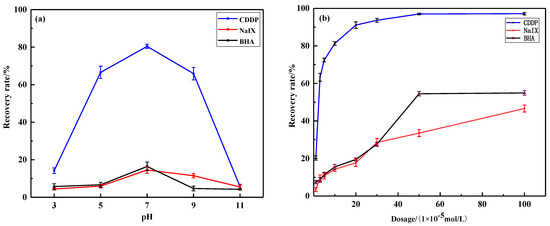
Figure 3.
(a) Effect of pH value on azurite flotation; (b) effect of collector dosage on azurite flotation.
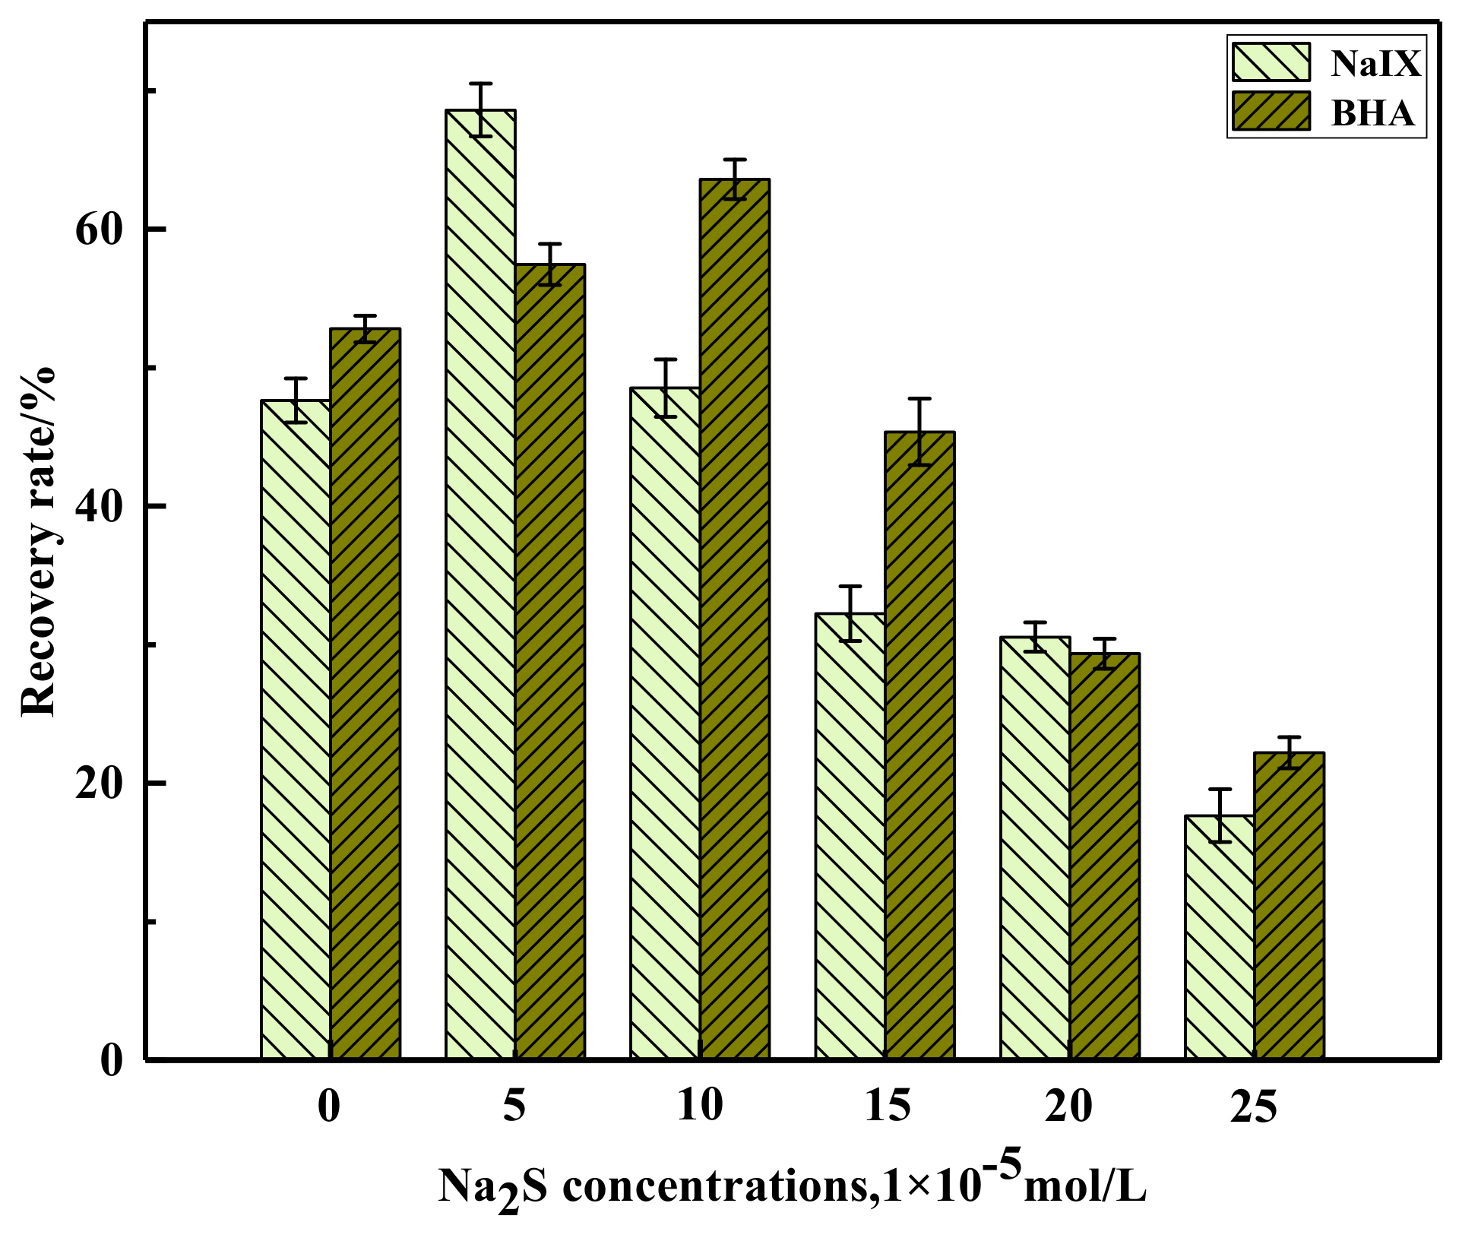
Figure 4 shows the flotation recovery of azurite in the presence and absence of Na2S with NaIX and BHA.At the optimum pH, NaIX and BHA did not show strong collecting ability in the presence of Na2S, less than 70% of the azurite was floated. Obviously, in the absence of Na2S, they still did not exhibit strong capture capacity for azurite. Given that, CDDP can achieve a satisfactory flotation performance without Na2S.

Figure 4.
Effect of Na2S dosage on azurite floatability.
3.2. Zeta Potential Measurements
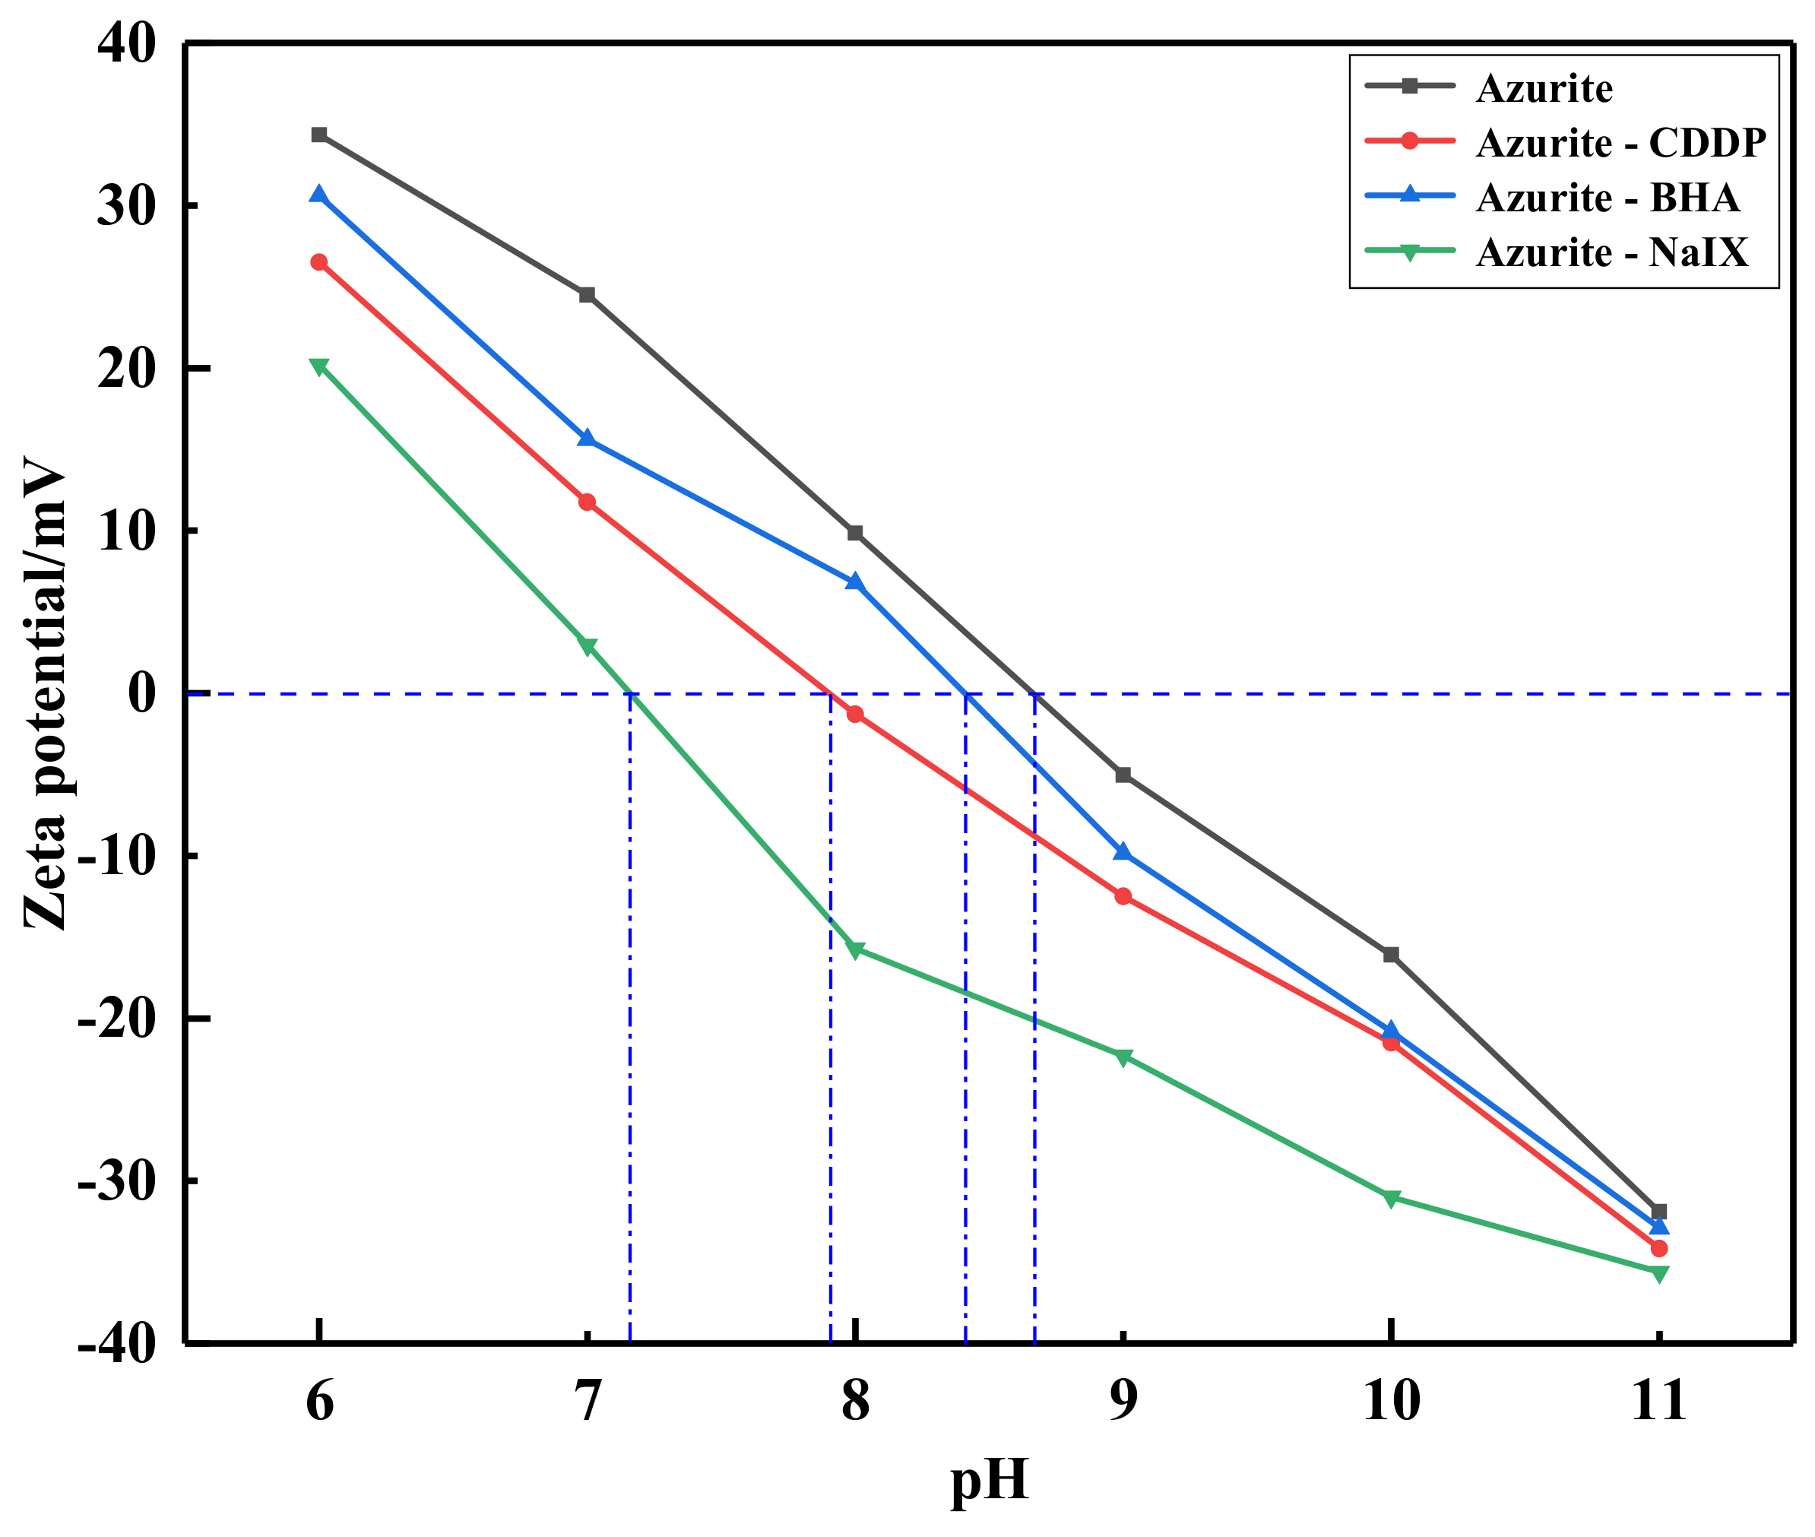
The change of zeta potential on the mineral surface could directly reflect the change of mineral surface properties [29,30]. As shown in Figure 5, the change of the zeta potential on the azurite surface with a pH value of pulp before and after adding collector, obviously demonstrates that the zeta potential of the azurite surface is shifted to the negative potential direction after adding the collector. The zero electric point (IEP) of azurite in clear water is 8.7, and after interacting with CDDP, BHA and NaIX the zero electric point decreases to 7.9, 8.4, and 7.2. This suggests that the anions ionized by the collector may be adsorbed on the azurite surface. From the negative shift of the zeta potential, the interaction strengths of the three collectors and azurite are NaIX, CDDP and BHA, in this order.
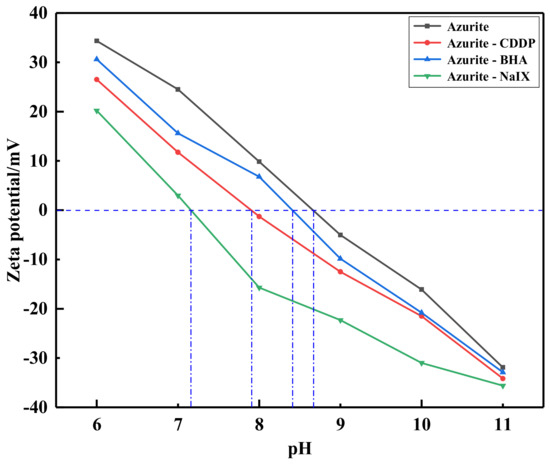
Figure 5.
Relationship between the zeta potential of azurite and the pH values before and after the addition of collectors.
3.3. FT-IR Analysis
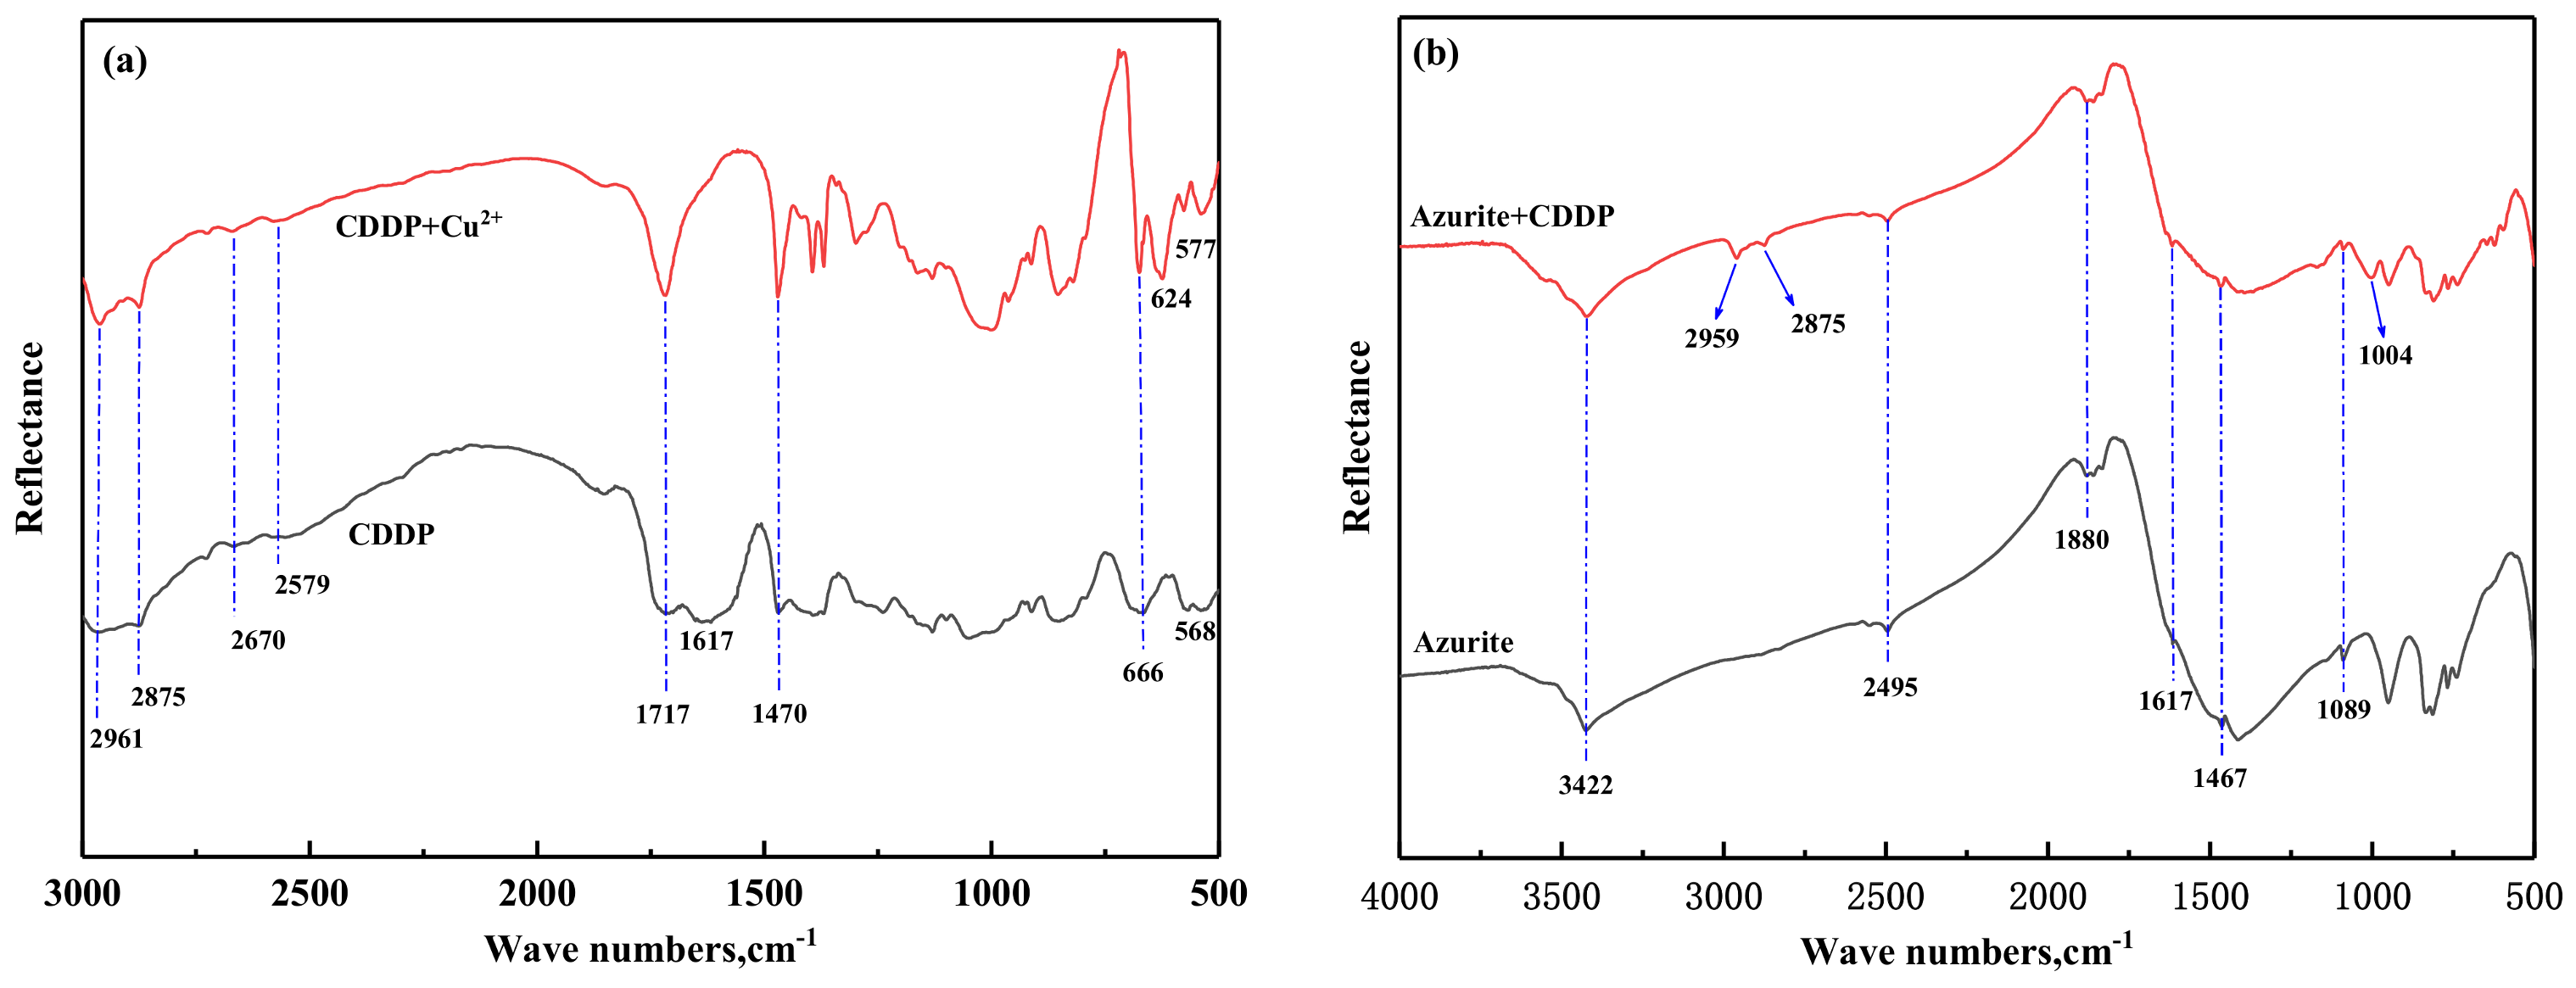
The FTIR spectra of CDDP and CDDP-Cu2+ precipitates and azurite before and after treatment with CDDP are shown in Figure 6a,b. Figure 6a indicates that the CDDP and CDDP-Cu2+ precipitates saturated C-H stretching vibrations and -CH3 or -CH2 deformation vibrations at 2961 cm−1, 2875 cm−1 and 1470 cm−1; they appear near 568 cm−1 and 666 cm−1. As for the PS2 symmetric and asymmetric stretching vibration; the peak of the stretching vibration assigned to the C=O group at 1717 cm−1 is strengthened in the CDDP/Cu2+ precipitate. The peak of CDDP at 568 cm−1 moved to 577 cm−1 in the CDDP/Cu2+ precipitate; at the peak of about 1617 cm−1 the CDDP-Cu2+ precipitate disappears, which means that the -OH bending disappeared; it is found at about 624 cm−1. The peak appears on the spectrum, which means that the Cu-O bond was formed. From Figure 6a, it can be inferred that the difference in the FTIR spectra of CDDP and CDDP-Cu2+ precipitates is due to the formation of CDDP-Cu2+ complexes after the reaction of CDDP with copper ions in the aqueous solution.
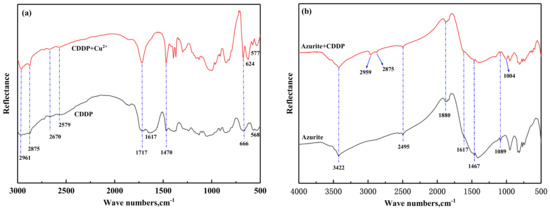
Figure 6.
(a) FT-IR spectra of CDDP and CDDP+Cu2+; (b) FT-IR spectra of azurite before and after interacting with CDDP.
Figure 6b shows that after CDDP treatment, -CH3 or -CH2 deformation vibrations are around 2959 cm−1 and 2875 cm−1, and -OH stretching vibrations in carboxylic acid are around 1004 cm−1, appearing on the azurite surface. Therefore, CDDP may be chemically adsorbed on azurite by forming a CDDP-Cu2+ surface complex.
3.4. XPS Analysis
XPS analysis is a useful method for accurately determining the chemical state and elemental composition of a mineral surface and is used to analyze the interaction between collectors and azurite [31,32]. The atomic content of Cu, C, O and S is listed in Table 1. The results in Table 2 indicate that the C and S atomic content on the azurite surface increased after CDDP treatment, while that of O and Cu atoms decreased.
Table 2.
The atomic concentrations of azurite and collector-treated azurite samples.
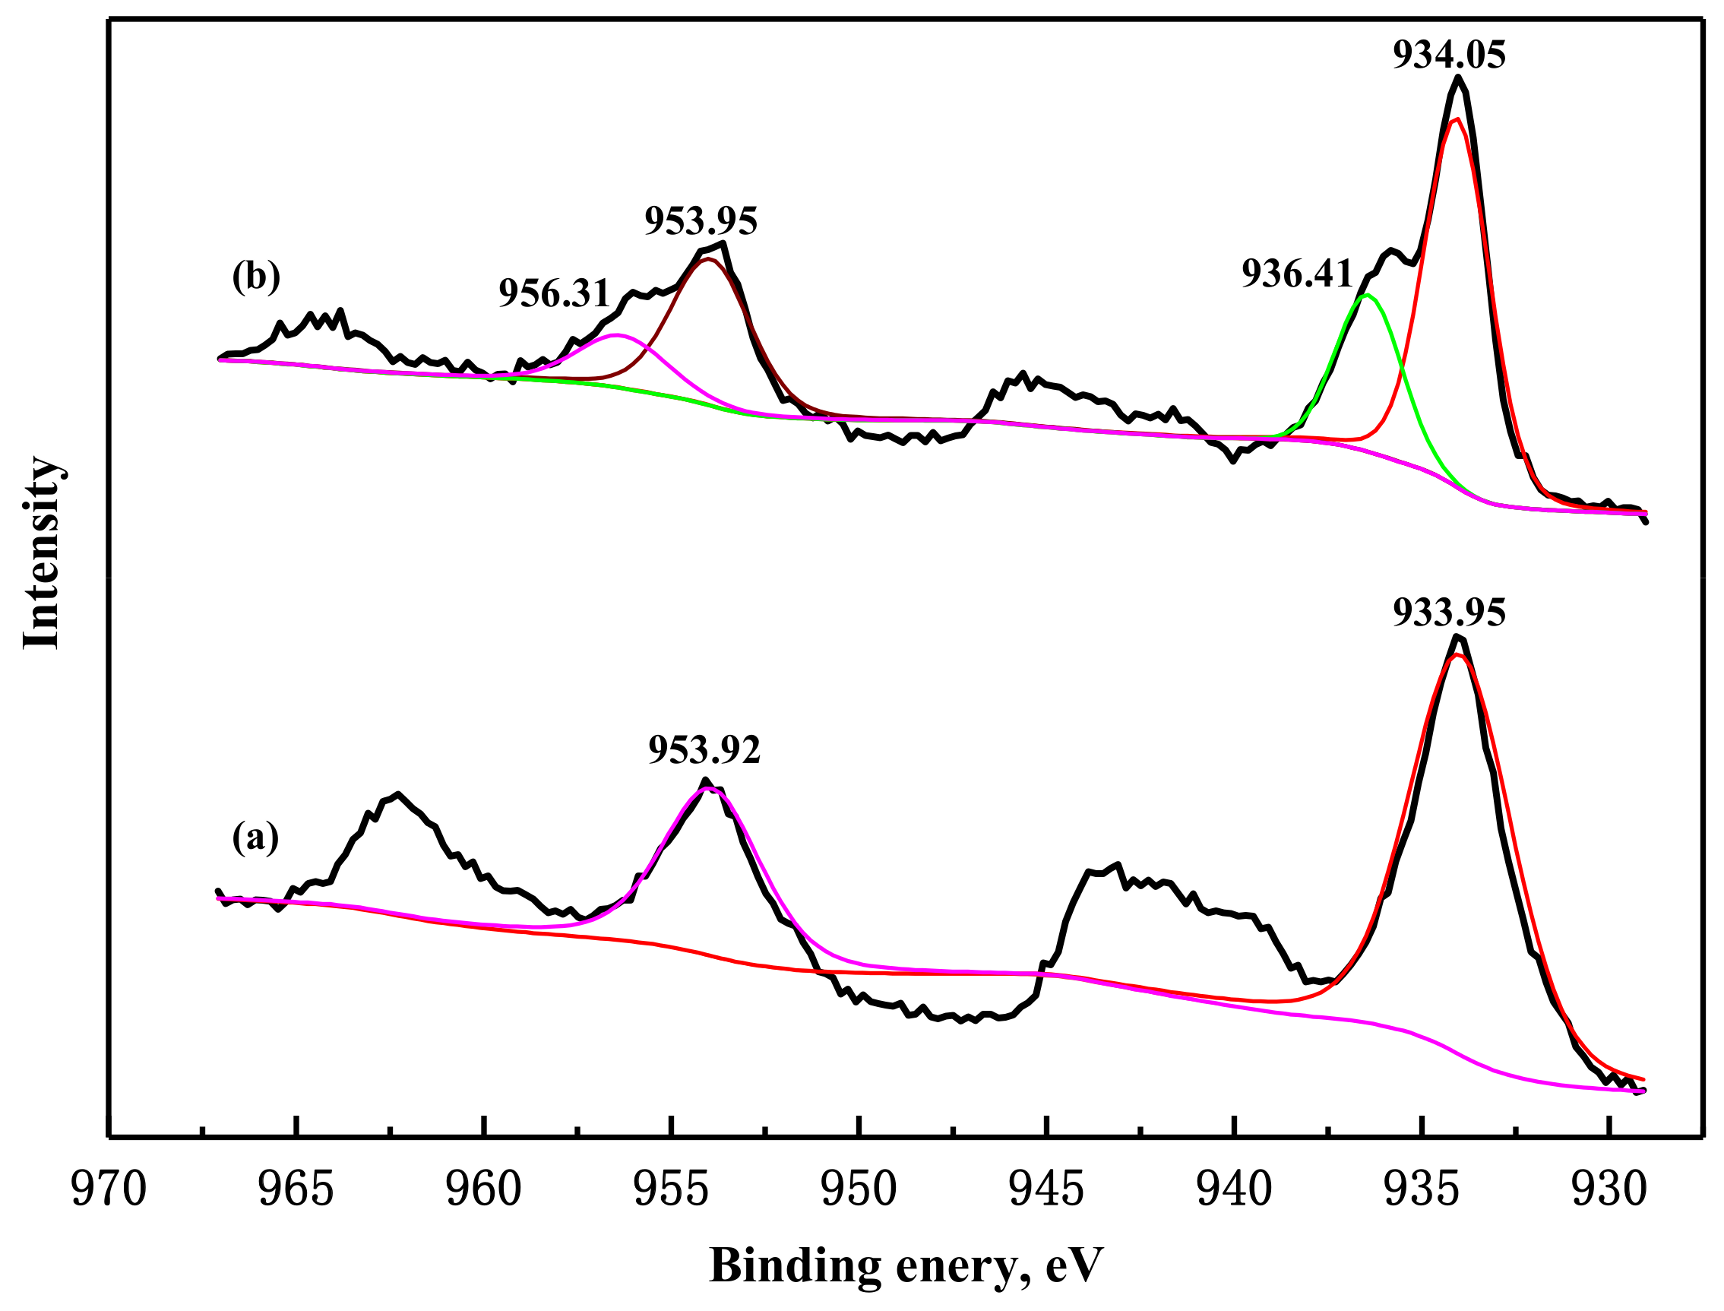
Figure 7 shows the Cu 2p spectra of the azurite and CDDP-treated azurite samples. The Cu signal of the azurite sample was fitted using two pairs of spin-orbit split peaks representing Cu 2p3/2 and Cu 2p1/2, whose binding energies are 933.95 and 953.92 eV, respectively, each of which appears as a single, symmetric peak. The Cu 2p1/2 and Cu 2p3/2 peaks, which were similar in appearance, and were assigned to the Cu2+ (cupric) species on the azurite surface. A pair of satellite peaks are also apparent in the Cu 2p spectra, it again shows the presence of Cu2+ on the surface of azurite [33]. For the azurite sample treated by CDDP (Figure 7b), in addition to the representative peak for Cu2+ species and the satellite peaks, a new doublet peak is fitted, with a binding energy of 936.41 and 956.31 eV. This result confirmed that some Cu2+ ions on the azurite surfaces are reduced to the Cu+ state, thus forming cuprous sulfide species. Table 3 also shows that the azurite sample is treated with CDDP. The proportion of Cu+ in the sample increased to 28.58%, which indicates that the mineral reacts with S in CDDP.
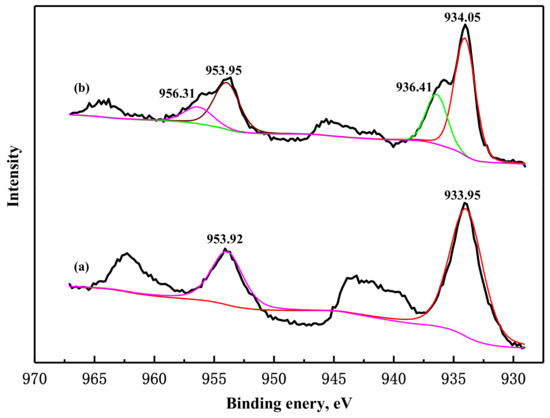
Figure 7.
(a) Cu 2p XPS spectra of azurite; (b) Cu 2p XPS spectra of azurite + CDDP.
Table 3.
Quantification of Cu 2p species in azurite and CDDP-treated azurite samples.
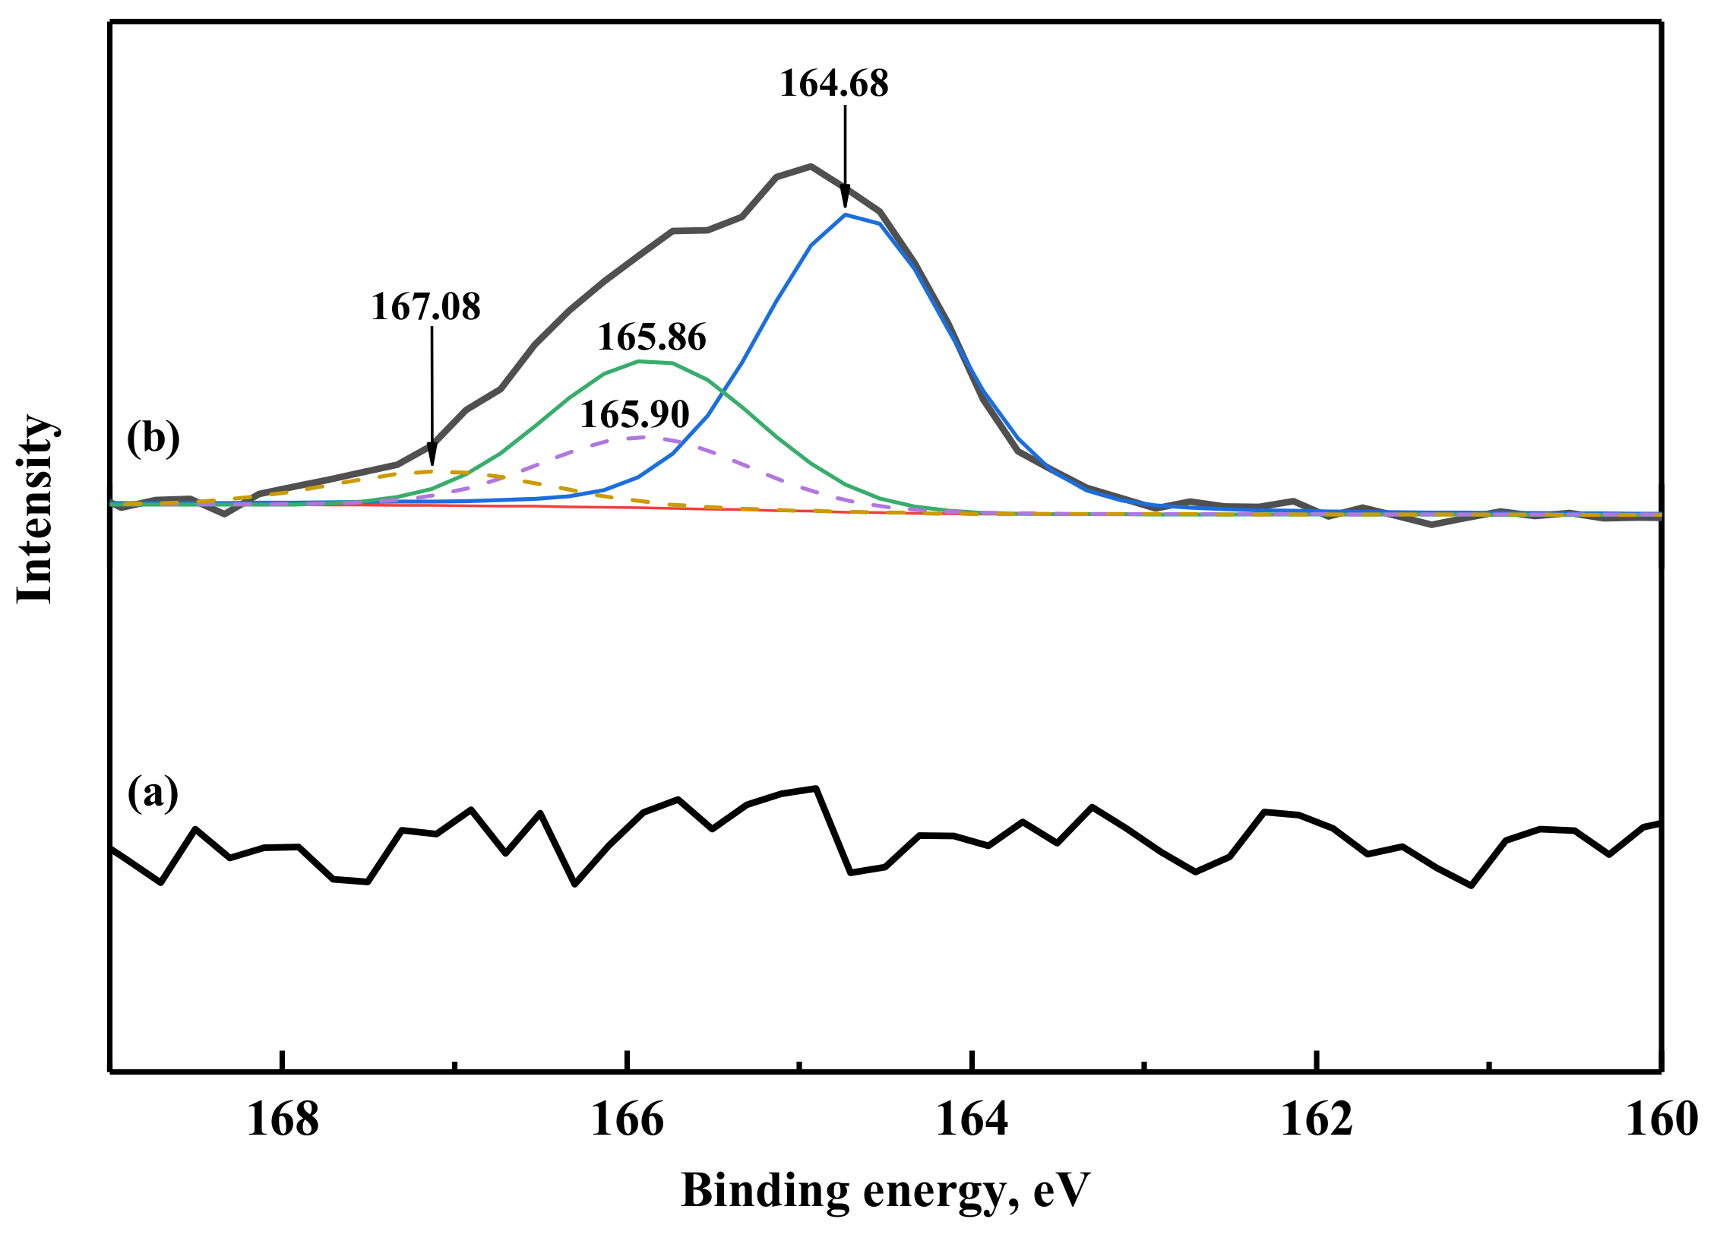
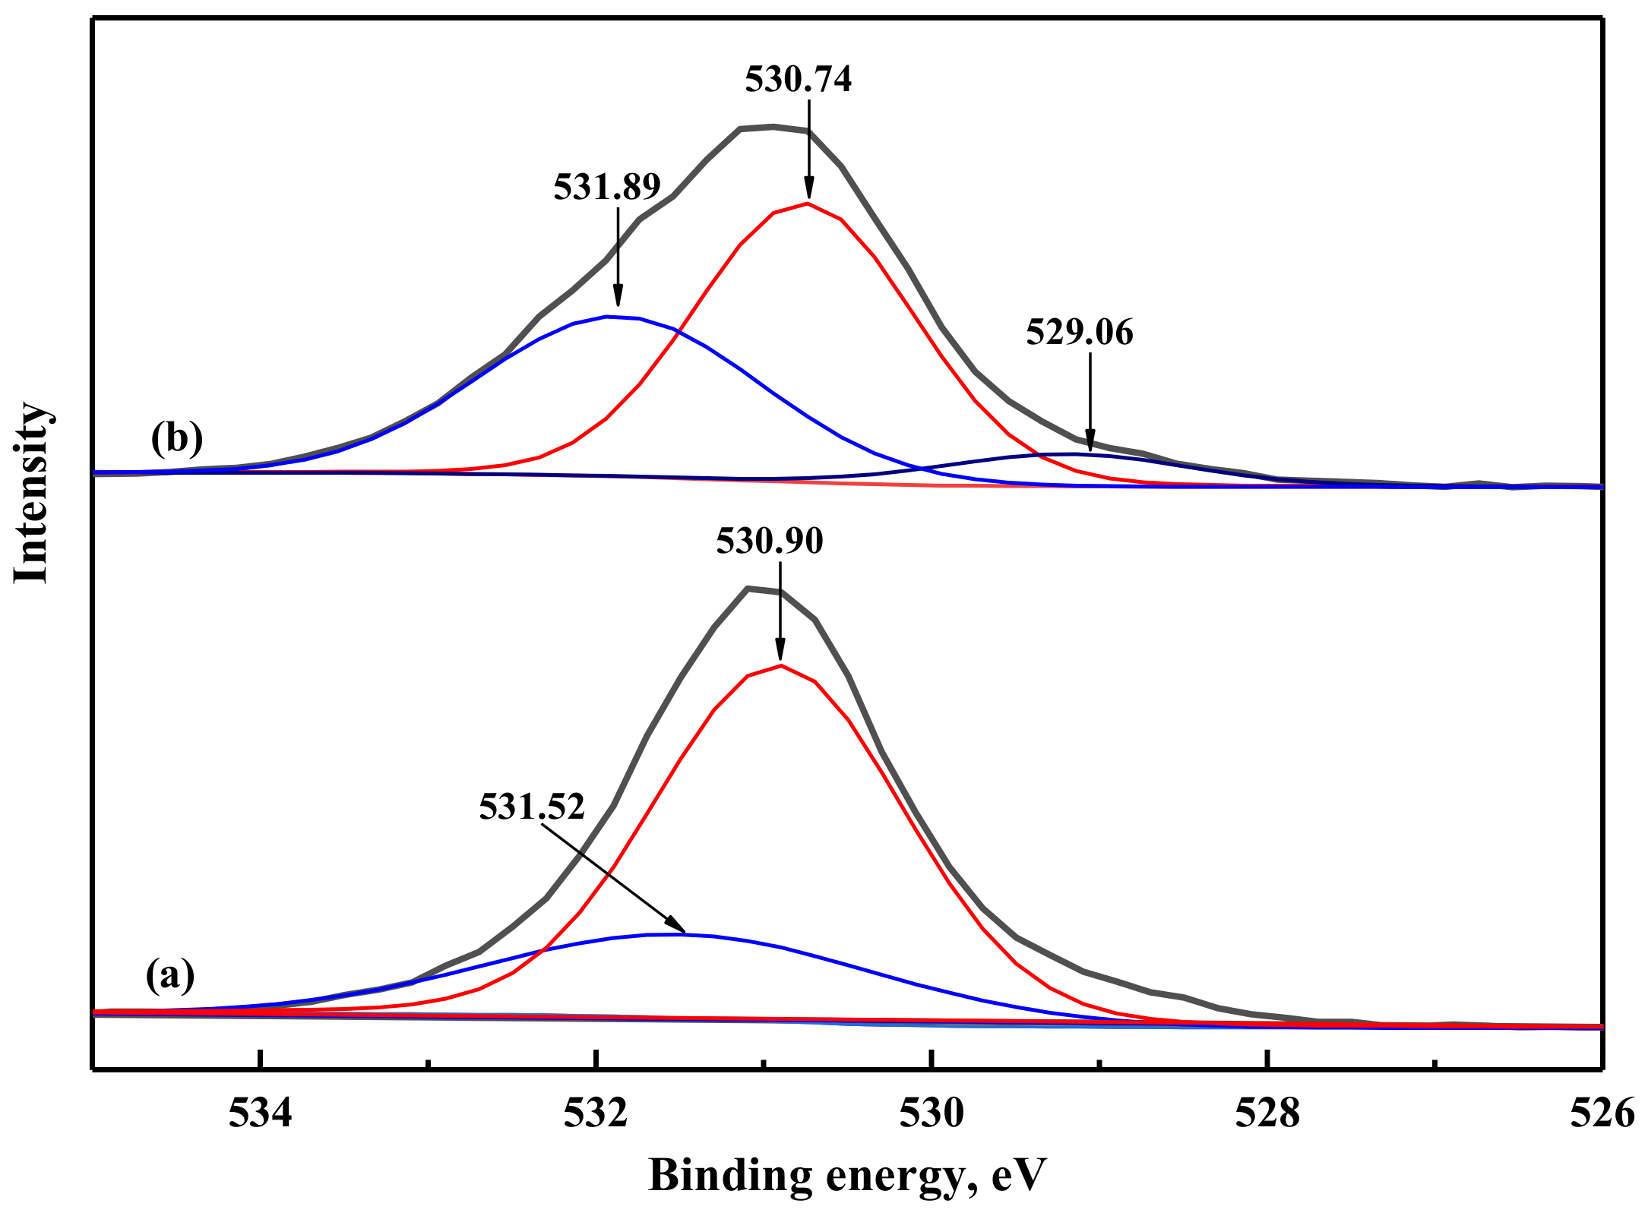
Based on Table 4 and Figure 8a, a small number of S species were present on the azurite surface before treatment with CDDP. These are the residual impurities during the crushing process of the raw ore, so the peak value cannot be fitted. After CDDP treatment the S 2p spectra are fitted by two doublet peaks (Figure 8b), consisting of S 2p3/2 and S 2p1/2 spin-orbit doublets separated by 1.18 eV with a 2:1 intensity ratio [34,35,36]. Of the two doublet peaks, one had binding energies of 164.68 eV (S 2p3/2) and 165.86 eV (S 2p1/2), while the binding energies of the other were 165.90 eV (S 2p3/2) and 167.08 eV of (S 2p1/2). These two doublets correspond to monosulfide (S2−) and polysulfide (Sn2−) species, respectively [37,38]. The presence of polysulfides on mineral surfaces is known to promote azurite hydrophobicity and thus flotation. Therefore, copper polysulfide formation plays a pivotal role in the increased recovery of azurite flotation. Table 4 presents the quantitative data obtained from the S 2p spectra of the pristine azurite and CDDP-treated azurite samples. In the case of the azurite sample treated with CDDP, the percentages of monosulfide and polysulfide species formed on the mineral surface are 80.17% and 19.83% of the total S. The results show that S in CDDP has a positive effect on the flotation of azurite [39,40]. Before CDDP treatment, the O 1s XPS peak of azurite had two components, which were CO32− of 530.90 eV and -OH of 531.52 eV (Figure 9a). The O 1s XPS peak could be fitted to three single peaks after CDDP treatment (Figure 9b). These three single peaks are considered to be -COOH at 529.06 eV.
Table 4.
S2p quantification of azurite and CDDP-treated azurite.
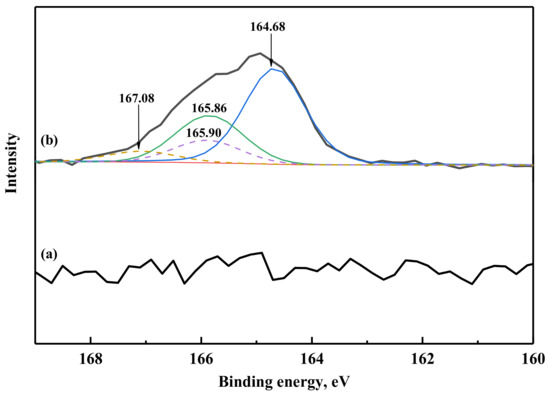
Figure 8.
(a) S2p XPS spectra of azurite; (b) S2p XPS spectra of azurite + CDDP.
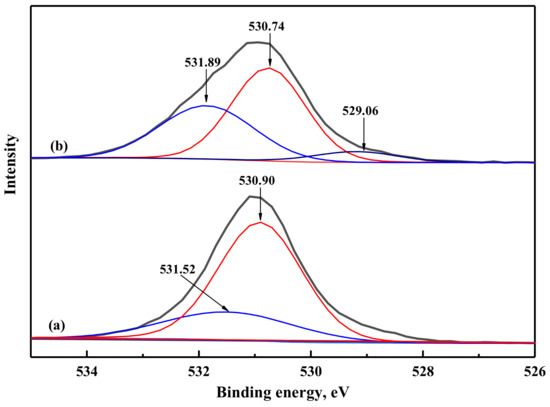
Figure 9.
(a) O1s XPS spectra of azurite; (b) O1s XPS spectra of azurite + CDDP.
3.5. FESEM-EDSanalysis
To discover the difference in the composition and morphology of the azurite surface before and after the agent, the morphology of the azurite surface was analyzed by scanning electron microscopy, the results of which are shown in Figure 10. From Figure 10a,b, it can be seen that before the CDDP action, the pure mineral particles of azurite were massive, the cleavage surface was relatively flat and the cleavage lines of azurite can be clearly observed. As shown in Figure 10c,d, CDDP was adsorbed on the surface of the mineral in a veined shape and the flat surface of azurite became uneven, indicating that the azurite surface underwent the interaction with CDDP. A certain degree of dissolution causes a sudden change in the microstructure of the azurite surface and improves its floatability [41].
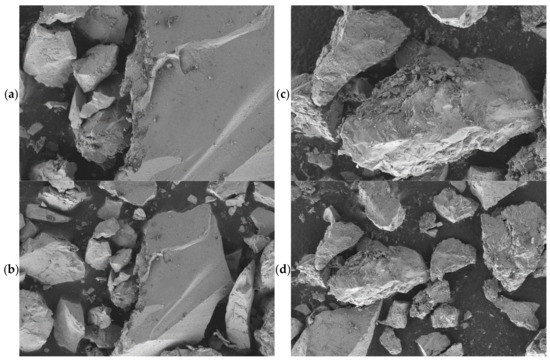
Figure 10.
The surface morphology of azurite: (a,b) before CDDP treatment; (c,d) after CDDP treatment.
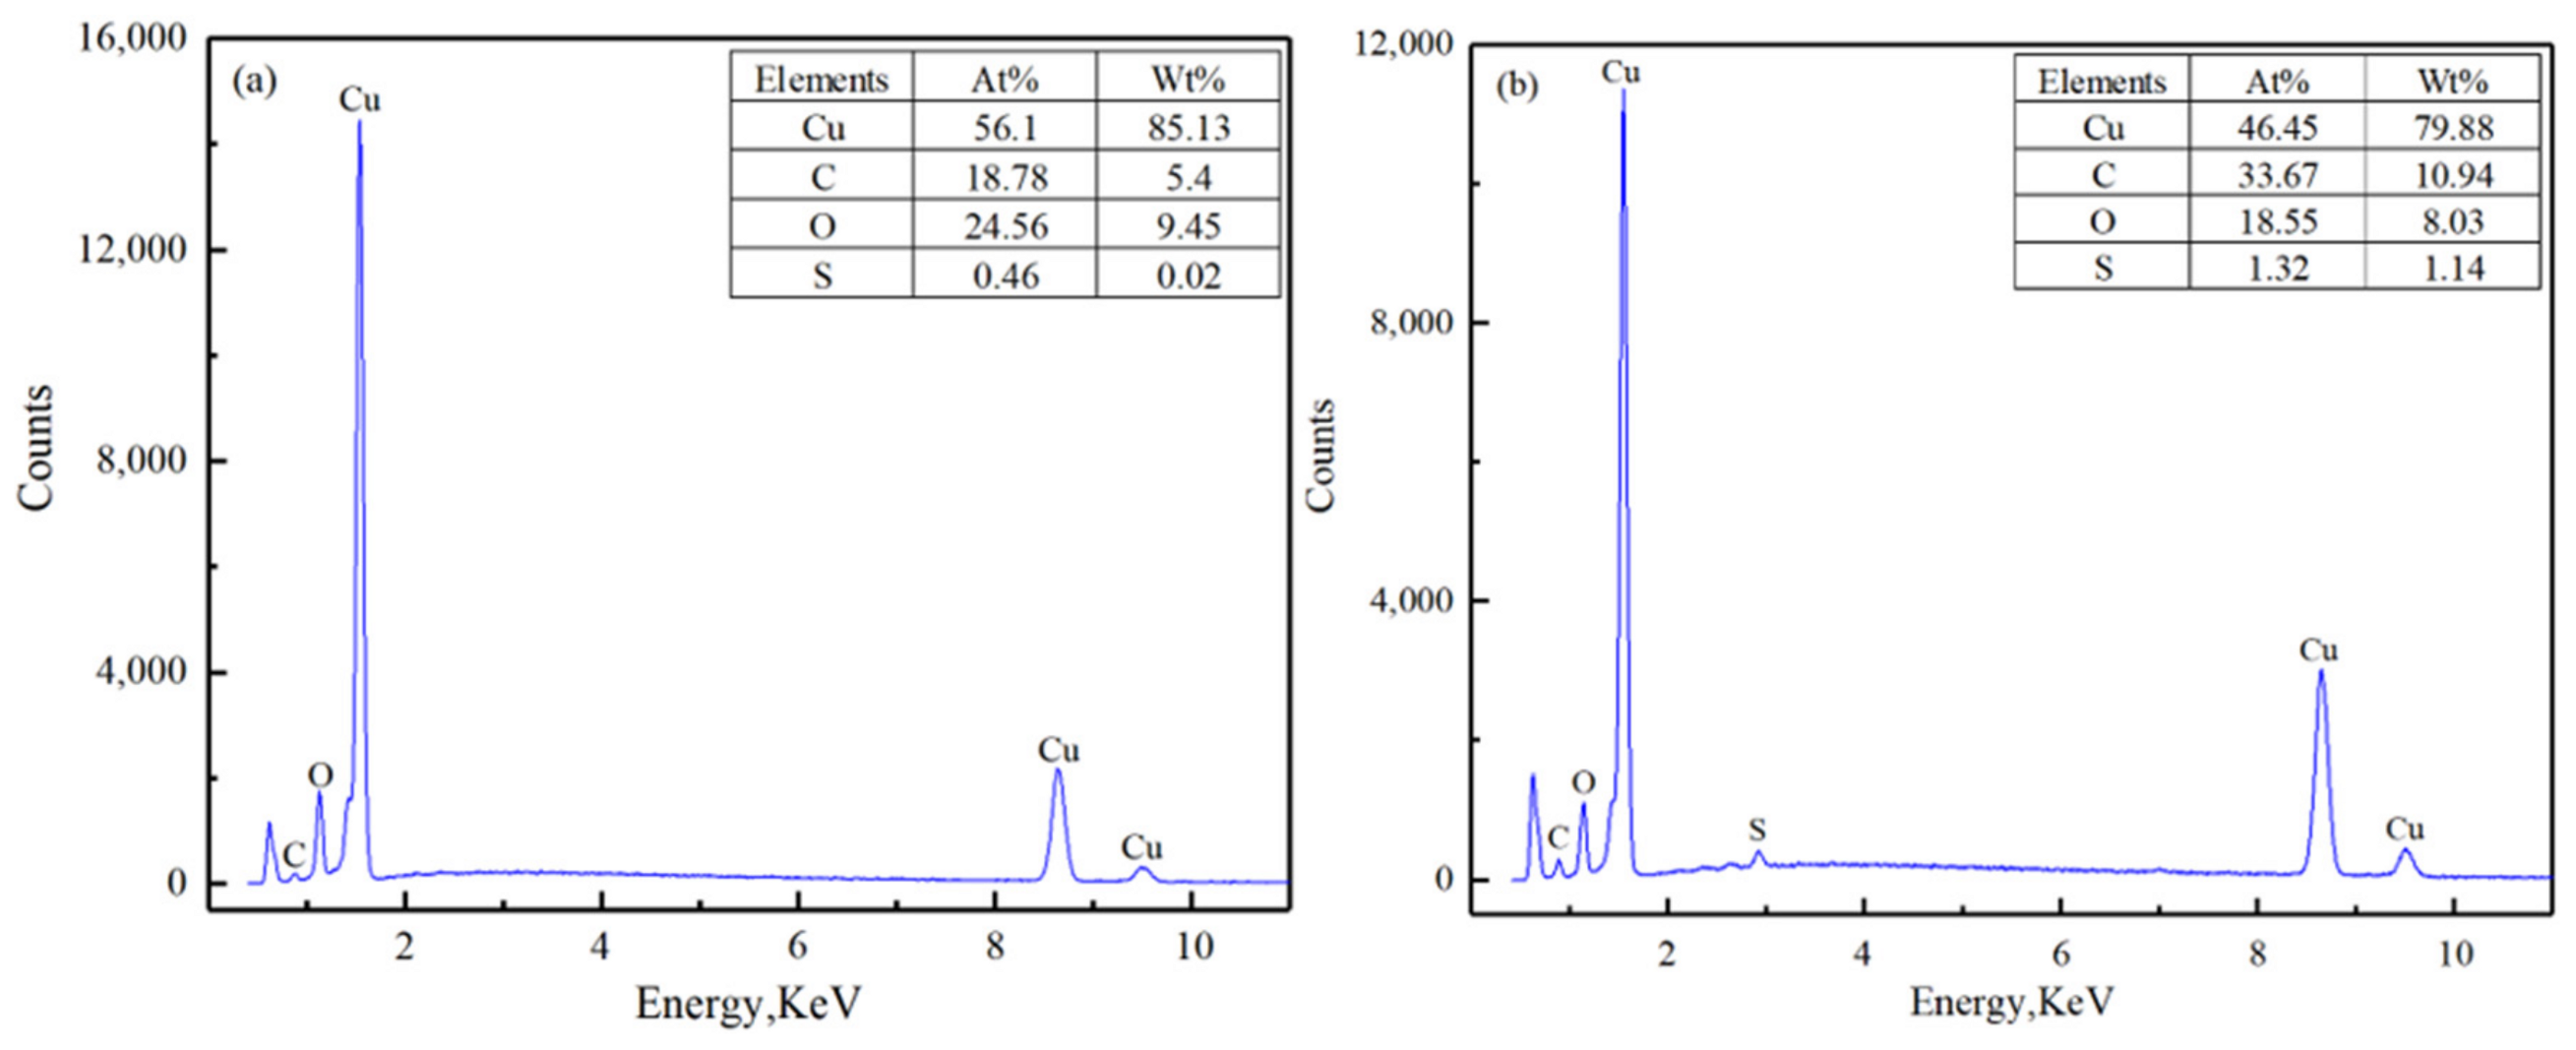
Through the EDS analysis of the samples before and after the CDDP treatment, Figure 11a shows that the electron energy spectrum only shows the peaks of Cu, C, and O elements, and the Cu content in the semi-quantitative analysis result is 56.3%, indicating that there are no other impurity elements in the surrounding area and the purity of azurite’s pure minerals is relatively high. Figure 11b shows that there are also S peaks in the electron energy spectrum. The atomic concentration of S is 1.32%, and some floccules also appear on the surface of the mineral, indicating that new substances have been formed. At the same time, the content of Cu is also reduced from 56.3 to 46.45%, meaning that CDDP may cover the Cu sites on part of the azurite surface [42].

Figure 11.
EDS spectrum of azurite: (a) before CDDP treatment; (b) after CDDP treatment.
3.6. DFT Calculation Analyses
Azurite belongs to the monoclinic minerals, the space group is P21/C, a = 0.5011 nm, b = 0.5849 nm, c = 1.0345 nm, β = 92°43′ [29]. The following parameters were set in the calculation process: (a) the PBE-SOL gradient correction function under the generalized gradient (GGA) is selected; (b) cutoff energy 400 eV; (c) convergence accuracy 2.0 × 10⁻⁵ eV/atom; (d) interatomic convergence standard of interaction is 0.005 eV/nm; (e) the convergence standard of internal crystal stress is 0.1 GPa; (f) the maximum atomic displacement convergence standard is 0.0002 nm; (f) the BFGS algorithm is used, and the optimized unit cell is shown in Figure 12.
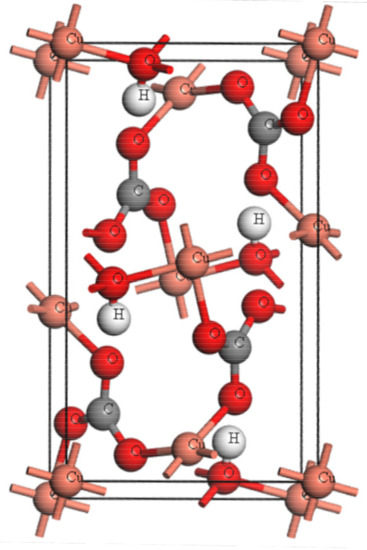
Figure 12.
Azurite crystal structure after structure optimization.
The cleavage of minerals tends towards the surface with the weakest atomic action, that is, the surface with the lowest energy [43]. The (100) crystal plane of azurite is the main cleavage surface of azurite. Therefore, from the perspective of adsorption energy, the adsorption of the agent on the (100) crystal plane of azurite was studied. Since the length of the carbon chain has little effect on the results in the quantum chemical simulation system, the carbon chain in the CDDP molecule was designed as a methyl group [44]. The geometric structure of the three collectors, CDDP, BHA and NaIX, after being optimized by the correction function is shown in Figure 13.

Figure 13.
(a) Optimization model of CDDP−; (b) optimization model of BHA−; (c) optimization model of C5H11OCSS−.
It can be seen from Table 5 that the adsorption energy of the three collectors on the surface of azurite minerals is less than zero, indicating that the reaction between the agent and the mineral can occur spontaneously, and the negative value of the adsorption energy of the interaction between CDDP and azurite is the largest, indicating that its adsorption effect is the strongest. From the perspective of adsorption energy, it shows that the adsorption of CDDP on the mineral surface is more likely to occur, which increases the floatability of the mineral.
Table 5.
The adsorption energy between collectors and azurite.
4. Conclusions
- (1)
- The pure mineral flotation test shows that, compared with NaIX and BHA, CDDP has better flotation performance. In the flotation conditions of pH 7 and CDDP dosage of 3 × 10⁻⁴ mol/L, CDDP can float 94.59% of azurite directly. For NaIX and BHA, the recovery rate of azurite is lower than 70%, whether it is direct flotation or presulfide flotation.
- (2)
- Zeta potential, FT-IR and FE-SEM analysis show that CDDP adsorption may be chemical adsorption. CDDP covers the Cu sites on the surface of azurite to form a CDDP-Cu2+ surface complex that is chemically adsorbed by azurite. XPS analysis shows that some Cu(II) ions on the surface of azurite treated by CDDP are reduced to the Cu(I) state. At the same time, the minerals react with S in CDDP to form polysulfides, thereby promoting flotation.
- (3)
- DFT calculations show that, compared with NaIX and BHA, CDDP has the largest negative adsorption energy on the surface of azurite, with an adsorption energy of 164.707 KJ/mol, and the strongest interaction with the mineral surface, making it easier to perform direct flotation.
Author Contributions
Investigation, B.H., B.Y. and X.Z.; conceptualization, B.H. and X.S.; writing–original draft, B.H.; supervision, L.H.; funding acquisition, L.H.; writing–review and editing, L.H.; methodology, B.Y., X.T. and X.X.; data curation, X.X.; formal analysis, X.T. and X.S. All authors have read and agreed to the published version of the manuscript.
Funding
This research project was supported by the National Natural Science Foundation of China (Grant No. 51964024, 51974030), The Yangtze River Scholar Program in Kunming University of Science and Technology (Grant No. 109720190145), Academic and Technical Talent Cultivation Project and Yunnan Province (Grant No. KKSY201952020, The Open Foundation of State Key Laboratory of Complex Nonferrous Metal Resources Clean Utilization (2017).
Data Availability Statement
Data are available from the authors upon reasonable request.
Conflicts of Interest
The authors declare no conflict of interest.
References
- Park, K.; Park, S.; Choi, J.; Kim, G.; Tong, M.; Kim, H. Influence of excess sulfide ions on the malachite-bubble interaction in the presence of thiol-collector. Sep. Purif. Technol. 2016, 168, 1–7. [Google Scholar] [CrossRef]
- Yu, X.Y.; Zhang, R.R.; Zeng, Y.H.; Cheng, C. The effect and mechanism of cinnamic hydroxamic acid as a collector in flotation separation of malachite and calcite. Miner. Eng. 2021, 164, 106847. [Google Scholar] [CrossRef]
- Barbaro, M.; Urbina, R.H.; Cozza, C. Flotation of oxidized minerals of copper using a new synthetic chelating reagent as collector. Int. J. Miner. Processing 1997, 50, 275–287. [Google Scholar] [CrossRef]
- Lee, K.; Archibald, D.; Mclean, J. Flotation of mixed copper oxide and sulphide minerals with xanthate and hydroxamate collectors. Miner. Eng. 2009, 22, 395–401. [Google Scholar] [CrossRef]
- Liu, C.; Zhu, G.L.; Song, S.X.; Li, H.Q. Interaction of gangue minerals with malachite and implications for the sulfidization flotation of malachite. Colloid. Surface 2018, A555, 679–684. [Google Scholar] [CrossRef]
- Feng, Q.; Zhao, W.; Wen, S. Surface modification of malachite with ethanediamine and its effect on sulfidization flotation. Appl. Surf. Sci. 2018, 436, 823–831. [Google Scholar] [CrossRef]
- Cai, J.; Shen, P.; Liu, D. Growth of covellite crystal onto azurite surface during sulfurization and its response to flotation behavior. Int. J. Min. Sci. Technol. 2021, 7, 1003–1012. [Google Scholar] [CrossRef]
- Nagaraj, D.R.; Ravishankar, S.A. Flotation Reagents—A Critical Overview from an Industry Perspective; Froth flotation: A century of innovation; Society for Mining: Littleton, CO, USA, 2007; pp. 375–424. [Google Scholar]
- Yang, X.L.; Huang, Y.G.; Liu, G.Y.; Liu, J.; Ma, L.Q. A DFT prediction on the chemical reactivity of novel azolethione derivatives as chelating agents: Implications for copper minerals flotation and copper corrosion inhibition. J. Taiwan Inst. Chem. Eng. 2018, 93, 109–123. [Google Scholar] [CrossRef]
- Fuerstenau, D.W.; Herrera, U.R.; Mcglashan, D.W. Studies on the applicability of chelating agents as universal collectors for copper minerals. Int. J. Miner. Process. 2000, 58, 15–33. [Google Scholar] [CrossRef]
- Akbar, A.M.; Livingston, S.E. Metal complexes of Sulphur-nitrogen chelating agents. Coord. Chem. Rev. 1974, 13, 101–132. [Google Scholar] [CrossRef]
- Martell, A.E.; Calvin, M. Chemistry of Metal Chelate Compounds; Prentice-Hall: Hoboken, NJ, USA, 1952; pp. 613–626. [Google Scholar]
- Kukushkin, V.Y.; Tudela, D.; Pombeiro, A.J.L. Metal-ion assisted reactions of oximes and reactivity of oxime-containing metal complexes. Coord. Chem. Rev. 1996, 156, 333–362. [Google Scholar] [CrossRef]
- Popp, C.J.; Ragsdale, R.O. Nickel (II), cobalt (II), and copper (II) complexes with N-methyl-p-nitroso-aniline and p-nitrosoaniline. J. Chem. Soc. A 1970, 1822–1825. [Google Scholar] [CrossRef]
- Xu, H.F.; Zhong, H.; Wang, S.; Niu, Y.N.; Liu, G.Y. Synthesis of 2-ethyl-2-hexenaloxime and its flotation performance for copper ore. Miner. Eng. 2014, 66, 173–180. [Google Scholar] [CrossRef]
- Li, L.Q.; Zhao, J.H.; Xiao, Y.Y.; Huang, Z.Q.; Guo, Z.Z.; Li, F.X.; Deng, L.Q. Flotation performance and adsorption mechanism of malachite with tert-butylsalicylaldoxime. Purif. Technol. 2019, 210, 843–849. [Google Scholar] [CrossRef]
- Liu, G.; Zhong, H.; Xia, L.; Wang, S.; Xu, Z. Improving copper flotation recovery from a refractory copper porphyry ore by using ethoxycarbonyl thiourea as a collector. Miner. Eng. 2011, 24, 817–824. [Google Scholar]
- Lee, J.S.; Nagaraj, D.R.; Coe, J.E. Practical aspects of oxide copper recovery with alkyl hydroxamates. Miner. Eng. 1998, 11, 929–939. [Google Scholar] [CrossRef]
- Hope, G.A.; Buckley, A.N.; Parker, G.K.; Numprasanthai, A.; Woods, R.; McLean, J. The interaction of n-octanohydroxamate with chrysocolla and oxide copper surfaces. Miner. Eng. 2012, 36, 2–11. [Google Scholar] [CrossRef] [Green Version]
- Xiao, J.J.; Liu, G.Y.; Zhong, H. The adsorption mechanism of N-butoxypropyl-S-[2-(hydroxyimino)propyl] dithiocarbamate ester to copper minerals flotation. Int. J. Miner. Process. 2017, 166, 53–61. [Google Scholar] [CrossRef]
- Deng, L.Q.; Zhao, G.; Zhong, H.; Wang, S.; Liu, G.Y. Investigation on the selectivity of N-((hydroxyamino)-alkyl) alkylamide surfactants for scheelite/calcite flotationseparation. J. Ind. Eng. Chem. 2016, 33, 131–141. [Google Scholar] [CrossRef]
- Li, F.; Zhong, H.; Xu, H.; Jia, H.; Liu, G. Flotation behavior and adsorption mechanism of a-hydroxyoctyl phosphinic acid to malachite. Miner. Eng. 2015, 71, 188–193. [Google Scholar] [CrossRef]
- Tijsseling, L.T.; Dehaine, Q.; Rollinson, G.K.; Glass, H.J. Flotation of mixed oxide sulphide copper-cobalt minerals using xanthate, dithiophosphate, thiocarbamate and blended collectors. Miner. Eng. 2019, 138, 246–256. [Google Scholar] [CrossRef]
- Liu, G.; Xiao, J.; Zhou, D.; Zhong, H.; Choi, P.; Xu, Z. A DFT study on the structure-reactivity relationship of thiophosphorus acids as flotation collectors with sulfide minerals: Implication of surface adsorption. Colloids Surf. A Physicochem. Eng. Asp. 2013, 434, 243–252. [Google Scholar] [CrossRef]
- Zhang, X.R.; Lu, L.; Zhu, Y.G.; Han, L.; Li, C.B. Research on the separation of malachite from quartz with S-carboxymethyl-O, O’-dibutyl dithiophosphate chelating collector and its insights into flotation mechanism. Powder Technol. 2020, 366, 130–136. [Google Scholar] [CrossRef]
- Zhang, X.; Lu, L.; Li, Y.; Yangge, Z.; Long, H.; Chengbi, L. Flotation separation performance of malachite from calcite with new chelating collector and its adsorption mechanism. Sep. Purif. Technol. 2020, 255, 11732. [Google Scholar]
- Zhang, Q.; Wen, S.; Feng, Q.; Zhang, S. Surface characterization of azurite modified with sodium sulfide and its response to flotation mechanism. Sep. Purif. Technol. 2020, 242, 116760. [Google Scholar] [CrossRef]
- Sheng, Q.Y.; Yin, W.Z.; Yang, B.; Cao, S.; Sun, H.; Ma, Y.; Chen, K. Improving surface sulfidization of azurite with ammonium bisulfate and its contribution to sulfidization flotation. Miner. Eng. 2021, 171, 107072. [Google Scholar] [CrossRef]
- Xu, H.F.; Zhong, H.; Wang, S.; Huang, Z.Q.; Zhao, G. Synthesis of novel cyclohexene carboxylic acid and its flotation performance for fluorite ore. Chin. J. Nonferrous Met. 2014, 24, 2935–2942. [Google Scholar]
- Yu, J.; Yang, H.Y.; Fan, Y.J. Effect of potential on characteristics of surface film on natural chalcopyrite. Trans. Nonferrous Met. Soc. China 2011, 21, 1880–1886. [Google Scholar] [CrossRef]
- Hu, W.J.H.; Tian, M.J.; Cao, J.; Xie, L.; Gong, L.; Sun, W.; Gao, Z.; Zeng, H. Probing the Interaction Mechanism between Benzohydroxamic Acid and Mineral Surface in the Presence of Pb2+ Ions by AFM Force Measurements and First-Principles Calculations. Langmuir 2020, 36, 8199–8208. [Google Scholar] [CrossRef] [PubMed]
- Wang, J.J.; Li, W.H.; Zhou, Z.H.; Gao, Z.Y.; Hu, Y.; Sun, W. 1-Hydroxyethylidene-1,1-diphosphonic acid used as pH-dependent switch to depress and activate fluorite flotation I: Depressing behavior and mechanism. Chem. Eng. Sci. 2020, 214, 115369. [Google Scholar] [CrossRef]
- Lopez, T.; Cuevas, J.L.; Ilharco, L.; Ramírez, P.F.; Rodríguez-Reinoso, F.; Rodríguez-Castellón, E. XPS characterization and E. Coli DNA degradation using functionalized Cu/TiO2nanobiocatalysts. Mol. Catal. 2018, 449, 62–71. [Google Scholar] [CrossRef]
- Zhao, W.J.; Liu, D.W.; Feng, Q.C.; Wen, S.M.; Chang, W.H. DFT insights into the electronic properties and adsorption mechanism of HS− on smithsonite (101) surface. Miner. Eng. 2019, 141, 105846. [Google Scholar] [CrossRef]
- Smart, R.S.C.; Skinner, W.M.; William, M.G.; Andrea, R. XPS of sulphide mineral surfaces: Metal-deficient, polysulphides, defects and elemental Sulphur. Surf. Interf. Anal. 1999, 28, 101–105. [Google Scholar] [CrossRef]
- Robert, G.A.; Sarah, L.H.; David, A.B. Synchrotron PEEM and ToF-SIMS study of oxidized heterogeneous pentlandite. pyrrhotite and chalcopyrite. J. Synchrotron Radiat. 2010, 17, 606–615. [Google Scholar]
- Chen, X.M.; Peng, Y.J.; Dee, B. The separation of chalcopyrite and chalcocite from pyrite in cleaner flotation after regrinding. Miner. Eng. 2014, 58, 64–72. [Google Scholar] [CrossRef]
- Feng, Q.C.; Wen, S.M.; Deng, J.S.; Zhao, W.J. Combined DFT and XPS investigation of enhanced adsorption of sulfide species onto cerussite by surface modification with chloride. Appl. Surf. Sci. 2017, 425, 8–15. [Google Scholar] [CrossRef]
- LI, F.X.; Zhou, X.T.; Lin, R.X. Flotation performance and adsorption mechanism of novel 1-(2-hydroxyphenyl)hex-2-en-1-one oxime flotation collector to malachite. Nonferrous Met. Soc. 2020, 30, 2792–2801. [Google Scholar] [CrossRef]
- Feng, Q.C.; Zhao, W.J.; Wen, S.M.; Cao, Q.B. Copper sulfide species formed on malachite surfaces in relation to flotation. J. Ind. Eng. Chem. 2016, 12, 029. [Google Scholar] [CrossRef]
- Zhang, L. Study on the Flotation Mechanism of Chrysocolla Sulfide Enhanced by Amine (ammonium) Salt. Master’s Thesis, Kunming University of Science and Technology, Kunming, China, 2018. [Google Scholar]
- Bi, K.J. Study on the Mechanism of Sulfide Flotation of Mixed Copper Ore. Master’s Thesis, Kunming University of Science and Technology, Kunming, China, 2017. [Google Scholar]
- Wen, S.M.; Deng, J.S.; Xian, Y.J.; Dan, L. Theory analysis and vestigial information of surface relaxation of natural chalcopyrite mineral crystal. Trans. Nonferrous Met. Soc. China 2013, 23, 796–803. [Google Scholar] [CrossRef]
- Lan, L.H.; Chen, J.H.; Li, Y.Q.; Chen, Y. Effect of Vacancy Defects on the Adsorption of Oxygen Molecules on Galena (100) Surface. Chin. J. Nonferrous Met. 2012, 9, 2626–2635. [Google Scholar]


Publisher’s Note: MDPI stays neutral with regard to jurisdictional claims in published maps and institutional affiliations. |
© 2022 by the authors. Licensee MDPI, Basel, Switzerland. This article is an open access article distributed under the terms and conditions of the Creative Commons Attribution (CC BY) license (https://creativecommons.org/licenses/by/4.0/).