Abstract
Eudialyte-group minerals (EGMs) are typical accessory or rock-forming minerals of the Lovozero peralkaline massif (Kola Peninsula, Russia). The EGM grains in the rocks of the massif are often replaced by an association of various secondary minerals such as lovozerite and wöhlerite group minerals, as well as terskite, catapleiite, elpidite, gaidonnayite, vlasovite, zircon, and loparite-(Ce). However, EGMs in the Lovozero massif can be not only pseudomorphized, but also partially or completely dissolved. The partial dissolution of eudialyte grains was simulated in three series of experiments, and the results obtained were compared with natural samples. Observations in natural samples and experimental studies have shown that the partial dissolution of eudialyte-group minerals occurs in two stages: (1) loss of sodium and hydration; (2) loss of other cations not included in the zirconosilicate framework. This process proceeds most intensively in acidic hydrothermal solutions and may be responsible for the appearance of new mineral species in the eudialyte group.
1. Introduction
Eudialyte, a zirconosilicate of sodium, calcium, and iron, was discovered more than 200 years ago in the Ilimaussaq alkaline massif in Greenland [1,2], but to this day it is of great scientific and economic interest. The complex zeolite-like crystal structures of eudialyte-group minerals (EGMs) contain many crystallographic sites (both framework and extra-framework) with different coordinational numbers and environments [3,4,5]. Although there are preferred sites for many elements in the crystal structure of eudialyte, the same element can occupy several sites. In addition, many sites may be either partially or fully vacant. Currently, the eudialyte group combines 31 mineral species [6,7,8,9], and new ones are constantly being discovered.
From the economic point of view, eudialyte-group minerals are a potential source of high-field-strength elements (HFSEs), such as zirconium and rare earth elements (REEs). Currently, many eudialyte deposits have been reported, some of which are located in Pajarito (NM, USA) [10], Lovozero (Russia) [11], Ilimaussaq (South Greenland) [12], Mont Saint-Hilaire (Canada) [13], and Norra Kärr (Sweden) [14]. Due to the significant amounts of eudialyte and its low radioactive content, this mineral has the potential of becoming a primary REE resource. The relative ease of extraction of eudialyte by magnetic separation and the significant proportion of heavy rare earth elements (HREEs) makes the exploration of eudialyte deposits economically feasible [15,16]. Although eudialyte can be easily dissolved with acids, eudialyte processing can be very challenging as co-dissolved silica forms an unfilterable gelatinous phase [17,18]. At present, methods have been developed for the leaching of eudialyte concentrate, aiming at recovering rare earth elements and suppressing silica gel formation [17,19].
The crystal chemical formula of EGMs derived from the IMA-approved formula [20] can be written as (Z = 3): {N(1)3N(2)3N(3)3N(4)3N(5)3}{[M(1a)3M(1b)3]3M(2)3M(3)M(4)Z3[Si24O72]Ø0–6}X(1)X(2),
where
- N(1–5) = Na, H3O+, K, Sr, REE, Y, Ba, Mn, Ca, □ (vacancy);
- M(1) = Ca, Mn, REE, Na, Fe;
- M(2) = IV,VFe2+, V,VIFe3+, V,VIMn2+, V,VINa, IV,VZr;
- M(3) and M(4) = IVSi, VINb, VITi, VIW6+, □;
- Z = Zr, Ti, Nb;
- Ø = O, (OH);
- X = Cl, F, S2−, H2O, CO3, and SO4.
The EGMs are index minerals of agpaitic (molar (Na + K)/Al > 1) rocks and are found during various stages of crystallization [12,21,22]. However, the majority of occurrences of EGMs are from late- to post-magmatic origin [21] from various localities elsewhere [23,24,25,26]. In particular, in the Pilansberg alkaline complex (South Africa), a late-magmatic generation of EGMs is replaced by two post-magmatic generations [27].
Late-stage hydrothermal alteration of EGMs is intimately linked with the agpaitic complexes and commonly attributed to the fluid-rich nature of the melts [21,27,28,29,30,31]. As a product of EGMs decomposition, micrometer-scale aggregates of secondary zirconosilicates, aluminosilicates, and Nb and REE phases are formed. In addition, as a result of EGM alterations, high-field-strength elements (HFSEs) can be mobilized and transported in a hydrothermal solution [32,33]. In particular, van de Ven and colleagues [32] found that hydrothermal alteration of EGMs from the Ilimaussaq massif produced three different associations of the secondary minerals (with catapleiite, gittinsite, or zircon). Moreover, EGM alteration was accompanied by the loss of HFSEs, and these elements were redeposited nearby in the same rocks.
EGMs are one of the main minerals of the Lovozero peralkaline massif (Kola Peninsula, Russia), where EGMs are second only to feldspars, nepheline, and aegirine in abundance [34]. In the Lovozero massif, EGMs are often replaced by an association of secondary minerals, among which the most common are lovozerite- and wöhlerite-group minerals, terskite, catapleiite, elpidite, gaidonnayite, vlasovite, zircon, and loparite-(Ce) [35,36,37,38]. Eudialyte-group minerals in Lovozero massif can be not only pseudomorphized, but also partly to completely dissolved. The dissolution of EGM crystals, followed by crystallization of various Zr-bearing minerals on the walls of the dissolution cavities or in the immediate vicinity, is described in detail in pegmatites of the Lovozero massif [35,39]. According to Pekov [35], accompanied local geochemical anomalies (in this case, zirconium) are usually formed in this case.
In fact, EGM grains in the Lovozero rocks often contain numerous microcracks and are surrounded by a loose rim of the undiagnosed Zr-Si phases. We have established that the “porous” (with numerous microcracks) EGMs contain an order of magnitude less sodium than the “fresh” (homogeneous, uncracked) ones. We assumed that such changes in the morphology and composition of EGMs are associated with the initial stage of their dissolution and modeled this process in a series of experiments. In this paper, we present the results of a study of EGM-bearing samples from the Lovozero massif, which were natural prototypes for our experiments. Based on the obtained results from our experiments, we discuss (1) the natural conditions under which EGMs may dissolve and (2) changes in the composition of the hydrothermal solution during the dissolution of EGMs.
2. Geological and Petrography Backgrounds
The Lovozero peralkaline massif (Figure 1a) is located on the Kola Peninsula (NW Russia) and covers an area of 650 km2. This layered laccolith-type intrusion was emplaced 360–370 million years ago [40,41,42] into Archean granite gneisses covered by Devonian volcaniclastic rocks [43,44]. Lovozero massif [45,46,47,48] is composed of three major units:
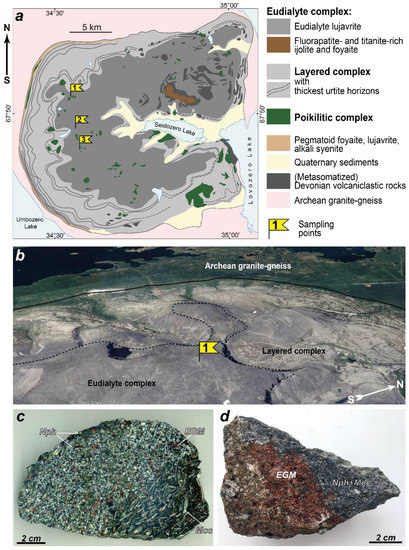
Figure 1.
Geological and petrography backgrounds. (a) Simplified geological map of the Lovozero peralkaline massif [46], where sampling points of eudialyte-bearing rock samples are marked by flags; (b) satellite image of the northwestern part of the Lovozero massif (sampling point 1); individual rhythms of the layered complex are clearly visible due to the fact that melanocratic nepheline syenites (the top of each rhythm) are more resistant to weathering; (c) EGM grains in eudialyte lujavrite (sample LV-500, sampling point 1); (d) EGM grain in poikilitic nepheline syenite (sample LV-604/2, sampling point 3).
- (1)
- Layered complex (77% massif’s volume; thickness about 1700 m). This complex consists of numerous sub-horizontal layers or “rhythms” (Figure 1). Each rhythm is a sequence of rocks (from top to bottom): lujavrite–foyaite–urtite or lujavrite–foyaite. Lujavrite is meso- to melanocratic nepheline syenite with a trachytoid texture; foyaite is leucocratic nepheline syenite, and urtite is an almost monomineral nepheline rock. The transitions between different rocks within the same rhythm are gradual, and the boundaries between the rhythms are sharp and are often marked by pegmatites.
- (2)
- Eudialyte complex (18% massif’s volume; thickness varies from 100 to 800 m). This complex overlies the layered complex (Figure 1) and mainly consists of lujavrite enriched in eudialyte-group minerals, co-called eudialyte lujavrite. Lenses and sheet-like bodies of foyaite, as well as fine-grained/porphyritic nepheline syenites, are irregularly located among eudialyte lujavrite.
- (3)
- Poikilitic complex (5% massif’s volume) consists of leucocratic feldspathoid syenites, in which grains of feldspathoids are poikilitically incorporated into large crystals of alkali feldspar. These rocks form lenses, or irregularly shaped bodies, which are located in both the layered and eudialyte complexes.
A large number of studies have been devoted to the chemical composition, crystal chemistry, and secondary alterations of EGMs from the Lovozero massif [5,34,49,50,51,52,53,54,55,56]. The EGMs (Figure 1c,d) are typical accessory or rock-forming minerals of the rocks of the Lovozero massif [37,45]. In all rock types of the layered complex, EGMs occur exclusively as anhedral grains in interstices of rock-forming minerals. In the urtite and foyaite, the content of the EGMs reaches 20 and 25 mod. %, respectively (the average content is 2.4 and 2.7 mod. %, respectively), while the EGM content in lujavrite is lower than that in urtite and foyaite (on average 2%, maximum 10%). In eudialyte lujavrite, EGMs form rounded grains, located mainly in close association with mafic minerals (alkaline pyroxenes and amphiboles). The content of EGMs in eudialyte lujavrite can reach 90 mod. %. In the rocks of the poikilitic complex, EGMs usually occur in close association with mafic minerals and form anhedral grains or poikilitic crystals. The EGM content in the rocks of the poikilitic complex does not exceed 5 mod. %.
3. Materials and Methods
3.1. Materials and Design of the Experimental Study
For this study, 24 samples of EGM-bearing rocks were selected. Samples were taken from both boreholes (sampling point 1; Figure 1) and outcrops (sampling points 2 and 3; Figure 1). The study of natural samples was necessary in order to characterize the composition of fresh EGMs, select samples for experiments, and also characterize the changes (decomposition/dissolution) that occur with EGMs in nature and compare them with the experimental results.
The general scheme of the study is shown in Figure 2.
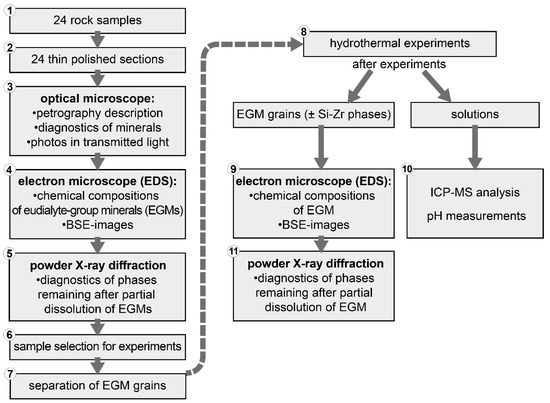
Figure 2.
General scheme of the study.
3.2. Chemical Composition of Minerals
The determinations of chemical compositions of EGMs and products of their transformation, as well as the studies of grain morphology, were performed at the Geological Institute, Kola Science Center of the Russian Academy of Sciences (GI KSC RAS, Apatity, Russia) using the scanning electron microscope LEO-1450 (Carl Zeiss Microscopy, Oberkochen, Germany) with the energy-dispersive system (EDS) Aztec Ultimmax 100 (Oxford Instruments, Abingdon, UK).
Mineral abbreviations (Table 1) are given in accordance with International Mineralogical Association (IMA)-approved mineral symbols [57], with the exception of the eudialyte- and lovozerite-group minerals.

Table 1.
Abbreviations, names, and formulas of minerals mentioned in this article.
3.3. Experimental Conditions
Three series of hydrothermal experiments were carried out, differing in the composition of the initial solution. The experimental conditions are summarized in Table 2. For the experiments, deionized water and 0.5 mol/L NaCl and 0.1 mol/L HCl of reagent-grade quality (Neva reactive) were used. EGM grains (about 0.4000 g) were kept in solution (15 mL) at 230 °C for 10/20/30/40 days without periodic shaking in the PTFE-lined hermetically sealed autoclaves for hydrothermal synthesis (TOPH, South Korea). The ratio of the volume of the autoclave to the volume of the solution was 1.6. An ED224S-RCE Sartorius analytical scale (Göttingen, Germany) was used for weighing. After each experiment, the grains of eudialyte were washed twice with deionized water (30 mL) and then once with 5 mL of ethanol solution and dried in air for 1 h.

Table 2.
Experimental conditions.
3.4. Powder X-ray Diffraction
The X-ray diffraction (XRD) measurements were performed at the Kola Science Center of the Russian Academy of Sciences using a MiniFlex-600 powder diffractometer (Rigaku Corporation, Tokyo, Japan). The X-ray source was Cu Kα radiation. The tube current and the tube voltage were set at 15 mA and 40 kV, respectively. A one-dimensional detector (D/teX Ultra2, Rigaku Corporation, Tokyo, Japan) was used with a Kβ filter.
3.5. Compositions of the Solutions
The concentration of the elements in solutions after experiments were determined using inductively coupled plasma mass spectrometry (ICP-MS) on an ELAN 9000 DRC-e (Perkin Elmer, Waltham, MA, USA) in the Institute of North Industrial Ecology Problems KSC RAS. The pH values of the solutions were measured using an AMT28F pH meter (Amtast, FL, USA); the admissible error of this instrument was +/−0.1 pH. This type of pH meter was used to measure pH due to the small volumes of analyzed solutions.
4. Results
The studied rock samples contain both unaltered (fresh) and partially dissolved EGM grains. We believe that the term “partially dissolved” is more suitable in this case because such EGM is surrounded by a loose and porous rim of undiagnosed Si-Zr phases. It should be stated that partially dissolved and fresh EGM grains can occur in the same hand sample and even in the same thin polished section.
4.1. Fresh EGMs from Rocks of the Lovozero Massif
Fresh EGM grains contain almost no cracks and have smooth boundaries (Figure 3a,b). The EGM grains are usually zoned in chemical composition. Generally, the rims are enriched in Sr, REE, Mn, and Cl. The sodium content varies from 14.73 to 15.60 atoms per formula unit (apfu) (Figure 3c).
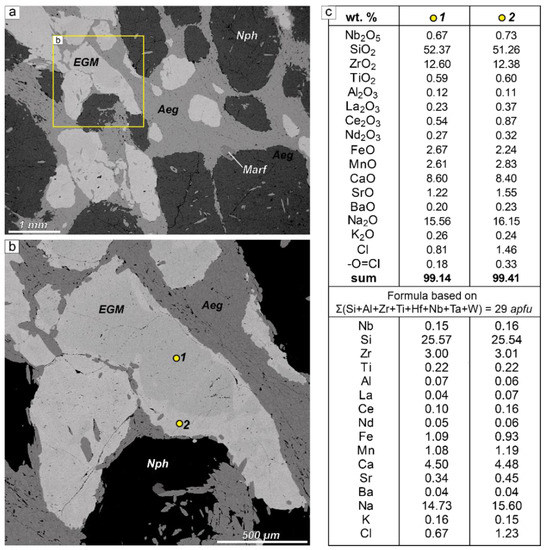
Figure 3.
Fresh EGMs. (a) EGM grains in eudialyte lujavrite (sample LV-222/177, sampling point 1 in Figure 1), BSE image; (b) detailed BSE image of a fragment of Figure 3a; EGM grains contain almost no cracks and has smooth boundaries; yellow dots are microprobe analysis points; (c) chemical composition of EGM grain shown in Figure 3b (point 1 = grain core; point 2 = grain rim). apfu—atoms per formula unit.
4.2. Partially Dissolved EGMs from the Rocks of the Lovozero Massif (Natural Prototype for the Experiments)
In the same thin section, along with fresh EGM grains, partially dissolved ones occur. Sometimes a grain of EGM is dissolved on only one side, as shown in Figure 4a,b. Partially dissolved grains are surrounded by a porous reticulate rim consisting of the Si-Zr phases and rhabdophane-(Ce) (Figure 4b–f), as well as natrolite and goethite. Commonly, rhabdophane-(Ce) forms clusters of very small grains, which can be located at a small distance from the partially dissolved EGM.
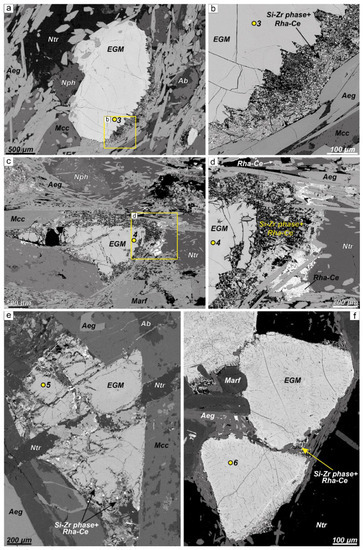
Figure 4.
BSE images of partially dissolved EGMs. (a,b) EGM grain in eudialyte lujavrite (sample LV-230/210, sampling point 1 in Figure 1); EGM grain partially dissolved on one side only (lower right); (c,d) EGM grain in eudialyte lujavrite (sample LV-32/128, sampling point 1 in Figure 1); there are numerous expanding cracks, partially filled with Si-Zr phases; in addition, the grain is surrounded by a wide rim of the Si-Zr phases + rhabdophane-(Ce), where rhabdophane-(Ce) forms clusters of small grains at a distance from the dissolving EGMs; (e) EGM grain in foyaite (sample LV-309, sampling point 2 in Figure 1); there are numerous expanding cracks, partially filled with Si-Zr phases; in addition, the grain is surrounded by a wide rim of the Si-Zr phases + rhabdophane-(Ce); (f) EGM grain in eudialyte lujavrite (sample LV-156/36, sampling point 1 in Figure 1); the grains are fractured and surrounded by a thin rim of the Si-Zr phase+ rhabdophane-(Ce). Yellow dots (3–6) with numbers are microprobe analysis points (see Table 3).
The Si-Zr phases are X-ray amorphous. The chemical compositions of these phases are quite variable. According to a rough estimate of the composition, the Si:Zr ratio varies from 3:1 to 6:1. Insignificant amounts of Na, K, Mn, Ca, Fe, and Ti have also been found in the composition of the Si-Zr phases.
When the intensity of dissolution increases, the width of the loose rim around EGM grains also increases. At the same time, the EGM grain itself becomes porous due to the appearance of a large number of microcracks. In addition, the chemical composition of EGM changes. If the dissolution is insignificant, then the chemical composition of EGMs corresponds to the composition of fresh eudialyte (Table 3, Figure 4a,b, analysis point 3). Intensively dissolved EGMs contain significantly less sodium (Table 3, Figure 4c–f, analysis points 4–6). The low sum of analysis of intensely dissolved EGM grains should also be noted (see Table 3, samples LV-32/128, LV-309, LV-156/36).

Table 3.
Representative chemical analyses of partially dissolved EGMs (wt. %).
4.3. Results of Experiments (Fresh → Partially Dissolved EGM)
Sample LV-604/2 (sampling point 3 in Figure 1a) was chosen for the experiments. In this sample, fresh EGM forms relatively large and chemically homogeneous grains. Figure 5 shows the representative morphology and chemical compositions of EGM grains separated from the sample LV-604/2 for experiments. Powder X-ray diffraction data for sample LV-604/2 are shown in Supplementary Materials (Figure S1).
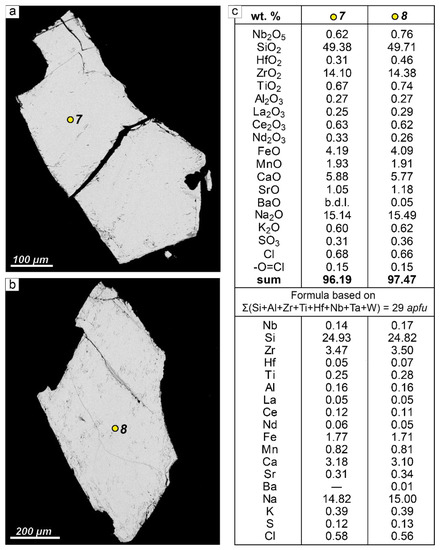
Figure 5.
The morphology and representative chemical analysis of EGM grains separated from the sample LV-604/2 (sampling point 3 in Figure 1a) for the experiments. (a,b) Grain morphology; BSE images; yellow dots are microprobe analysis points; (c) chemical compositions of EGM grains shown in Figure 5a,b; apfu—atoms per formula unit; b.d.l.—below detection limit.
After experiments with deionized water and 0.5 mol/L NaCl solution, no changes in the morphology of EGM grains were observed (Figure 6a, b). Regardless of the time of the experiment, the EGM grains remained homogeneous with smooth boundaries, without any signs of dissolution. The chemical composition of EGM also remained unchanged. Table 4 shows the representative chemical analyses of EGM after experiments with deionized water and 0.5 mol/L NaCl solution.
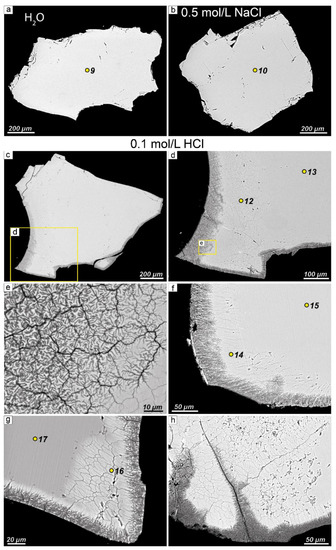
Figure 6.
BSE images of the morphology of EGM grains after experiments. (a) EGM grain after experiment with deionized water (experiment time = 40 days); (b) after experiment with 0.5 mol/L NaCl solution (experiment time = 40 days); (c) after experiment with 0.1 mol/L HCl solution (experiment time = 10 days); grain is surrounded by a zonal rim consisting of Si-Zr phases and sodium-depleted EGM. Detailed image of the fragments: (d) shown in Figure 6c; (e) shown in Figure 6d. The fragments of EGM grain: (f) after experiment with 0.1 mol/L HCl solution (experiment time = 20 days); zonal rim about 100 μm across surrounding the EGM grain is clearly visible; (g) after experiment with 0.1 mol/L HCl solution (experiment time = 30 days); (h) after experiment with 0.1 mol/L HCl solution (experiment time = 30 days). Yellow dots (9–17) are microprobe analysis points (see Table 4 and Table 5).

Table 4.
Representative chemical analyses of EGM after experiments with both water and NaCl (wt%).
After the experiments with a 0.1 mol/L solution of HCl were carried out, a zonal rim around the EGM grains appeared (Figure 6c–h). The outer zone (up to 150 µm across) of this rim consists of undiagnosed Si-Zr phases, while the intermediate zone (up to 300 µm across) is represented by EGM with an extremely low sodium content in comparison with the grain center. The widths of both outer and intermediate zones increase with the duration of the experiment. Table 5 shows representative chemical compositions of EGM grains after experiments with 0.1 mol/L HCl solution (Figure 6, points 12–17). Note that the sum of the analysis of EGM with low sodium content does not exceed 90%, which is much lower than the sum of the analysis of unaltered EGM. Powder X-ray diffraction data for Na-depleted EGM after the experiment with a 0.1 mol/L solution of HCl (Aks. 12) are shown in Supplementary Materials.

Table 5.
Representative chemical analyses of EGM after experiments with 0.1 mol/L HCl solution (wt%).
The Si-Zr phase obtained in experiments is X-ray amorphous. According to a rough estimate of the composition, the Si:Zr ratio is about 6:1. Insignificant amounts of Na, K, Mn, Ca, Fe, and Ti were also found.
During the experiments, a change in the compositions of solutions was observed. Table 6, Table 7 and Table 8 show the chemical composition and pH of both initial solutions and solutions after experiments.

Table 6.
Chemical composition (mg/L) and pH of both deionized H2O and solutions after experiments.

Table 7.
Chemical composition (mg/L) and pH of both initial solution and solutions after experiments with 0.5 mol/L NaCl solution.

Table 8.
Chemical composition (mg/L) and pH of both initial solution and solutions after experiments with 0.1 mol/L HCl solution.
When an experiment with deionized water was conducted for 10 days, the calcium content in the solution increased more than 30 times, and in an experiment that lasted 40 days, the calcium content in the solution increased more than 500 times. The sodium concentration in the solution in the experiment lasting 10 days increased almost 60 times, and in the experiment lasting 40 days, the sodium content in the solution was 80 times higher than that in the initial solution. The concentrations of other elements (Fe, Mn, Ti, La) in the solutions also increased. After the experiments, the concentration of Fe in the solutions became 100 to 300 times higher than that in the initial solutions. The content of Mn increased almost 30 times; the concentrations of Ti in solutions after the experiments are from 30 to 80 times higher than those in the initial solutions. As a result of experiments, the pH increased up to 10.5, while the pH of the initial solution was 5.6.
When experiments with 0.5 mol/L NaCl solutions were conducted, the calcium content increased more than 60 times, regardless of the duration of the experiment. The Na concentration increased to the maximum (1.3 times) in the experiment lasting 40 days. Regardless of the duration of the experiment, the content of Ti in the solutions increased in about 13 times, while the content of zirconium in the solution increased only in an experiment lasting 10 days. An increase in the iron content was also recorded in only one experiment (30 days). The concentrations of La and Ce in solutions during experiments almost did not change. As a result of experiments, the pH increased up to 7.5, while the pH of the initial solution was 3.4.
The composition of solutions changed most significantly during experiments with 0.1 mol/L HCl solution. The Ca content in the solutions increased up to 550 times (maximal in the experiment lasting 30 days). The concentration of Mn in solutions increased from 5 to 11 times. The concentration of iron in the experiment lasting 40 days increased 17 times, and in other experiments, the concentrations of this element increased from 5 to 8 times. The Na concentrations in the solutions after the experiments became 1200–1800 times higher compared to the concentration of this element in the initial solutions. As a result of the experiments, the pH increased up to 7.7, while the pH of the initial solution was 1.8. After carrying out experiments with a 0.1 mol/L HCl solution, the inner walls of autoclaves with a PTFE lining turned out to be covered with a very thin film of iron hydroxide.
5. Discussion
In the rocks of the Lovozero massif, pseudomorphic replacement of eudialyte-group minerals by various secondary minerals is often observed. The minerals and mineral associations replacing EGMs are very diverse and include lovozerite- and wöhlerite-group minerals, terskite, catapleiite, elpidite, gaidonnayite, vlasovite, zircon, and loparite-(Ce) [35,36,37,38]. For example, A.P. Khomyakov [38,59] and I.V. Pekov [35] described in detail the development of zirsinalite after EGMs, followed by the replacement of zirsinalite with lovozerite.
However, in addition to pseudomorphized EGMs, the rocks of the Lovozero massif contain partially dissolved grains of this mineral. In our opinion, the signs of partial dissolution of EGMs are as follows: Firstly, the grains are surrounded by a porous rim of undiagnosed Si-Zr phases. In association with this phase, there are clusters of small grains of rhabdophane-(Ce), and goethite. Secondly, the EGM grains themselves contain many microcracks. Thirdly, such microfractured grains contain extremely little sodium, and the sum of the analysis does not exceed 90 wt%, which indicates the presence of a significant amount of water.
The decrease in the sodium content in the composition of EGMs is probably the result of their hydration. This process is widespread in agpaitic rocks and pegmatites. Thus, according to Pekov [35], Na deficiency in EGMs is directly related to the intensity of alteration of rocks by post-magmatic hydrothermal solutions. Different compensation schemes of the alkaline cation (A+) deficiency such as A+ = (H3O)+, A+ = H+, A+ = (H2O)0 + H+, and A+ + O2– = □ + (OH)− have been discussed in the literature concerning the charge balance of hydrated EGM formulas [5,60,61,62,63,64]. As a result of hydration, new minerals of the eudialyte group can be formed. In particular, aqualite [61] differs from typical eudialyte by the extremely low contents of Na and Fe, with more than 50% Na being replaced with the (H3O)+ group [65]. The presence of oxonium ions in aqualite is confirmed by IR spectroscopic and X-ray single-crystal diffraction analysis. Khomyakov and colleagues [61] stated that hydrated EGMs were formed at a relatively low temperature through the ion-exchange transformation of “protoeudialytes”; the successor minerals inherited the principal structural and compositional features of the precursor minerals [66].
Indeed, in experiments with a 0.1 mol/L HCl solution, we observed the process of sodium loss from “protoeudialyte” with the formation of hydrated eudialyte. For example, in Figure 6c,d, the grain center is “protoeudialyte” (see Table 5, point 13), and the surrounding rim is hydrated eudialyte (see Table 5, point 12). In this case, indeed, the successor minerals inherited the principal structural and compositional features of the precursor minerals.
We assume that the loss of sodium may be followed by the loss of other cations, mainly calcium, iron, and manganese. In fact, as a result, only the zirconosilicate “framework” of EGM remains. In experiments and natural samples, we can observe this “framework” in the form of an undiagnosed Si-Zr phase. Carried-out cations can be deposited in the immediate vicinity of the dissolving EGM grain. For example, in natural samples, REEs are included in rhabdophane-(Ce), whose small grains are located either among the Si-Zr phase (Figure 4e) or in close proximity to it (Figure 4c,d). It is also likely that, under natural conditions, cations removed from the structure of EGM can be transported by hydrothermal solutions.
Thus, the partial dissolution of EGM begins with the loss of sodium and hydration, followed by the loss of other cations such as Ca, Fe, and Mn. This process is most intensive in an acidic environment. Let us compare the change in the composition of solutions in experiments with deionized water and 0.5 mol/L NaCl solution. The morphology of EGM grains did not change in these experiments, but changes in the composition of the solution indicate that a slight dissolution of EGM did occur. It is possible that only the thinnest surface layer of EGM grains was dissolved, and therefore we do not observe changes in their morphology.
In experiments with a solution of sodium chloride (pH = 3.4), intense loss of sodium from the crystal structure of EGM does not occur due to the high concentration of sodium in the initial solution. Therefore, the difference between the sodium content in the initial solutions and the content of this element in the solutions after the experiments is very small (Figure 7a). At the same time, the differences in the concentrations of other cations (Ca, Fe, Mn) between the initial solutions and solutions after experiments are minimal (Figure 7b–d). In experiments with deionized water, the difference between the sodium content in the initial solutions and solutions after the experiments is much higher. At the same time, the difference between the Ca, Fe, and Mn concentrations in the initial solutions and those in the solutions after the experiments is significant. Thus, it can be assumed that the loss of sodium from EGM is the first step and a prerequisite for the (partial) dissolution of EGM.
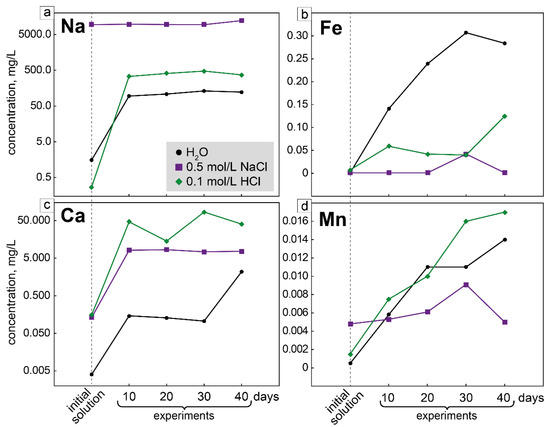
Figure 7.
Changes in the composition of solutions in experiments on the partial dissolution of EGM. (a) Change in sodium content from the initial solutions; (b) change in iron content from the initial solutions; (c) change in calcium content from the initial solutions; (d) change in manganese content from the initial solutions.
In experiments with a 0.1 mol/L HCl solution, it is likely that part of the iron was oxidized and precipitated on the walls of the autoclave in the form of iron hydroxide. Therefore, in experiments with HCl, a strong increase in the concentration of iron in the solution is not observed, compared with deionized water (Figure 7b). With the partial dissolution of EGMs in nature, iron oxidation also occurs, since iron hydroxides are present in association with the Si-Zr phases and rhabdophane-(Ce).
6. Conclusions
Observations in natural samples and experimental studies have shown that the partial dissolution of EGMs occurs in two stages: (1) loss of sodium and hydration; (2) loss of other cations not included in the zirconosilicate framework. A generalized scheme of partial dissolution of EGM is shown in Figure 8. The process proceeds most intensively in acidic hydrothermal solutions and may be responsible for the appearance of new mineral species in the eudialyte group.
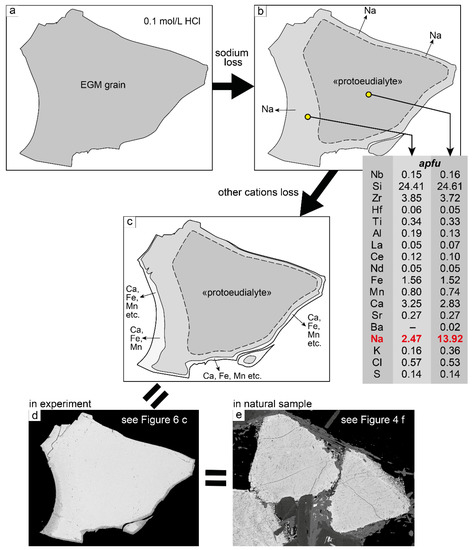
Figure 8.
The general scheme of partial dissolution of EGM. (a) Start of the experiment: a grain of unaltered EGM is placed in 0.1 mol/L HCl solution; (b) loss of sodium from the marginal parts of EGM grain leads to the formation of EGM with extremely low Na content; (c) loss of other cations from the edge of the grain; as a result, a rim of the Si-Zr phases is formed; (d) EGM grain after experiment; unaltered EGM (in the center), surrounded first by a rim of low-sodium EGM and then by a rim of Si-Zr phase; BSE image; (e) EGM, partially dissolved in natural conditions; BSE image.
Supplementary Materials
The following supporting information can be downloaded at: https://www.mdpi.com/article/10.3390/min12111460/s1, Figure S1: X-ray data; Powder X-ray diffraction data.
Author Contributions
Conceptualization, J.A.M., G.O.K., and S.M.A.; methodology, G.O.K.; investigation, Y.A.P. and G.O.K.; resources, J.A.M. and S.M.A.; data curation, Y.A.P. and G.O.K.; writing—original draft preparation, J.A.M.; writing—review and editing, G.O.K., Y.A.P., and S.M.A.; visualization, Y.A.P. and J.A.M.; project administration, J.A.M. All authors have read and agreed to the published version of the manuscript.
Funding
This research was funded by Russian Science Foundation, project No. 21-47-09010.
Data Availability Statement
Not applicable.
Acknowledgments
We are grateful to the reviewers who helped us improve the presentation of our results.
Conflicts of Interest
The authors declare no conflict of interest.
References
- Stromeyer, F. Summary of Meeting 16 December 1819. Göttingische Gelehrte Anz. 1819, 3, 1993–2000. [Google Scholar]
- Sjöqvist, A.S.L. The Tale of Greenlandite: Commemorating the Two-Hundredth Anniversary of Eudialyte (1819–2019). Minerals 2019, 9, 497. [Google Scholar] [CrossRef]
- Aksenov, S.M.; Kabanova, N.A.; Chukanov, N.V.; Panikorovskii, T.L.; Blatov, V.A.; Krivovichev, S.V. The Role of Local Heteropolyhedral Substitutions in the Stoichiometry, Topological Characteristics and Ion-Migration Paths in the Eudialyte-Related Structures: A Quantitative Analysis. Acta Crystallogr. Sect. B 2022, 78, 80–90. [Google Scholar] [CrossRef] [PubMed]
- Rastsvetaeva, R.K.; Chukanov, N.V.; Aksenov, S.M. Minerals of Eudialyte Group: Crystal Chemistry, Properties, Genesis; University of Nizhni Novgorod: Nizhniy Novgorod, Russia, 2012. (In Russian) [Google Scholar]
- Rastsvetaeva, R.K. Structural Mineralogy of the Eudialyte Group: A Review. Crystallogr. Rep. 2007, 52, 47–64. [Google Scholar] [CrossRef]
- Chukanov, N.V.; Rastsvetaeva, R.K.; Rozenberg, K.A.; Aksenov, S.M.; Pekov, I.V.; Belakovsky, D.I.; Kristiansen, R.; Van, K.V. Ilyukhinite (H3O,Na)14Ca6Mn2Zr3Si26O72(OH)2∙3H2O, a New Mineral of the Eudialyte Group. Geol. Ore Depos. 2017, 59, 592–600. [Google Scholar] [CrossRef]
- Khomyakov, A.P.; Nechelyustov, G.N.; Rastsvetaeva, R.K.; Rozenberg, K.A. Davinciite, Na12K3Ca6Fe32+Zr3(Si26O73OH)Cl2, a New K,Na-Ordered Mineral of the Eudialyte Group from the Khibiny Alkaline Pluton, Kola Peninsula, Russia. Geol. Ore Depos. 2013, 55, 532–540. [Google Scholar] [CrossRef]
- Mikhailova, J.A.; Stepenshchikov, D.G.; Kalashnikov, A.O.; Aksenov, S.M. Who Is Who in the Eudialyte Group: A New Algorithm for the Express Allocation of a Mineral Name Based on the Chemical Composition. Minerals 2022, 12, 224. [Google Scholar] [CrossRef]
- Khomyakov, A.P.; Nechelyustov, G.N.; Rastsvetaeva, R.K.; Rozenberg, K.A. Andrianovite, Na12(K,Sr,Ce)3Ca6Mn3Zr3Nb(Si25O73)(O,H2O,OH)5, a New Potassium-Rich Mineral Species of the Eudialyte Group from the Khibiny Alkaline Pluton, Kola Peninsula, Russia. Geol. Ore Depos. 2008, 50, 705–712. [Google Scholar] [CrossRef]
- Mclemore, V.T. Background and Perspectives on the Pajarito Mountain Yttrium-Zirconium Deposit, Mescalero Apache Indian Reseruation, Otero Gounty, New Mexico. New Mex. Geol. 1990, 12, 22. [Google Scholar]
- Kogarko, L.N. Ore-Forming Potential of Alkaline Magmas. Lithos 1990, 26, 167–175. [Google Scholar] [CrossRef]
- Sørrensen, H. Agpaitic Nepheline Syenites: A Potential Source of Rare Elements. Appl. Geochem. 1992, 7, 417–427. [Google Scholar] [CrossRef]
- Schilling, J.; Marks, M.A.W.; Wenzel, T.; Vennemann, T.; Horváth, L.; Tarassoff, P.; Jacob, D.E.; Markl, G. The Magmatic to Hydrothermal Evolution of the Intrusive Mont Saint-Hilaire Complex: Insights into the Late-Stage Evolution of Peralkaline Rocks. J. Petrol. 2011, 52, 2147–2185. [Google Scholar] [CrossRef]
- Sjöqvist, A.S.L.; Cornell, D.H.; Andersen, T.; Erambert, M.; Ek, M.; Leijd, M. Three Compositional Varieties of Rare-Earth Element Ore: Eudialyte-Group Minerals from the Norra Kärr Alkaline Complex, Southern Sweden. Minerals 2013, 3, 94–120. [Google Scholar] [CrossRef]
- Goodenough, K.M.; Schilling, J.; Jonsson, E.; Kalvig, P.; Charles, N.; Tuduri, J.; Deady, E.A.; Sadeghi, M.; Schiellerup, H.; Müller, A.; et al. Europe’s Rare Earth Element Resource Potential: An Overview of REE Metallogenetic Provinces and Their Geodynamic Setting. Ore Geol. Rev. 2016, 72, 838–856. [Google Scholar] [CrossRef]
- Stark, T.; Silin, I.; Wotruba, H. Mineral Processing of Eudialyte Ore from Norra Kärr. J. Sustain. Metall. 2017, 3, 32–38. [Google Scholar] [CrossRef]
- Davris, P.; Stopic, S.; Balomenos, E.; Panias, D.; Paspaliaris, I.; Friedrich, B. Leaching of Rare Earth Elements from Eudialyte Concentrate by Suppressing Silica Gel Formation. Min. Eng. 2017, 108, 115–122. [Google Scholar] [CrossRef]
- Lebedev, V.N. Sulfuric Acid Technology for Processing of Eudialyte Concentrate. Russ. J. Appl. Chem. 2003, 76, 1559–1563. [Google Scholar] [CrossRef]
- Balinski, A.; Atanasova, P.; Wiche, O.; Kelly, N.; Reuter, M.A.; Scharf, C. Selective Leaching of Rare Earth Elements (REEs) from Eudialyte Concentrate after Sulfation and Thermal Decomposition of Non-Ree Sulfates. Minerals 2019, 9, 522. [Google Scholar] [CrossRef]
- Johnsen, O.; Ferraris, G.; Gault, R.A.; Grice, J.D.; Kampf, A.R.; Pekov, I.V. The Nomenclature of Eudialyte-Group Minerals. Can. Mineral. 2003, 41, 785–794. [Google Scholar] [CrossRef]
- Marks, M.A.; Markl, G. A Global Review on Agpaitic Rocks. Earth Sci. Rev. 2017, 173, 229–258. [Google Scholar] [CrossRef]
- Sorensen, H. The Agpaitic Rocks—An Overview. Miner. Mag. 1997, 61, 485–498. [Google Scholar] [CrossRef]
- Chakhmouradian, A.R.; Mitchell, R.H. The Mineralogy of Ba- and Zr-Rich Alkaline Pegmatites from Gordon Butte, Crazy Mountains (Montana, USA): Comparisons between Potassic and Sodic Agpaitic Pegmatites. Contrib. Mineral. Petrol. 2002, 143, 93–114. [Google Scholar] [CrossRef]
- Ridolfi, F.; Renzulli, A.; Santi, P.; Upton, B.G.J. Evolutionary Stages of Crystallization of Weakly Peralkaline Syenites: Evidence from Ejecta in the Plinian Deposits of Agua de Pau Volcano (São Miguel, Azores Islands). Miner. Mag. 2003, 67, 749–767. [Google Scholar] [CrossRef]
- Kogarko, L.N.; Orlova, M.P.; Woolley, A.R. Alkaline Rocks and Carbonatites Part 2: Former USSR; Springer Science + Business Media: Dordrecht, The Netherlands, 1995. [Google Scholar]
- Harris, C.; Marsh, J.S.; Milner, S.C. Petrology of the Alkaline Core of the Messum Igneous Complex, Namibia: Evidence for the Progressively Decreasing Effect of Crustal Contamination. J. Petrol. 1999, 40, 1377–1397. [Google Scholar] [CrossRef]
- Mitchell, R.H.; Liferovich, R.P. Subsolidus Deuteric/Hydrothermal Alteration of Eudialyte in Lujavrite from the Pilansberg Alkaline Complex, South Africa. Lithos 2006, 91, 352–372. [Google Scholar] [CrossRef]
- Coulson, I.M. Post-Magmatic Alteration in Eudialyte from the North Qoroq Centre, South Greenland. Miner. Mag. 1997, 61, 99–109. [Google Scholar] [CrossRef][Green Version]
- Mitchell, R.H.; Chakrabarty, A. Paragenesis and Decomposition Assemblage of a Mn-Rich Eudialyte from the Sushina Peralkaline Nepheline Syenite Gneiss, Paschim Banga, India. Lithos 2012, 152, 218–226. [Google Scholar] [CrossRef]
- Estrade, G.; Salvi, S.; Béziat, D. Crystallization and Destabilization of Eudialyte-Group Minerals in Peralkaline Granite and Pegmatite: A Case Study from the Ambohimirahavavy Complex, Madagascar. Miner. Mag. 2018, 82, 375–399. [Google Scholar] [CrossRef]
- Borst, A.M.; Friis, H.; Andersen, T.; Nielsen, T.F.D.; Waight, T.E.; Smit, M.A. Zirconosilicates in the Kakortokites of the Ilímaussaq Complex, South Greenland: Implications for Fluid Evolution and HFSE-REE Mineralisation in Agpaitic Systems. Miner. Mag. 2016, 80, 5–30. [Google Scholar] [CrossRef]
- van de Ven, M.A.J.; Borst, A.M.; Davies, G.R.; Hunt, E.J.; Finch, A.A. Hydrothermal Alteration of Eudialyte-Hosted Critical Metal Deposits: Fluid Source and Implications for Deposit Grade. Minerals 2019, 9, 422. [Google Scholar] [CrossRef]
- Salvi, S. Hydrothermal Mobilization of High Field Strength Elements in Alkaline Igneous Systems: Evidence from the Tamazeght Complex (Morocco). Econ. Geol. 2000, 95, 559–576. [Google Scholar] [CrossRef]
- Kogarko, L.N.; Nielsen, T.F.D. Compositional Variation of Eudialyte-Group Minerals from the Lovozero and Ilímaussaq Complexes and on the Origin of Peralkaline Systems. Minerals 2021, 11, 548. [Google Scholar] [CrossRef]
- Pekov, I.V. Genetic Mineralogy and Crystal Chemistry of Rare Elements in Highly Alkaline Postmagmatic Systems. Ph.D. Thesis, Moscow State University, Moskow, Russia, 2005. (In Russian). [Google Scholar]
- Sokolova, M.N. Typomorphism of Minerals of Ultraagpaitic Associations; Nauka: Moskow, Russia, 1986. (In Russian) [Google Scholar]
- Semenov, E.I. Mineralogy of the Lovozero Alkaline Massif; Nauka: Moscow, Russia, 1972. (In Russian) [Google Scholar]
- Khomyakov, A.P. Mineralogy of Hyperagpaitic Alkaline Rocks; Oxford Scientific Publications: Oxford, UK, 1995. [Google Scholar]
- Pekov, I.V. Lovozero Massif: History, Pegmatites, Minerals; Ocean Pictures Ltd.: Moscow, Russia, 2002. (In Russian) [Google Scholar]
- Kramm, U.; Kogarko, L.N. Nd and Sr Isotope Signatures of the Khibina and Lovozero Agpaitic Centres, Kola Alkaline Province, Russia. Lithos 1994, 32, 225–242. [Google Scholar] [CrossRef]
- Mitchell, R.H.; Wu, F.Y.; Yang, Y.H. In Situ U-Pb, Sr and Nd Isotopic Analysis of Loparite by LA-(MC)-ICP-MS. Chem. Geol. 2011, 280, 191–199. [Google Scholar] [CrossRef]
- Wu, F.Y.; Yang, Y.H.; Marks, M.A.W.; Liu, Z.C.; Zhou, Q.; Ge, W.C.; Yang, J.S.; Zhao, Z.F.; Mitchell, R.H.; Markl, G. In Situ U-Pb, Sr, Nd and Hf Isotopic Analysis of Eudialyte by LA-(MC)-ICP-MS. Chem. Geol. 2010, 273, 8–34. [Google Scholar] [CrossRef]
- Korchak, Y.A.; Men’shikov, Y.P.; Pakhomovskii, Y.A.; Yakovenchuk, V.N.; Ivanyuk, G.Y. Trap Formation of the Kola Peninsula. Petrology 2011, 19, 87–101. [Google Scholar] [CrossRef]
- Eliseev, N.A. Devonian Volcanic Rocks of the Lovozero Tundras. ZVMO 1946, 75, 113. (In Russian) [Google Scholar]
- Gerasimovsky, V.I.; Volkov, V.P.; Kogarko, L.N.; Polyakov, A.I.; Saprykina, T.V.; Balashov, Y.A. Geochemistry of the Lovozero Alkaline Massif; Nauka: Moscow, Russia, 1966. (In Russian) [Google Scholar]
- Bussen, I.V.; Sakharov, A.S. Petrology of the Lovozero Alkaline Massif; Nauka: Leningrad, Russia, 1972. (In Russian) [Google Scholar]
- Vlasov, K.A.; Kuzmenko, M.V.; Eskova, E.M. Lovozero Alkaline Massif; Academy of sciences SSSR: Moskow, Russia, 1959. (In Russian) [Google Scholar]
- Fersman, A.E. Minerals of the Khibina and Lovozero Tundras; Academy of Sciences of the USSR: Moscow-Leningrad, Russia, 1937. (In Russian) [Google Scholar]
- Kogarko, L.; Nielsen, T.F.D. Chemical Composition and Petrogenetic Implications of Eudialyte-Group Mineral in the Peralkaline Lovozero Complex, Kola Peninsula, Russia. Minerals 2020, 10, 1036. [Google Scholar] [CrossRef]
- Panikorovskii, T.L.; Mikhailova, Y.A.; Pakhomovsky, Y.A.; Ivanyuk, G.Y. Crystal Chemistry of the Eudialyte Group Minerals from the Lovozero Eudialyte Complex, Kola Peninsula, Russia. In Proceedings of the Magmatism of the Earth and Related Strategic Metal Deposits—2019, St Petersburg, Russia, 23–26 May 2019; pp. 221–223. [Google Scholar]
- Mikhailova, J.A.; Pakhomovsky, Y.A.; Panikorovskii, T.L.; Bazai, A.V.; Yakovenchuk, V.N. Eudialyte Group Minerals from the Lovozero Alkaline Massif, Russia: Occurrence, Chemical Composition, and Petrogenetic Significance. Minerals 2020, 10, 1070. [Google Scholar] [CrossRef]
- Rastsvetaeva, R.K.; Chukanov, N.V.; Van, K.V. New Data on the Isomorphism in Eudialyte-Group Minerals. VII: Crystal Structure of the Eudialyte–Sergevanite Series Mineral from the Lovozero Alkaline Massif. Crystallogr. Rep. 2020, 65, 554–559. [Google Scholar] [CrossRef]
- Borneman-Starynkevich, I.D. Eudialyte. In Isomorphism in Minerals; Nauka: Moscow, Russia, 1975. (In Russian) [Google Scholar]
- Bussen, I.V.; Rogachev, D.A. Rock-Forming Eudialyte of the Lovozero Alkaline Massif. Mater. Mineral. Kola Penins. 1967, 194. (In Russian) [Google Scholar]
- Kostyleva, E.E. Eudialyte as Zirconium Ore in the Khibiny and Lovozero Tundras. Khibiny’s Apatites 1933, 5, 148–153. (In Russian) [Google Scholar]
- Kostyleva, E.E. Isomorphic Eudialyte-Eucolith Series from Khibiny and Lovozero Tundras. Proc. Mineral. Mus. Acad. Sci. USSR 1929, 3, 169–222. (In Russian) [Google Scholar]
- Warr, L.N. IMA-CNMNC Approved Mineral Symbols. Miner. Mag 2021, 85, 291–320. [Google Scholar] [CrossRef]
- Pekov, I.V.; Krivovichev, S.V.; Zolotarev, A.A.; Yakovenchuk, V.N.; Armbruster, T.; Pakhomovsky, Y.A. Crystal Chemistry and Nomenclature of the Lovozerite Group. Eur. J. Mineral. 2009, 21, 1061–1071. [Google Scholar] [CrossRef]
- Khomyakov, A.P. New in the Mineralogy of the Lovozerite Group. Proc. USSR Acad. Sci. 1977, 237, 199–202. [Google Scholar]
- Rozenberg, K.A.; Rastsvetaeva, R.K.; Khomyakov, A.P. Decationized and Hydrated Eudialytes. Oxonium Problem. Eur. J. Mineral. 2005, 17, 875–882. [Google Scholar] [CrossRef]
- Khomyakov, A.P.; Nechelyustov, G.N.; Rastsvetaeva, R.K. Aqualite, a New Mineral Species of the Eudialyte Group from the Inagli Alkaline Pluton, Sakha-Yakutia, Russia, and the Problem of Oxonium in Hydrated Eudialytes. Geol. Ore Depos. 2007, 49, 739–751. [Google Scholar] [CrossRef]
- Rastsvetaeva, R.K.; Khomyakov, A.P. Structural Characteristics of Na,Fe-Decationated Eudialyte with the Symmetry R3. Crystallogr. Rep. 2002, 47, 232–236. [Google Scholar] [CrossRef]
- Rastsvetaeva, R.K.; Viktorova, K.A.; Aksenov, S.M. New Data on the Isomorphism in Eudialyte-Group Minerals. II. Refinement of the Aqualite Crystal Structure at 110 K. Crystallogr. Rep. 2018, 63, 891–896. [Google Scholar] [CrossRef]
- Ekimenkova, I.A.; Rastsvetaeva, R.K.; Chukanov, N.V. Crystal Structure of the Oxonium-Containing Analogue of Eudialyte. Proc. Russ. Acad. Sci. 2000, 371, 625–628. [Google Scholar]
- Chukanov, N.V.; Vigasina, M.F.; Rastsvetaeva, R.K.; Aksenov, S.M.; Mikhailova, J.A.; Pekov, I.v. The Evidence of Hydrated Proton in Eudialyte-Group Minerals Based on Raman Spectroscopy Data. J. Raman Spectrosc. 2022, 53, 1188–1203. [Google Scholar] [CrossRef]
- Rastsvetaeva, R.K.; Aksenov, S.M.; Rozenberg, K.A. Crystal Structure and Genesis of the Hydrated Analog of Rastsvetaevite. Crystallogr. Rep. 2015, 60, 831–840. [Google Scholar] [CrossRef]
Publisher’s Note: MDPI stays neutral with regard to jurisdictional claims in published maps and institutional affiliations. |
© 2022 by the authors. Licensee MDPI, Basel, Switzerland. This article is an open access article distributed under the terms and conditions of the Creative Commons Attribution (CC BY) license (https://creativecommons.org/licenses/by/4.0/).