1. Introduction
Recent advances in Artificial Intelligence (AI) have accelerated the use of data-driven methods across various fields, including healthcare, manufacturing, and education [
1,
2,
3]. Among these technologies, Deep Learning (DL) has demonstrated remarkable performance by automatically extracting high-dimensional and nonlinear features from large-scale data [
4]. Despite its success, DL models often behave as black boxes: their internal decision-making process is difficult to interpret, and the lack of transparency limits their adoption in safety-critical domains such as medicine, law, and finance [
5,
6,
7,
8,
9]. To address this limitation, neuro-fuzzy systems have gained attention as an interpretable form of eXplainable Artificial Intelligence (XAI). By modeling uncertainty and generating human-readable rules based on membership functions, fuzzy inference provides linguistic explanations that help users understand why a particular decision was made [
10,
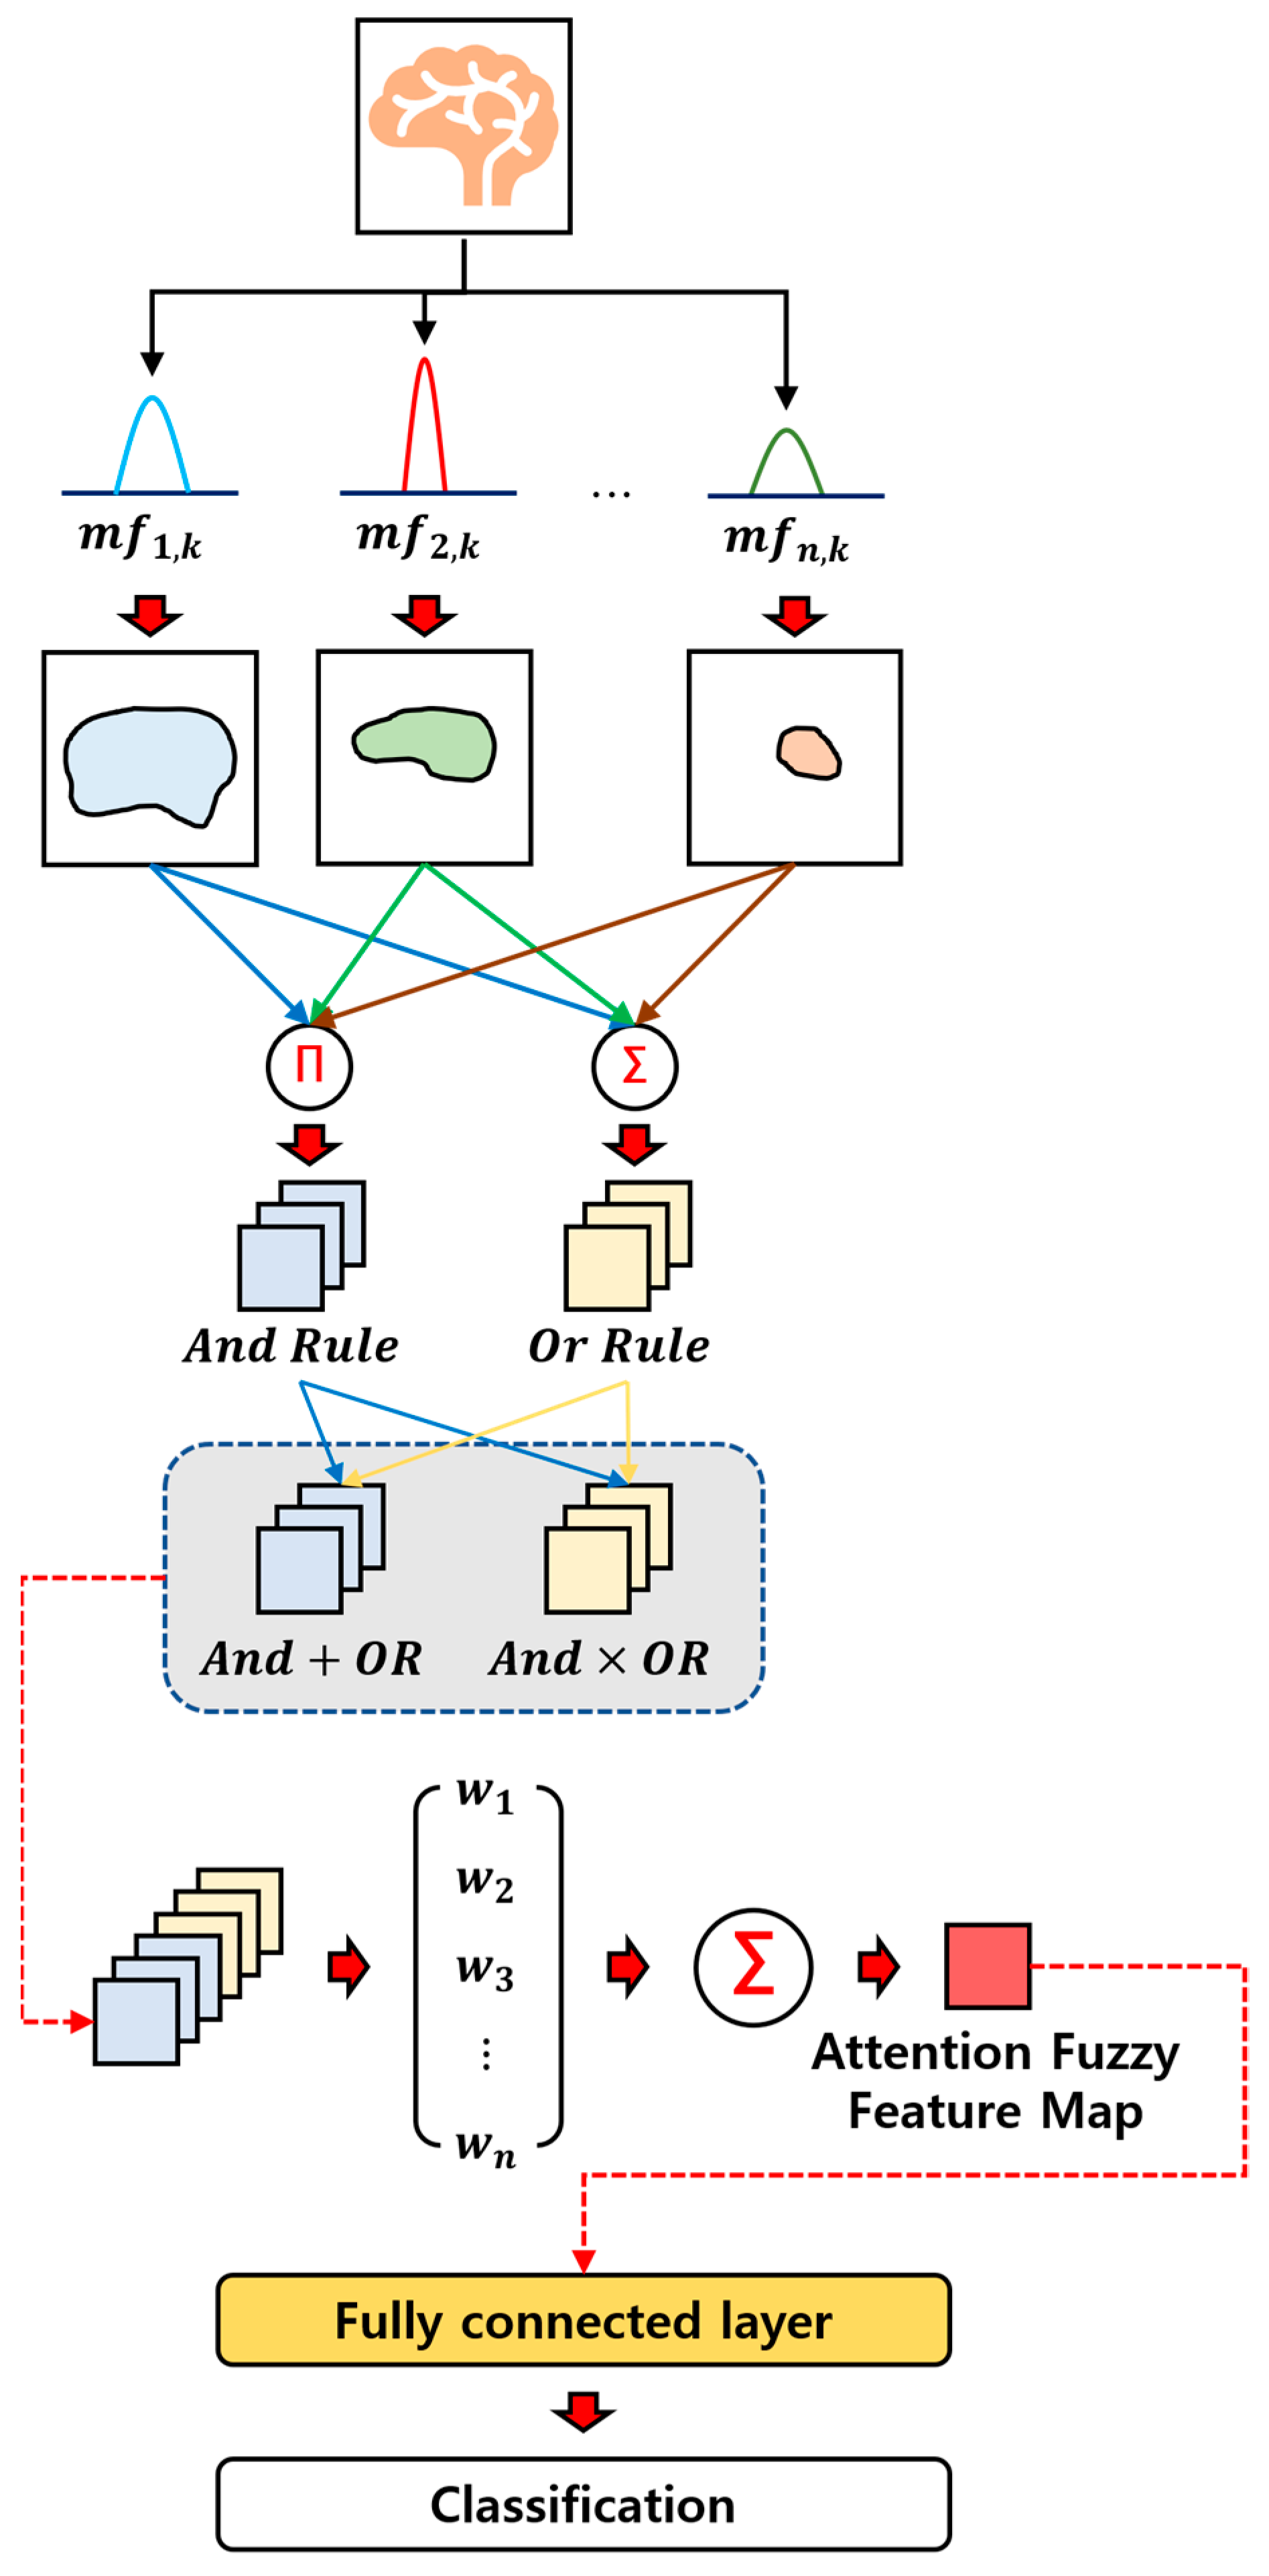
11]. However, existing fuzzy–deep learning hybrids suffer from a major structural drawback: fuzzy rules are usually applied to deep feature vectors, not to the original image domain. As a result, the learned rules operate on abstract hidden representations that clinicians cannot interpret visually, limiting their usefulness in medical imaging. Furthermore, conventional fuzzy logic is inherently designed for tabular or one-dimensional signal data, making pixel-level reasoning on images difficult. To bridge this gap, we propose the Fuzzy Attention Rule (FAR) model, a novel framework that enables direct pixel-level fuzzy computation on medical images without relying on CNN-derived feature maps. FAR generates interpretable rule images that visually correspond to meaningful lesion-related patterns in the input domain. This approach provides transparent reasoning aligned with the original image—something that existing neuro-fuzzy systems and Grad-CAM-based explainability methods cannot fully achieve.
However, despite these advantages, most existing neuro-fuzzy approaches are mainly applied to tabular or signal-based data and are typically attached to the high-level feature vectors extracted from deep learning models. As a result, the learned fuzzy rules operate in an abstract feature space that is difficult for users or clinicians to interpret in the context of the original medical image. This gap highlights the need for a fuzzy–deep learning framework that provides both strong predictive performance and pixel-level interpretability within the image domain. To address this challenge, we propose the Fuzzy Attention Rule (FAR) model, which enables direct fuzzy computation on medical images and generates rule images that correspond to meaningful visual patterns in the input domain. FAR is designed to overcome the structural limitations that previously hindered pixel-level fuzzy reasoning and to provide interpretable representations aligned with the original medical image.
The main contributions of this work are summarized as follows:
- (1)
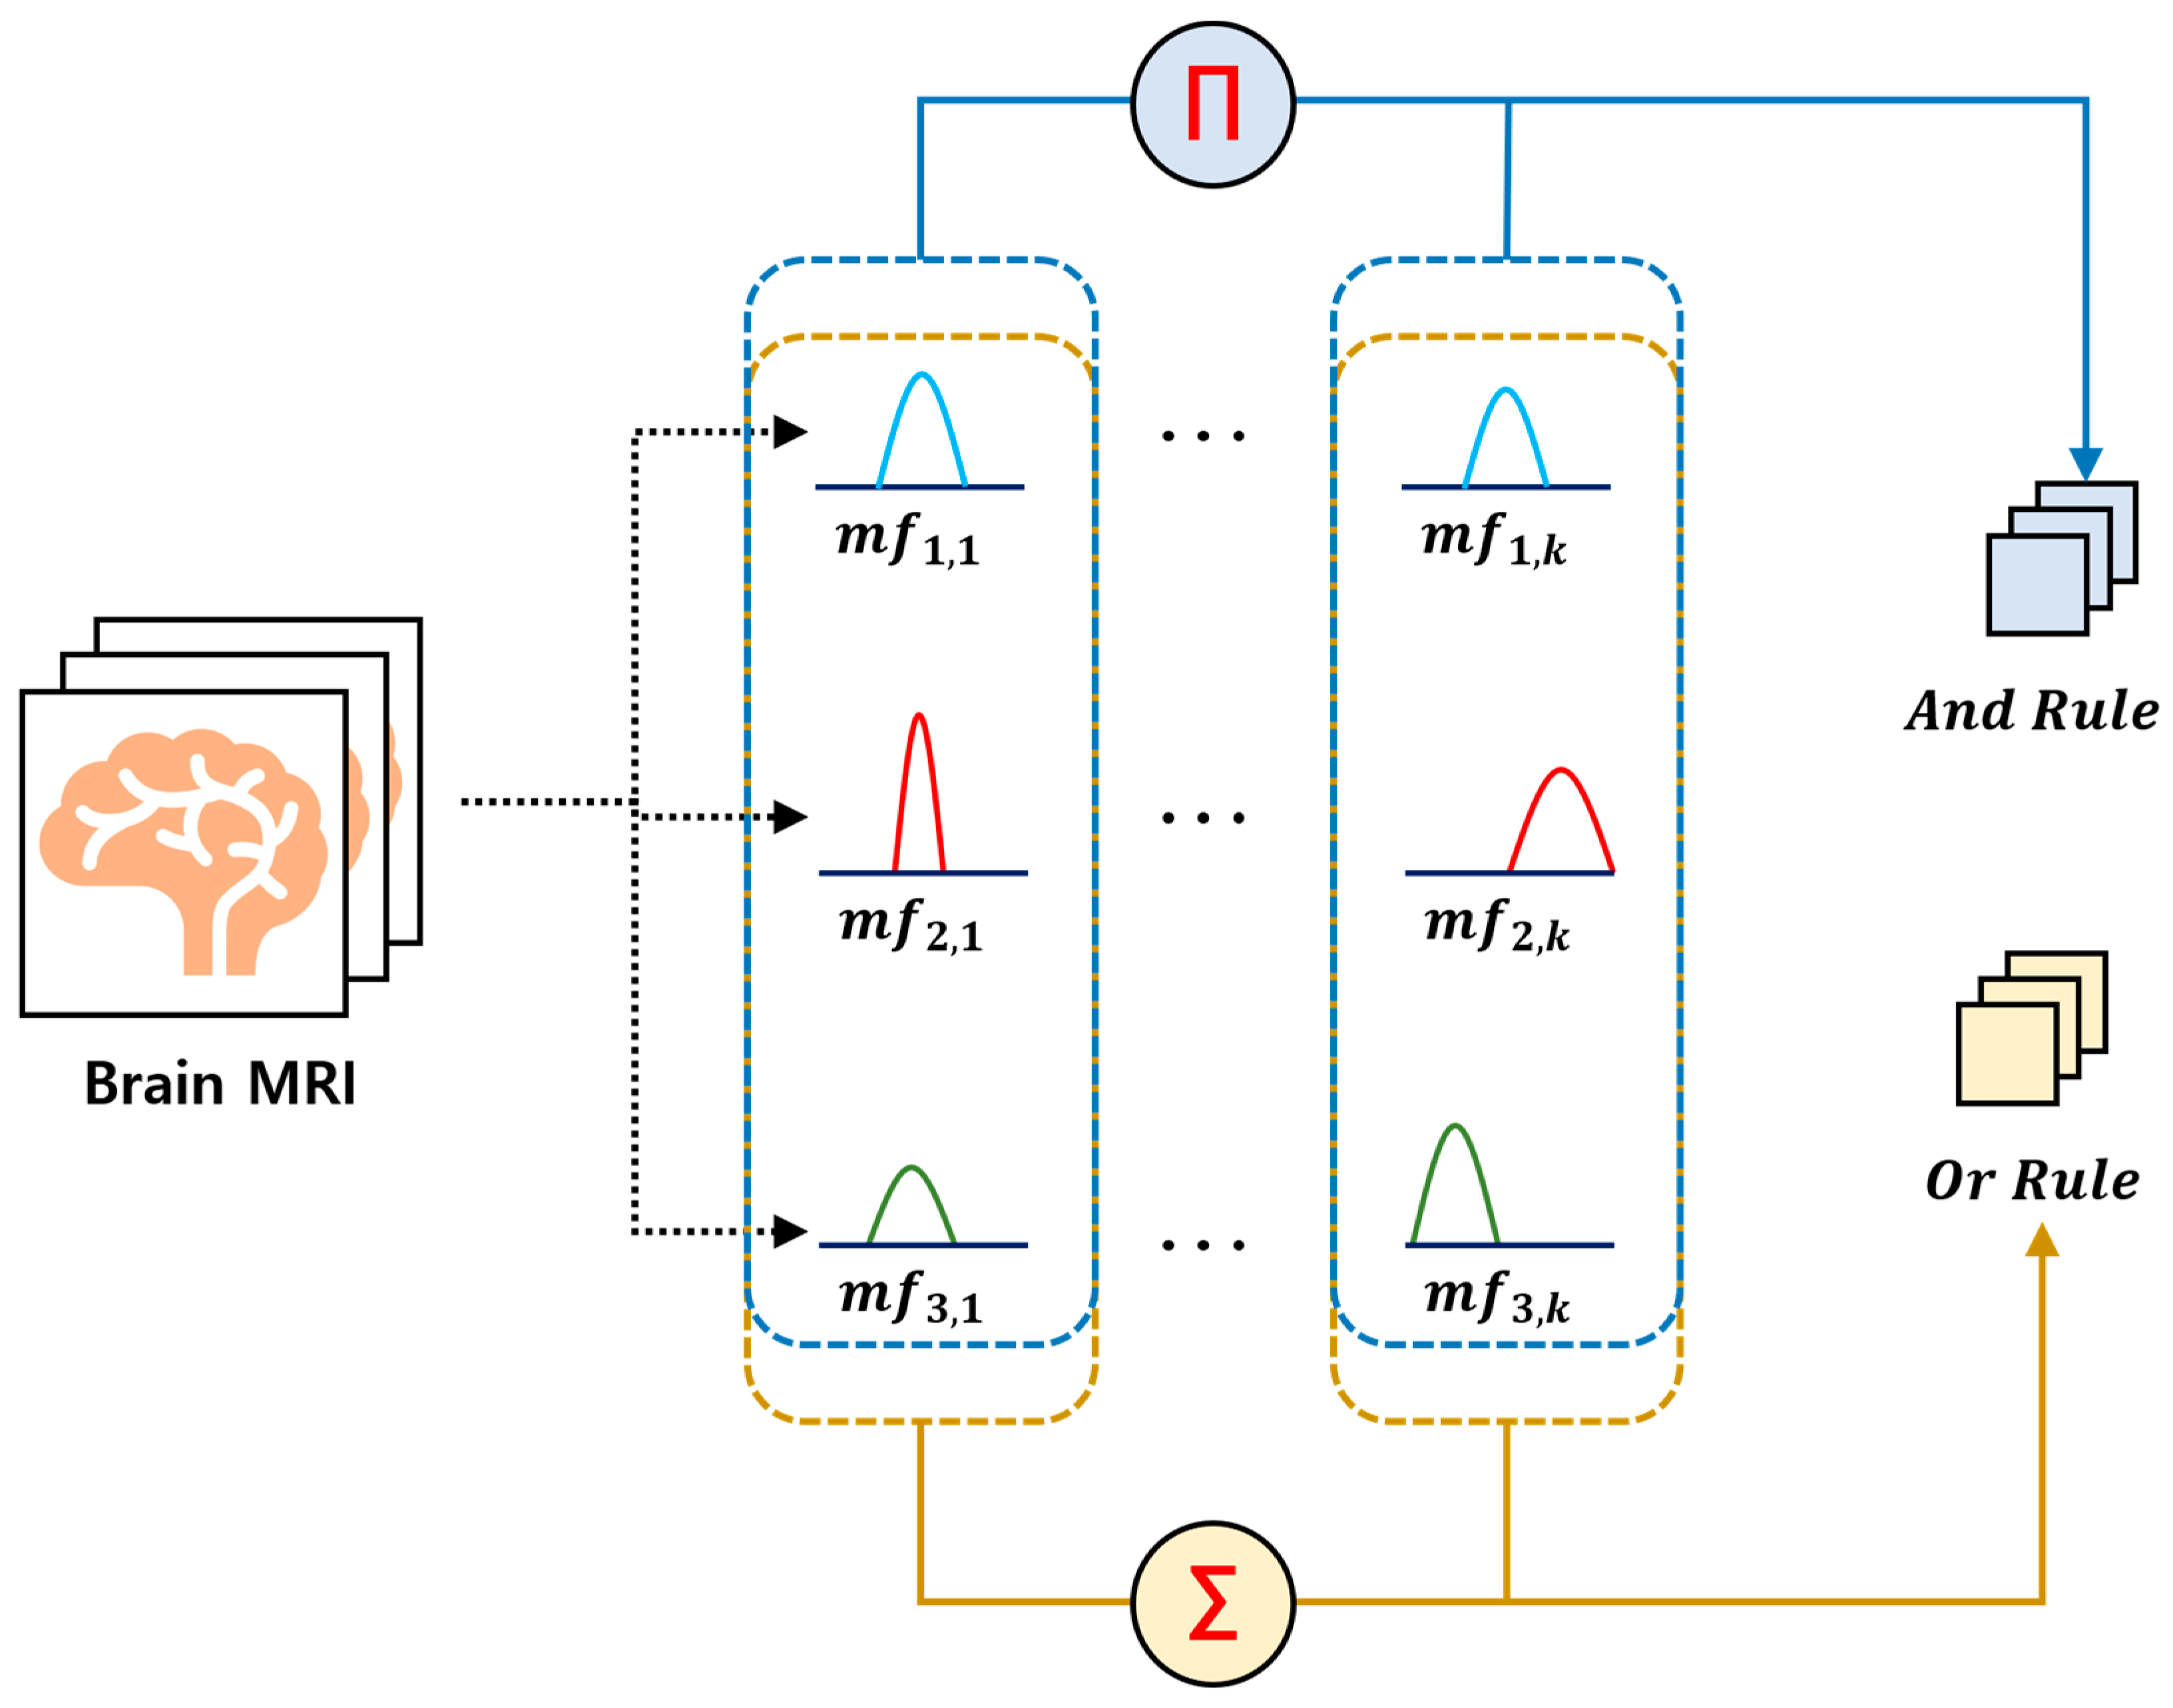
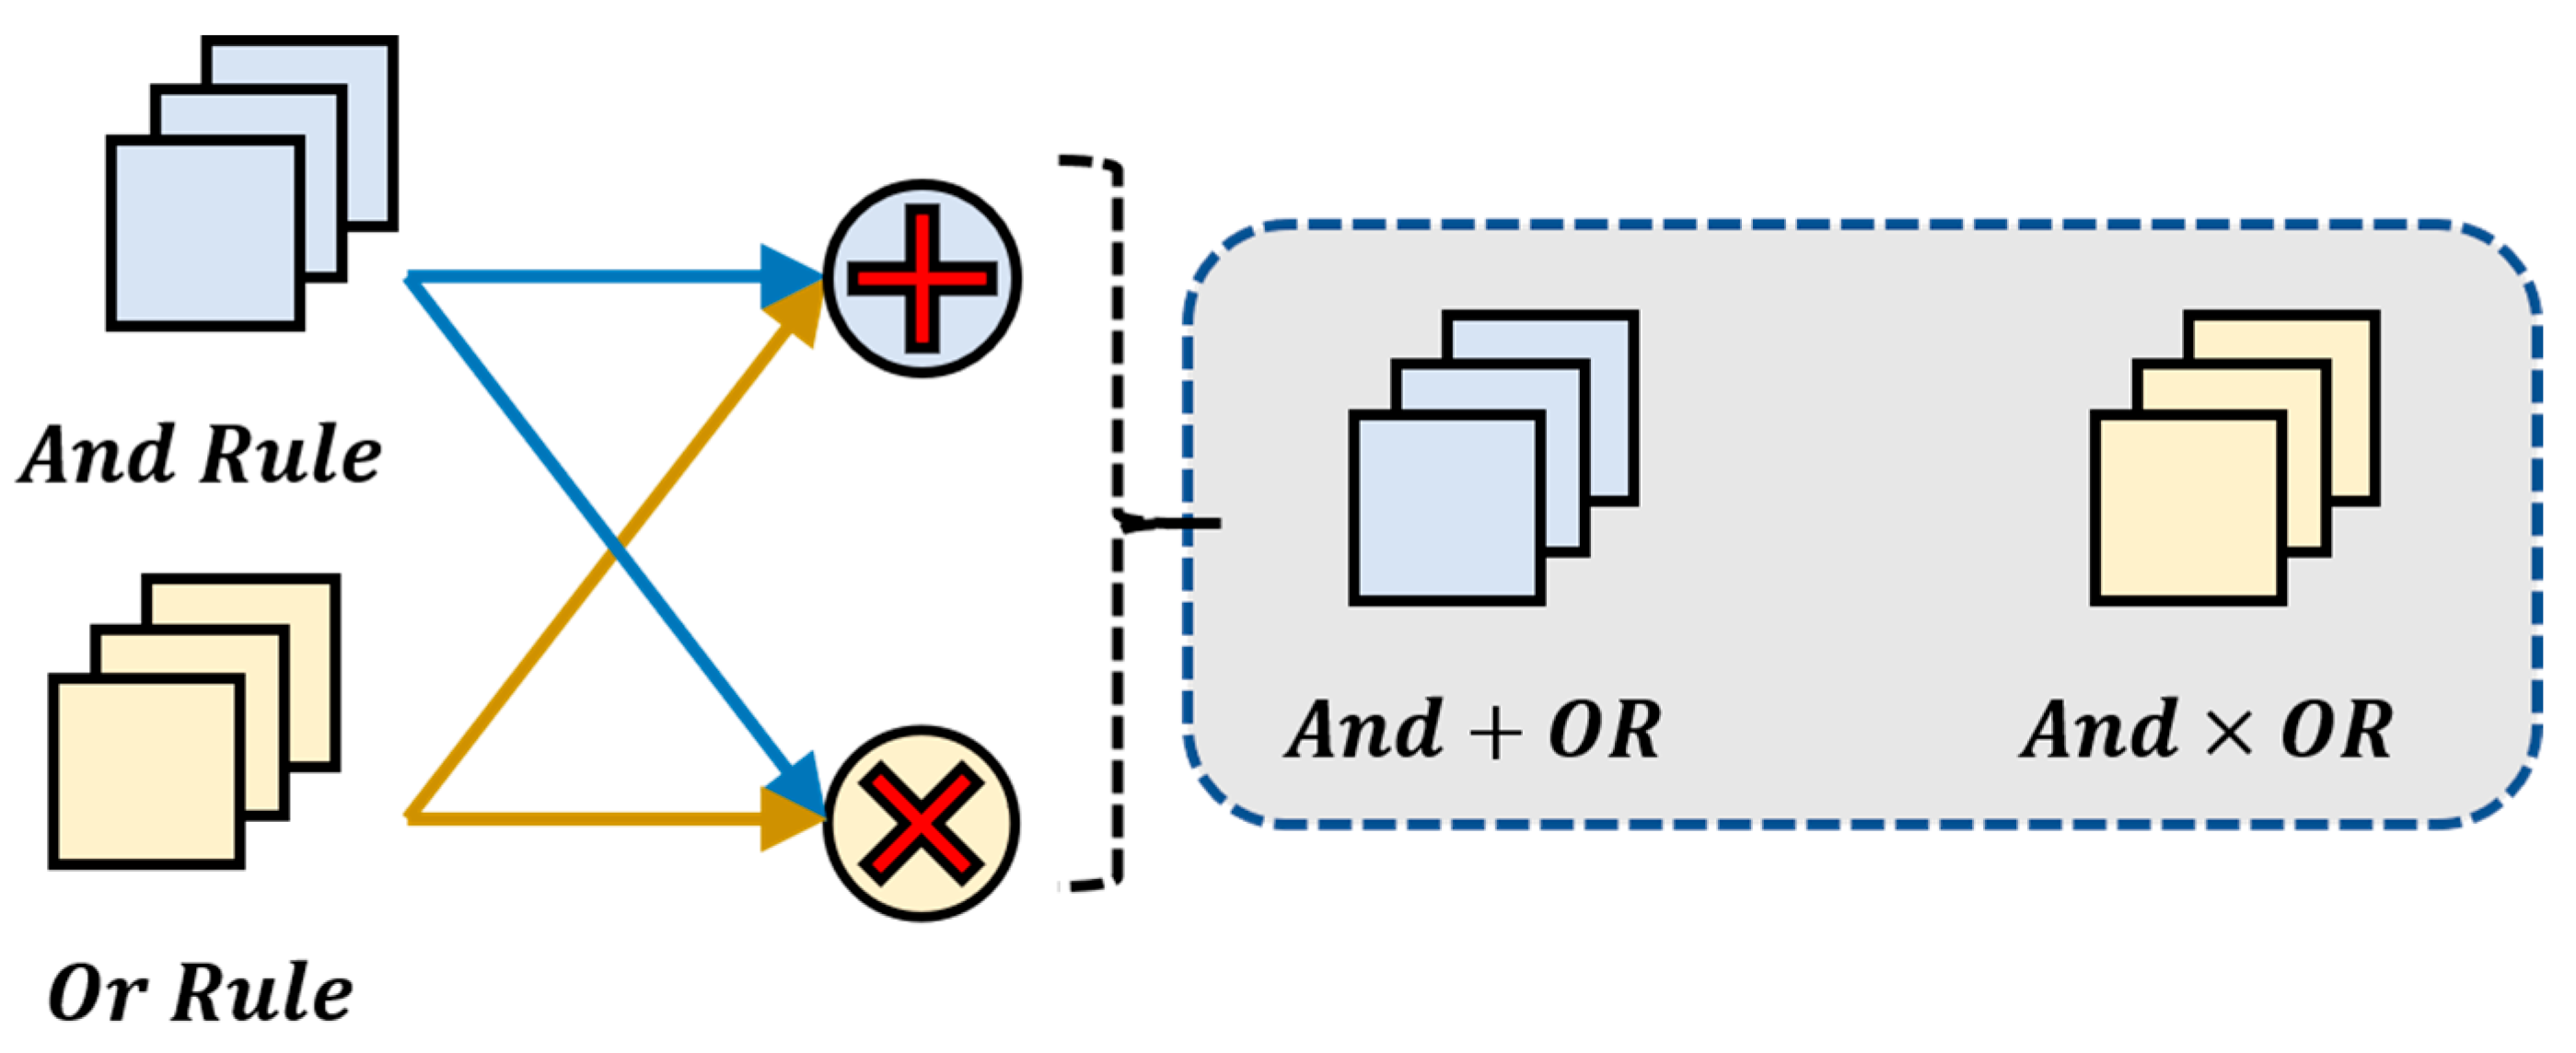
We introduce an AND/OR–based fuzzy rule construction method that generates interpretable rule images directly from medical inputs. The AND operator captures conservative feature interactions, whereas the OR operator captures broader and complementary patterns. The resulting rule images align more accurately with lesion regions than Grad-CAM, offering improved interpretability and reliability.
- (2)
FAR requires only a very small number of trainable fuzzy parameters to construct pixel-level rule maps, yet it achieves classification performance comparable to CNN-based models. This balance between minimal fuzzy parameterization and competitive accuracy makes FAR an attractive alternative for settings where interpretability at the image level is essential.
- (3)
By combining AND and OR rule maps, FAR integrates both conservative and inclusive feature representations, enhancing classification performance and interpretability in a symmetric manner. These complementary rule images provide richer insight into the model’s reasoning process and reveal which lesion-related features contribute to the final decision.
DL’s strong performance has been accompanied by a black box limitation, where users cannot understand the decision-making process. To address this, research into its fusion with fuzzy logic is actively underway. This section introduces studies that have improved both performance and explainability by handling uncertainty, as detailed below.
While DL’s automated feature extraction is more effective than manual methods, it is limited by its dependence on the quality and quantity of data. To mitigate the black box limitation of DL, Ma [
12] proposed the DIFL-FR (Deep Image Feature Learning with Fuzzy Rules) method. This approach demonstrated robust extraction capabilities even with noisy images and secured explainability through rules and the scalability of unsupervised learning. Zang [
13] proposed the FFT-FFR-RBFC model to improve the limitation that DL, despite its high processing power for tabular data, lacks enhanced interpretability. This model uses FFT to hierarchically stack fuzzy layers to boost classification performance and improves the loss of explainability in the hierarchical structure by reconstructing FFR. Finally, it performed fuzzy rule-based classification through the RBFC unit, demonstrating high classification performance and interpretability for tabular data.
Luo [
14] performed retinal image classification for automated diagnosis of Diabetic Retinopathy using DL but noted the problem that existing DL models depend on a large amount of labeled data. To address this, they proposed SFCN (Self-supervised Fuzzy Clustering Network). This framework performs retinal image classification with reduced label dependency by calculating the probability of a feature vector, generated after passing through DL convolutions, belonging to each cluster. Juang [
15] proposed the DFM-FNCN (Deep Feature Map-based Fuzzy Neural Classification Network), which enables the visual interpretation of feature maps outputted from a deep convolutional layer. This method processes images through a convolutional model and then uses a divide-and-conquer technique on the extracted feature maps to perform fuzzy operations for classification, allowing for computation with fewer parameters. It also provides interpretability by visualizing the feature maps.
Kurdi [
16] proposed a method to solve the problem that while DL achieves high performance in MRI-based brain tumor classification, it is difficult to preserve detailed information. This method segments the tumor area in the input MRI image using Fuzzy C-Means (FCM) and normalizes the parameters of the HHOCNN (Harris Hawks Optimized CNN) network by applying the Harris Hawks Optimization algorithm. Sovatzidi [
17] proposed an image classification method that can automatically interpret high-level features extracted by a CNN using a fuzzy cognitive map. This approach clusters features and groups them into several clusters per class, then calculates the similarity of the input features to these clusters to classify the class and provide an interpretable result.
Ennab [
18] proposed a new convolutional fuzzy model to provide pixel-level explainability in medical image classification. While existing black box-solving techniques provide explanations at the image level, the proposed method provides pixel-wise explanations, enabling high-level interpretation. It analyzes the range of pixel values of a normalized input image to classify them as normal or infected data. Thus, if a specific area falls within a certain class range, the degree of infection can be determined. The proposed method demonstrated higher performance and interpretability than existing methods. Kamthan [
19] proposed a hierarchical fuzzy DL technique to improve the limitations of fuzzy-based image classification tasks and reduce rule dimensionality. This method divides the input data into smaller samples, processes them using Otsu’s method, and hierarchically connects them to a fuzzy subsystem. This enables the processing of large-scale image data with fuzzy logic. While a CNN showed slightly better accuracy than the proposed method, the latter was more effective in terms of computational time.
Hasan [
20] proposed FP-CNN (Fuzzy Pooling CNN) as a COVID-19 classification model using ultrasonic lung images. Existing methods that use max or average pooling effectively reduce spatial dimensions but fail to adequately handle uncertainty. This limitation is overcome by applying a fuzzy system. Through the proposed FP, the features of the image are enhanced and uncertainty is handled, achieving high classification performance. Furthermore, it secured explainability by explaining the basis of the model’s predictions via SHAP. Belhadi [
21] proposed the Ensemble Fuzzy Deep Learning (EFDL) framework to increase the accuracy of medical image segmentation. It applied fuzzy logic to solve the problems of uncertainty and variability in brain tissue regions and trained the model using U-Net and Transformer. As data passes through the model, it goes through the proposed Volumetric Fuzzy Pooling (VFP) to reduce data uncertainty and enhance information. It showed superior performance compared to existing methods, but the inference time was longer in the knowledge-based search process.
3. Results
In this study, we employed the Brain Tumor MRI Dataset from Kaggle [
22] for tumor classification and lesion localization tasks. This dataset integrates the initial collection by Masoud Nickparvar [
23] and the SciDB Brain Tumor dataset [
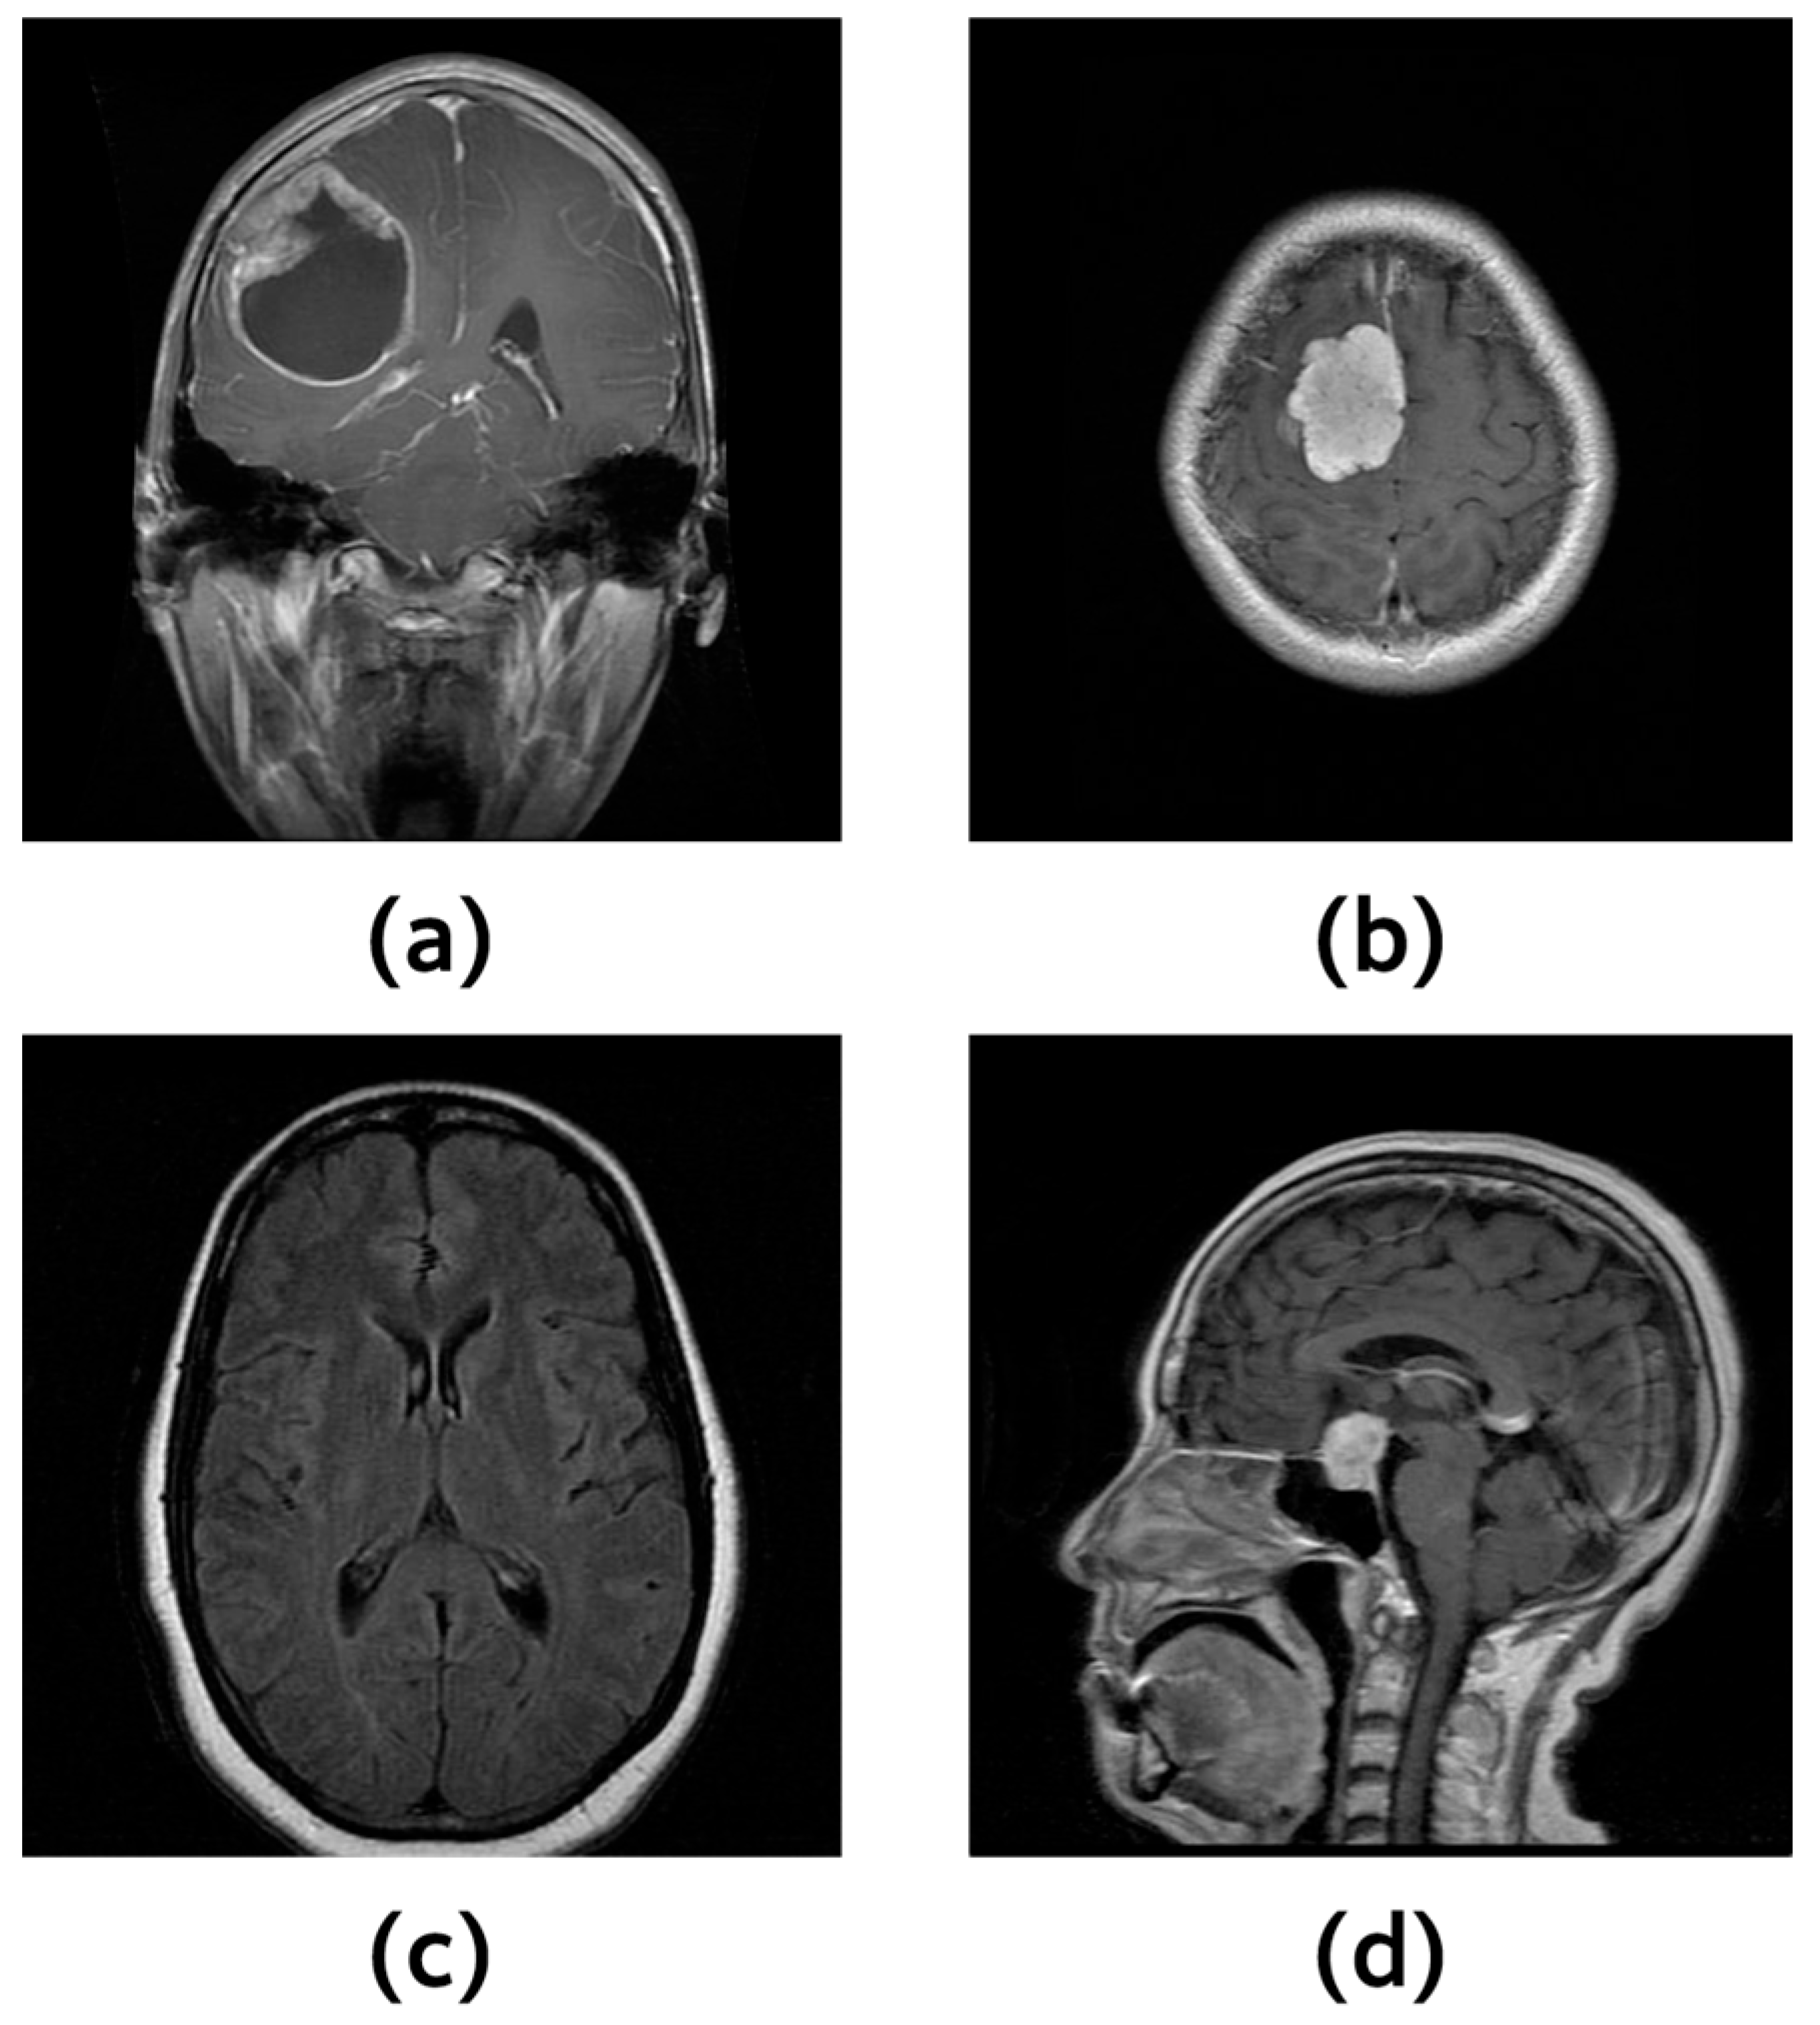
24], and includes four tumor categories accompanied by expert-annotated pixel-level lesion masks. These annotations allow us to evaluate not only classification accuracy but also whether the model correctly focuses on the pathological regions through quantitative and qualitative analyses. The dataset, as shown in
Figure 5, consists of 7023 MRI images, of which 5712 were randomly assigned for training and 1311 for testing. The second dataset is from Kaggle’s Alzheimer’s MRI Images [
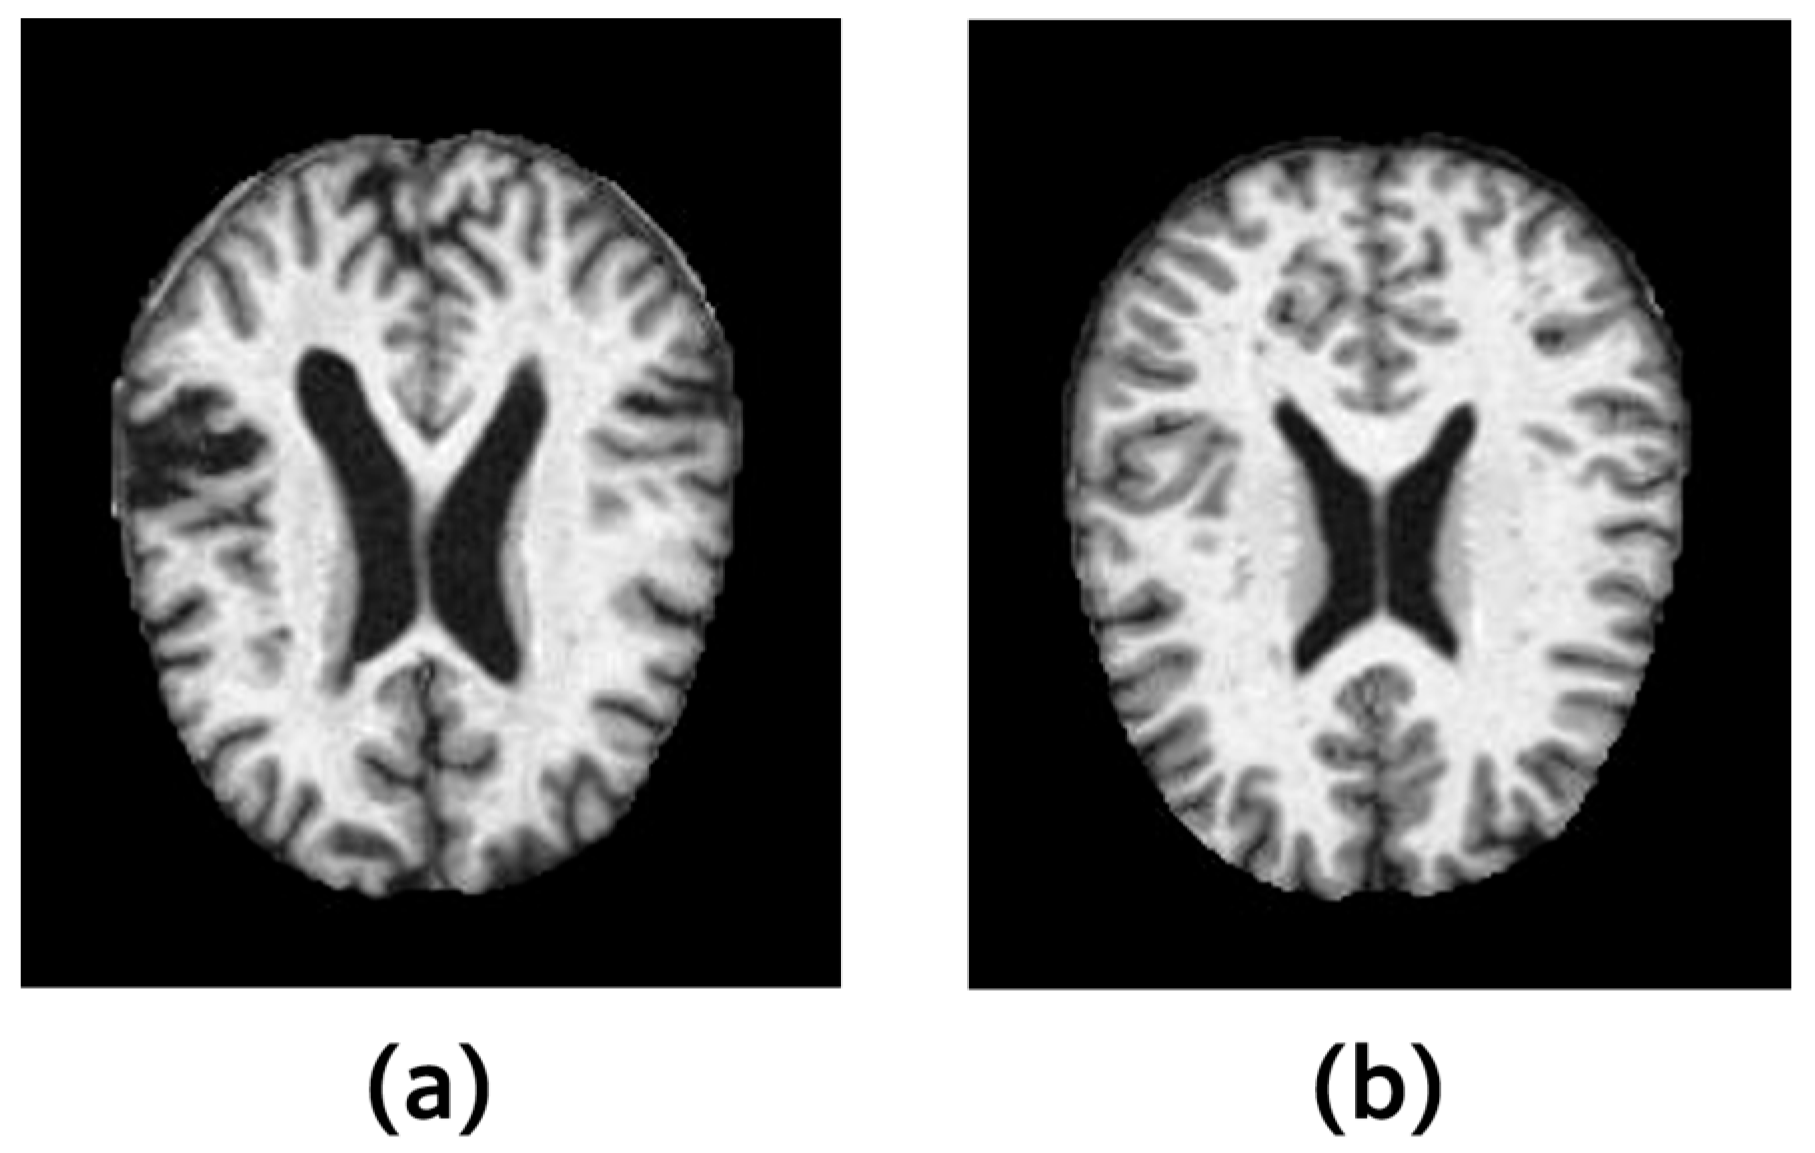
25], used to classify two disease states. Although the original dataset consists of four dementia states—mild demented, moderate demented, non-demented, and very mild demented—, as shown in
Figure 6, we reclassified them into two balanced classes, demented and non-demented, due to class imbalance. The second dataset contains 3200 images per class, and the data were randomly split into 70% for training and 30% for testing. To ensure transparency and prevent train–test leakage, we performed an average-hash-based duplication check between the training and test sets. Any duplicated images detected were removed from the test set to ensure a clean and reliable evaluation.
To ensure fair comparison across models, all experiments were conducted in MATLAB 2024b with randomized parameter initialization, using the Adam optimizer with a learning rate of 0.001 and 40 training epochs. Due to its deep architecture, Resnet-50 required approximately 500 min of training. FAR, which shares a similar structure with MLP but includes additional computations for fuzzy rule learning, required an average of approximately 25 min depending on the number of rules. The MLP model, being the simplest architecture, required roughly 5 min of training.
3.1. Comparison of Classification Performance Between Resnet50, MLP and FAR Model
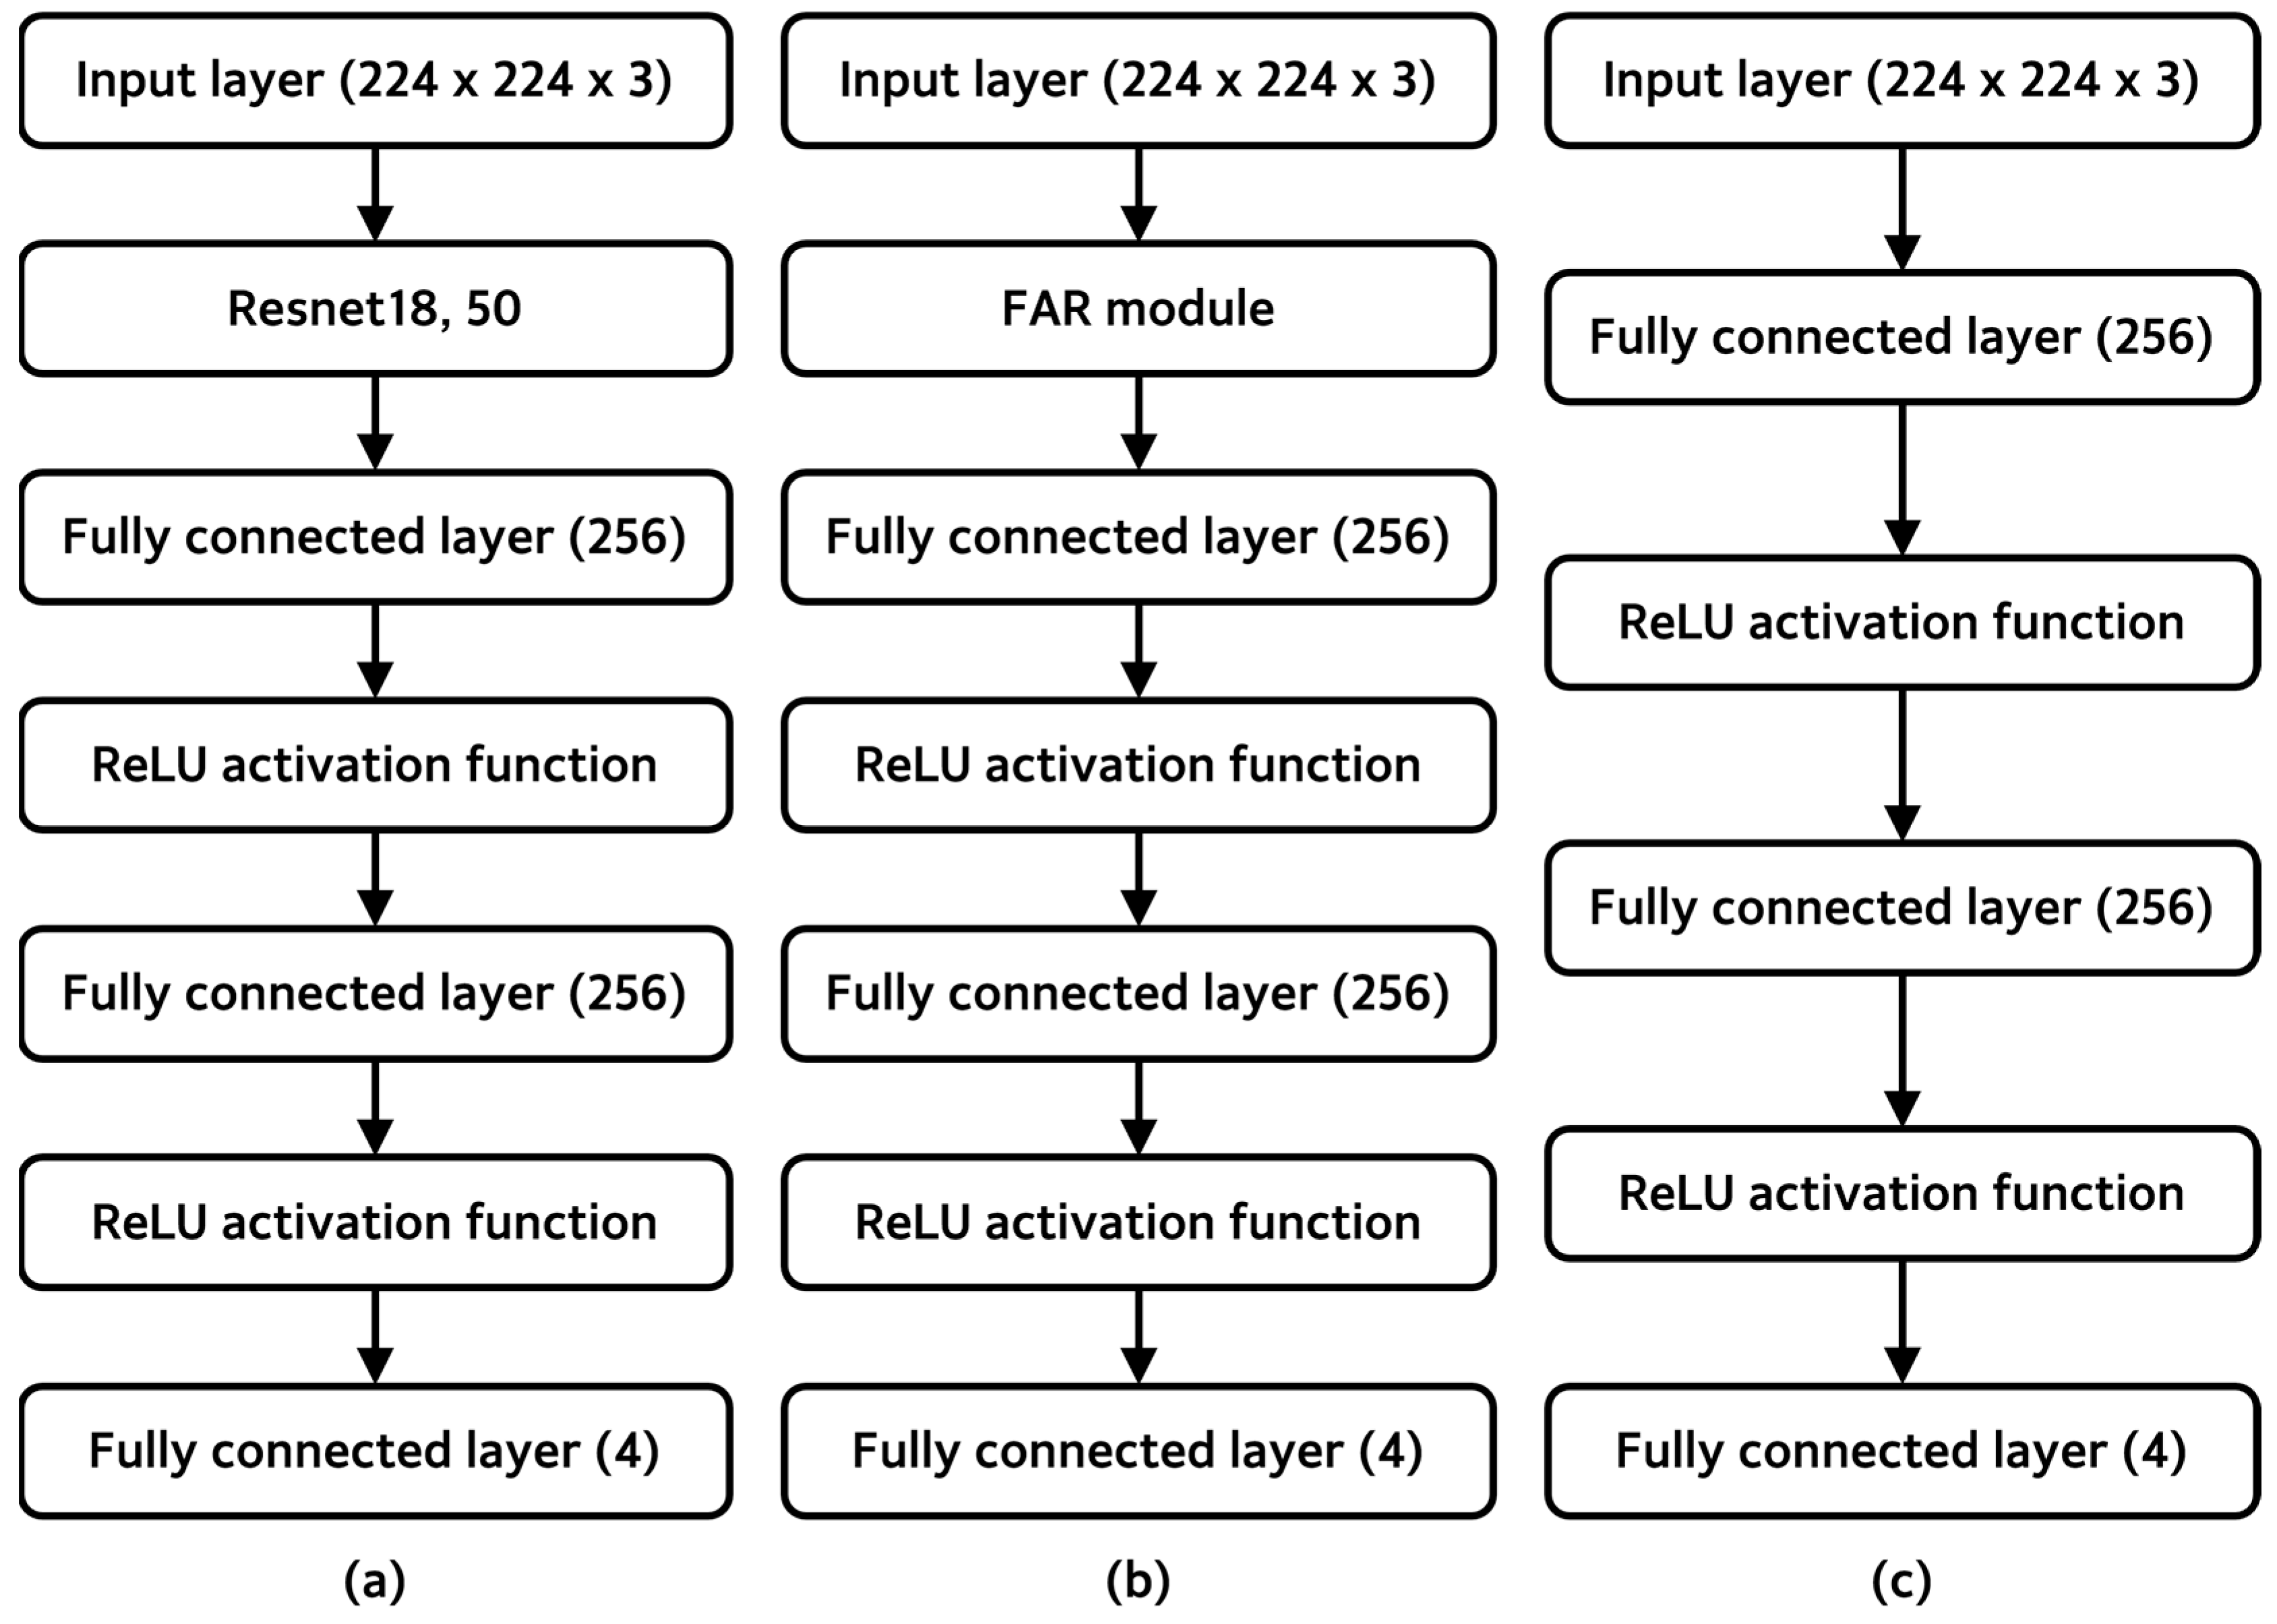
As shown in
Figure 7, we employed three models—Resnet18, Resnet50, Multi-Layer Perceptron (MLP), and FAR—to compare the effectiveness of the proposed method. To ensure fair comparison, all models used the same MLP structure for the final classification layers, allowing the evaluation to focus specifically on differences in feature extraction. Resnet18 and Resnet50 are deep CNN architectures with residual connections designed to alleviate gradient vanishing. Resnet18 contains approximately 11.3 million parameters, whereas Resnet50 contains about 24.1 million parameters, and both models were fine-tuned on our dataset for comparison. The MLP model, which processes the input image solely through fully connected layers, has the largest number of parameters at approximately 38.6 million. In contrast, FAR produces a single-channel fuzzy rule image during its rule-generation process, resulting in a significantly smaller parameter size of approximately 12.9 million.
Through repeated experiments, we evaluated model performance across different numbers of fuzzy rules, as shown in
Table 1 and
Table 2. From these results, we identified a range in which stable performance could be achieved with a minimal number of rules and used this configuration in the final experiments. Although increasing the number of rules may potentially improve performance, an excessively large rule set complicates the interpretation of the model’s reasoning process. Therefore, we selected a rule count that balances accuracy and interpretability. Accuracy is computed as overall accuracy, calculated over all test samples.
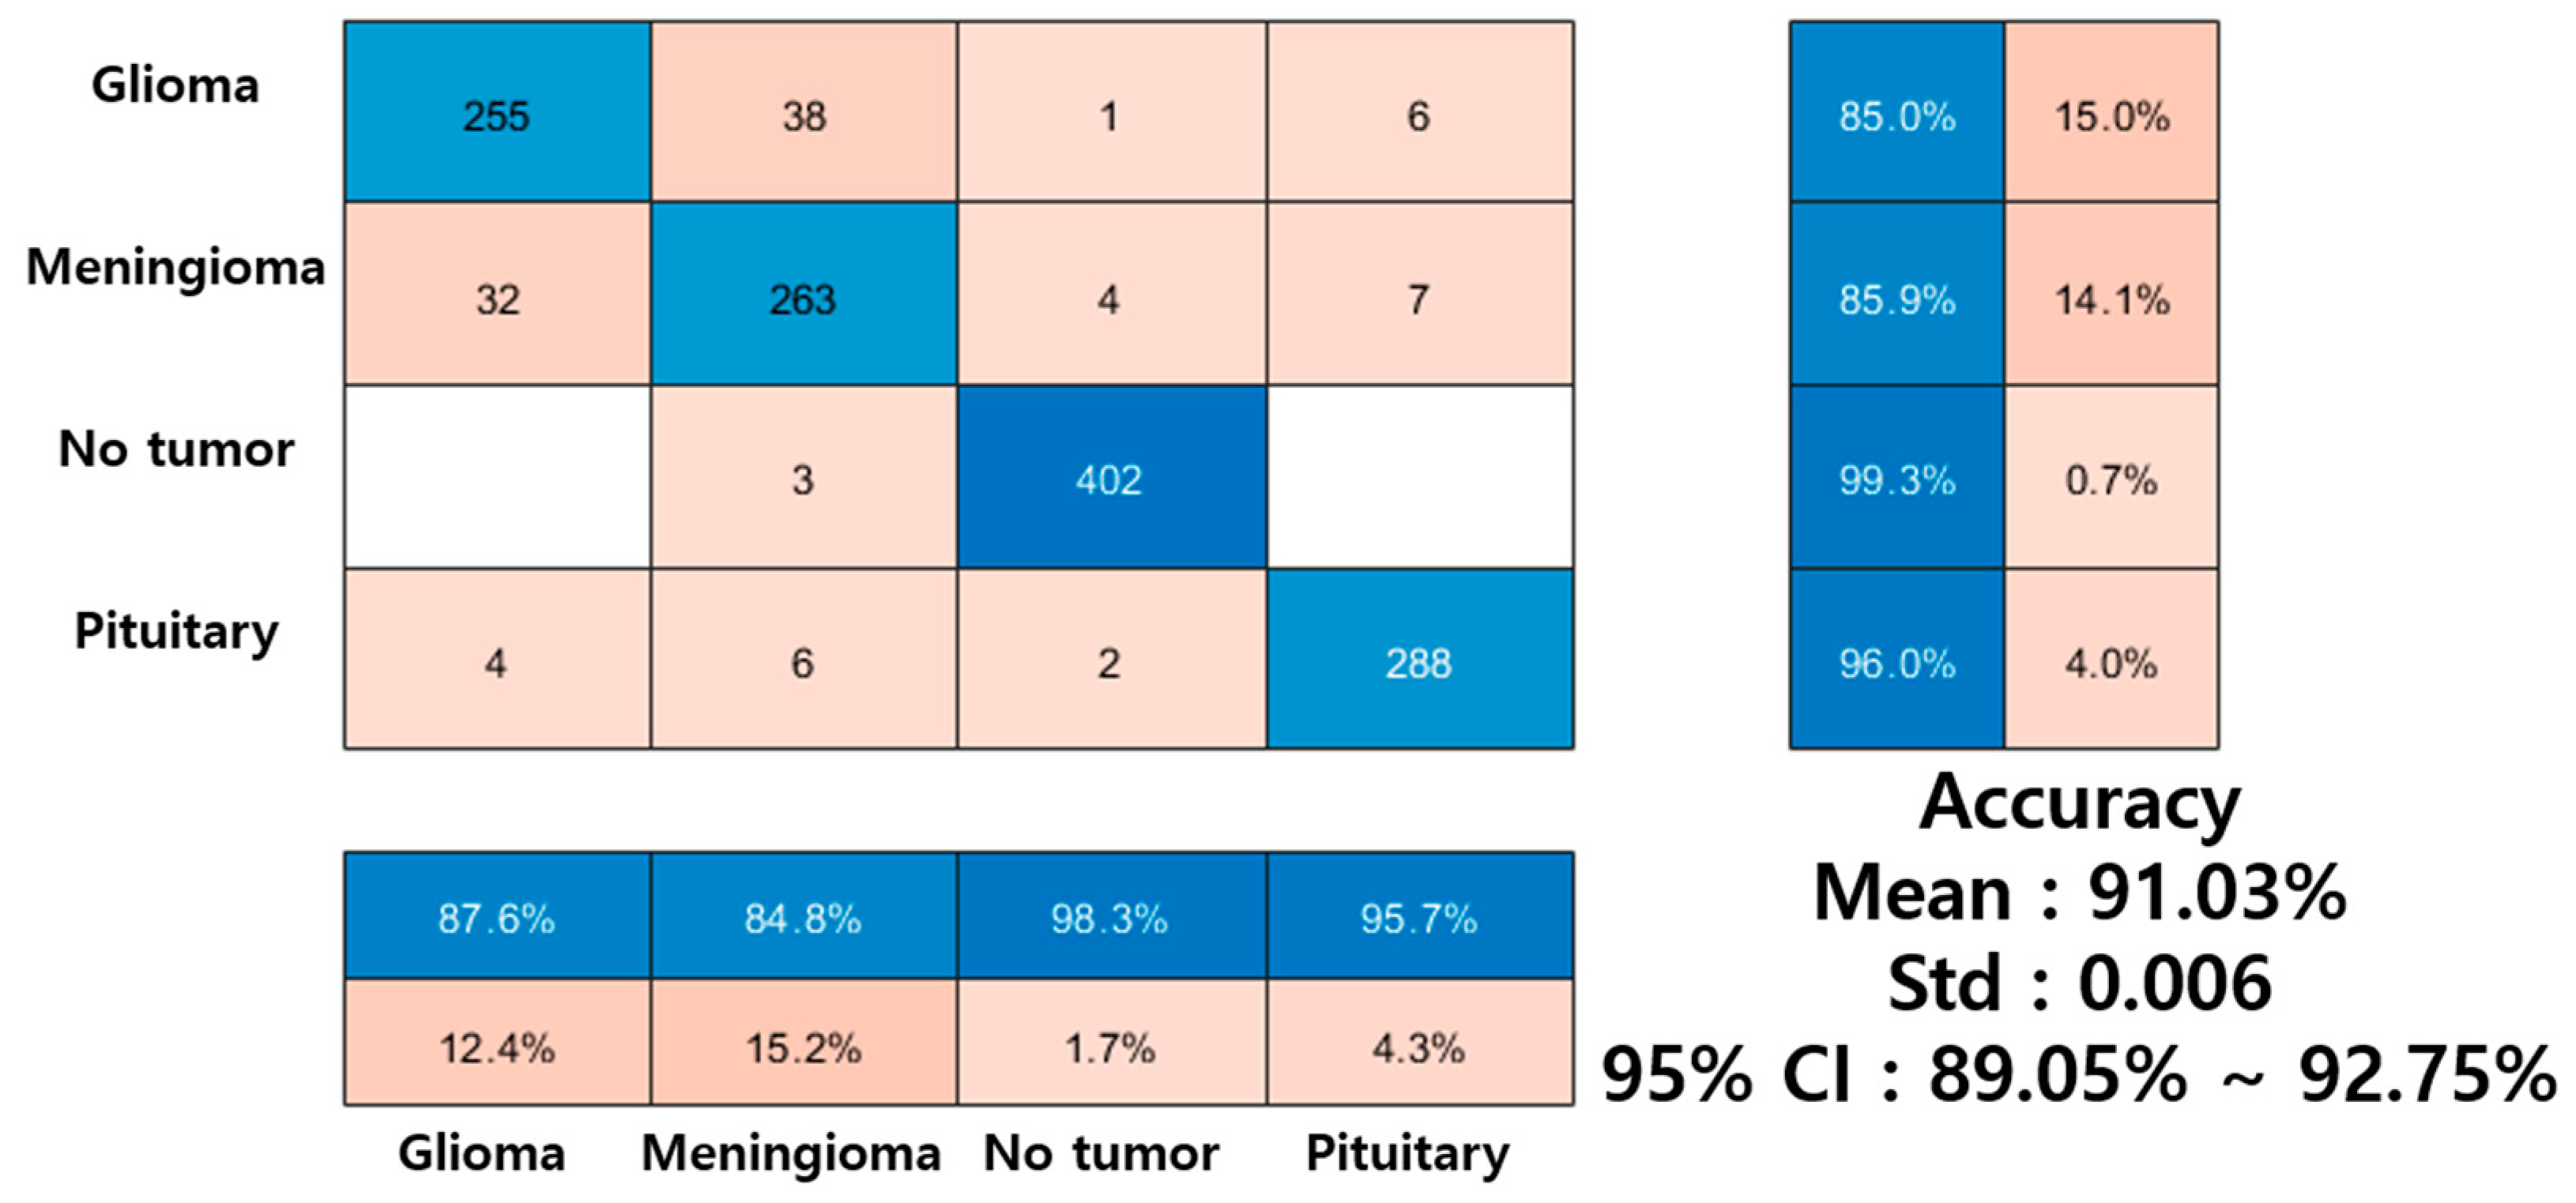
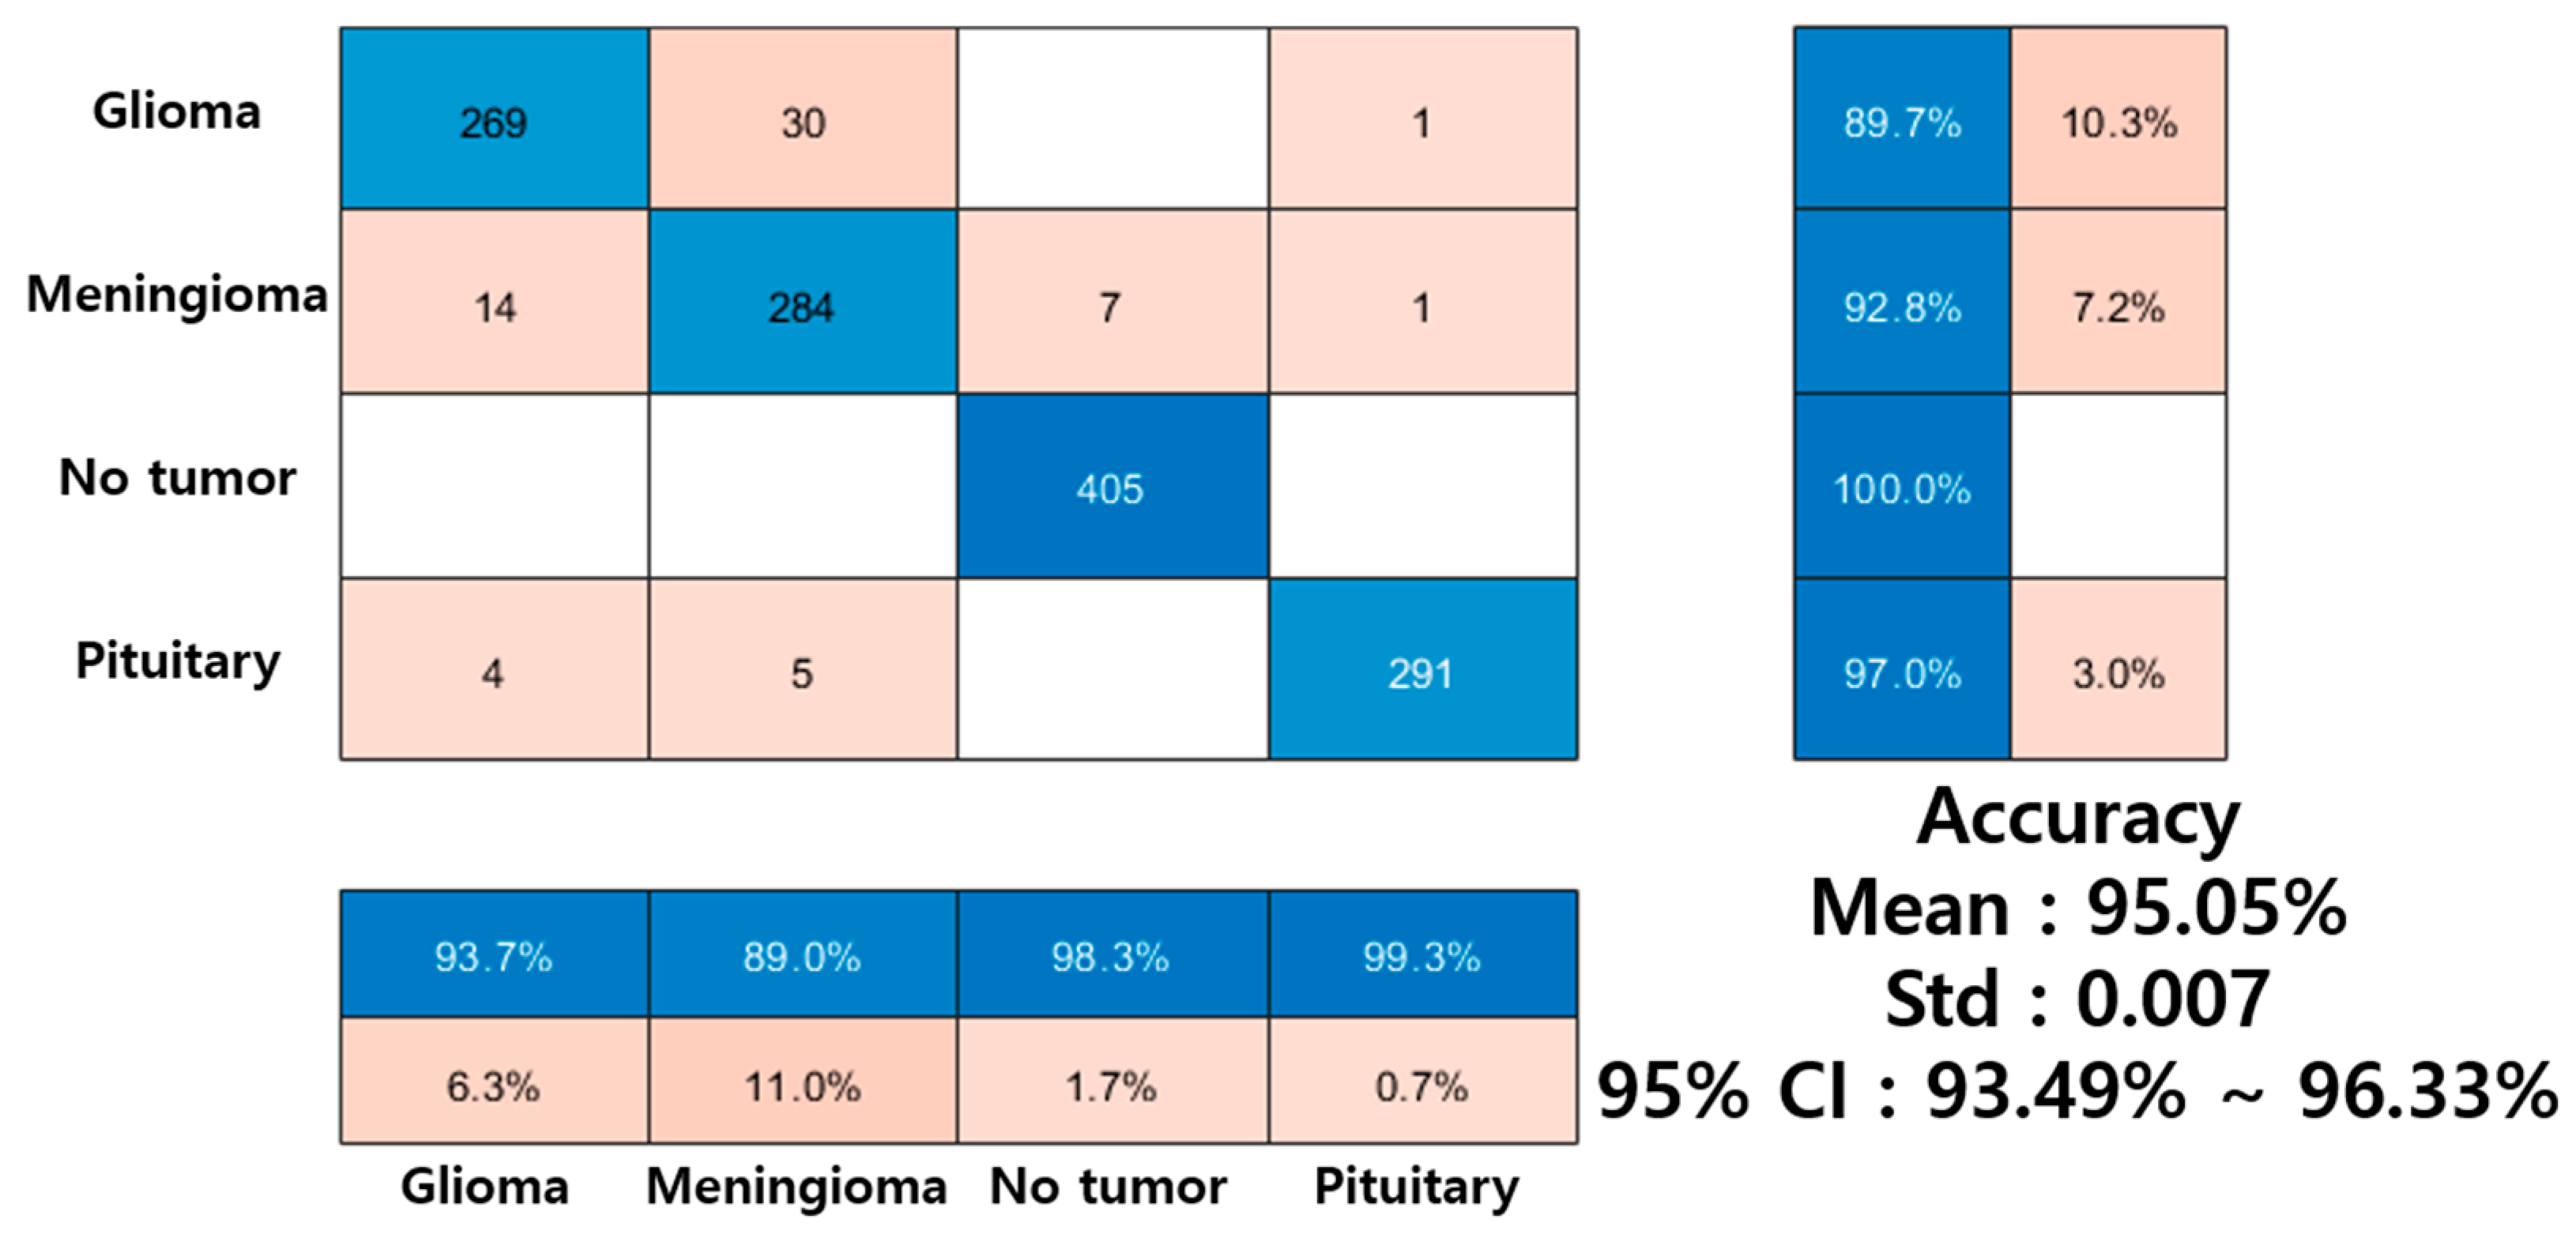
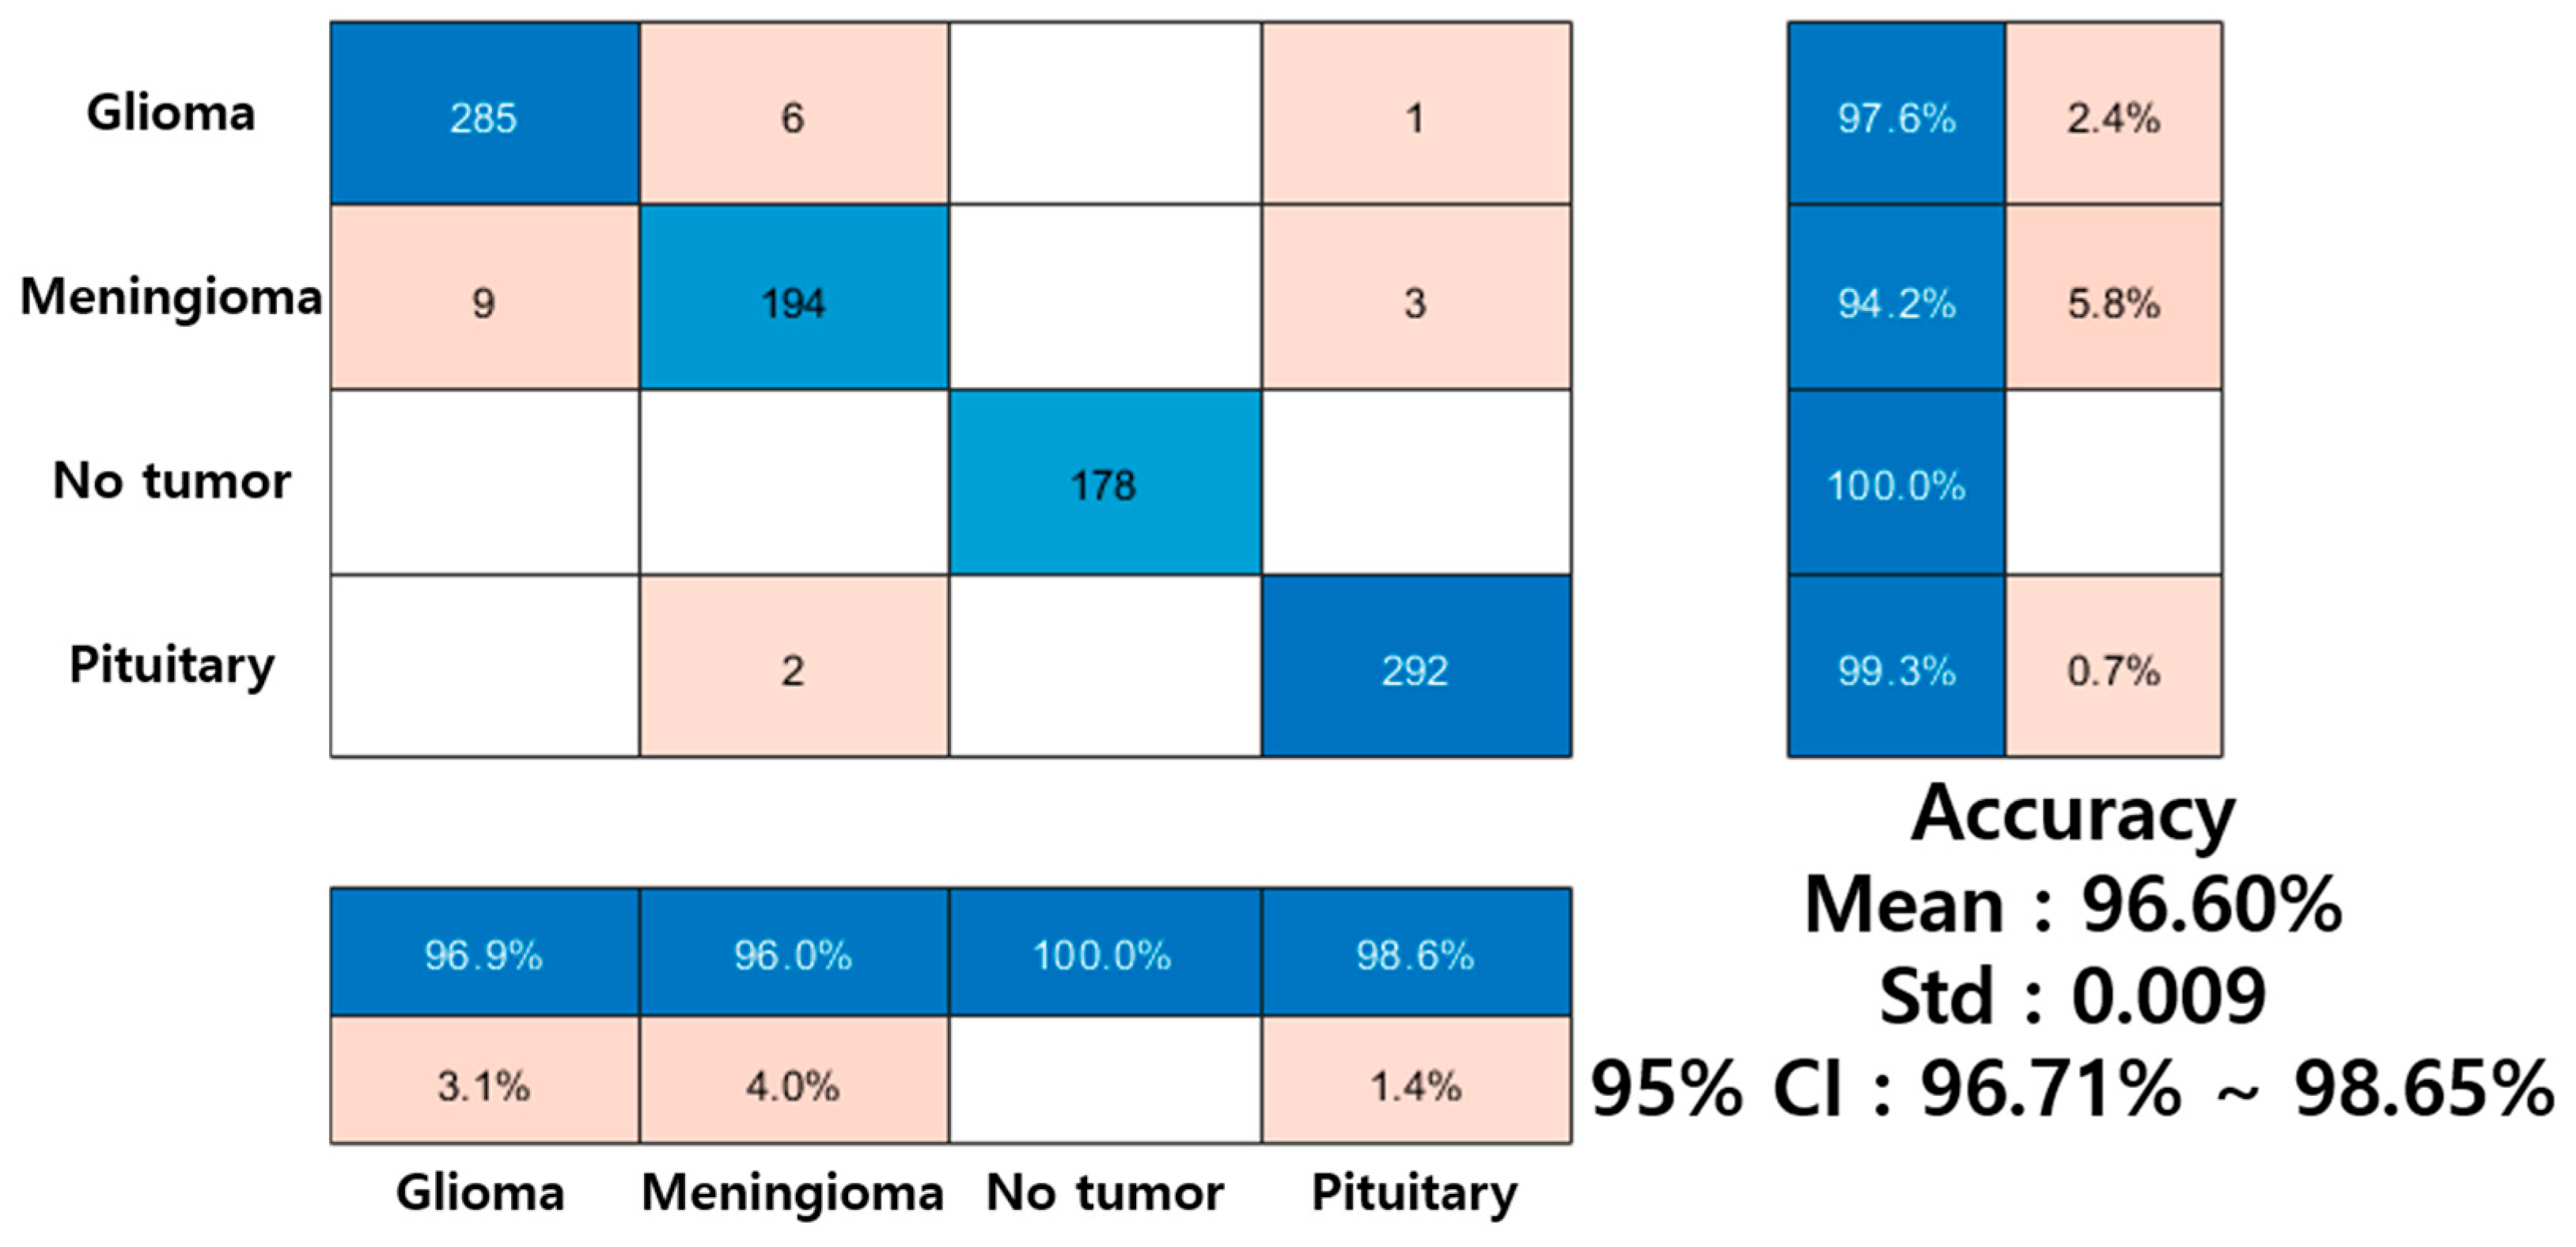
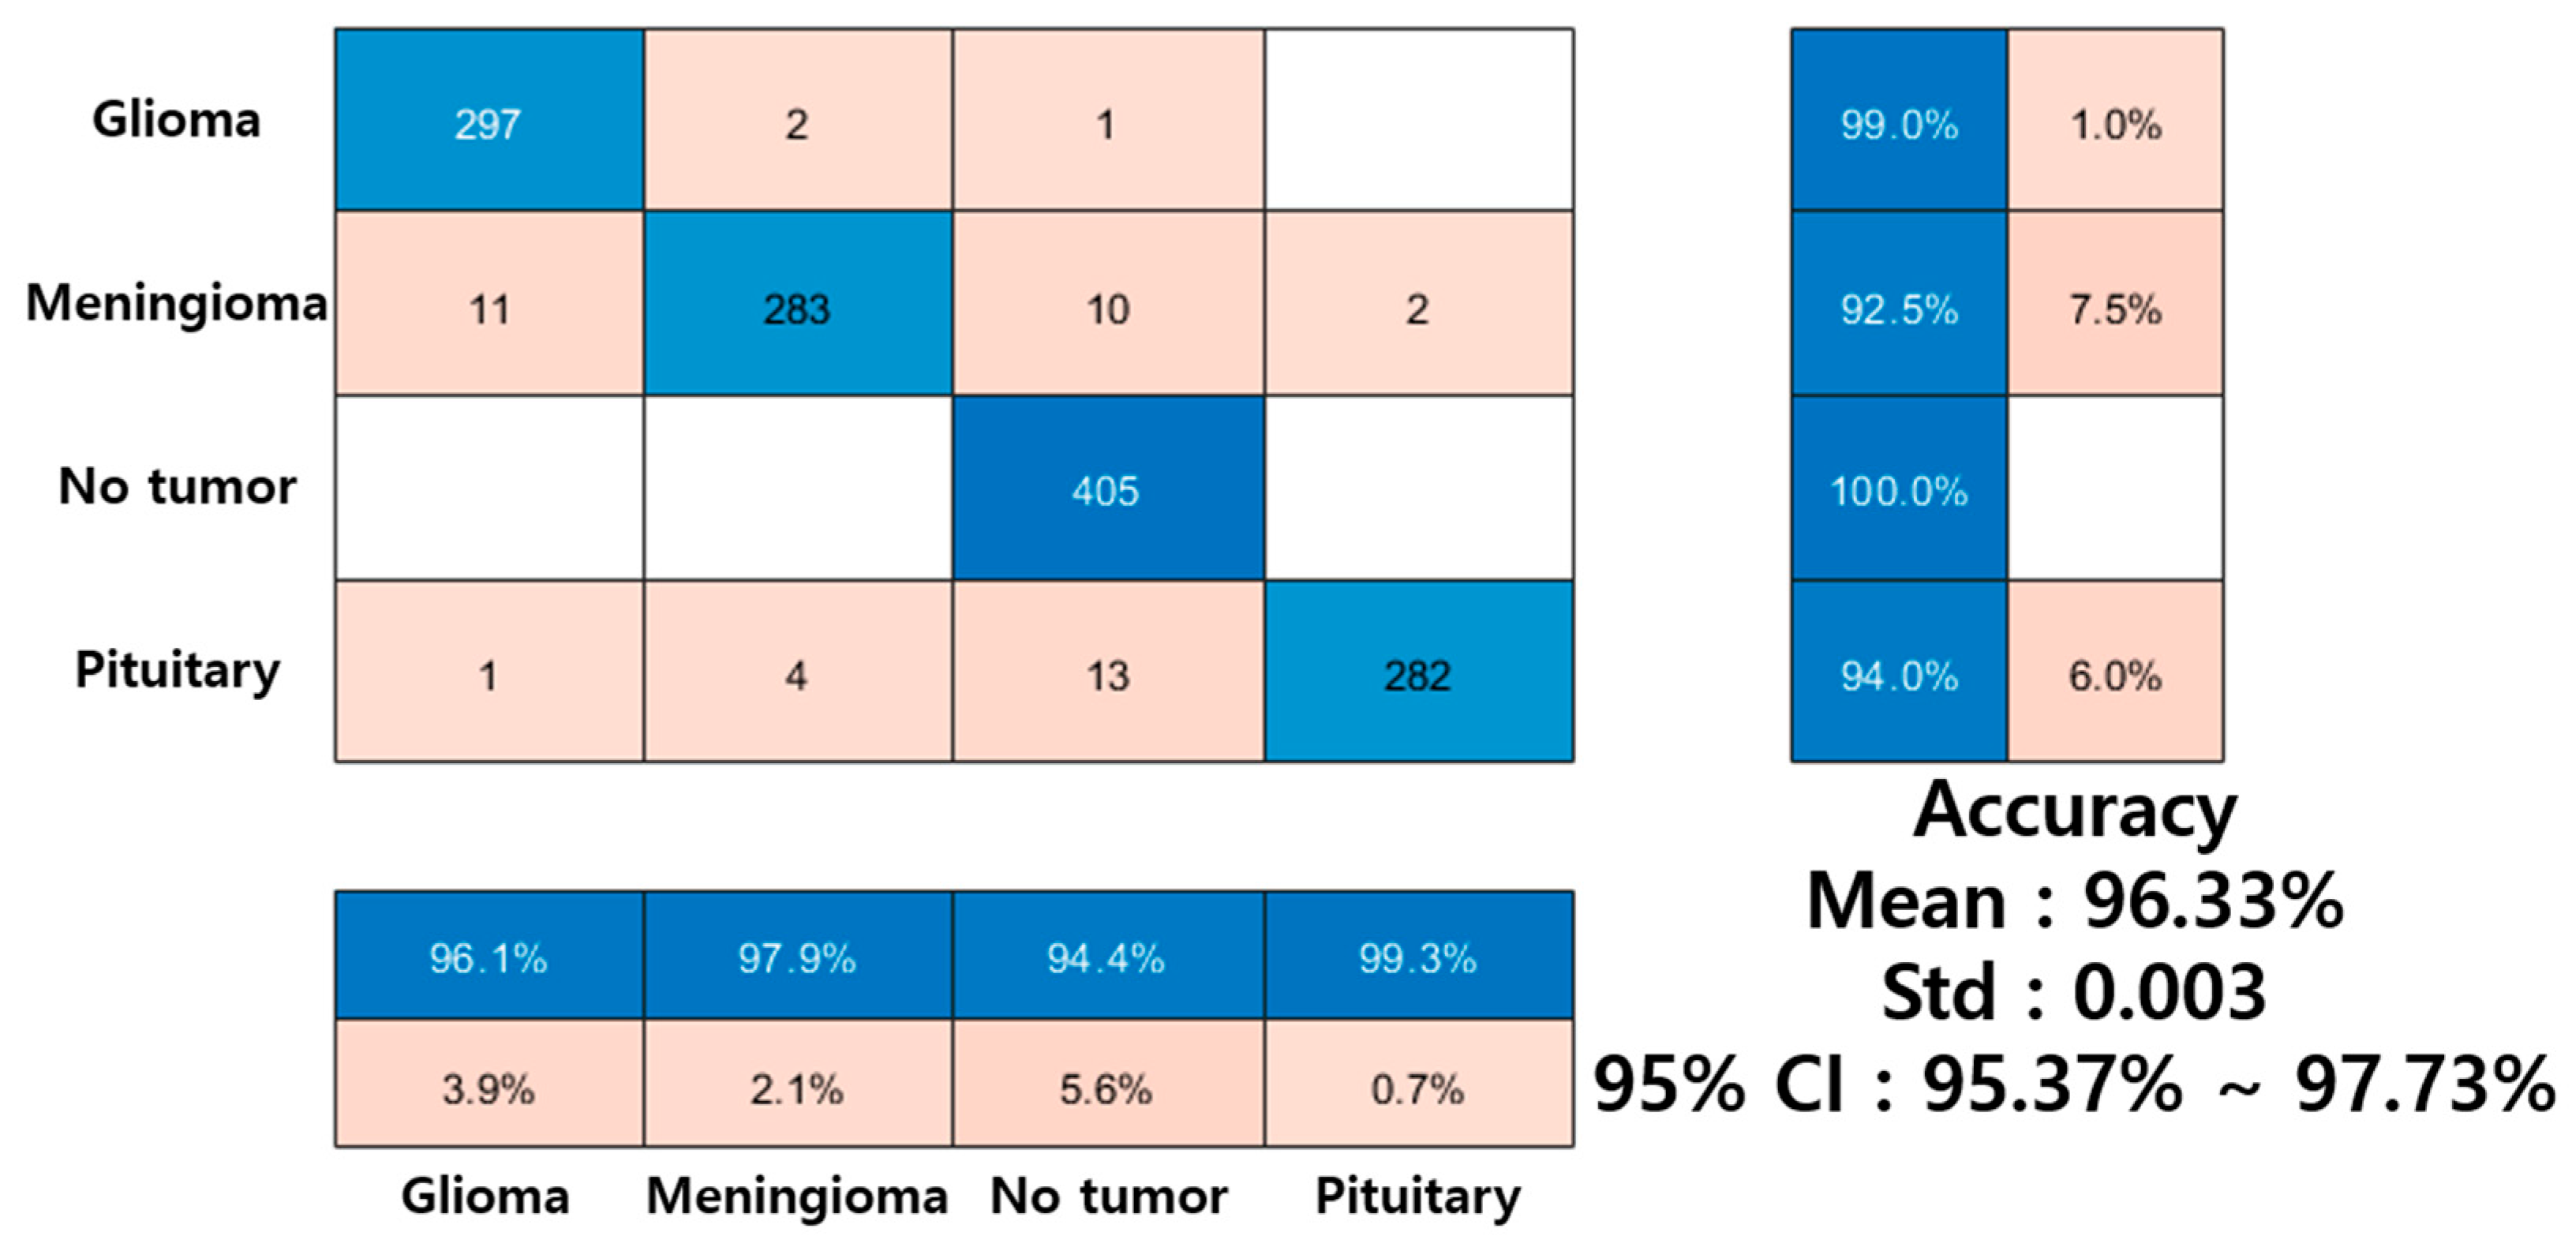
Figure 8,
Figure 9,
Figure 10 and
Figure 11 show confusion matrices comparing the classification performance of the proposed FAR model with ResNet18, ResNet50, and MLP on the brain tumor MRI dataset, along with the mean micro-averaged accuracy, standard deviation, and 95% confidence intervals. The MLP shares a similar neural network structure with the classification layer of the FAR model, allowing us to evaluate whether the fuzzy attention rules provide a learning advantage and enable explainability. The performance comparison shows that Resnet18 and Resnet50 achieve slightly higher classification accuracy than the proposed model. Notably, Resnet18 attains strong performance with even fewer parameters than FAR, indicating that deep convolutional networks remain powerful baselines from a purely performance-driven perspective. Nevertheless, the proposed FAR model demonstrates competitive accuracy while offering a shallow architecture and an explicit, rule-based inference process that provides interpretability. Furthermore, as shown in
Figure 9, the FAR model, which applies fuzzy logic to the input layer, shows higher performance and explainability compared to the MLP-based brain tumor classification. This demonstrates that our method achieves high classification performance in medical image classification while providing reliable transparency.
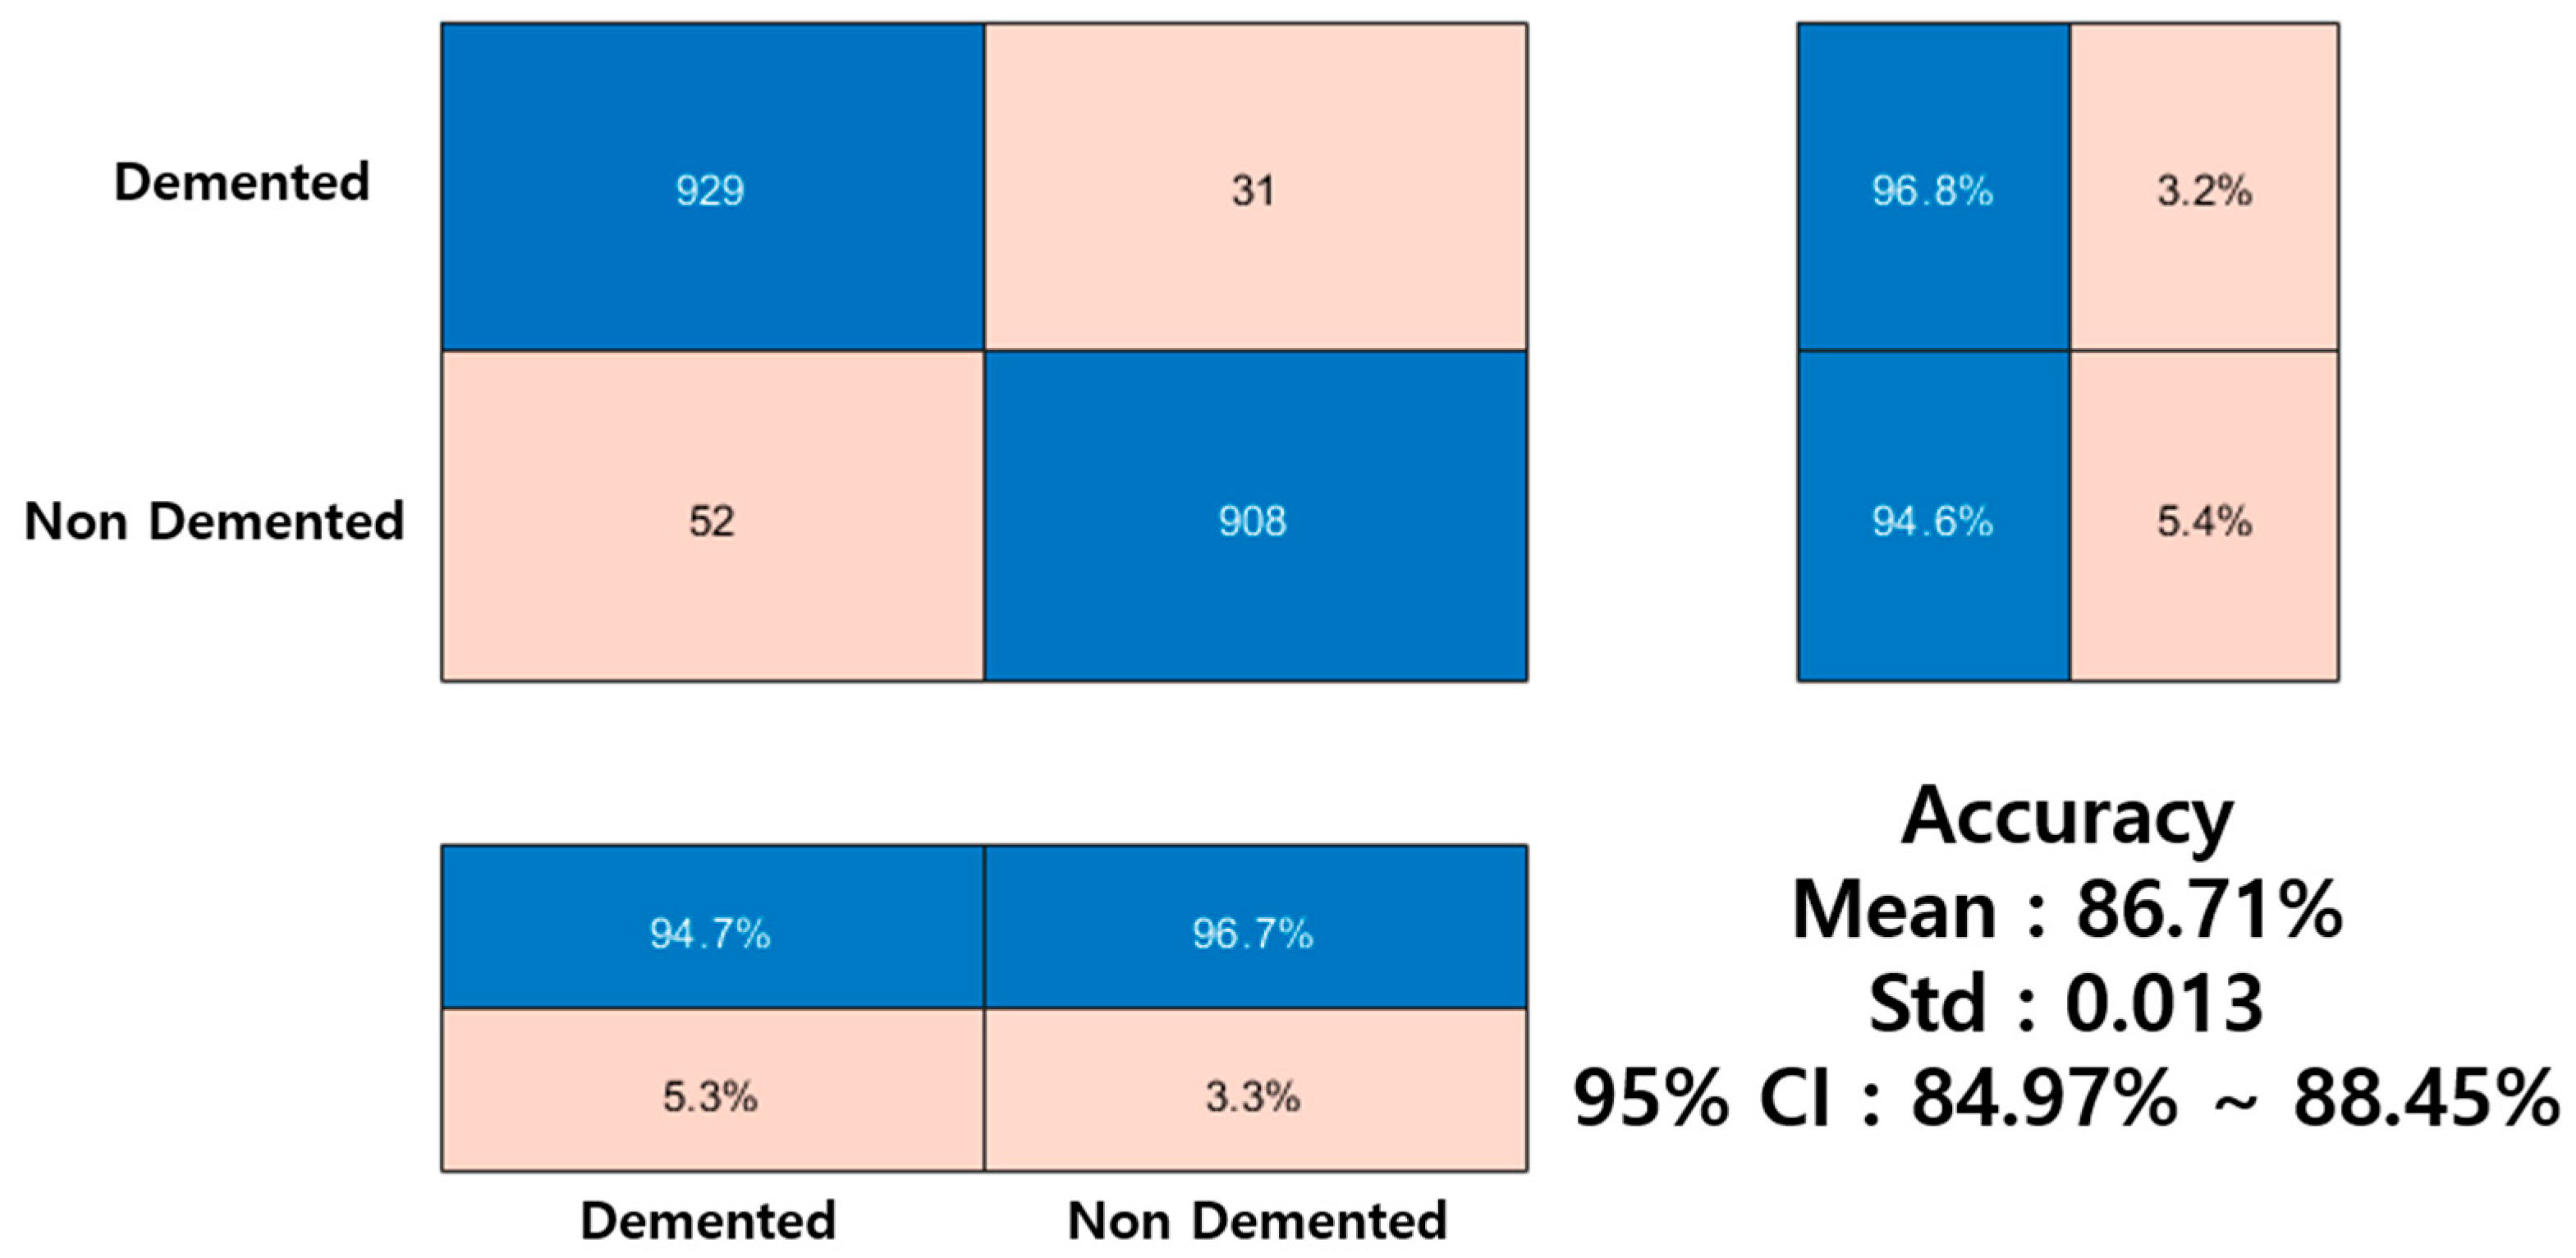
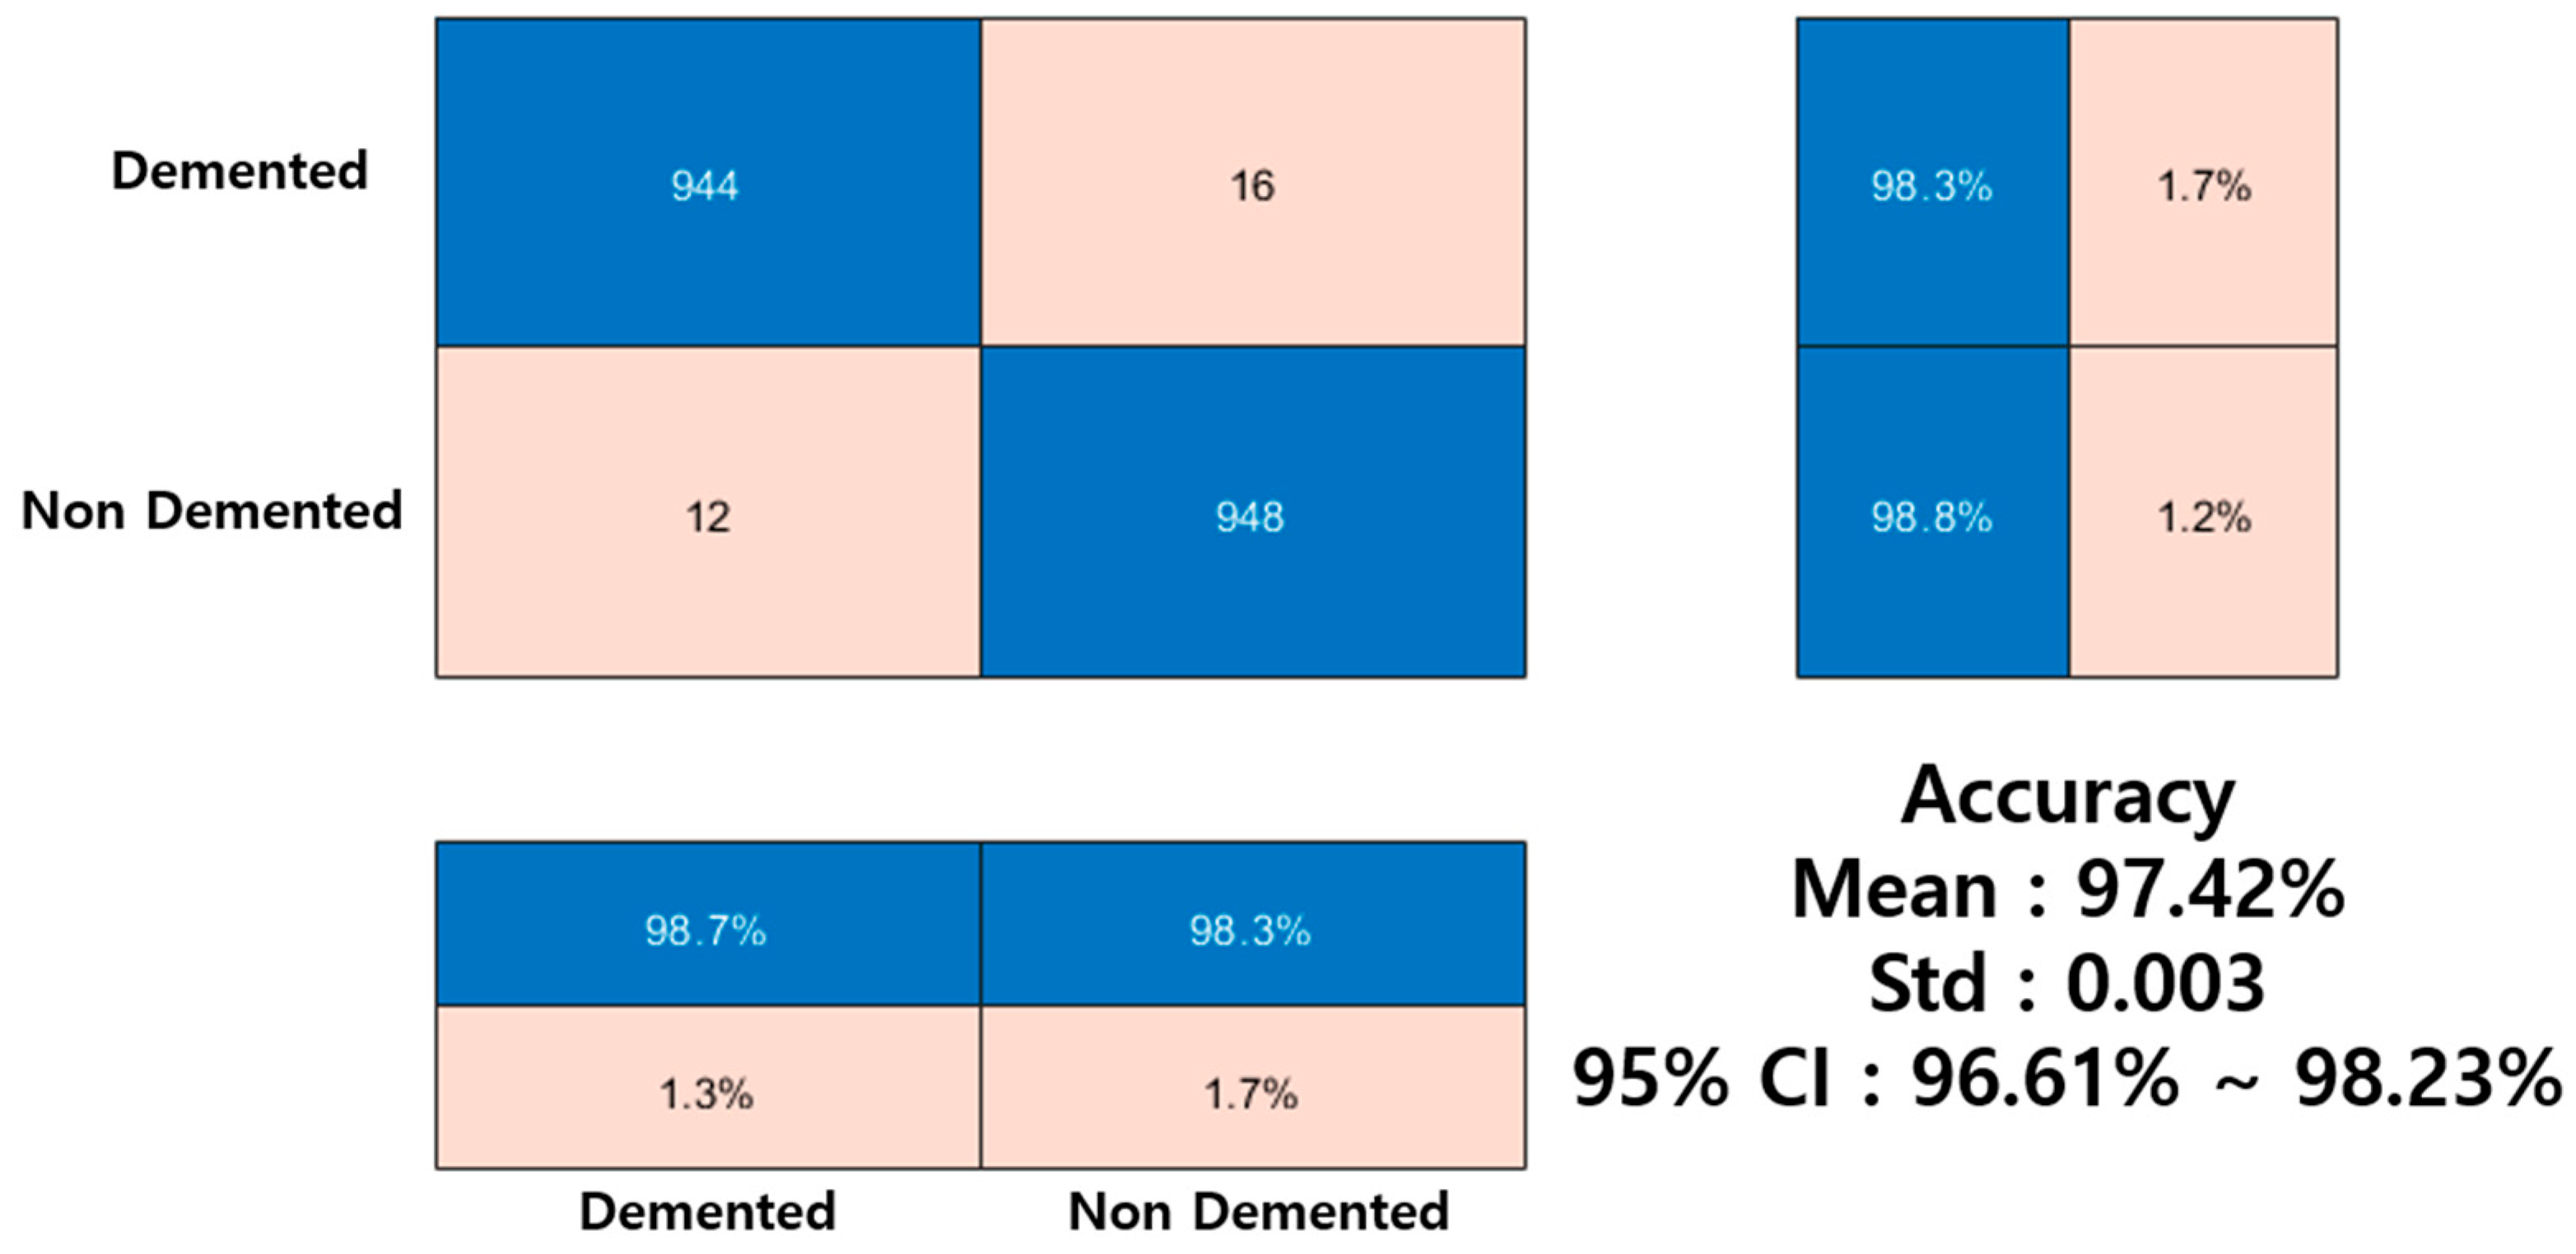
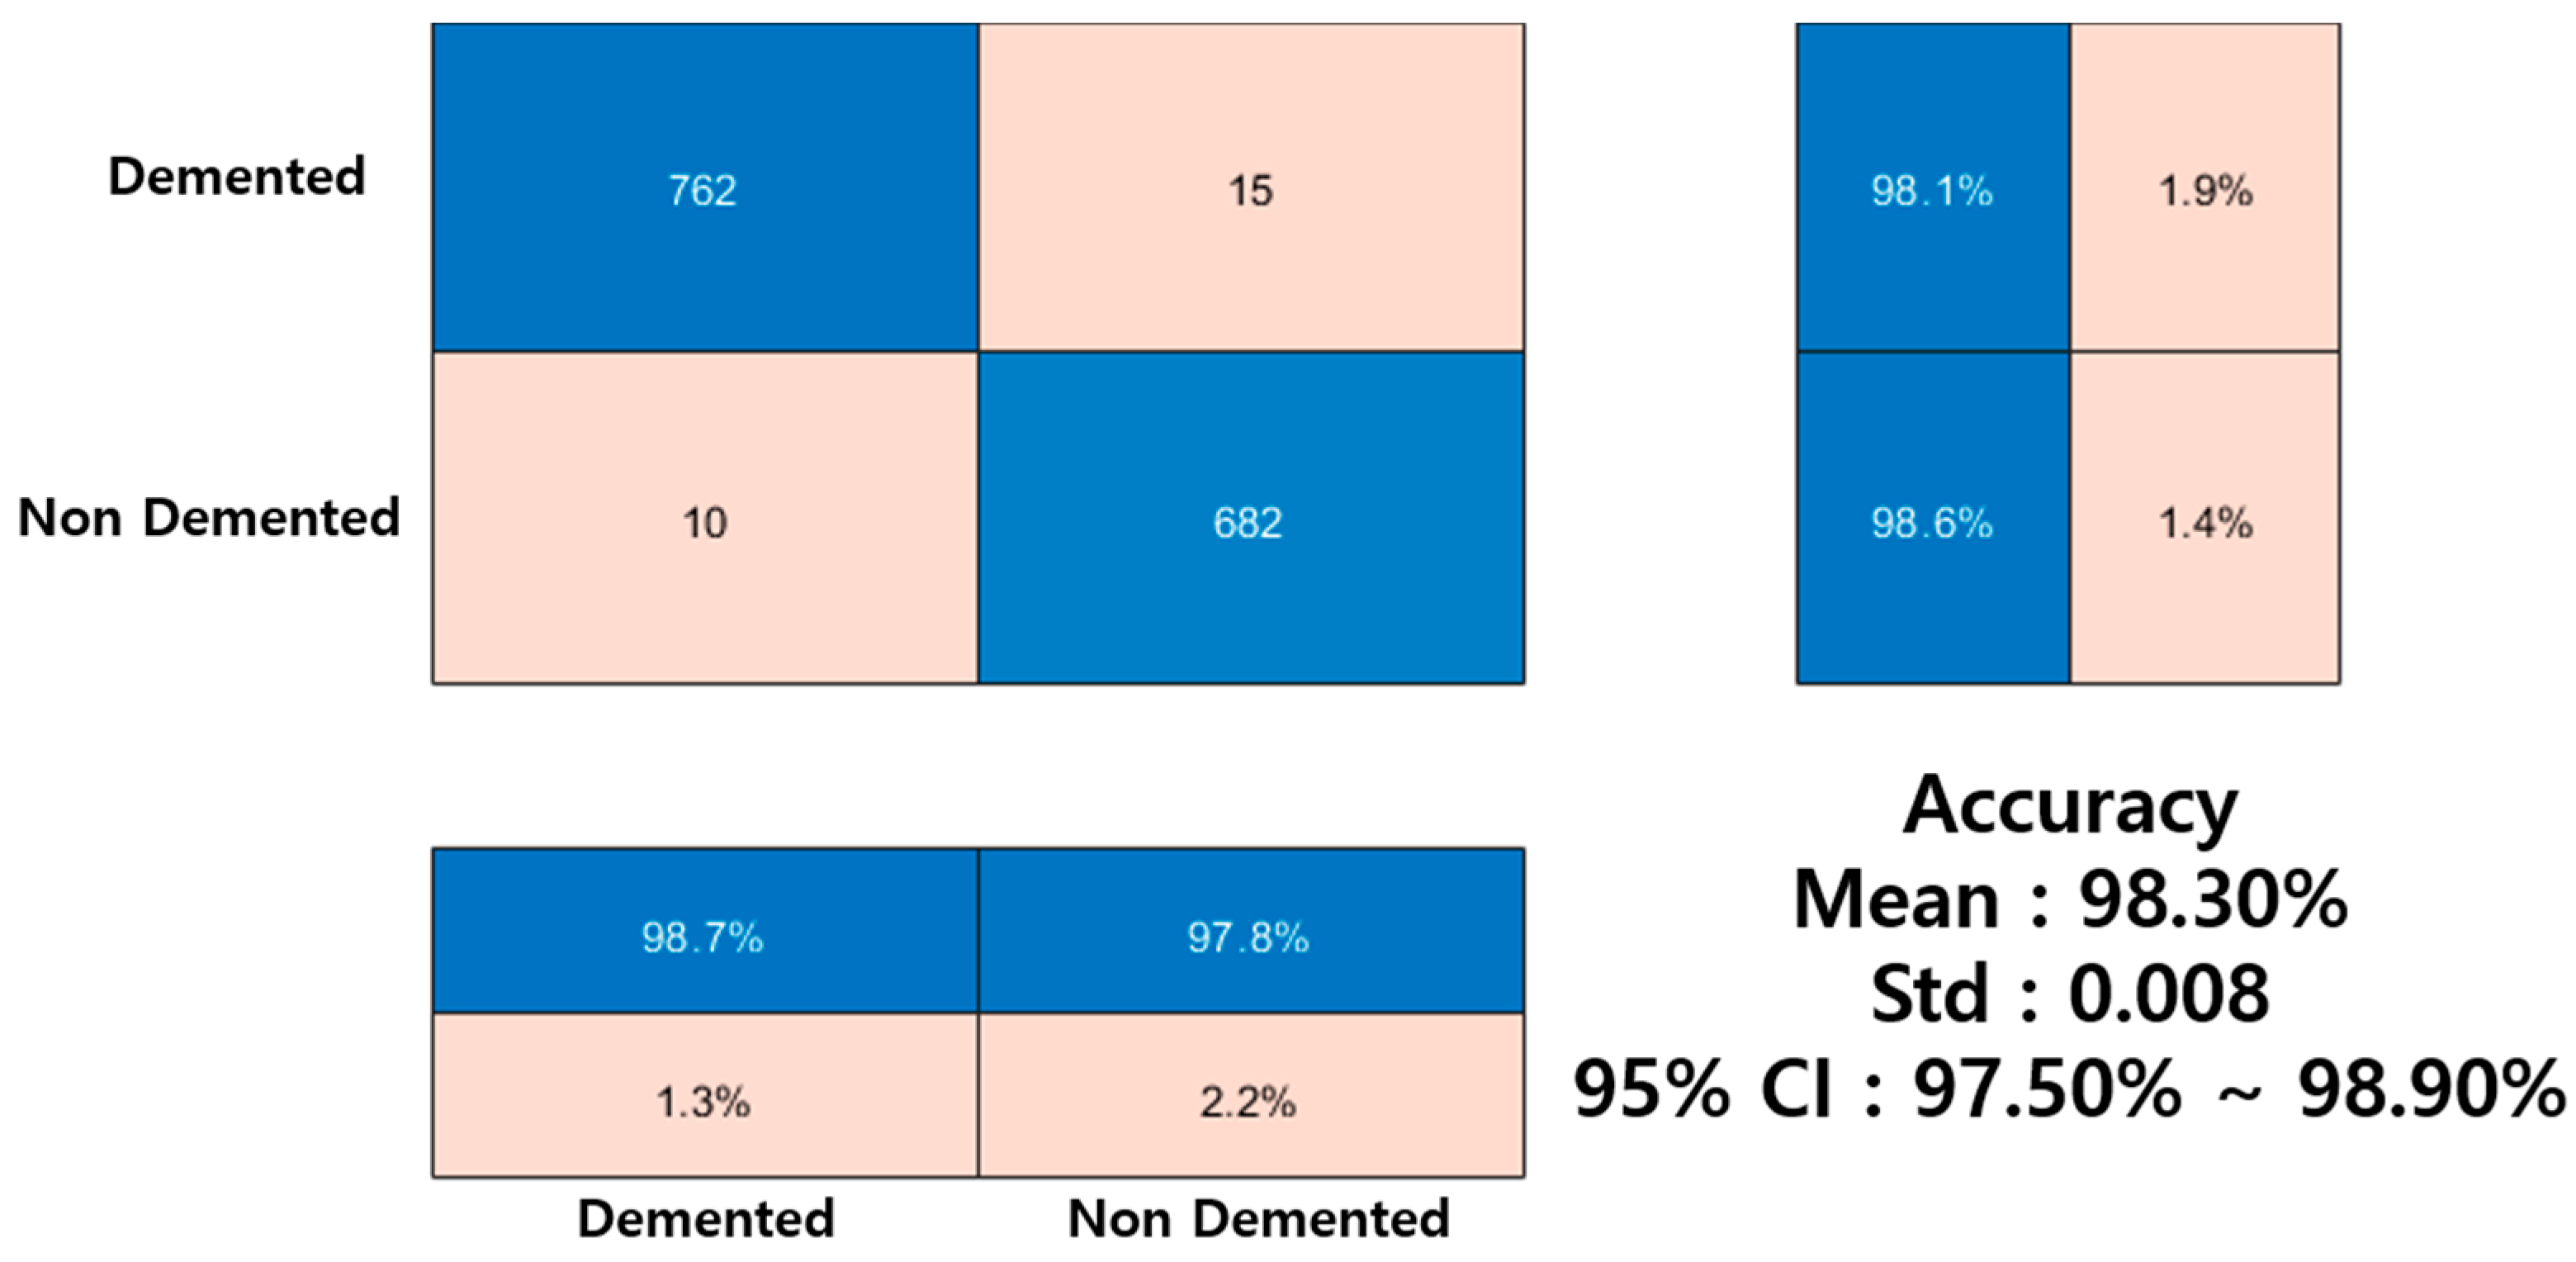
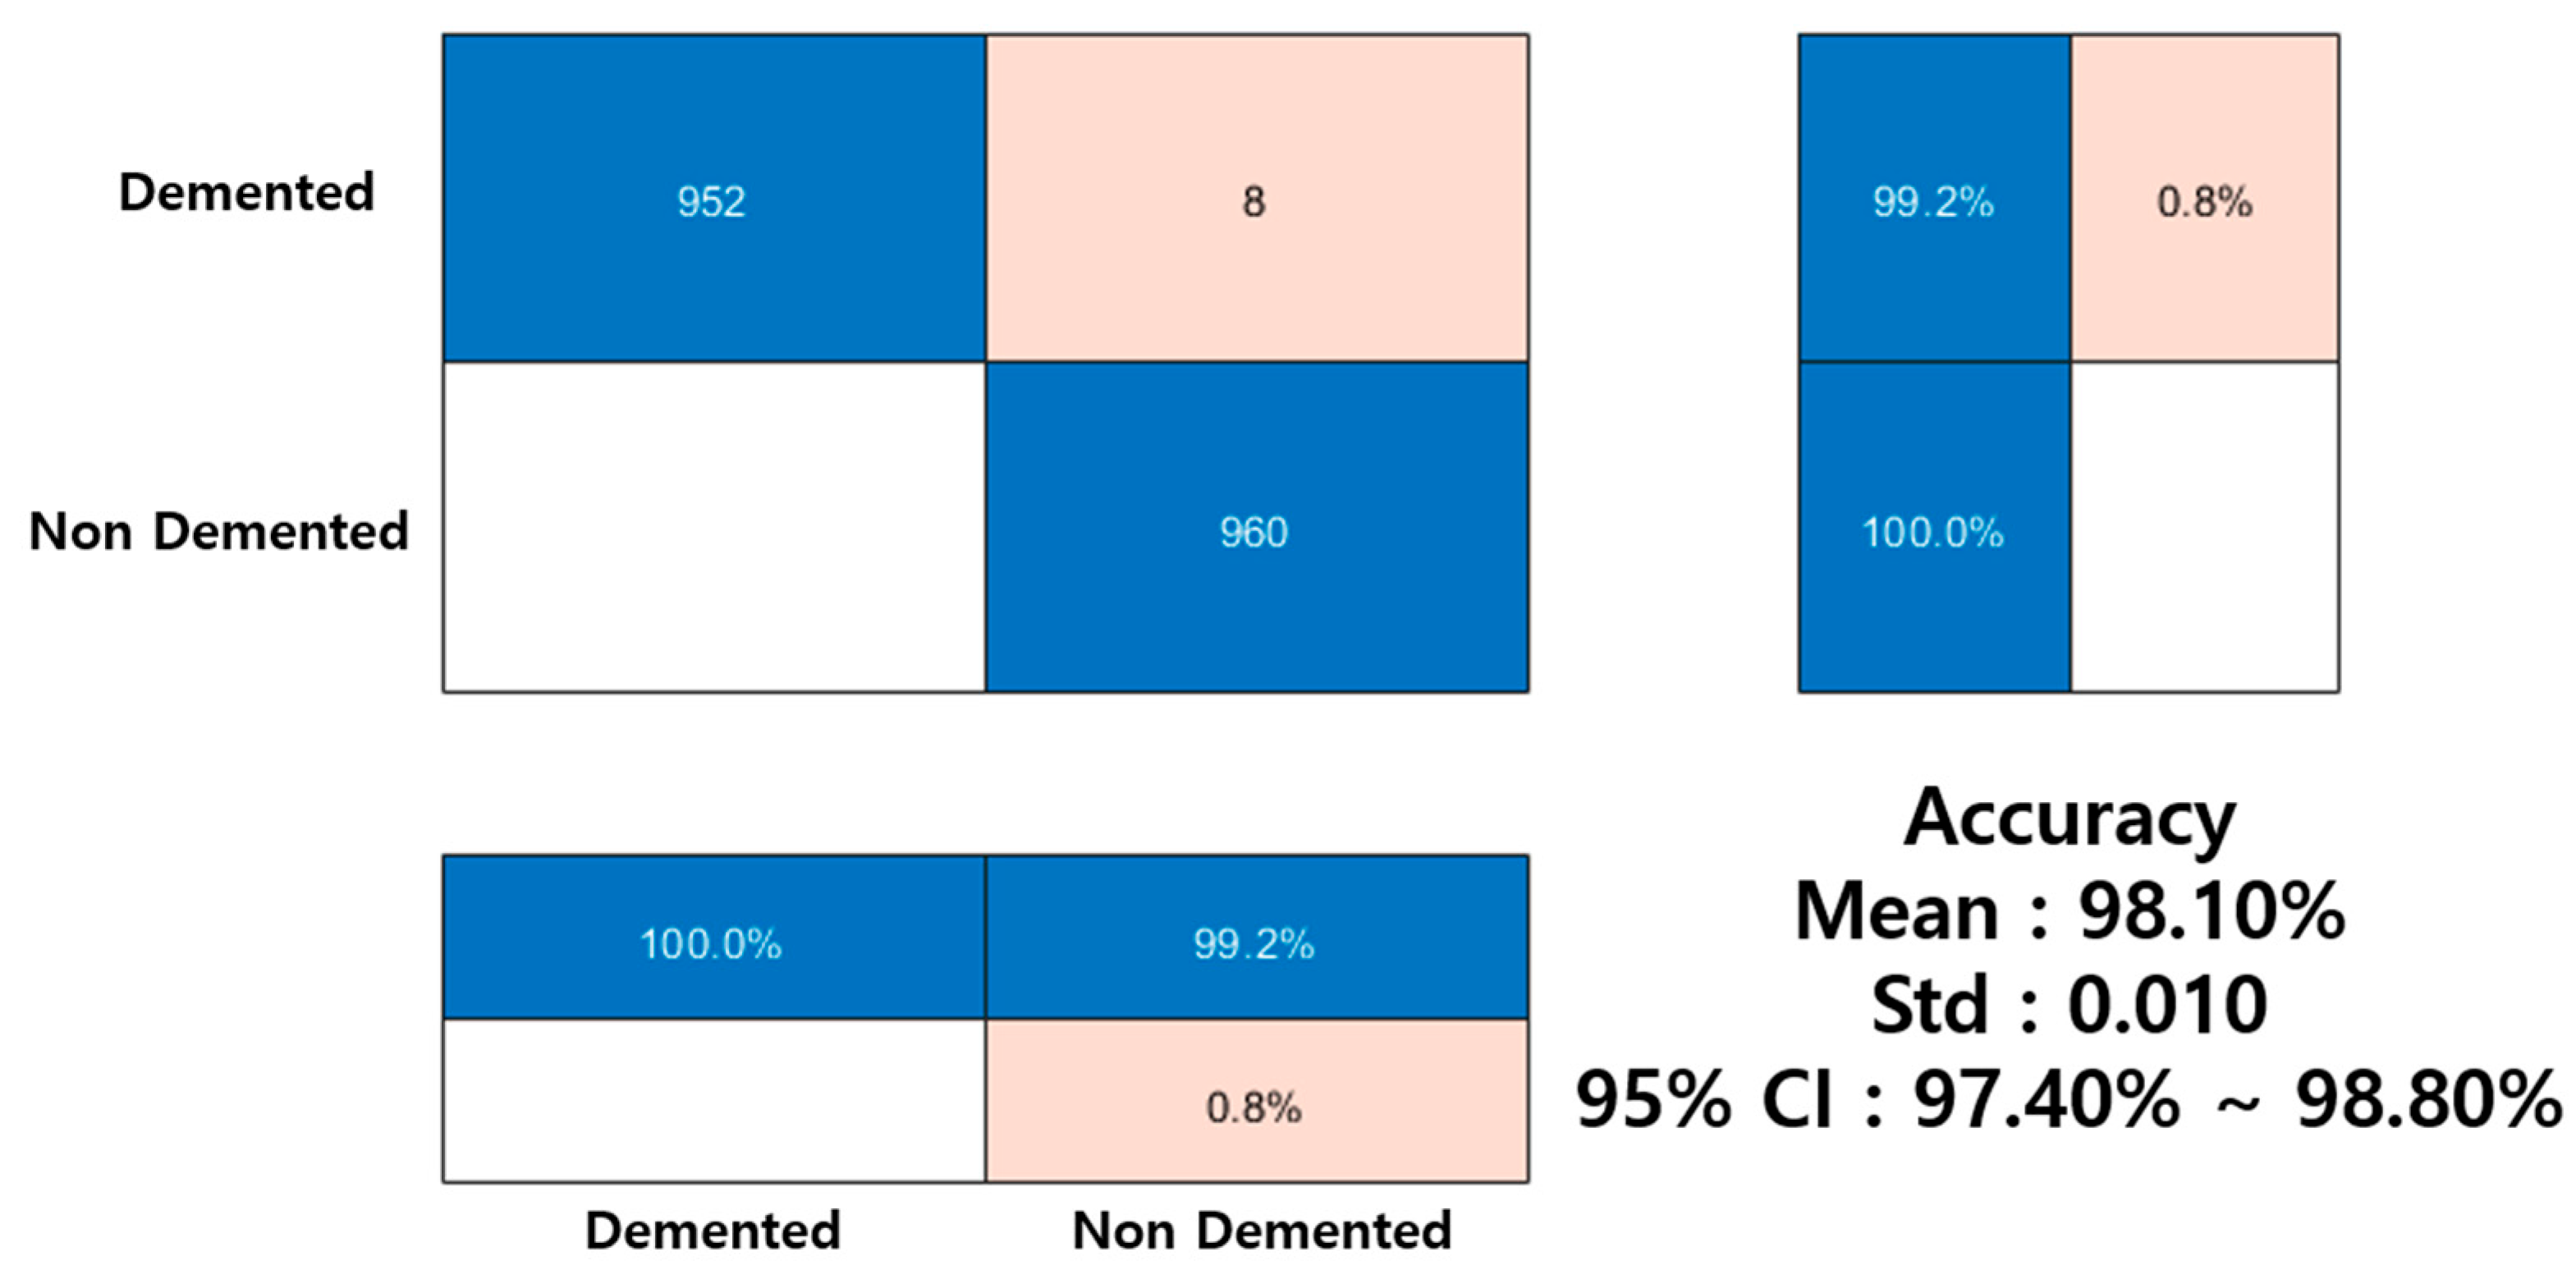
Figure 12,
Figure 13,
Figure 14 and
Figure 15 show the classification performance on the Alzheimer’s MRI images for, MLP, FAR, Resnet18, and Resnet50 models, along with the mean micro-averaged accuracy, standard deviation, and 95% confidence intervals. Resnet18, Resnet50 and FAR showed significantly higher performance than the MLP-based classification, with both models achieving nearly identical high performance. This suggests that the FAR approach of applying fuzzy logic to the input layer can stably focus on key regions, making it a viable method for enhancing explainability, which is essential in the medical field.
In evaluating the effectiveness of the proposed FAR module, our aim is not to compete with state-of-the-art medical image classifiers, but rather to determine whether fuzzy rule reasoning can maintain or improve performance while providing interpretable rule maps. Accordingly, MLP was selected as a lightweight comparator, allowing us to assess whether the FAR module—consisting of only ~65 trainable parameters—can still contribute meaningfully to performance and interpretability. Notably, FAR not only improved accuracy and localization quality but also reduced the overall parameter count. Resnet18 and Resnet50 were included as CNN baselines to evaluate the feature-extraction capability and efficiency of FAR relative to commonly used convolutional architectures. Our experiments show that FAR provides shorter training time and substantially enhanced interpretability. However, we also observed that CNN models with sufficient dimensionality reduction can achieve higher accuracy with even fewer parameters than FAR. These findings suggest that FAR may serve as an interpretable alternative or complementary module to CNNs by providing rule-based reasoning while maintaining a lightweight parameter footprint.
3.2. Quantitative Comparison of Fuzzy Rule-Based Visualization and Lesion Localization
In this study, we first examined the effect of the proposed FAR module on classification performance using MRI data. The comparison with an MLP baseline confirmed that FAR contributes to performance improvement while maintaining a lightweight architecture. Although Resnet18 and Resnet50 achieved higher overall classification accuracy—primarily due to their strong convolutional feature extraction and larger representational capacity—this does not guarantee that they attend to clinically meaningful lesion regions. CNN models often focus on background textures or irrelevant structures despite their high accuracy. To evaluate whether FAR provides more medically meaningful attention, we conducted an additional quantitative and qualitative analysis by comparing the ground-truth lesion masks with two interpretability approaches: Grad-CAM heatmaps generated from Resnet models and the rule-based attention maps produced by the proposed FAR method. The interpretability comparison focuses on contrasting CNN-based saliency maps with fuzzy rule-based attention maps, rather than comparing different CNN backbones. Therefore, ResNet50 was selected as a representative high-capacity CNN for Grad-CAM analysis.
Table 3 summarizes the quantitative evaluation across three classes using five standard metrics. Although the Resnet50 achieved higher classification performance, the FAR-based heatmaps consistently outperformed Grad-CAM across all metrics. This indicates that the fuzzy-based visualization provides clearer lesion localization and stronger spatial consistency. Global accuracy represents the proportion of correctly classified pixels out of all pixels and reflects the overall segmentation performance. Mean accuracy is obtained by averaging the per-class accuracies and therefore mitigates the effect of class imbalance, providing a more balanced evaluation. Mean IoU (Intersection over Union) is computed by averaging the IoU values across all classes, where IoU is defined as the ratio between the intersection and the union of the predicted and ground-truth regions. Weighted IoU is calculated by weighting each class-specific IoU by its pixel count, thereby reflecting the overall prediction quality. Mean BFScore denotes the average boundary F1-score across classes and evaluates how well the predicted boundaries align with the true lesion boundaries. In this study, Grad-CAM was generated by selecting the last convolutional layer before the final classification stage as the target layer, using the Softmax output as the reference signal. To restore the feature maps to the original image resolution, standard bilinear interpolation was applied. For images with available lesion masks, both Grad-CAM and FAR-based heatmaps were normalized to the range of 0–1 and binarized using Otsu’s threshold, after which the resulting masks were quantitatively compared with the ground-truth annotations.
In contrast, Grad-CAM tended to produce diffuse activation maps over broad background regions, resulting in relatively lower localization accuracy. Nevertheless, these results do not necessarily imply that Grad-CAM incorrectly represents the decision process of the Resnet50. Since Grad-CAM relies on the gradient information of the output layer, it mainly reflects the overall classification direction rather than precise spatial correspondence of the lesion areas. Therefore, although the proposed fuzzy-based approach may exhibit slightly lower classification performance, it demonstrates superior capability in identifying lesion regions accurately, highlighting its potential as a medically interpretable diagnostic aid.
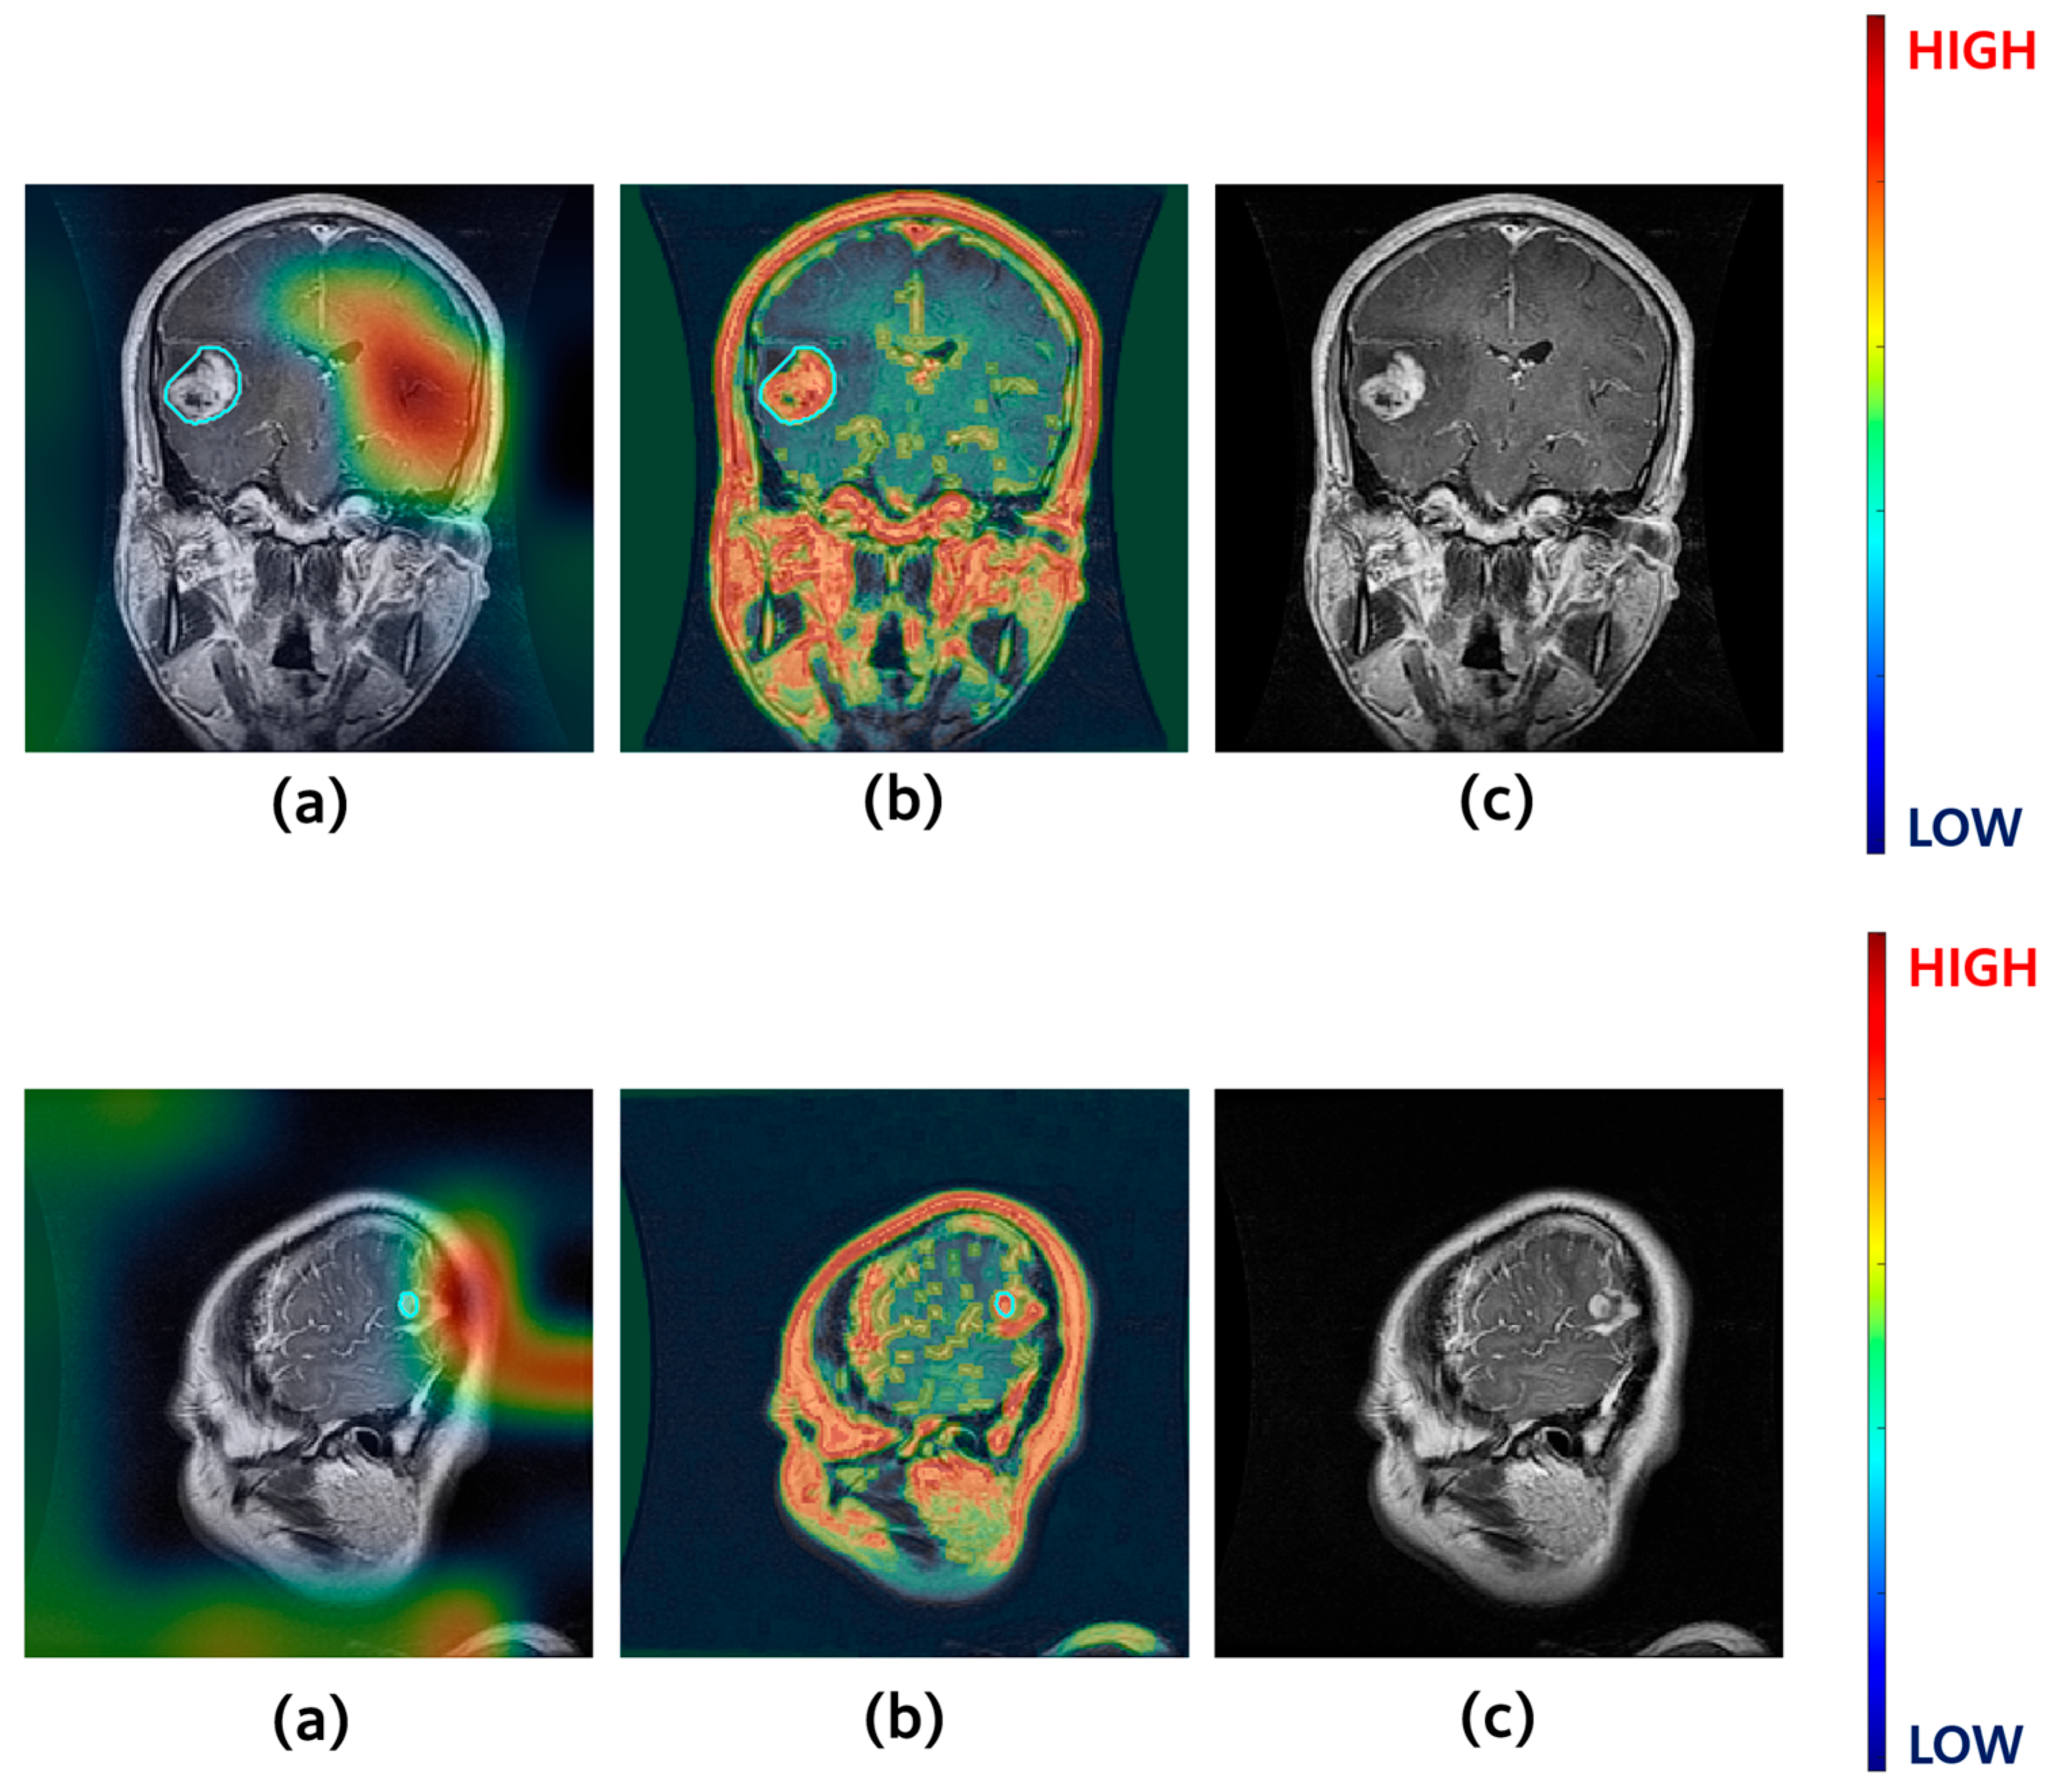
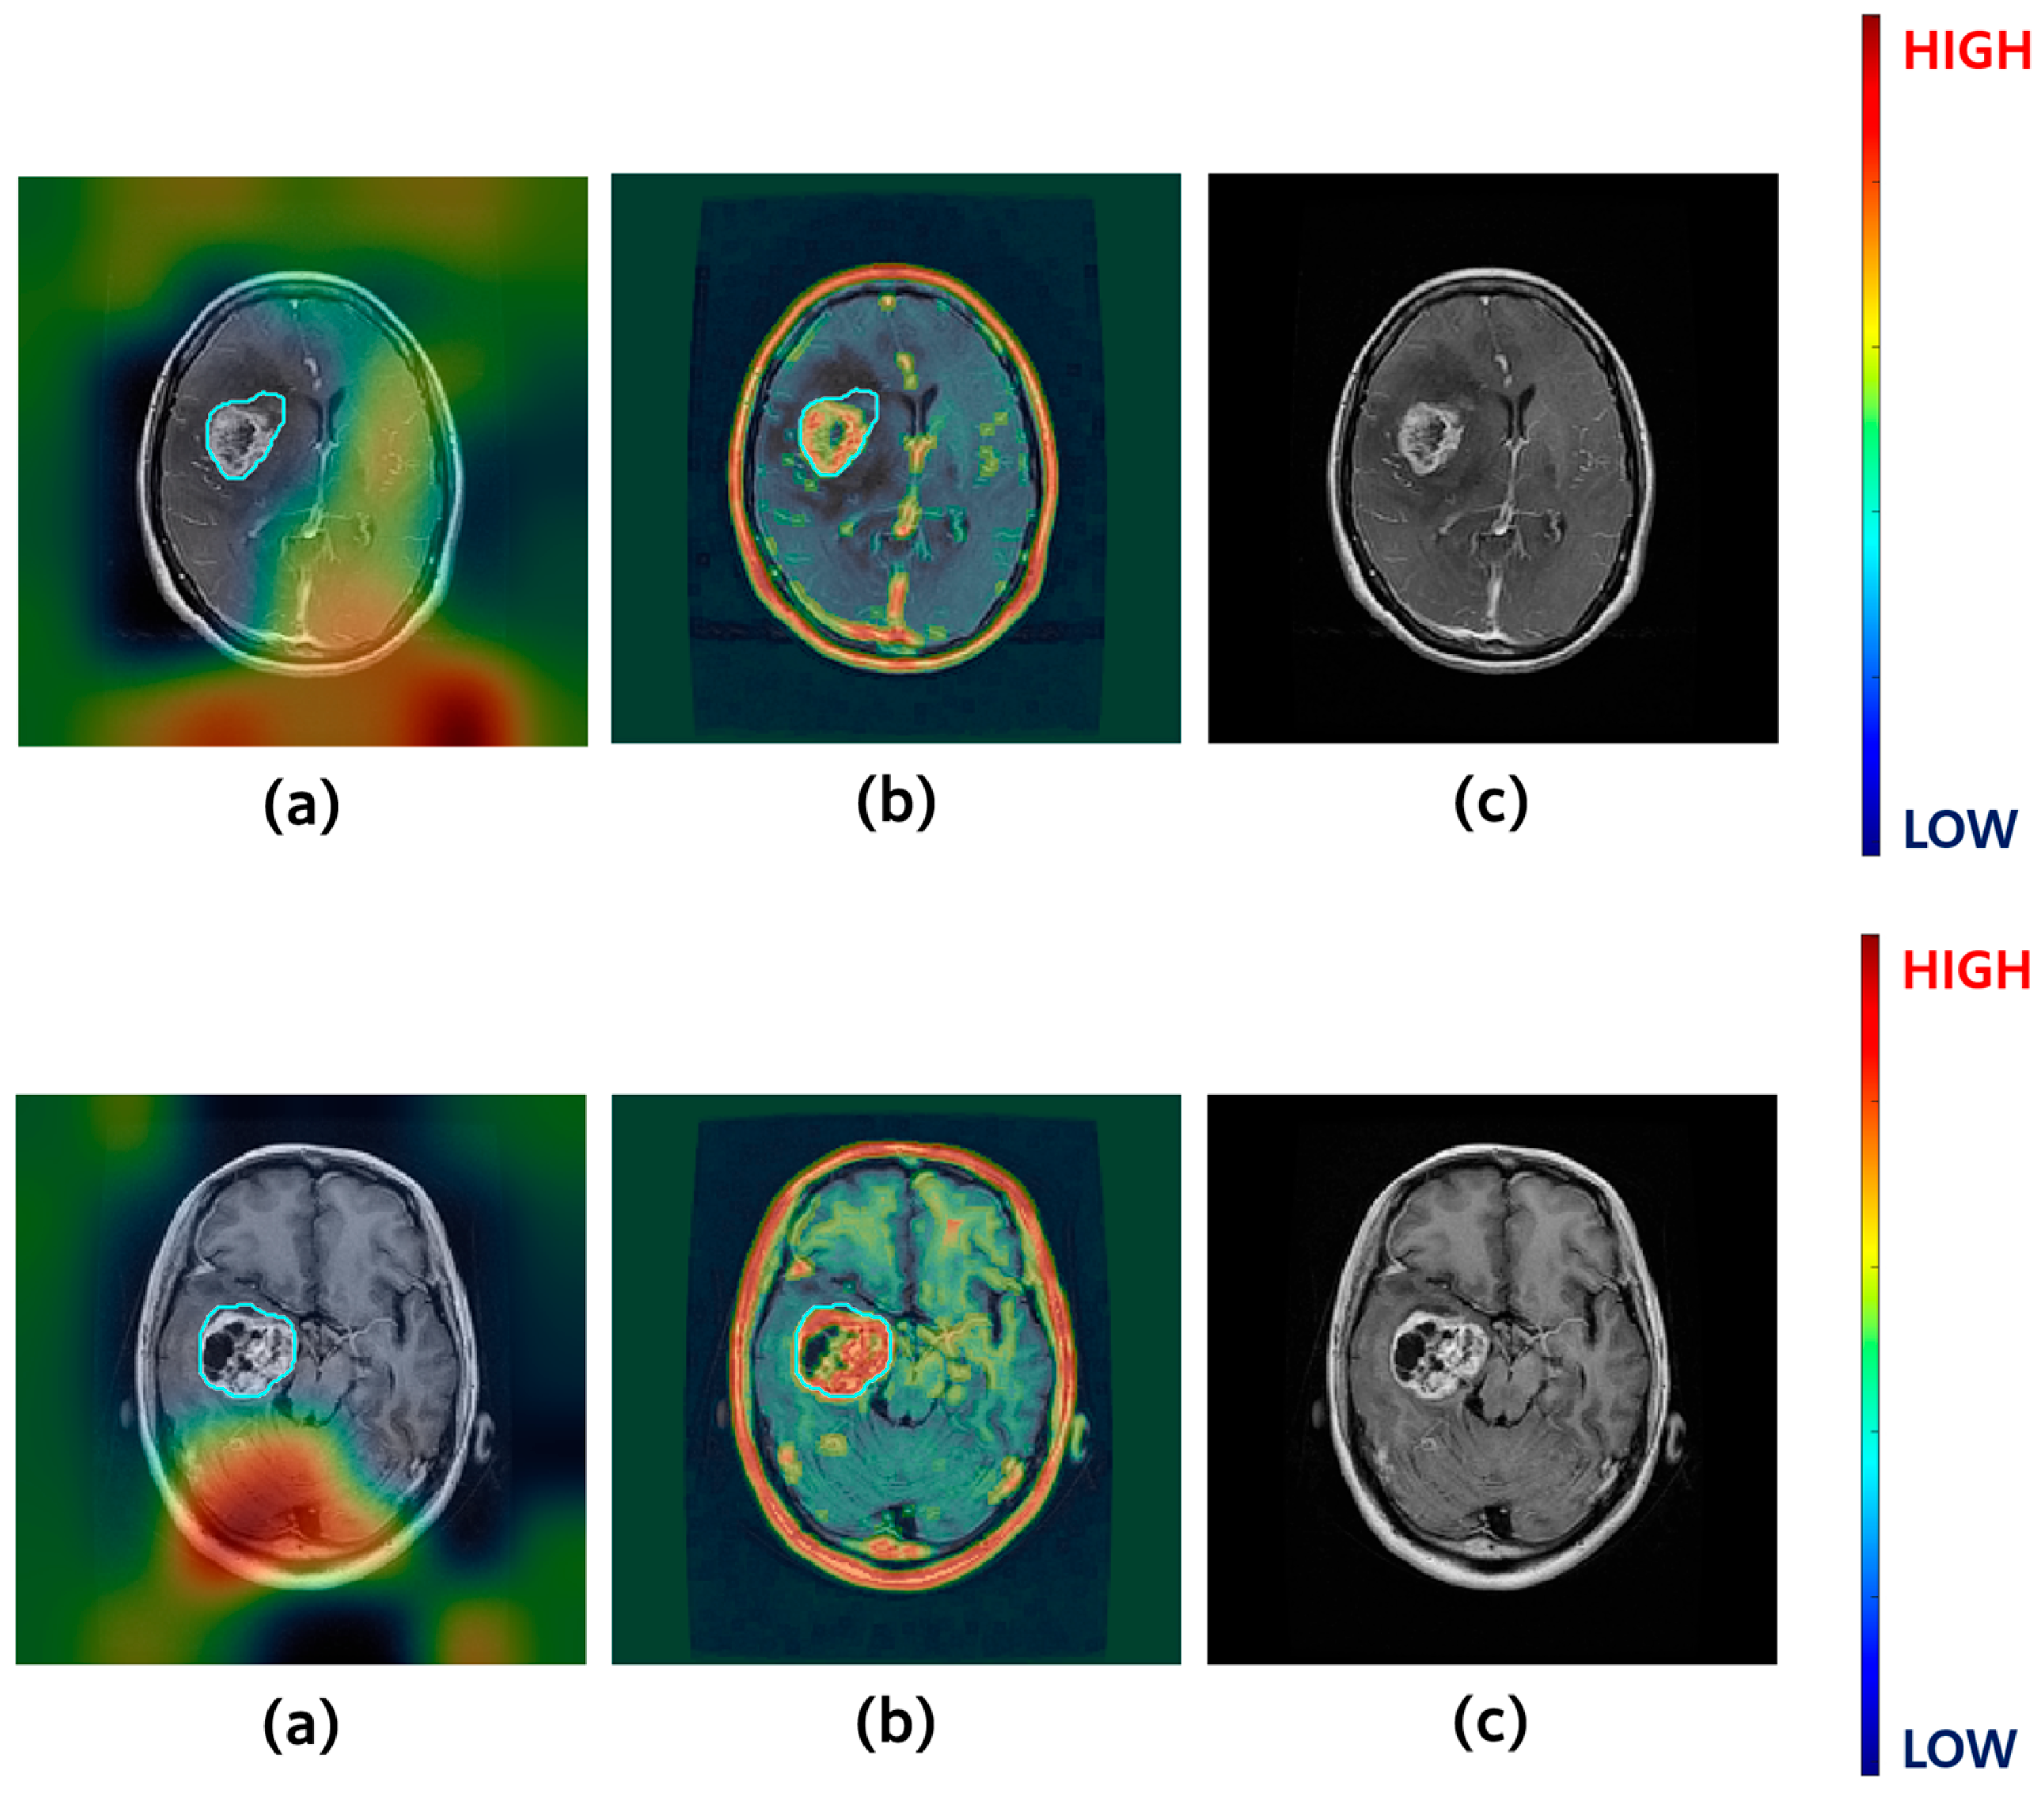
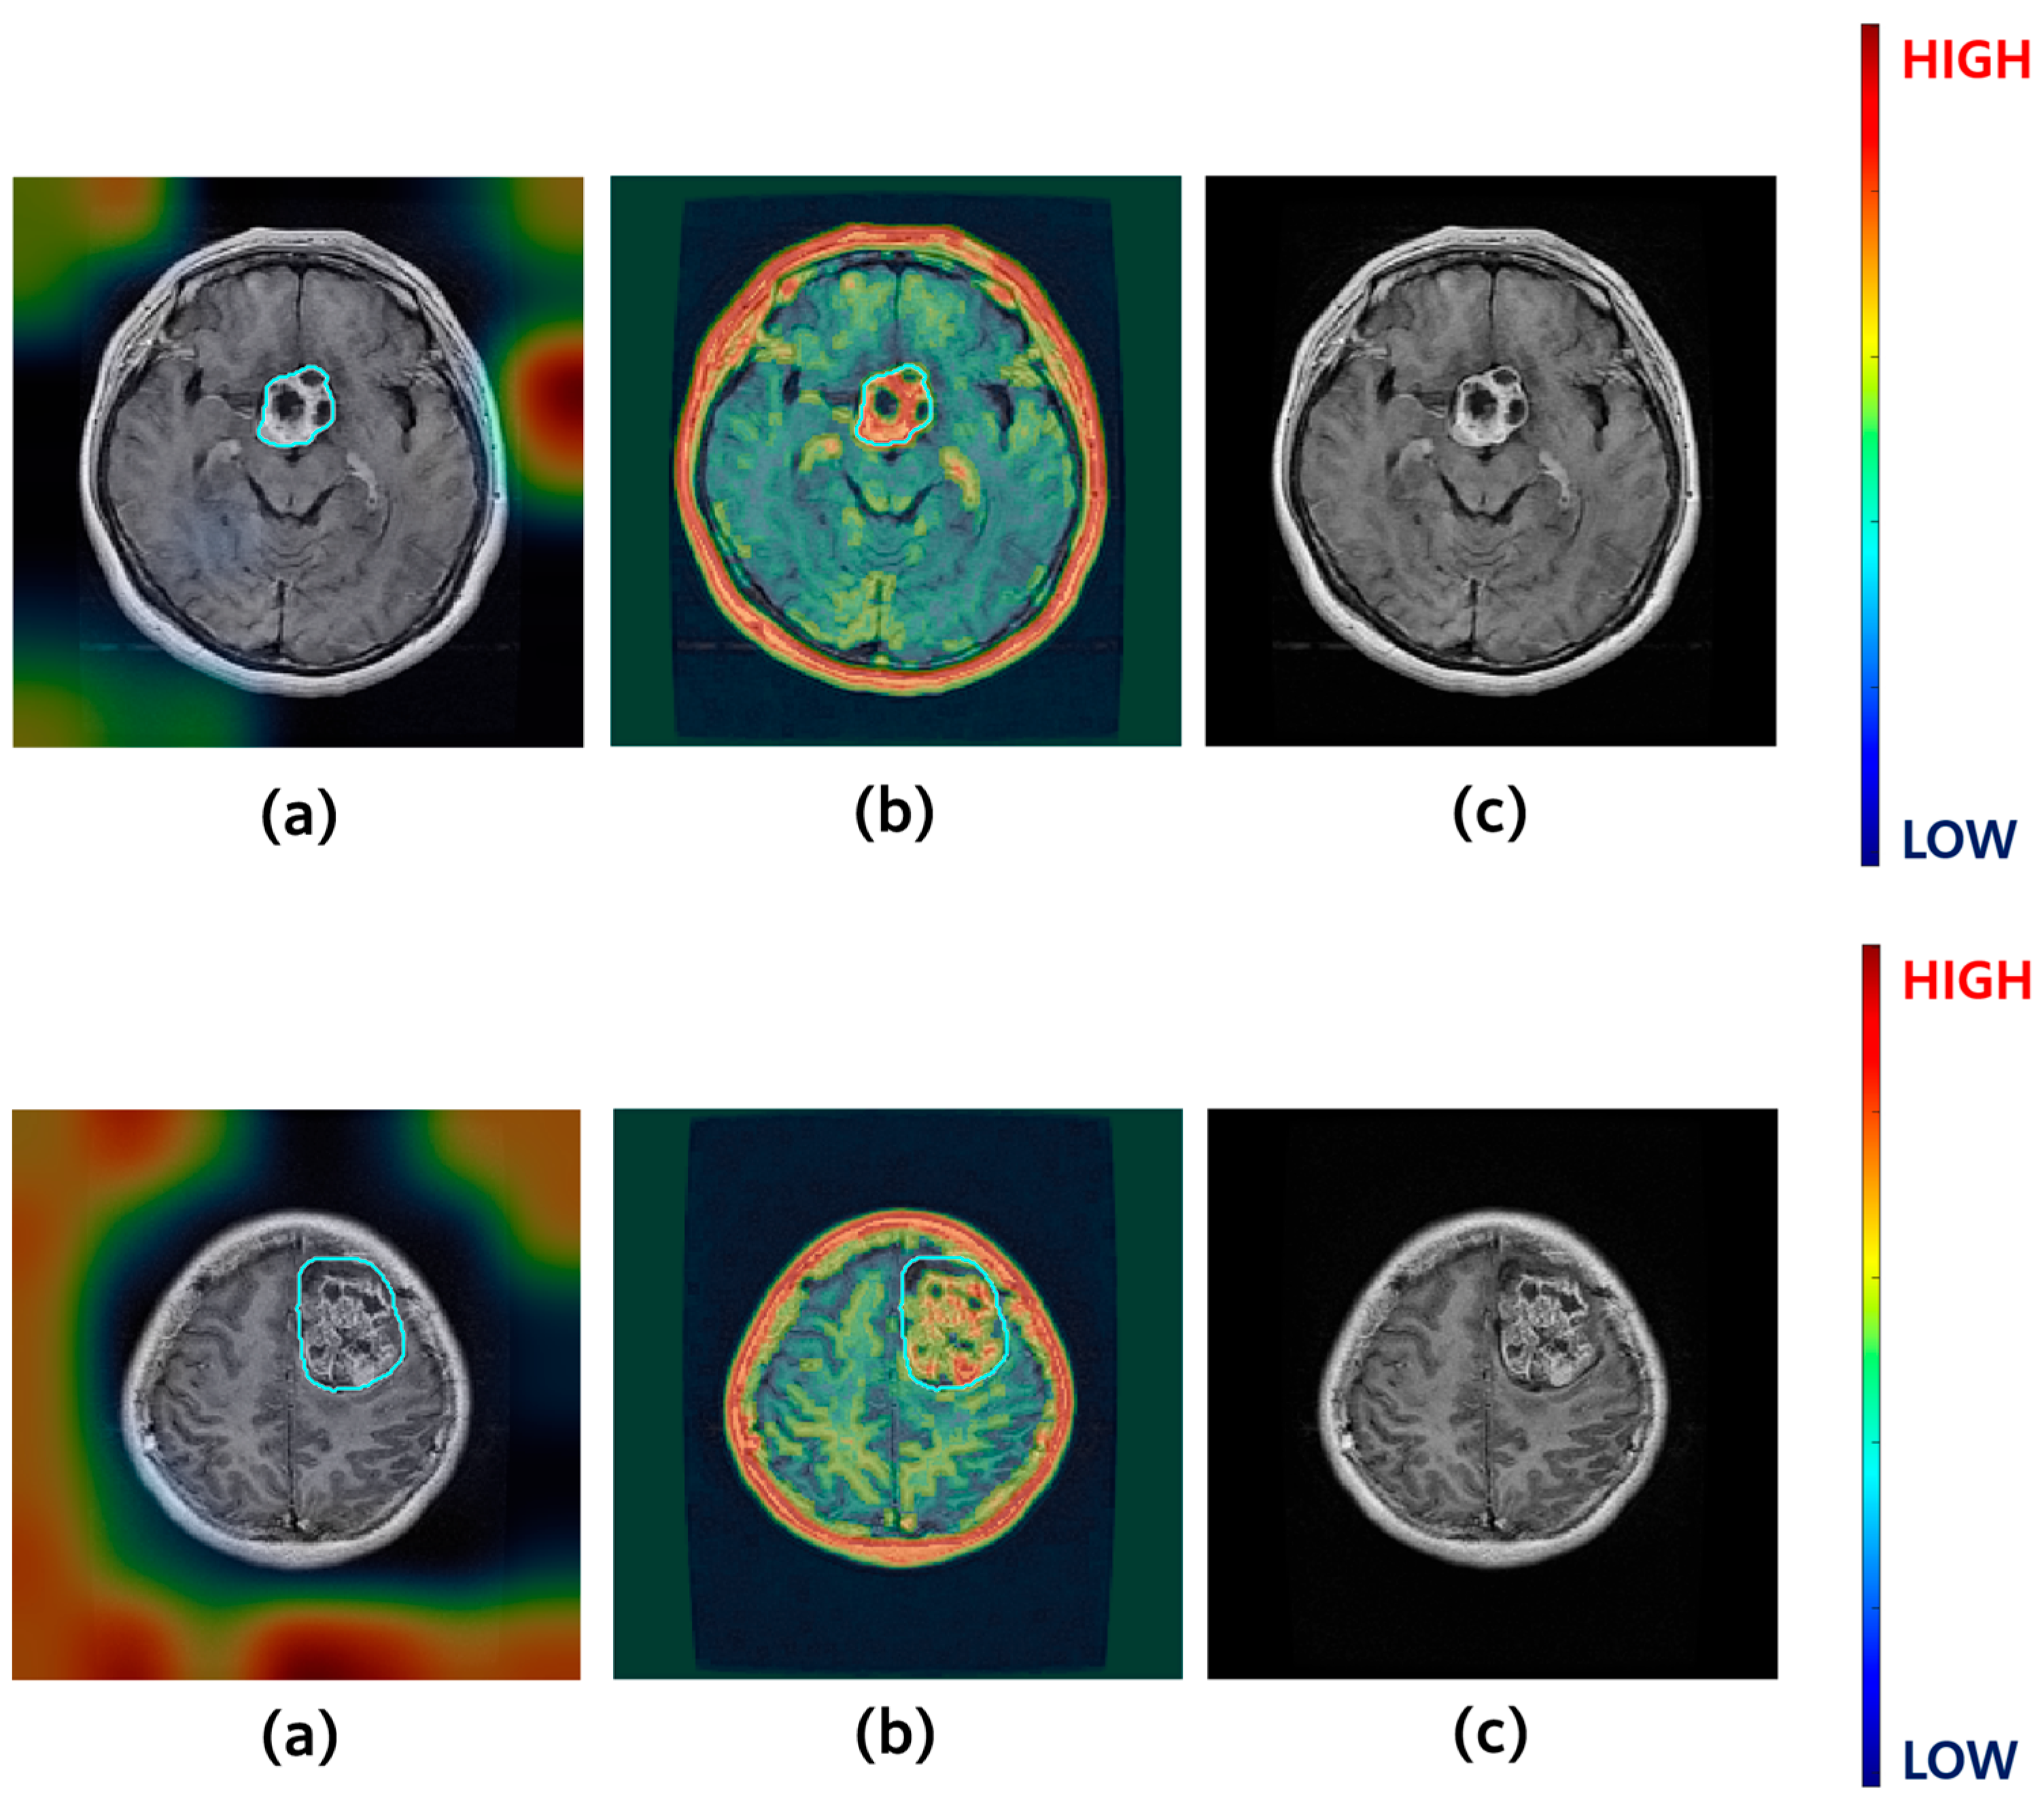
Figure 16,
Figure 17 and
Figure 18 present representative qualitative examples for each class, illustrating the visual difference between the Grad-CAM and FAR-based heatmaps. Compared with the ground truth lesion regions (depicted in cyan), Grad-CAM activations were primarily distributed around non-lesion regions such as the outer boundaries of the brain or surrounding tissues, whereas the FAR heatmap accurately emphasized both structural components and lesion areas. Furthermore, the FAR-based activation maps provided concentrated and physiologically relevant highlighting of tissue regions, offering a clearer and more intuitive visual explanation for clinicians.
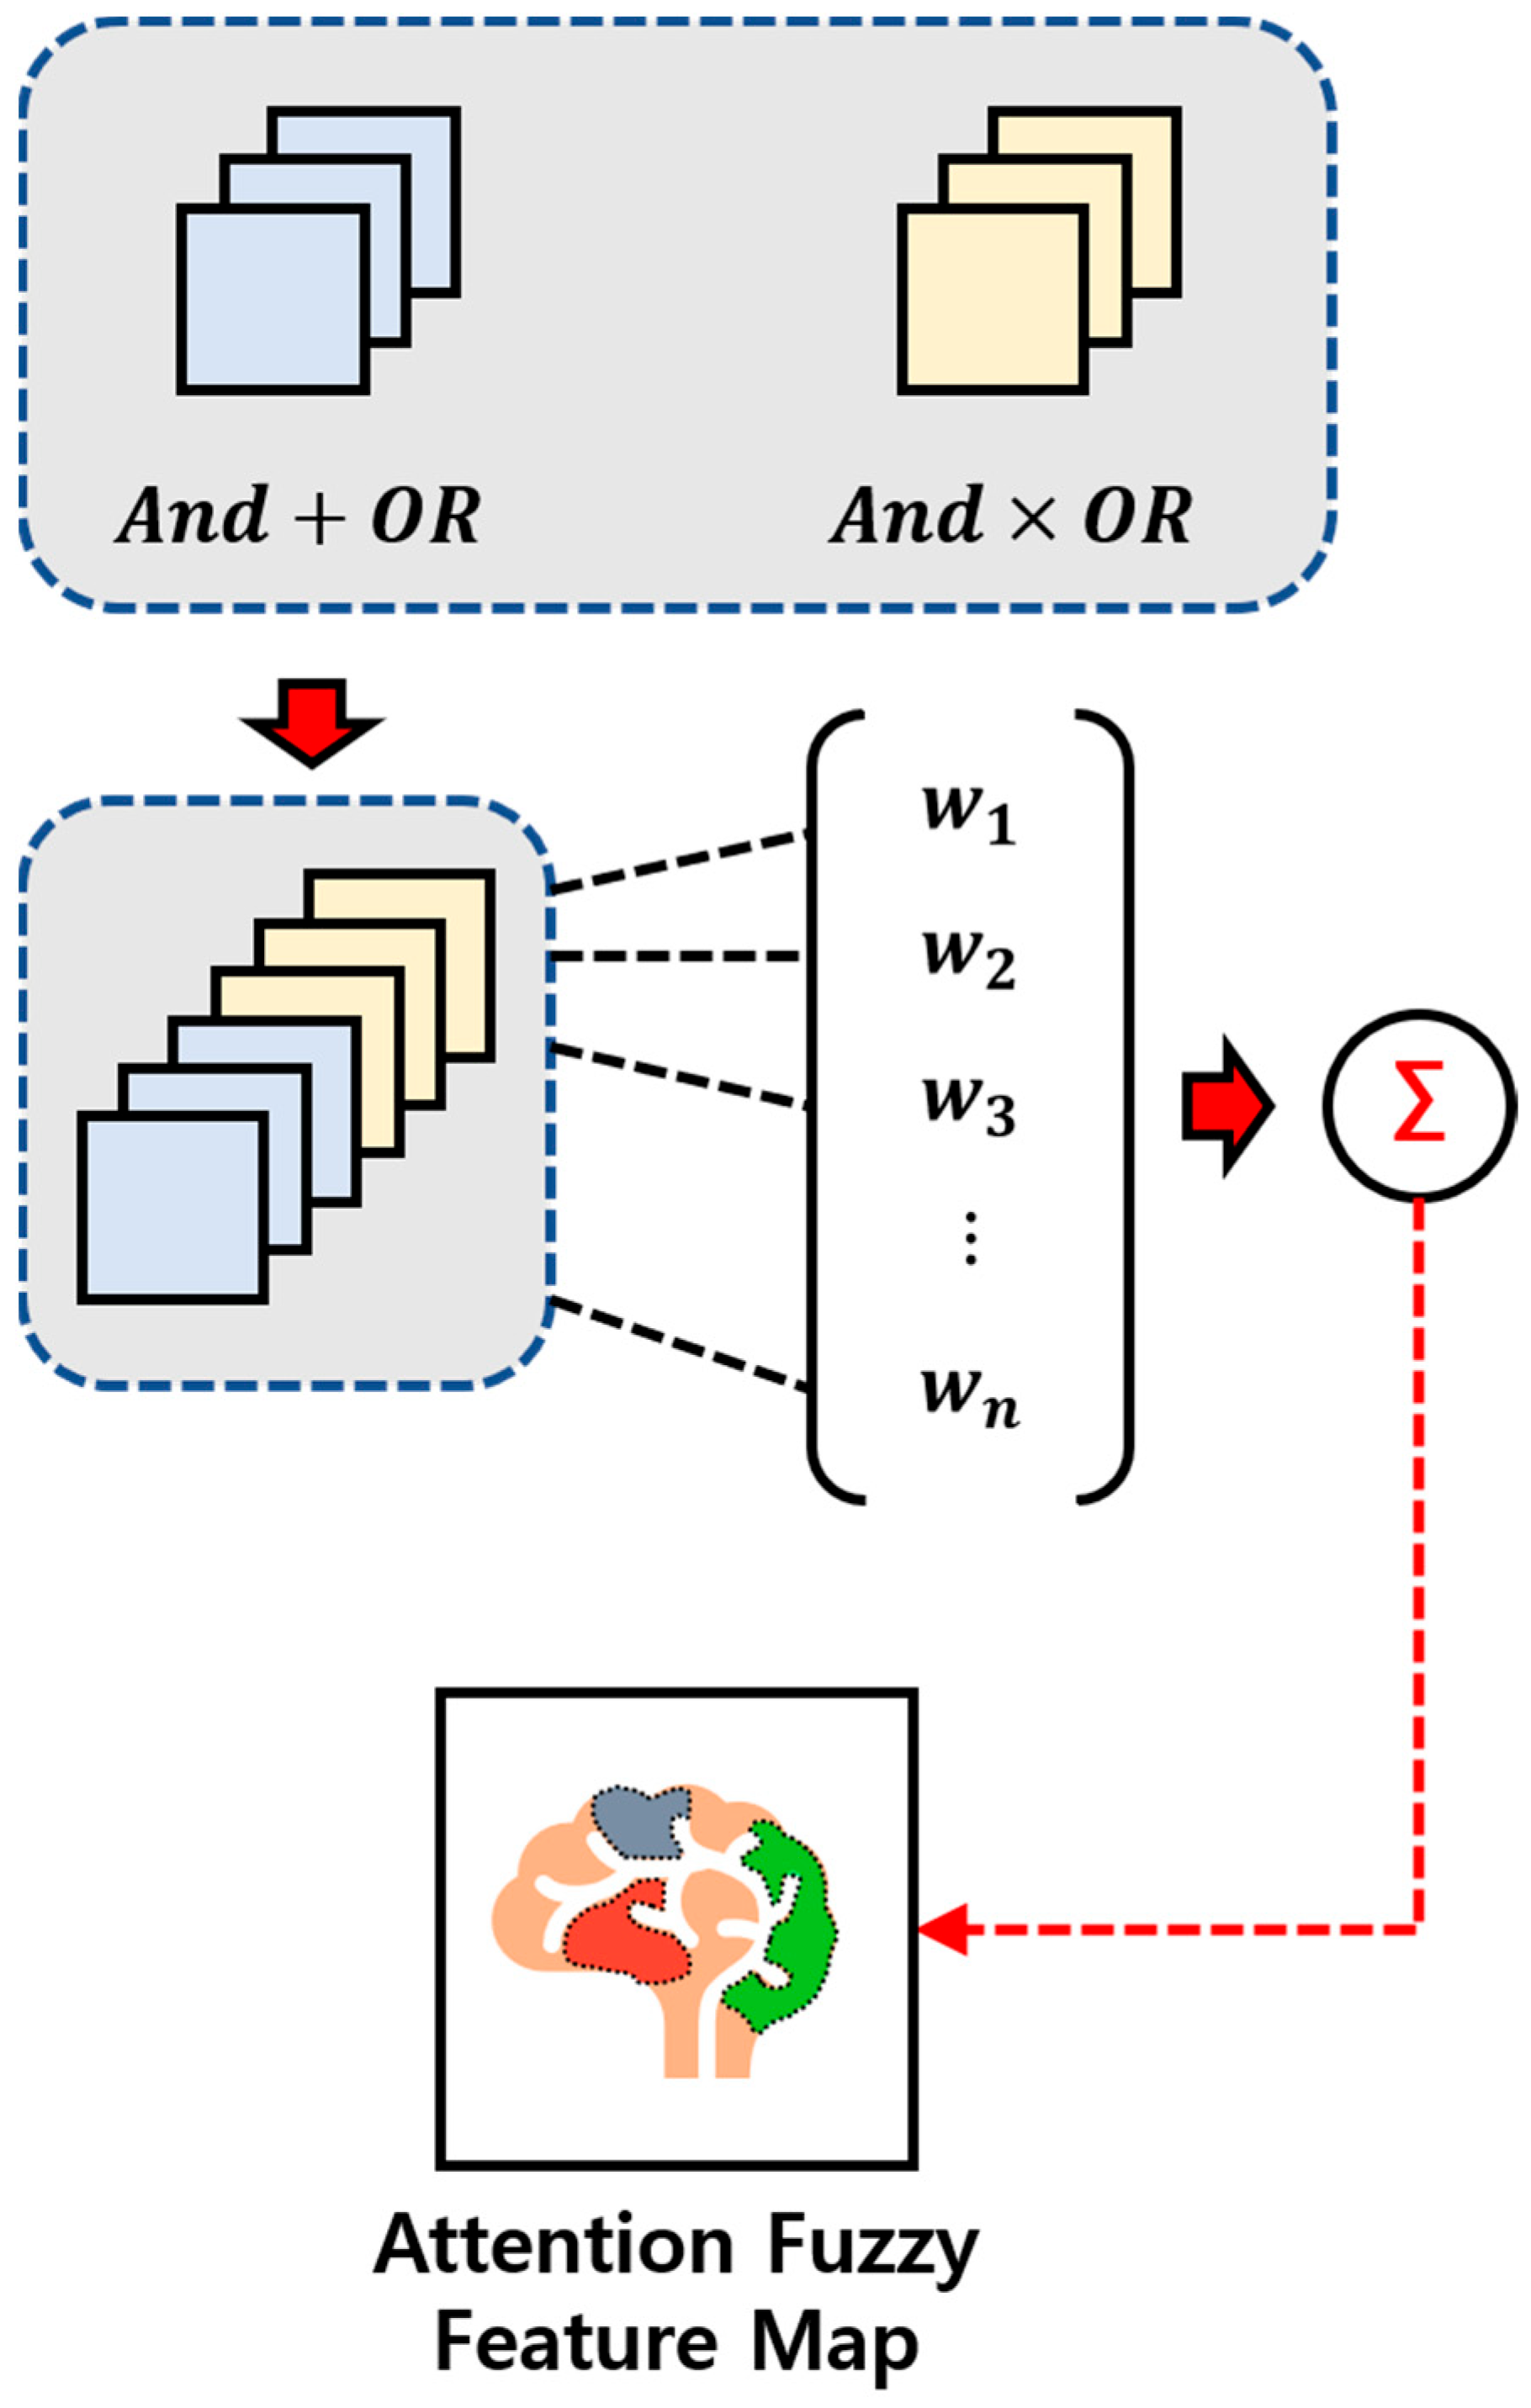
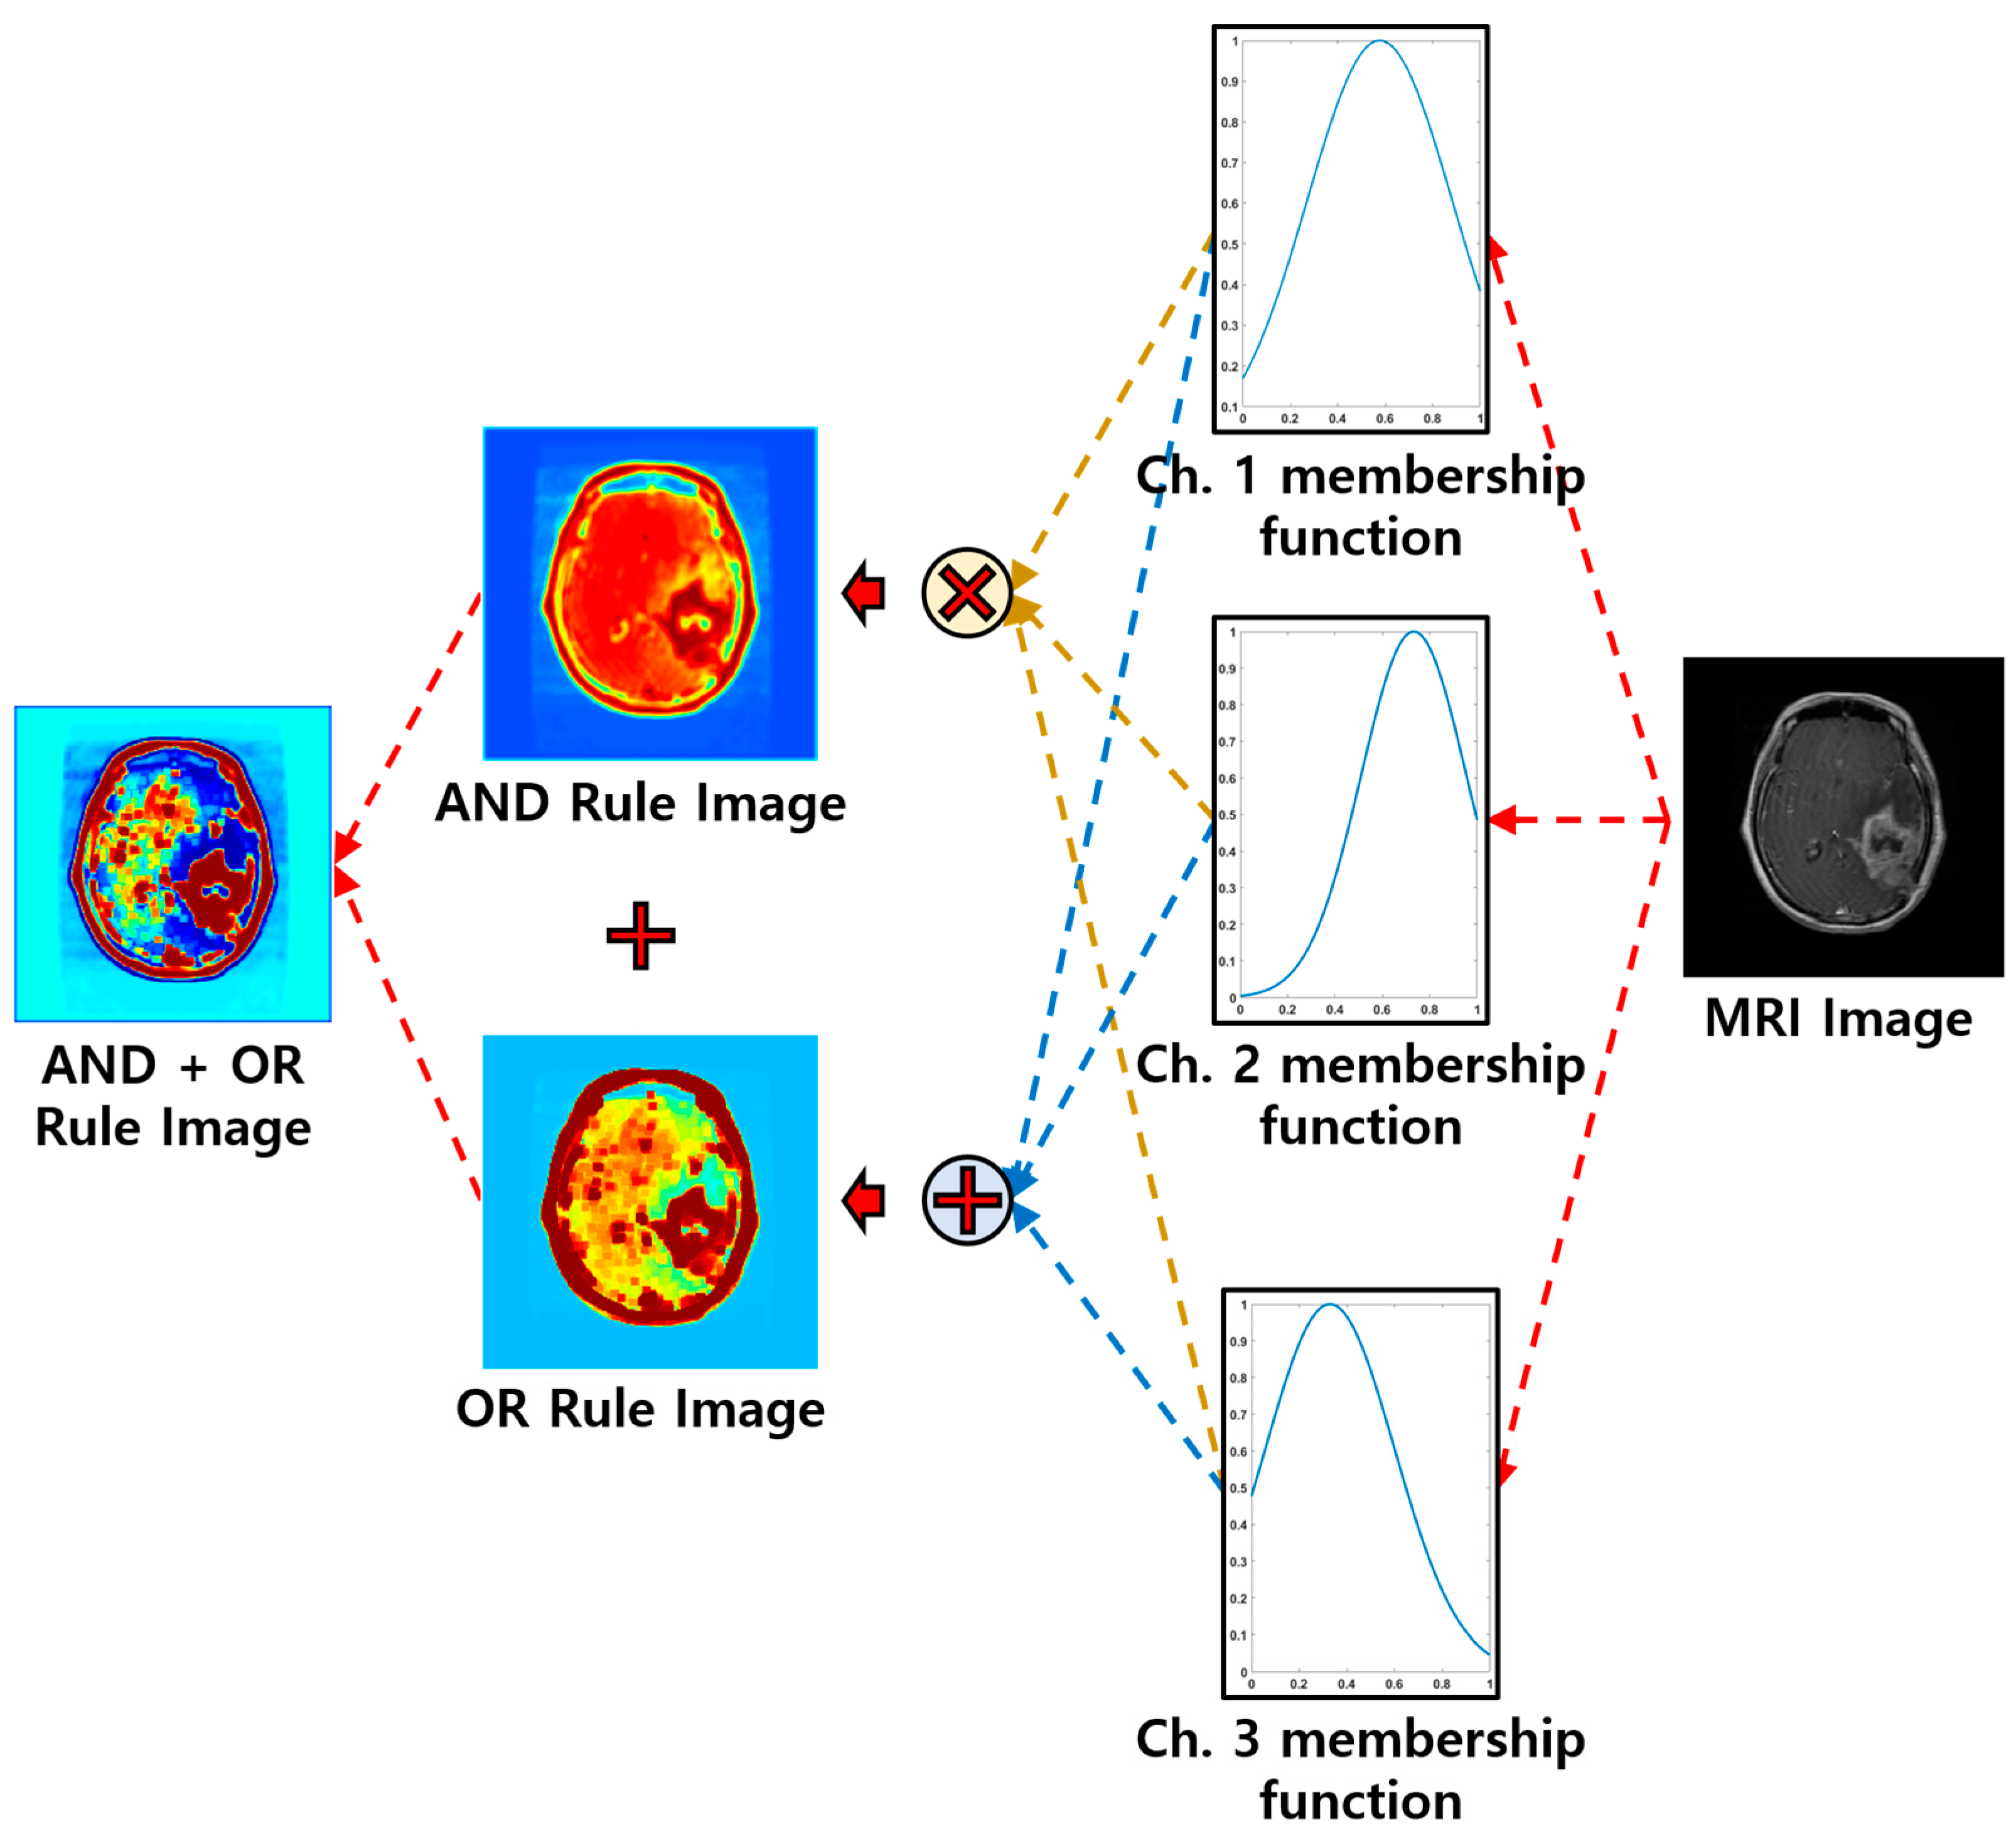
The output attention fuzzy feature map is an image generated from a complex rule process via membership functions applied to the input image.
Figure 19 shows the process of analyzing the rule with the highest contribution to this map. To construct the rule-based attention area, we identified the AND + OR image with the highest contribution through its weight and pixel values. To form this image, AND and OR rule images were combined, and to form each of those rule images, the channel-specific membership function corresponding to Rule 1 was needed. By passing the membership function from
Figure 19 through the original image, we can understand how the final classification was made.
In linguistic terms, the model’s decision can be explained as:
“IF the input image contains a region with a high pixel membership function to the degree of A, AND a region with a medium pixel membership function to the degree of B, AND a region with a low pixel membership function to the degree of C, AND if it contains the common region (AND) and the comprehensive region (OR) of these areas (OR), THEN, it is highly likely to be a Glioma.”
4. Discussion
In this study, we introduced FAR, an AND/OR–based fuzzy reasoning model designed to provide both competitive classification performance and transparent decision-making for medical image analysis. Although Resnet18 and Resnet50 achieved strong performance due to their deep convolutional feature extractors, FAR—with its much simpler architecture and significantly fewer parameters—achieved comparable classification accuracy. Moreover, when compared with an MLP classifier, FAR yielded substantial performance improvements while simultaneously reducing the overall parameter count, demonstrating its computational efficiency. However, classification accuracy alone does not guarantee clinically meaningful localization. Therefore, we further compared FAR’s rule-based attention maps with the Grad-CAM outputs of Resnet models. While Resnet occasionally focused on irrelevant image regions despite high classification accuracy, FAR consistently highlighted lesion-relevant areas and provided interpretable visual reasoning that aligns with clinical expectations. Despite these strengths, several limitations remain. First, the number of fuzzy rules is still selected empirically, and a more systematic rule-optimization strategy is needed. Second, while FAR is effective for lesion-focused medical imaging tasks, it is less suitable for general object classification problems where texture- and shape-based features extracted by CNNs are essential. Third, although the current FAR framework is combined with an MLP classifier, integrating FAR with deep CNNs may require additional analysis to harmonize fuzzy rule learning with convolutional feature hierarchies. Future work will explore integrating FAR with various deep learning backbones, developing automated rule-selection mechanisms, and extending the model to broader medical and general imaging tasks. Through these efforts, FAR has the potential to evolve into a model that jointly advances interpretability and predictive performance.