Abstract
This paper introduces a market-inspired meta-heuristic named the Market Game Optimization Algorithm (MGOA), which models the symmetric competitive interactions between merchants and customers. MGOA simulates the dual dynamics of attraction and collaboration among merchants and customers, integrating a global search strategy that reflects how merchants attract customers. The optimization process includes two distinct stages, each employed with a 50% probability through a merchant cooperation mechanism designed to balance exploration and exploitation. Prior to performance evaluation, a qualitative analysis and parameter sensitivity study were conducted to clarify parameter selection and optimization characteristics. The algorithm was tested on 42 benchmark functions from the CEC2017 and CEC2022 test suites and compared against 10 well-established and 10 recently proposed meta-heuristic algorithms. Results indicate that MGOA achieves the highest overall ranking. Furthermore, its application to 11 real-world engineering design problems demonstrates high effectiveness and solution quality. All experimental findings confirm that MGOA is a robust and competitive meta-heuristic capable of solving complex real-world optimization problems.
1. Introduction
The rapid advancement of modern society necessitates the continuous adoption of intelligent methods for optimization. Whether the objective is maximization or minimization, such optimization problems are essential to societal progress [1]. Optimization algorithms—defined as stochastic or deterministic methods that optimize decision variables subject to objective functions and constraints [2,3,4]—are employed to address problems involving multiple decision variables under complex nonlinear constraints [5]. Classical optimization techniques include gradient descent [6], Newton’s method [7], the method of Lagrange multipliers [8], and simulated annealing [9]. However, real-world optimization tasks often exceed the capabilities of traditional solvers due to their large scale, high dimensionality, and inherently nonlinear nature. Such problems are frequently multimodal, causing search processes to easily become trapped in local optima and miss global solutions. Moreover, the proliferation of variables leads to an exponential expansion of the search space, resulting in the “curse of dimensionality.” The nonlinear and often non-differentiable behavior of objective functions further restricts the applicability of classical algorithms that rely on smoothness and convexity [10,11,12]. Engineering problems, especially multi-criteria optimization, are core issues in engineering design and manufacturing. Most practical optimization problems inherently involve multiple conflicting objectives [13]. Optimization algorithms can achieve material and manufacturing cost reductions while maintaining structural performance. Therefore, simple yet efficient metaheuristic algorithms are particularly suitable for solving difficult engineering optimization problems [14].
In contrast to conventional optimization approaches, genetic algorithms introduce a novel perspective on optimization [15]. As an evolution-inspired strategy and the first metaheuristic algorithm, they are capable of identifying high-quality solutions within computationally feasible time and resource constraints by evolving their own problem-solving ability, thereby enabling efficient handling of real-world optimization challenges [16]. Dokeroglu et al. argue that a new generation of metaheuristics is increasingly becoming one of the most effective avenues for tackling complex optimization problems. These methods are celebrated for their potent global search capabilities, minimal assumptions about problem structure, and exceptional scalability. They are widely applied to high-dimensional, nonlinear, and multimodal optimization landscapes that defy conventional techniques, demonstrating remarkable efficiency and practicality in real-world applications [17]. Those are also related to the challenge mentioned by Cebeci & Timur. In addition to calculating the mean ranking, the method to verify the successful development of metaheuristic algorithms also includes recording the median and the number of times the solution converges to the global optimum, since the solution is usually non-normally distributed. This successfully verifies the success of genetic algorithms in the origin of metaheuristic algorithms and the powerful engineering problem-solving capabilities they bring [18]. However, the outcomes derived from different research questions often vary. When deciding whether to use the mean or the median for comparison, researchers need to conduct analyses based on the specific context of the problem. In general, each statistical method emphasizes different aspects, thereby reflecting the diversity in how results are presented across various issues.
The new generation of metaheuristic algorithms can be primarily categorized into four types. The first category comprises variants inspired by evolutionary behavior, which are developed based on biological evolution or genetic mechanisms. The Genetic Algorithm (GA) was the first to employ evolutionary principles, simulating chromosomal crossover and mutation [19]. The Differential Evolution (DE) algorithm, proposed by Price et al., introduced vector differences between individuals in a population as a perturbation mechanism to guide the search direction, enhancing both solution accuracy and convergence efficiency in continuous optimization problems [20]. The Evolutionary Mating Algorithm (EMA), developed by Sulaiman et al., made a significant contribution by incorporating the Hardy–Weinberg equilibrium principle from population genetics into evolutionary computation. This provided a quantifiable model of genetic drift for discrete optimization, establishing a search framework based on explicit genetic mechanisms [21]. Meanwhile, Dong et al. proposed a Chaotic Enhanced Evolutionary Optimization (CEO) method, which integrates a memristive hyperchaotic system with differential evolution. This hybrid approach effectively balances global exploration and convergence speed, offering a novel dynamical optimization pathway for tackling NP-hard problems [22].
The second category consists of algorithms inspired by physical and chemical phenomena, tracing back to the Simulated Annealing (SA) algorithm by Bertsimas and Tsitsiklis. SA, inspired by the physical process of cooling, has solved numerous optimization problems and provided foundational insights into physicochemical-inspired metaheuristics [23]. Abdel-Basset et al. proposed the Kepler Optimization Algorithm (KOA), which is inspired by celestial mechanics. By simulating the orbital motion of planets under gravitational forces, KOA effectively guides the movement of candidate solutions, significantly improving global search capability and convergence efficiency [24]. Su et al. developed the Rime Optimization Algorithm (RIME), emulating the formation mechanism of frost ice in nature. Through modeling the growth behavior of soft and hard rime under varying temperature conditions, the algorithm achieves an adaptive balance between exploration and exploitation during the search process [25]. Additionally, Kashan proposed the Optics-Inspired Optimization (OIO) algorithm, which innovatively applies Fermat’s principle from optics to optimization. By mapping the path of light propagation in media to search strategies in the solution space, OIO demonstrates exceptional ability to avoid local optima in non-convex and complex function optimization [26].
The third category, and currently the most popular, is swarm intelligence metaheuristics inspired by collective behavior. Notable recent representatives are as follows: The pioneers of metaheuristic algorithms—particle swarm optimization (PSO) based on the response of particle groups and ant colony optimization (ACO) based on the communication behavior of ants—have set a precedent for the development of group behavior in metaheuristic algorithms [27,28]. The Dhole optimization algorithm (DOA) by Mohammed et al. was inspired by the vocal communication and cooperative hunting strategies of dhole. By simulating sound-guided adaptive decision-making and dynamic clustering behavior, DOA effectively balances exploration and exploitation during the search process [29]. Rüppell’s Fox Optimizer (RFO) by Braik et al., which models the diurnal and nocturnal foraging behavior of Rüppell’s fox, leverages acute sensory capabilities such as a 260° field of vision and 150° auditory perception. Its cognitive component dynamically coordinates the transition between global exploration and local exploitation [30]. The Animated Oat Optimization algorithm (AOO) by Wang et al. was based on the propagation mechanisms of animated oat seeds—including dispersal via external forces, obstacle-avoiding propulsion, and hygroscopic twisting movement. This offers a novel nature-inspired search framework for engineering optimization, such as wireless sensor network layout [31]. The Superb Fairy-Wren Optimization algorithm by Jia et al. draws inspiration from the development, brooding, and predator avoidance behaviors of superb fairy-wrens. By simulating these natural behaviors in distinct phases, the algorithm efficiently handles feature selection problems [32].
The final category represents the most recent advancement: human-inspired metaheuristics based on individual and collective human behaviors. Ahmadi pioneered the Human Behavior-Based Optimization (HBO) model, abstracting search rules from multiple cognitive stages such as knowledge acquisition, consultation, and belief evolution. This establishes an optimization framework adaptable to complex constraints with cognitive interpretability [33]. Bourechekara proposed the Most Valuable Player Algorithm (MVP), which draws on the dual mechanisms of individual excellence and collective collaboration in sports teams. It constructs a search strategy that simultaneously optimizes individual performance and group cooperation, effectively mitigating the inherent conflict between exploration and exploitation in traditional swarm intelligence algorithms [34]. Trojovský designed the Preschool Education Optimization Algorithm (PEOA) based on the phased teaching mechanisms in early childhood cognitive development. By simulating the influence gradient of teachers and a three-stage cognitive evolution process, the algorithm significantly enhances the ability to escape local optima in complex multimodal environments [35].
In summary, metaheuristic algorithms can be categorized as shown in Figure 1. The pursuit of robust and efficient optimizers is fundamental in tackling the ever-growing complexity of real-world problems. Despite the proliferation of metaheuristic algorithms, significant challenges remain, particularly in achieving a delicate balance between exploratory and exploitative behaviors—a common limitation that often leads to suboptimal performance or premature convergence. While various natural and physical phenomena have inspired numerous algorithms, the sophisticated strategic interactions inherent in human economic behavior remain a relatively untapped source of inspiration. To bridge this gap, this paper proposes the Market Game Optimization Algorithm (MGOA). Its core novelty lies in a unique two-stage mechanism that simulates, with equal probability, the competitive strategies of merchants and their coordination with customers. This design fosters a dynamic and effective search process. The efficacy of MGOA is rigorously validated through comprehensive parameter analysis, behavioral and visual inspection, extensive experiments on the CEC 2017 and 2022 benchmark suites, and applications to 11 real-world engineering design problems.
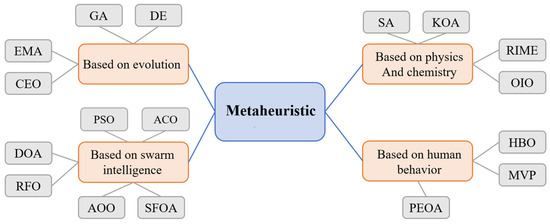
Figure 1.
Summary of Metaheuristic.
The remainder of this paper is structured as follows: Section 2 delineates the interactive behaviors between merchants and customers and elucidates the underlying mechanisms that inspire the algorithm. Section 3 formalizes the merchant-customer game behavior model and introduces the proposed MGOA. Section 4 presents the experimental setup, including parameter configuration, qualitative discussions, performance evaluations, and practical applications. Section 5 concludes the study by summarizing the findings and discussing limitations and future research directions.
2. Inspiration from the Competitive Behavior of Merchants and Consumers
The essence of market activities stems from the complex strategic interplay between businesses and consumers. Companies dynamically adjust their marketing strategies to maximize profits, while consumers make choices to optimize their own utility, proving that the market has always been a game process [36]. This continual adaptation of strategies on both sides constitutes a paradigmatic game scenario. This paper conceptualizes the pivotal behavioral mechanisms inherent in commercial competition and formulates a Market Game Optimization Algorithm (MGOA).
- Gravity Phase (Exploration-oriented)The core characteristic of the market lies in its inherent dynamism and volatility—shifting demands, diverse consumer preferences, and an ever-evolving competitive landscape. To navigate such uncertainties, businesses must proactively sense market conditions and continuously refine their marketing strategies—such as pricing, product positioning, and promotional tactics—to attract diverse customer segments. This process is conceptualized as the Gravitational Phase: within the algorithm, “merchant agents” (candidate solutions) dynamically update their positions (strategies) based on market feedback (fitness values), emulating how businesses explore and attract distinct customer clusters (promising regions in the solution space). This phase emphasizes global exploration, preventing premature convergence to local optima, as illustrated in Figure 2.
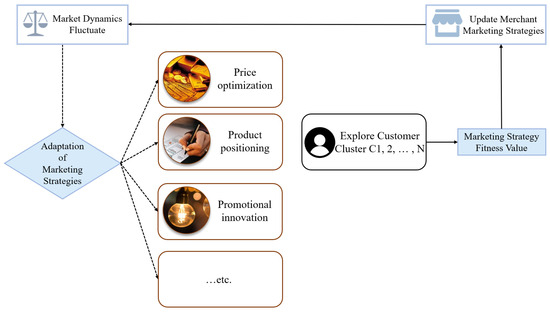 Figure 2. Merchants Adjust Marketing Strategies to Attract Customers.
 - Collaboration Phase (Development-oriented)While attracting new customers, businesses must also prioritize retaining repeat customers to secure stable revenue streams. The interaction with this group transitions from broad outreach to deepened collaboration—achieved through personalized services, loyalty programs, and tailored solutions—enhancing mutual satisfaction and fostering long-term benefits. This behavior is mapped into the Collaborative Phase: high-performing merchant agents (solutions occupying high-value regions) engage within their neighborhoods to share strategic information and jointly refine solutions. This phase focuses on local exploitation, improving convergence accuracy through intensive search within high-potential regions, as shown in Figure 3.
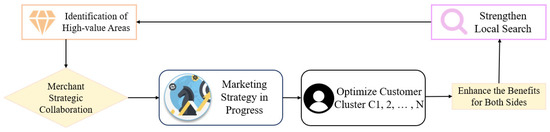 Figure 3. Merchants’ Marketing Strategies Develop in Tandem with Customers.
Ultimately, the Gravitational and Collaborative phases form a closed-loop feedback mechanism: exploration identifies promising regions, while exploitation refines and extracts value from these areas. Their dynamic balance equips the algorithm with both global search capability and local optimization efficiency, progressively converging toward the optimal market strategy.
Before starting the next section, we first clarify that all the symbols in this paper are shown in Table 1.

Table 1.
Symbols and Description of Market Game Optimization Algorithm.
3. Mathematical Model of the MGOA
This section proceeds to introduce the mathematical modeling and operational workflow of MGOA. The algorithm is designed to simulate the game-theoretic interactions between merchants and customers, wherein merchants continuously employ both attraction and collaboration strategies to maximize benefits. Through the merchant model [37], within the fluctuating cycles of the market, merchants adapt their marketing strategies to cater to a diverse customer base—a phase referred to as the Gravitational Phase. Subsequently, within the repeat-customer segment, merchants engage in cooperative behavior with these consumers to enhance mutual satisfaction and strengthen shared value, constituting the Collaborative Phase. The algorithm ultimately selects the optimal strategy emerging from this game process as the final solution.
3.1. Initialization
In the context of metaheuristic algorithms, population initialization constitutes the foundational phase of the overall optimization process. This paper employs a stochastic initialization method to generate an initial population of merchants, where each merchant represents a candidate solution. Specifically, the population consists of N individual merchants, the term “multi-dimensional marketing strategy” refers to a complete set of decisions a merchant makes across various competitive domains, mathematically, each characterized by d strategy dimensions. The values along each dimension are randomly generated within prescribed boundaries. This process can be mathematically formulated as follows:
where denotes the value of merchant i in the j-th strategy dimension, and represents a random number uniformly distributed within the range . Following the initialization process, the fitness value for each merchant is evaluated.
where denotes the marketing strategy j selected by merchant i, and represents the market fitness evaluation function, which assesses the attractiveness of the merchant’s strategy to the market.
The initial optimal solution and its corresponding fitness value are subsequently identified.
This stage provides a high-quality initial solution set for the subsequent optimization process.
3.2. Strategy Adjustment Strength S
Inspired by the phenomenon of cyclical market fluctuations, this paper introduces a strategy adjustment intensity mechanism into the MGOA to effectively balance the algorithm’s global exploration and local exploitation capabilities. The core formula of this mechanism is formulated as follows:
where denotes the base amplitude of adjustment, and it is set to . This value provides a principled and standardized initial step size for the strategy adjustment, corresponding to a half-cycle in a sinusoidal context. is the current number of function evaluations, is the maximum number of evaluations, is the parameter controlling the frequency of market fluctuations, and is the decay coefficient, which is a constant rigorously determined through extensive ablation experiments. represents the adjustment intensity, which starts with a higher value in the early iterations to promote global exploration and gradually decreases to enhance local exploitation as the optimization proceeds. The term simulates the cyclical nature of market fluctuations, enabling the algorithm to maintain strong exploratory capability and high sensitivity in the early stages. Meanwhile, ensures that the adjustment intensity decays progressively throughout the iterations, thereby improving the stability of exploitation and convergence behavior in the later phases.
3.3. Merchant and Customer Attraction Stage
The merchant attraction phase corresponds to the global exploration stage of the algorithm. Inspired by the Nash random selection, where players adjust their strategies to maximize payoff against the current strategies of others, each merchant adjusts its strategy relative to the current global best. Therefore, the algorithm is designed to model the exploratory and collaborative dynamics between merchants and customers through two distinct stages. To ensure balanced progression between these stages, each one is selected with a probability of 50% during each iteration. To prevent premature convergence that can occur from solely following the best strategy, the algorithm incorporates structured randomness by updating only a random subset of dimensions. The dimension selection mechanism is designed to balance efficiency and diversity, formulated as:
where the problem dimension represents strategies. represents the number of extracted dimensions. After that, in the selected dimension, the strategy update will develop in the direction of a better response in the market fluctuation environment. The displacement from the current position towards the best-known strategy is scaled by the strategy adjustment strength S, which modulates the step size. The update is given by:
Inspired by the concept of attraction in collective movement and to maintain diversity and avoid premature convergence, the mechanism performs updates only along a randomly selected subset of dimensions. This stochastic dimension selection drives merchant strategies toward more optimal directions and ensures that not all components of the strategy vector are updated simultaneously, thereby preserving population diversity and enabling a more comprehensive exploration of the solution space. The negative sign “” in the equation signifies a directional movement toward the region occupied by the best merchant, facilitating convergence by reducing the discrepancy between the current and the best strategies. This form of update can be interpreted as a form of gradient-free optimization, where the search direction is biased toward the current optimum. As a result, the algorithm achieves a balance between directed convergence toward promising regions and stochastic exploration of uncharted areas, enhancing its ability to escape local optima and effectively locate the global optimum.
3.4. Merchant and Customer Collaboration Stage
The merchant-customer collaboration phase corresponds to the local exploitation stage of the algorithm. During this phase, each merchant not only draws inspiration from the optimal strategy but also synthetically incorporates strategic information from other merchants, thereby enhancing solution quality through multi-faceted strategy adjustments. The update mechanism is formulated as follows:
where and represent random cooperation coefficients within range and are two adaptability capabilities of merchants to adjust their strategies during the cooperation process (computed as ); and represents the difference between the strategies of two randomly selected merchants in the population and the customer. The utilization of only two randomly selected merchants to compute the difference vectors is a deliberate design choice, inspired by the differential mutation mechanism in evolutionary algorithms. This approach is justified by two primary considerations: computational efficiency and the preservation of population diversity. Using a small, random set of individuals introduces stochastic noise, which is crucial for preventing premature convergence and maintaining the exploratory capability of the algorithm. Business collaborations should be broadly open, so random search is used to disperse search directions, prevent premature convergence, and maintain population diversity. By combining solutions from multiple randomly selected individuals, this strategy simulates a form of recombination that allows exploration of new areas in the solution space without over-reliance on elite individuals. This is particularly effective in expanding the scope of exploration, helping to escape local optima, and promoting exploratory development in potential areas. This collaborative mechanism enriches search directions and enhances the algorithm’s ability to explore within potential optimal areas, thereby helping to obtain more accurate solutions.
After each strategy update, the new fitness value is computed through objective function evaluation:
Subsequent strategy adoption follows greedy selection principle:
The global optimal solution is updated through comparative assessment:
This mechanism emulates the process through which merchants progressively seek optimal strategies by identifying the best fitness value across multiple gameplay rounds, ensuring monotonic improvement of solution quality throughout optimization.
3.5. Overall Algorithm Flow
In summary, inspired by the strategic adaptive behaviors of merchants in market competition, this paper proposes an optimization method that integrates periodic exploration and cooperative development. The algorithm begins by initializing the population and evaluating the initial fitness. In each iteration, it dynamically computes the strategy adjustment intensity S, and selects—with equal probability—either the Attraction Phase or the Collaboration Phase to execute. After each strategy update, a greedy selection mechanism is applied to update both the individual and global best solutions. The process continues until the maximum number of evaluations is reached, ultimately outputting the historical optimal solution. The overall framework of the algorithm, including its pseudocode and flowchart, is presented in Algorithm 1 and Figure 4.
| Algorithm 1 Pseudocode of MGOA |
| Set parameters N, FEsmax, lb, ub, nD, fobj; Initialize population positions X randomly within [lb, ub]; Evaluate fitness values for all solutions; Determine the best solution Posbest and best fitness Fitbest; Initialize convergence curve cg; |
| For FEs = 1 : maxFEs |
| Calculate strategy adjustment parameter S by Equation (5); |
| If rand < 0.5 |
| For i = 1 : N |
| Randomly select dimensions by Equation (6); |
| For each selected dimension j |
| Position update according to the exploration strategy by Equation (7); |
| End For |
| Apply boundary constraints; |
| End For |
| Else |
| For i = 1 : N |
| Randomly select two solutions from population; |
| Position update according to the exploitation strategy by Equation (8); |
| Apply boundary constraints; |
| End For |
| End If |
| For i = 1 : N |
| Evaluate new fitness value; |
| If new fitness is better than current fitness |
| Update current solution and fitness; |
| If new fitness is better than global best fitness |
| Update global best position by Equation (9); |
| Update global best fitness by Equation (11); |
| End If |
| End If |
| End For |
| Record current best fitness in convergence curve; |
| End For |
| Return bestfit, bestpos, cg; |
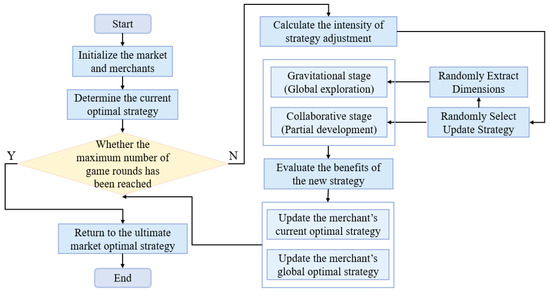
Figure 4.
Overall Algorithm Flow.
4. Experiment and Analysis
To demonstrate the advantages and characteristics of MGOA, this study employs behavioral and visual analysis and parameter configuration experiments to illustrate the algorithm’s optimization capability. Subsequently, a multi-dimensional performance comparison is conducted against ten well-established metaheuristic algorithms on the CEC2017 benchmark, highlighting the superior performance of MGOA. Furthermore, comparative experiments involving ten state-of-the-art enhanced algorithms on CEC2022 and 11 real-world engineering problems are carried out, providing dual validation of MGOA’s applicability and potential in both benchmark testing and practical optimization scenarios.
4.1. Computing Environment
To ensure the fairness and repeatability of the experiments, all experiments in this paper were conducted in a unified environment. The experimental configuration is detailed in Table 2.
Table 2.
Configuration Instructions.
4.2. Behavioral and Visual Analysis
This section employs 8 classic benchmark functions to design four experiments for the behavioral and visual analysis of MGOA. First, the distribution of the optimal merchant strategies within the solution space of MGOA is analyzed to visualize the search strategy characteristics of merchants. The historical trajectories of marketing strategy searches are recorded by tracking the position of the optimal marketing strategy in each iteration. Additionally, an experiment on business strategy evolution is designed by documenting the best business strategy at every iteration. Then, to examine the overall iterative trend of the algorithm, the fitness value of the best solution after each iteration is recorded, and a convergence curve experiment is constructed. Finally, to analyze the variation trend of the fitness value over iterations, a fitness value change experiment is designed by logging the best fitness value after each update.
Figure 5 presents the results of MGOA on the four qualitative experiments described above. Specifically, Figure 5a illustrates the 3D spatial distribution of all solutions for each benchmark function, while Figure 5b depicts the two-dimensional distribution of the MGOA search history. It can be observed that a small number of historical best solutions are scattered across the solution space, while the majority cluster around the global optimum—particularly evident in functions F1, F3, F7, F11, and F13. This indicates that MGOA is capable of rapidly identifying near-optimal solutions within the solution space and transitioning earlier into the exploitation phase, thereby enhancing solution accuracy.
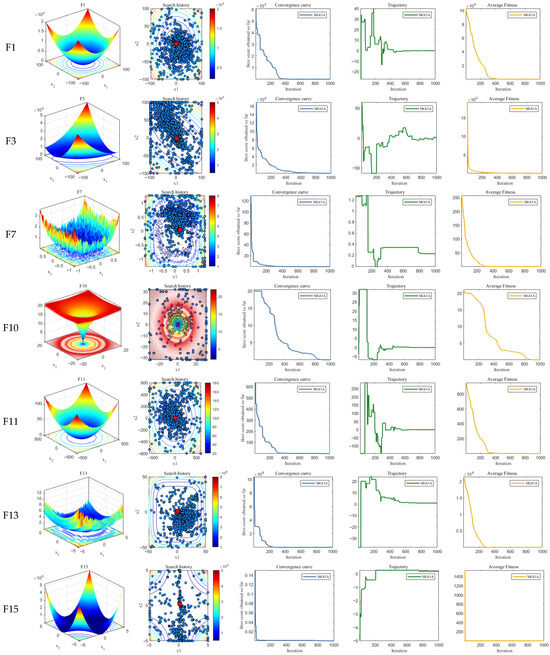
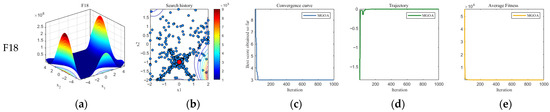
Figure 5.
Behavioral and Visual Analysis of Experimental Results. (a) Function Rendering; (b) Search History; (c) Convergence Curve; (d) Trajectory; (e) Average Fitness. The red circles indicate the location of the optimal solution.
Figure 5c tracks the convergence behavior of MGOA throughout the iterative process. For most test functions, MGOA consistently improves solution quality as iterations proceed without becoming trapped in local optima. This holds true not only for unimodal functions such as F1 and F3 but also for complex multimodal and composite functions like F10 and F11. Through the synergistic effect of the attraction phase and the cooperation phase, MGOA conducts incremental search and refinement during iterations, effectively avoiding local optima.
As shown in Figure 5d, due to the influence of the attraction phase in the early search stages, MGOA exhibits relatively large search step sizes in functions such as F1, F3, F10, F11, and F13. This characteristic facilitates escaping local optima and locating the global optimum. In later iterations, the cooperation phase plays a critical role by reducing step sizes, which contributes to refining the accuracy of the best solution.
Figure 5e records the best fitness value of MGOA after each iteration. It can be seen that the fitness values fluctuate to some extent across iterations, which stems from merchants’ active strategy adjustments during updates. This behavior confirms the effectiveness of the algorithm in dynamically exploring optimal solutions and aligns with its intended design.
In summary, MGOA not only demonstrates the ability to quickly converge to near-global optima and focus on intensive exploitation for improved precision but also actively alters search positions during updates. This enhances global exploration capability and the capacity to escape local optima, all while maintaining competitive convergence speed.
4.3. Strategy Coefficient and Dimension Selection Analysis
The CEC2017 benchmark set [38] comprises a heterogeneous suite of test functions, including both unimodal and multimodal problems. These functions exhibit non-homogeneous properties—such as non-separability, robustness, and rotational invariance—enabling a comprehensive evaluation of an algorithm’s adaptability across diverse search environments. This benchmark has become a well-established standard for assessing the robustness and efficiency of optimization methods. In the performance evaluation experiments, the population size is set to 50, the maximum number of iterations is 5000, and 50 independent runs are conducted in parallel. Table 3 presents all function suites within the CEC2017 test set.
Table 3.
CEC2017 Test Table.
In this section, we vary the value of parameter in CEC 2017—introduced in Section 3.2 as the decay coefficient for strategy adjustment, which significantly influences the overall precision and stability of the algorithm. Experiments are conducted with set to 1, 3, 5, 7, and 10, respectively, and compared with the original configuration, where , to illustrate the impact of parameter variation on the performance of MGOA.
As illustrated in Figure 6, the value of α directly affects the behavior of the adjustment intensity . A constant value of indicates that the algorithm is conducting intensive exploitation around the current best solution, while a decreasing suggests broader exploration. Therefore, plays a critical role in directly governing the balance between exploration and exploitation, making appropriate selection essential. It can be observed that as the number of iterations increases, gradually stabilizes when or 10. For or 5, although exhibits mild fluctuations, the amplitude remains limited. Only when does demonstrate significant and persistent oscillations, indicating that a balance between exploration and exploitation has been achieved.
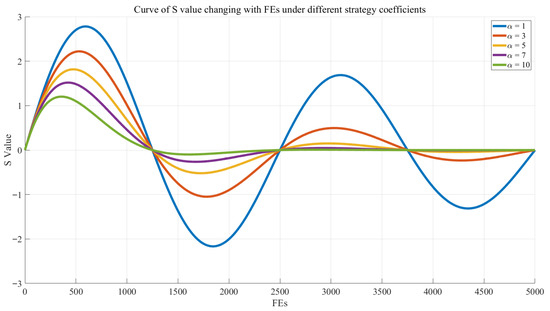
Figure 6.
The Influence of Value on the Adjustment Strength .
Table 4 presents the comparative results and rankings of different parameter configurations on the CEC2017 benchmark suite under 100-dimensional settings. Among these, bold text indicates the optimal result. MGOA (with ) achieves the highest overall ranking, and its average rank is superior to those of algorithms with other parameter values. This indicates that MGOA (with ) does not exhibit inferior performance in optimization tasks.
Table 4.
Comparison Results and Ranking of α Parameters of MGOA.
Figure 7 similarly displays the ranking performance of various α values across different benchmark functions. Darker, nearly black shades indicate higher algorithm rankings under the corresponding parameter, whereas lighter, orange-like shades correspond to lower ranks. It can be observed that MGOA (with ) achieves the highest number of first-place rankings—prevailing in 16 out of 30 functions—significantly outperforming all other parameter configurations.
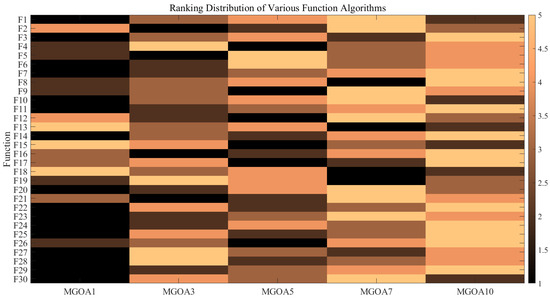
Figure 7.
Heatmap of the Ranks for Different Alpha Values Across Test Functions.
Therefore, based on comprehensive consideration of algorithmic accuracy and stability, the decay coefficient is set to 1 in this study.
After that, this study selects MGOA (with ) for a qualitative analysis of dimension selection, setting D to 1, 3, 5, 7, and 10. As can be seen in Table 5, when the dimension selection ranges from 1 to 5, the algorithm performance improves, and when it ranges from 5 to 10, it starts to deteriorate, but it is still better than when the selection is small. In addition, MGOA (with ) has the lowest Friedman ranking, ranking first, indicating that dimension is not always better when it is larger. In addition, the methodology shows that it is related to the problem dimension. Therefore, the key to improving performance is to reasonably select a moderate number of algorithm dimensions. The number of dimensions extracted was 5 in this study.
Table 5.
Comparison Results and Ranking of Dimension Selection of MGOA.
4.4. Exploration and Development Evaluation
MGOA optimizes market strategies by balancing exploration and exploitation behaviors among merchant agents through the alternating execution of an attraction phase and a cooperation phase. To quantitatively assess the algorithm’s exploration–exploitation tendency, we track the dynamic variation in components across dimensions to quantify its search behavior. The exploration–exploitation balance is evaluated using the following formula:
Figure 8 shows that as iterations proceed, the exploration curve gradually declines, while the exploitation curve rises and eventually approaches 100%. This trend indicates that the algorithm initially emphasizes exploration and progressively shifts its focus toward exploitation, refining local solutions as the search continues. Through this dynamic balance, MGOA effectively integrates global search with local refinement, thereby converging toward an optimal market strategy.
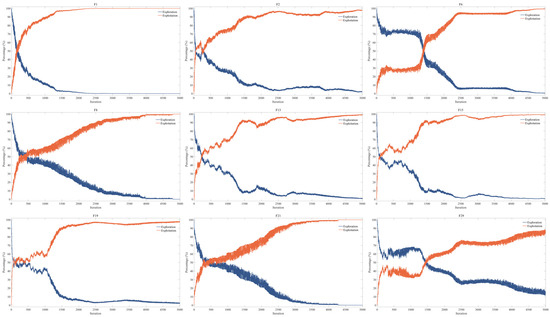
Figure 8.
Exploration and Development Assessment Results.
4.5. Comparison of Mature Algorithms
Subsequently, this study compares MGOA against several established and recently proposed metaheuristic algorithms on the CEC2017 benchmark to validate its effectiveness. The compared algorithms include four highly cited classical methods: Whale Optimization Algorithm (WOA) [39], Harris Hawks Optimization (HHO) [40], Aquila Optimizer (AO) [41], and Dung Beetle Optimizer (DBO) [42]; four mature algorithms published in 2024: Black-Winged Kite Algorithm (BKA) [43], Newton-Raphson-Based Optimizer (NRBO) [44], Information Acquisition Optimizer (IAO) [45], and Bermuda Triangle Optimizer (BTO) [46]; and two latest high-performance algorithms published in 2025: Tornado Optimizer with Coriolis (TOC) [47] and Chinese Pangolin Optimizer (CPO) [48].
To ensure reproducibility, Table 6 summarizes the initial parameter configurations for all algorithms involved (excluding adaptive parameters, only fixed parameters are used).
Table 6.
Initial Parameter Settings of Algorithms.
According to the results presented in Table 7, the classical algorithms perform well on unimodal functions but exhibit significant performance divergence on complex multimodal and hybrid functions. Some algorithms, such as BTO, even suffer a drastic decline in solution quality by several orders of magnitude in certain cases. Within this context, MGOA demonstrates comprehensive and superior performance: it achieves the theoretical optimal values on functions F1, F2, F3, F4, and F9, indicating perfect convergence capability. Moreover, it consistently yields the lowest mean values or ranks among the top performers across the majority of the remaining functions, highlighting exceptional stability and robustness. These results strongly validate the powerful global exploration and local exploitation capabilities of MGOA.
Table 7.
Result of Mean Value of CEC2017 Dim 10.
According to Table 8, where the test dimension of CEC2017 is increased to 30, MGOA continues to demonstrate comprehensive and superior performance. It not only exhibits outstanding global optimization capability, reliably locating the global optimal region, but also maintains high convergence speed and exceptional stability.
Table 8.
Result of Mean Value of CEC2017 Dim 30.
As shown in Table 9, with the test dimension further raised to 50, MGOA consistently retains top-tier performance. Its powerful global exploration ability enables it to effectively escape local optima and approach the true global optimum, reflecting an excellent balance between broad search coverage and precise local exploitation.
Table 9.
Result of Mean Value of CEC2017 Dim 50.
Based on Table 10, where the dimension is elevated to 100, MGOA achieves optimal or near-optimal results stably across the majority of test functions. Its remarkable convergence accuracy, robustness, and reliability fully validate the significant advantages in both global exploration and local exploitation capabilities. Figure 9 displays selected convergence behaviors under the 100-dimensional CEC2017 benchmark. The dark blue curve represents MGOA, which demonstrates rapid convergence in the early stages on functions such as F11, F14, F18, F21, and F30, while significantly outperforming other comparative algorithms in later-phase exploitation, underscoring its competitiveness among state-of-the-art methods.
Table 10.
Result of Mean Value of CEC2017 Dim 100.
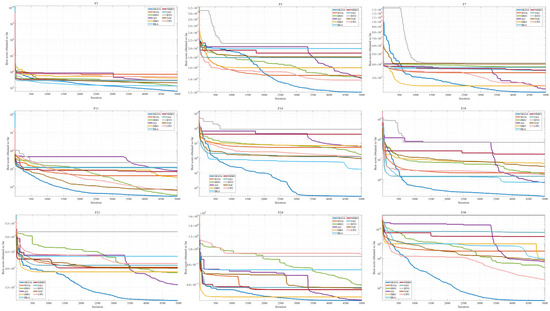
Figure 9.
Convergence Curves of Various Algorithms in CEC2017 Dim 100.
As observed in Figure 10, MGOA converges to the optimal value in nearly all test functions except F30, where it exhibits relatively high fluctuation variance. Its consistently low mean values across the benchmark illustrate its powerful global optimization capability.
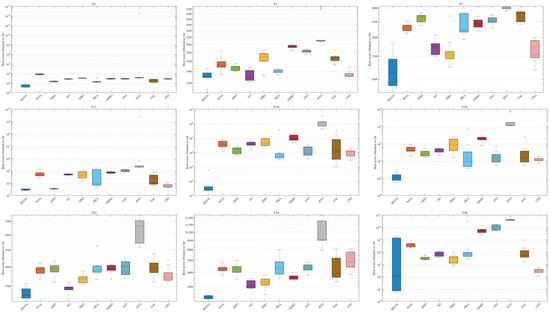
Figure 10.
CEC2017 Dim 100 Box Plots of Algorithms.
Figure 11 presents the average computation time of each algorithm. The most notable trend is that IAO requires significantly more time than the others. Algorithms such as CPO, NRBO, and MGOA show noticeably lower computational costs, with MGOA achieving the shortest average time, indicating relatively high efficiency.
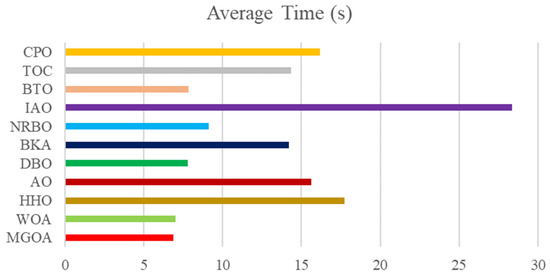
Figure 11.
Mean Computing Time of Each Algorithm in CEC2017 Dim 100.
Table 11 reports the outcomes of the Wilcoxon rank-sum test on the CEC2017 benchmark suite (10 dimensions), conducted at the 95% confidence level (α = 0.05). In this table, the symbol “+” indicates that the reference algorithm MGOA performs significantly better than its counterpart, “−” denotes significantly worse performance, and “=” reflects no statistically significant difference. Inspection of the summary row reveals a striking pattern: against HHO, NRBO, and BTO, MGOA achieves superiority across all 30 test functions (30/0/0). When compared with WOA and TOC, only a single function in each case fails to reach statistical significance (29/1/0). Similarly, MGOA demonstrates a clear advantage over CPO and BKA (28/2/0 and 27/3/0, respectively). Even in comparison with AO, the results (26/4/0) remain dominated by positive outcomes. By contrast, modest instability emerges in the cases of DBO and IAO, where a handful of unfavorable instances are observed (23/6/1 and 5/24/1, respectively)—the only two columns in the table containing “−,” with IAO characterized primarily by ties. Coupled with the prevalence of exceedingly small p-values across individual functions (e.g., 1.83 × 10⁻⁴), these findings substantiate the conclusion that, on the 30 test functions of CEC2017, MGOA consistently exhibits statistically significant superiority over the majority of competing algorithms. The exceptions lie in its comparisons with IAO, where ties predominate, and with DBO, where occasional disadvantages arise. Results for other dimensional settings are provided in Appendix B. Taken together, the scarcity of “−” outcomes and the predominance of “+” and “=” outcomes underscore that MGOA’s performance is, in most cases, not inferior to—and frequently superior to—that of the other algorithms.
Table 11.
Wilcoxon Test of Various Algorithms in CEC2017 Dim 10.
Figure 12 displays the Friedman mean rankings of the algorithms across different dimensions (10, 30, 50, and 100), highlighting their relative performance under various settings. MGOA consistently maintains favorable rankings across all dimensions, demonstrating outstanding stability and efficiency. It achieves competitive rankings while retaining low computational time, particularly in the 100-dimensional case. In contrast, other algorithms such as IAO and BTO exhibit considerable volatility. These results distinguish MGOA as the most balanced and efficient algorithm overall, excelling in both time complexity and dimensional scalability.
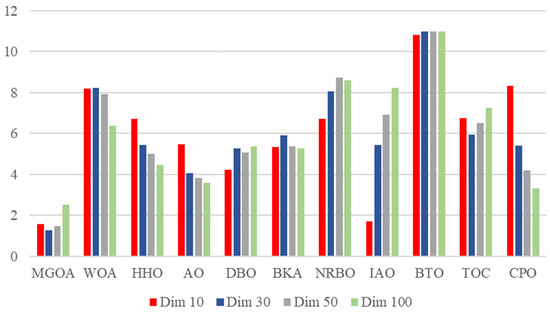
Figure 12.
CEC2017 Friedman Mean Ranking of Each Algorithm in Each Dimension.
4.6. Comparison of Advanced Improved Algorithms
Subsequently, this study evaluates MGOA against ten recently published improved algorithms on the CEC2022 (shown in Table 12) benchmark to further verify its efficiency and advanced performance [49]. The compared algorithms include: Multi-population mutative moth-flame optimization algorithm (MM_MFO) [50], Dung Beetle Optimization Algorithm Based on Improved Multi-Strategy Fusion (MSFDBO) [51], Enhanced gorilla troops optimizer (EGTO) [52], Hybrid constriction coefficient-based PSO and gravitational search algorithm (CPSOGSA) [53], Black-winged kite algorithm fused with osprey (OCBKA) [54], Improved RIME (IRIME) [55], Enhanced adaptive butterfly optimization algorithm (EABOA) [56], Hybrid whale optimization algorithm (hGWOA) [57], ESHO benchmarks for hyperthermia therapy optimization (ESHO) [58], and Enhanced walrus optimization algorithm (EWO) [59].
Table 12.
CEC2022 Test Table.
According to the results in Table 13 and Figure 13, MGOA demonstrates comprehensive and superior performance: it achieves better mean values than other state-of-the-art improved algorithms on functions F1, F2, F3, F6, F7, F9, and F11, while matching their convergence speed. These results reflect its well-balanced global exploration and local exploitation capabilities.
Table 13.
Result of Mean Value of CEC2022 Dim 20.
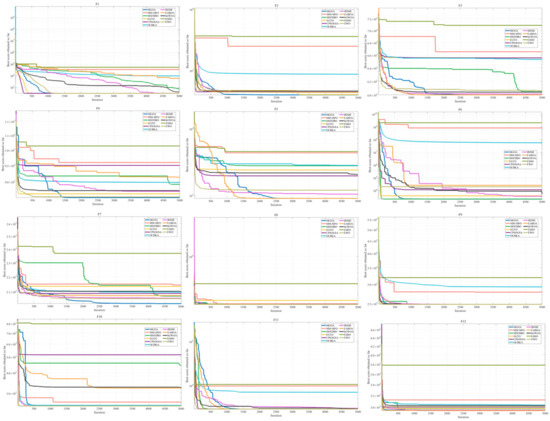
Figure 13.
Convergence Curves of Various Algorithms in CEC2022 Dim 20.
As illustrated in Figure 14, MGOA attains the lowest mean values and standard deviations in almost every test function. This consistent advantage over advanced improved algorithms confirms MGOA’s strong capability in handling robustness and sensitivity challenges.
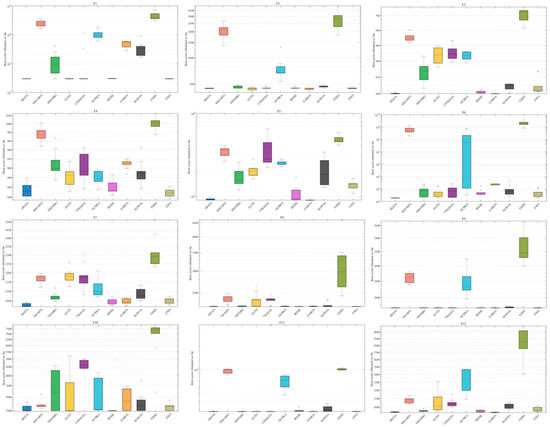
Figure 14.
CEC2022 Dim 20 Box Plots of Various Algorithms.
Table 14 reports the results of the Wilcoxon rank-sum test on the CEC2022 benchmark (20 dimensions) at the 95% significance level (α = 0.05). In the table, “+” indicates that the reference algorithm, MGOA, is significantly superior to the comparator; “−” indicates it is significantly inferior; and “=” denotes no statistically significant difference. The aggregate statistics in the final row reveal that MGOA attains a 12/0/0 record against ESHO, reflecting the most consistent and pronounced overall advantage. Against hGWOA, MM_MFO, MSFDBO, OCBKA, and EWO, the tallies are 10/2/0, 11/1/0, 10/2/0, 10/2/0, and 7/4/1, respectively—outcomes dominated by “+,” with relatively few ties. Results against CPSOGSA and IRIME are 9/3/0, with no losses; versus EGTO, 7/4/1, with only a single significant loss; and against EABOA, 5/5/2, which yields the greatest number of ties and two losses, marking it as the most challenging competitor. Examination of the per-function p-values shows that most entries lie well below the 0.05 threshold (e.g., the many 1.83e−4 values in F3–F7 and F12), corroborating these significance claims; several functions (e.g., F1 and F8–F10) exhibit more “=” outcomes, indicating negligible differences. The few defeats arise primarily on F3 and F5 versus EABOA, on F11 versus EGTO, and on F10 versus EWO. Taken together, the scarcity of “−” outcomes and the preponderance of “+” and “=” indicate that, across the 12 CEC2022 test functions, MGOA is generally not inferior to—and often significantly better than—most state-of-the-art enhanced algorithms.
Table 14.
Wilcoxon Test of Various Algorithms in CEC2022 Dim 20.
Figure 15 illustrates the computational time complexity of MGOA compared to state-of-the-art improved algorithms. It can be observed that MGOA achieves the lowest average computational time. Combined with its previously demonstrated superior performance, these results indicate that MGOA is not only conceptually concise but also a highly powerful metaheuristic algorithm.
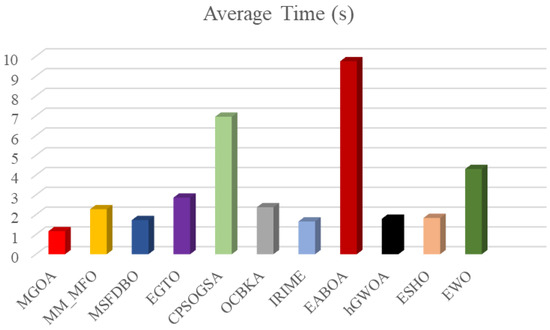
Figure 15.
CEC2022 Dim 20 Mean Computing Time of Each Algorithm.
4.7. Practical Engineering Design Issues
Engineering design optimization problems aim to achieve optimal system performance through mathematical modeling and algorithmic solutions while satisfying physical constraints and performance metrics. To validate the effectiveness of the proposed method, this subsection employs 11 engineering design problems, systematically recording statistical metrics—including best value, mean value, and standard deviation—for each algorithm.
4.7.1. Tension/Compression Spring Design Problem
The tension/compression spring design problem aims to minimize the weight of a spring under constraints of minimum deflection, surge frequency, and shear stress. As illustrated in Figure 16, the problem involves three continuous decision variables: wire diameter (d), mean coil diameter (D), and number of active coils (P). The mathematical formulation is provided in Appendix A.1.
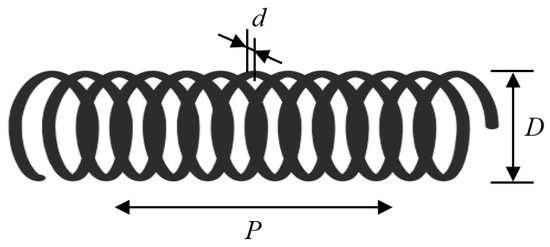
Figure 16.
Tension/Compression Spring Design Problem.
As shown in Table 15, which presents the statistical results of the tension/compression spring design problem, MGOA achieves the minimum values in both the best and mean result categories, along with the smallest standard deviation. This indicates that MGOA can rapidly converge to the optimal solution for this problem, demonstrating superior performance compared to other algorithms and highlighting its effectiveness in addressing the tension/compression spring design challenge.
Table 15.
Statistical Results of Tension/Compression Spring Design Problems.
4.7.2. Pressure Vessel Design Problem
The objective of the pressure vessel design problem is to minimize the total cost, which includes material, forming, and welding costs. As shown in Figure 17, the cylindrical pressure vessel is sealed at both ends with hemispherical heads. This optimization problem involves four decision variables: shell thickness (Ts), head thickness (Th), inner radius (R), and the length of the cylindrical section (L). The mathematical model is provided in Appendix A.2.
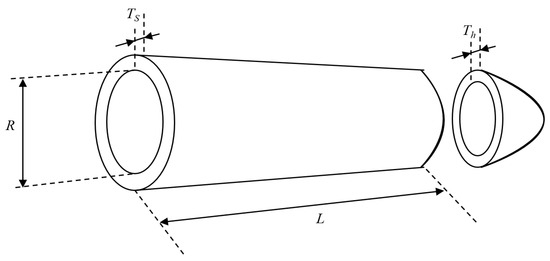
Figure 17.
Pressure Vessel Design Problem.
As can be seen from Table 16, MGOA achieves the lowest values in both the best and mean results, along with the smallest standard deviation, indicating the minimal optimized cost. These results demonstrate that MGOA exhibits higher stability in locating the optimal solution, which has positive implications for this practical application.
Table 16.
Statistical Results of Pressure Vessel Design Problem.
4.7.3. Three-Bar Truss Design Problem
The objective of the three-bar truss design problem is to minimize the volume of a truss structure by adjusting the cross-sectional areas (x1 and x2). The truss is subject to stress constraints (σ) on each structural member, as illustrated in Figure 18. This optimization problem involves one nonlinear fitness function, three nonlinear inequality constraints, and two continuous decision variables. The mathematical formulation is provided in Appendix A.3.
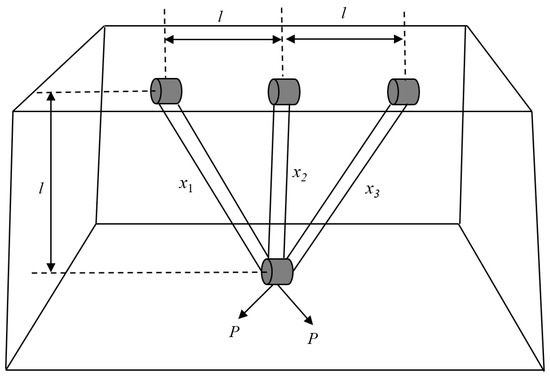
Figure 18.
Three-bar Truss Design Problem.
As shown in Table 17, MGOA again ranks first with particularly notable performance—its standard deviation of zero far surpasses that of other algorithms, maintaining a significant advantage. These results confirm MGOA’s exceptional stability and superior performance, consistently enabling precise convergence to the global optimum for this problem.
Table 17.
Statistical Results of Three-bar Truss Design Problem.
4.7.4. Welded Beam Design Problem
As depicted in Figure 19, the welded beam structure consists of a beam and welded connections. The design is constrained by multiple factors, including shear stress, bending stress in the beam, buckling load on the bar, and end deflection of the beam. Solving this problem requires identifying an optimal combination of the following structural parameters: weld thickness (h), clamped bar length (L), bar height (t), and bar thickness (b). These variables are represented as a vector x = [x1, x2, x3, x4], where x1 to x4 correspond to h, L, t, and b, respectively. The mathematical model is detailed in Appendix A.4.
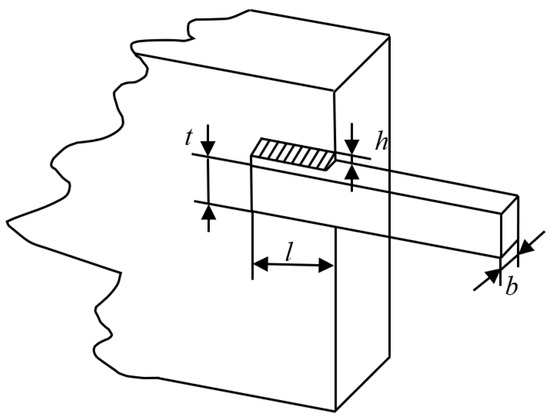
Figure 19.
Welded Beam Design Problem.
Table 18 demonstrates that MGOA achieves the best results in terms of both the best and mean values, while ranking third in standard deviation, behind EABOA and EWO. However, the computational time complexity of MGOA is considerably lower than that of EABOA and EWO, particularly significantly lower than EABOA. Moreover, the standard deviation of MGOA is only marginally larger than that of EABOA and EWO, indicating that MGOA is capable of rapidly converging to high-quality solutions within a short timeframe.
Table 18.
Statistical Results of Welded Beam Design Problem.
4.7.5. Speed Reducer Design Problem
The speed reducer design problem involves seven design variables: face width (b), gear module (m), number of gear teeth (p), length of the first shaft between bearings (l1), length of the second shaft between bearings (l2), diameter of the first shaft (d1), and diameter of the second shaft (d2). The primary objective is to minimize the total weight of the speed reducer while satisfying constraints including bending stress of the gear teeth, surface contact stress, transverse deflection of the shafts, and stress in the shafts. The mathematical model is provided in Appendix A.5.
As illustrated in Table 19, the method achieves optimal results in both the best and mean value categories, while ranking closely behind EABOA and EWO in standard deviation. Notably, the disadvantage of MGOA in standard deviation is substantially outweighed by its significant advantage in computational time complexity compared to EABOA and EWO. These outcomes indicate that MGOA maintains its lightweight characteristic while simultaneously delivering competitive stability.
Table 19.
Statistical Results of Speed Reducer Design Problem.
4.7.6. Gear Train Design Problem
The gear train design problem represents a practical optimization challenge in mechanical engineering with no additional constraints, making it relatively straightforward. The goal is to minimize the specific transmission cost of the gear train. The variables are the number of teeth of four gears: Na (x1), Nb (x2), Nd (x3), and Nf (x4). The mathematical formulation is described in Appendix A.6.
As shown in Table 20, MGOA ranks second—behind only ESHO—in terms of both the mean and the standard deviation. This is attributable to the stringent constraints and quasi-discrete nature of the gear-train design. MGOA’s exploration-oriented updates may overshoot the narrow feasible region near the optimum, occasionally yielding near-feasible solutions and thereby increasing the mean and variance. In contrast, ESHO features a stronger late-stage exploitation or repair mechanism that better preserves feasibility and continues to refine solutions once ratios close to the optimum are identified. Nevertheless, MGOA also achieves the best-known optimum, indicating strong optimization capability and confirming its effectiveness for the gear system design problem.
Table 20.
Statistical Results of Gear Train Design Problem.
4.7.7. Cantilever Beam Design Problem
The cantilever beam consists of five hollow square sections, each defined by one structural parameter while maintaining a constant thickness, resulting in a total of five decision variables. The objective of the cantilever beam optimization is to minimize its total weight under the constraint of satisfying a specified vertical displacement limit. The mathematical formulation is provided in Appendix A.7.
As shown in Table 21, MGOA achieves a standard deviation of zero and the lowest optimized weight, reflecting ideal performance. These results demonstrate that MGOA can stably and efficiently address this engineering challenge, further confirming its excellence and precision in search capability.
Table 21.
Statistical Results of Cantilever Beam Design Problem.
4.7.8. Minimize I-Beam Vertical Deflection Problem
Minimizing the vertical deflection of an I-beam is a classical structural optimization problem. The main objective is to reduce the beam’s vertical deflection under load through optimal design of its cross-section and material properties. An I-beam, characterized by its I-shaped cross-section, typically consists of two flanges and a web. The beam is fixed at one end and subjected to concentrated or distributed loads at the other, leading to bending and vertical deflection. The goal is to design a beam that minimizes this deflection under applied loading. The mathematical model is described in Appendix A.8.
Table 22 shows that MGOA achieved the lowest values in terms of the best, mean, and standard deviation; however, the same results were also attained by MSFDBO and EABOA. Nevertheless, MGOA exhibited the shortest average computation time, demonstrating its lightweight nature, lower computational time complexity, and overall superior performance.
Table 22.
Statistical Results of Minimizing I-Beam Vertical Deflection Problem.
4.7.9. Tubular Column Design Problem
Tubular columns are typically hollow cylindrical structures used to support other components or resist bending. Since they primarily bear axial forces, these columns are susceptible to buckling, especially under high axial compression. Thus, the main objective in tubular column design is to prevent buckling under external loads while optimizing geometric dimensions—such as outer diameter and wall thickness—so that the structure can withstand design loads with minimal material cost. The mathematical model is provided in Appendix A.9.
As shown in Table 23, while MGOA, EGTO, EABOA, and EWO all achieved the same minimum values in terms of the best, mean, and standard deviation, MGOA demonstrated a consistently shorter average computation time compared to the other three algorithms. This advantage underscores MGOA’s lightweight nature, enabling it to rapidly converge to optimal solutions and effectively address the tubular column design problem.
Table 23.
Statistical Results of Tubular Column Design Problem.
4.7.10. Piston Lever Design Problem
The piston lever design problem is a mechanical optimization task aimed at developing an efficient and stable lever system to ensure desired force transmission while minimizing system size or material cost. A piston generates linear reciprocating motion via fluid pressure, and a lever is used to modify the magnitude and direction of this linear force—commonly applied in mechanical transmission, force amplification, or torque conversion. Designing such a system often involves optimizing lever dimensions within reasonable spatial and weight constraints to achieve required performance metrics such as force transmission, effectiveness, and stability. The mathematical formulation is described in Appendix A.10.
Table 24 indicates that MGOA secured the optimal best value, while it was only surpassed by MSFDBO and EABOA in the mean value, and by EABOA alone in standard deviation. Notably, the performance gaps in both the mean and standard deviation are minimal. Furthermore, MGOA exhibits slightly lower computational complexity than MSFDBO and significantly lower complexity compared to EABOA. Collectively, these findings affirm that MGOA—by virtue of its ability to identify optimal solutions with low time complexity—offers a meaningful contribution to addressing the piston lever design challenge.
Table 24.
Statistical Results of Piston Lever Design Problem.
4.7.11. Reinforced Concrete Beam Design Problem
This problem focuses on designing a reinforced concrete beam that meets strength, stiffness, and stability requirements while minimizing material consumption and cost, without compromising structural safety. A reinforced concrete beam combines two materials: concrete, which resists compressive stresses, and steel reinforcement, which bears tensile stresses. The design must ensure the beam can support design loads without failure or excessive deformation. Key variables include beam dimensions, amount and distribution of reinforcement, and concrete strength grade. The mathematical formulation is detailed in Appendix A.11.
Table 25 demonstrates that MGOA delivers performance comparable to EGTO, EABOA, and EWO, with all four algorithms achieving identical optimal results in terms of best, mean, and standard deviation values. Moreover, MGOA required the shortest computation time among all algorithms evaluated, underscoring its inherently lightweight architecture and low computational complexity. These attributes position MGOA as a viable and efficient solution for the reinforced concrete beam design problem.
Table 25.
Statistical Results of Reinforced Concrete Beam Design Problem.
5. Conclusions
The proposed high-performance algorithm, named the Market Game Optimization Algorithm (MGOA), draws inspiration from the competitive dynamics between merchants and customers and aims to solve complex real-world optimization problems. MGOA computationally models how merchants adapt their strategies in response to market changes and engage customers through attraction and collaboration. The algorithm is structured around two complementary stages, each activated with a 50% probability. In the first stage, extensive search and strategy adjustments are performed, while the second stage focuses on refining strategies based on customer feedback and coordination. This design introduces innovative behavioral inspiration and delivers highly efficient optimization performance. Qualitative analysis shows that the algorithm consistently converges toward the global optimum. Parameter analysis further identifies the optimal adjustment intensity for reacting to market volatility. In subsequent performance evaluations, MGOA was compared against 10 widely recognized algorithms and 10 recently enhanced variants, demonstrating superior effectiveness on unimodal, multimodal, hybrid, and composite functions from CEC benchmark suites. Finally, applications to 11 real-world engineering design problems confirm that MGOA achieves the most effective results in the majority of cases among all compared algorithms.
Therefore, the contributions of this work are threefold: (1) Its design inspiration stems from the intelligent behaviors of advanced biological entities, opening a novel and forward-looking heuristic design pathway in the field of optimization algorithms. (2) By incorporating the attraction and synergy mechanisms between merchants and customers, the algorithm achieves extensive exploration in the early iterations, thereby accelerating convergence, while focusing on refined exploitation in later phases to effectively avoid local optima. (3) In practical applications, MGOA exhibits superior solving efficiency and stability, contributing to the effective resolution of numerous real-world optimization problems. In addition, compared to traditional gradient-based methods, which rely heavily on gradient information and are often limited to differentiable objective functions, MGOA, as a gradient-free heuristic approach, demonstrates significant advantages in handling non-differentiable, highly nonlinear, or noisy problems. However, it should be noted that gradient-based methods may still achieve faster convergence on smooth and convex problems where explicit gradient information is available.
In summary, MGOA demonstrates exceptional global optimization capabilities. Future research directions could encompass the introduction of chaotic mechanisms to enhance its global exploration performance, the improvement of mutation strategies to strengthen its ability to escape local optima, or its integration with other intelligent behavioral models or advanced algorithms. After that, we will prioritize rigorous, head-to-head comparisons with leading CEC algorithms—such as EA4Eig, NL-SHADE-LBC, S-LSHADE-DP, and LSHADE-cnEpSin—under standardized benchmark settings and statistical testing (subject to the availability of verified implementations) to more comprehensively assess enhanced MGOA’s competitiveness. Such developments would further advance the emergence of powerful hybrid algorithms capable of efficiently handling large-scale complex optimization problems.
Author Contributions
Conceptualization, S.L. and Y.X.; methodology, S.L. and Y.X.; software, S.L. and Y.X.; validation, S.L. and X.G.; formal analysis, S.L. and Y.X.; investigation, X.G. and W.W.; resources, S.L. and X.G.; data curation, S.L. and Y.X.; writing—original draft preparation, S.L. and Y.X.; writing—review and editing, F.Z., A.Z. and W.W.; visualization, S.L. and Y.X.; supervision, F.Z. and A.Z.; project administration, F.Z. and A.Z.; funding acquisition, W.W., F.Z. and A.Z. All authors have read and agreed to the published version of the manuscript.
Funding
This work is supported by the subject of human resources and social security in Hebei Province (Grant No. JRSHZ-2025-01126).
Data Availability Statement
The original contributions presented in the study are included in the article, further inquiries can be directed to the corresponding author.
Acknowledgments
We would like to show our greatest appreciation to the anonymous reviewers, editor and those who have helped to contribute to the writing of this paper.
Conflicts of Interest
The authors declare no conflicts of interest.
Appendix A
Appendix A.1. Extension/Compression Spring Design Issues
Appendix A.2. Pressure Vessel Design Issues
Appendix A.3. Three-Bar Truss Design Problem
Appendix A.4. Welded Beam Design Issues
Appendix A.5. Reducer Design Issues
Appendix A.6. Gear Train Design Issues
Appendix A.7. Cantilever Beam Design Problems
Appendix A.8. Minimizing the Vertical Deflection of I-Beams
Appendix A.9. Tubular Column Design Issues
Appendix A.10. Piston Lever Design Issues
Appendix A.11. Design Problems of Reinforced Concrete Beams
Appendix B
Table A1.
Wilcoxon Test of Various Algorithms in CEC2017 Dim 30.
Table A1.
Wilcoxon Test of Various Algorithms in CEC2017 Dim 30.
| MGOA | WOA | HHO | AO | DBO | BKA | NRBO | IAO | BTO | TOC | CPO | |
|---|---|---|---|---|---|---|---|---|---|---|---|
| F1 | - | 1.83 × 10⁻⁴ (+) | 1.83 × 10⁻⁴ (+) | 1.83 × 10⁻⁴ (+) | 1.83 × 10⁻⁴ (+) | 1.83 × 10⁻⁴ (+) | 1.83 × 10⁻⁴ (+) | 1.83 × 10⁻⁴ (+) | 1.83 × 10⁻⁴ (+) | 1.83 × 10⁻⁴ (+) | 1.83 × 10⁻⁴ (+) |
| F2 | - | 1.83 × 10⁻⁴ (+) | 5.83 × 10⁻⁴ (+) | 1.83 × 10⁻⁴ (+) | 1.83 × 10⁻⁴ (+) | 1.83 × 10⁻⁴ (+) | 1.83 × 10⁻⁴ (+) | 1.83 × 10⁻⁴ (+) | 1.83 × 10⁻⁴ (+) | 1.83 × 10⁻⁴ (+) | 3.07 × 10⁻¹ (=) |
| F3 | - | 1.83 × 10⁻⁴ (+) | 1.83 × 10⁻⁴ (+) | 1.83 × 10⁻⁴ (+) | 1.83 × 10⁻⁴ (+) | 1.83 × 10⁻⁴ (+) | 1.83 × 10⁻⁴ (+) | 1.83 × 10⁻⁴ (+) | 1.83 × 10⁻⁴ (+) | 1.83 × 10⁻⁴ (+) | 1.83 × 10⁻⁴ (+) |
| F4 | - | 1.83 × 10⁻⁴ (+) | 5.83 × 10⁻⁴ (+) | 1.83 × 10⁻⁴ (+) | 1.31 × 10⁻³ (+) | 3.61 × 10⁻³ (+) | 1.83 × 10⁻⁴ (+) | 1.83 × 10⁻⁴ (+) | 1.83 × 10⁻⁴ (+) | 3.30 × 10⁻⁴ (+) | 1.71 × 10⁻³ (+) |
| F5 | - | 1.83 × 10⁻⁴ (+) | 1.83 × 10⁻⁴ (+) | 3.76 × 10⁻² (+) | 1.71 × 10⁻³ (+) | 7.69 × 10⁻⁴ (+) | 1.83 × 10⁻⁴ (+) | 1.83 × 10⁻⁴ (+) | 1.83 × 10⁻⁴ (+) | 1.83 × 10⁻⁴ (+) | 1.83 × 10⁻⁴ (+) |
| F6 | - | 1.83 × 10⁻⁴ (+) | 1.83 × 10⁻⁴ (+) | 1.83 × 10⁻⁴ (+) | 1.83 × 10⁻⁴ (+) | 1.83 × 10⁻⁴ (+) | 1.83 × 10⁻⁴ (+) | 1.83 × 10⁻⁴ (+) | 1.83 × 10⁻⁴ (+) | 1.83 × 10⁻⁴ (+) | 1.83 × 10⁻⁴ (+) |
| F7 | - | 1.83 × 10⁻⁴ (+) | 1.83 × 10⁻⁴ (+) | 1.01 × 10⁻³ (+) | 7.57 × 10⁻² (=) | 1.83 × 10⁻⁴ (+) | 1.83 × 10⁻⁴ (+) | 1.83 × 10⁻⁴ (+) | 1.83 × 10⁻⁴ (+) | 1.83 × 10⁻⁴ (+) | 1.83 × 10⁻⁴ (+) |
| F8 | - | 7.69 × 10⁻⁴ (+) | 3.12 × 10⁻² (+) | 4.73 × 10⁻¹ (=) | 1.01 × 10⁻³ (+) | 2.83 × 10⁻³ (+) | 1.83 × 10⁻⁴ (+) | 2.46 × 10⁻⁴ (+) | 1.83 × 10⁻⁴ (+) | 5.83 × 10⁻⁴ (+) | 2.46 × 10⁻⁴ (+) |
| F9 | - | 1.83 × 10⁻⁴ (+) | 1.83 × 10⁻⁴ (+) | 4.40 × 10⁻⁴ (+) | 4.59 × 10⁻³ (+) | 3.30 × 10⁻⁴ (+) | 1.83 × 10⁻⁴ (+) | 2.46 × 10⁻⁴ (+) | 1.83 × 10⁻⁴ (+) | 3.76 × 10⁻² (=) | 1.83 × 10⁻⁴ (+) |
| F10 | - | 2.83 × 10⁻³ (+) | 3.85 × 10⁻¹ (=) | 9.70 × 10⁻¹ (=) | 1.40 × 10⁻¹ (=) | 9.70 × 10⁻¹ (=) | 4.40 × 10⁻⁴ (+) | 4.27 × 10⁻¹ (=) | 1.83 × 10⁻⁴ (+) | 1.01 × 10⁻³ (+) | 6.23 × 10⁻¹ (=) |
| F11 | - | 2.46 × 10⁻⁴ (+) | 3.45 × 10⁻¹ (=) | 1.73 × 10⁻² (+) | 2.20 × 10⁻³ (+) | 6.40 × 10⁻² (=) | 1.83 × 10⁻⁴ (+) | 3.30 × 10⁻⁴ (+) | 1.83 × 10⁻⁴ (+) | 2.83 × 10⁻³ (+) | 5.21 × 10⁻¹ (=) |
| F12 | - | 1.83 × 10⁻⁴ (+) | 1.83 × 10⁻⁴ (+) | 1.83 × 10⁻⁴ (+) | 1.83 × 10⁻⁴ (+) | 1.83 × 10⁻⁴ (+) | 1.83 × 10⁻⁴ (+) | 1.83 × 10⁻⁴ (+) | 1.83 × 10⁻⁴ (+) | 1.83 × 10⁻⁴ (+) | 1.83 × 10⁻⁴ (+) |
| F13 | - | 1.83 × 10⁻⁴ (+) | 1.83 × 10⁻⁴ (+) | 1.83 × 10⁻⁴ (+) | 1.83 × 10⁻⁴ (+) | 1.83 × 10⁻⁴ (+) | 1.83 × 10⁻⁴ (+) | 1.83 × 10⁻⁴ (+) | 1.83 × 10⁻⁴ (+) | 1.83 × 10⁻⁴ (+) | 1.83 × 10⁻⁴ (+) |
| F14 | - | 1.83 × 10⁻⁴ (+) | 1.83 × 10⁻⁴ (+) | 1.83 × 10⁻⁴ (+) | 1.83 × 10⁻⁴ (+) | 4.40 × 10⁻⁴ (+) | 1.83 × 10⁻⁴ (+) | 5.80 × 10⁻³ (=) | 1.83 × 10⁻⁴ (+) | 2.46 × 10⁻⁴ (+) | 1.83 × 10⁻⁴ (+) |
| F15 | - | 1.83 × 10⁻⁴ (+) | 1.83 × 10⁻⁴ (+) | 1.83 × 10⁻⁴ (+) | 1.83 × 10⁻⁴ (+) | 1.83 × 10⁻⁴ (+) | 1.83 × 10⁻⁴ (+) | 1.83 × 10⁻⁴ (+) | 1.83 × 10⁻⁴ (+) | 1.83 × 10⁻⁴ (+) | 1.83 × 10⁻⁴ (+) |
| F16 | - | 1.83 × 10⁻⁴ (+) | 1.83 × 10⁻⁴ (+) | 3.30 × 10⁻⁴ (+) | 1.83 × 10⁻⁴ (+) | 4.40 × 10⁻⁴ (+) | 1.83 × 10⁻⁴ (+) | 1.01 × 10⁻³ (+) | 1.83 × 10⁻⁴ (+) | 1.83 × 10⁻⁴ (+) | 1.83 × 10⁻⁴ (+) |
| F17 | - | 4.40 × 10⁻⁴ (+) | 7.69 × 10⁻⁴ (+) | 2.57 × 10⁻² (+) | 1.31 × 10⁻³ (+) | 1.73 × 10⁻² (+) | 1.01 × 10⁻³ (+) | 6.78 × 10⁻¹ (=) | 1.83 × 10⁻⁴ (+) | 2.46 × 10⁻⁴ (+) | 2.46 × 10⁻⁴ (+) |
| F18 | - | 1.83 × 10⁻⁴ (+) | 1.83 × 10⁻⁴ (+) | 1.83 × 10⁻⁴ (+) | 1.83 × 10⁻⁴ (+) | 1.83 × 10⁻⁴ (+) | 1.83 × 10⁻⁴ (+) | 1.83 × 10⁻⁴ (+) | 1.83 × 10⁻⁴ (+) | 1.83 × 10⁻⁴ (+) | 1.83 × 10⁻⁴ (+) |
| F19 | - | 1.83 × 10⁻⁴ (+) | 1.83 × 10⁻⁴ (+) | 1.83 × 10⁻⁴ (+) | 1.83 × 10⁻⁴ (+) | 1.83 × 10⁻⁴ (+) | 1.83 × 10⁻⁴ (+) | 1.40 × 10⁻² (+) | 1.83 × 10⁻⁴ (+) | 1.83 × 10⁻⁴ (+) | 1.83 × 10⁻⁴ (+) |
| F20 | - | 1.83 × 10⁻⁴ (+) | 1.83 × 10⁻⁴ (+) | 3.61 × 10⁻³ (+) | 2.20 × 10⁻³ (+) | 3.30 × 10⁻⁴ (+) | 1.83 × 10⁻⁴ (+) | 4.59 × 10⁻³ (+) | 1.83 × 10⁻⁴ (+) | 2.46 × 10⁻⁴ (+) | 1.83 × 10⁻⁴ (+) |
| F21 | - | 1.83 × 10⁻⁴ (+) | 1.83 × 10⁻⁴ (+) | 1.01 × 10⁻³ (-) | 1.83 × 10⁻⁴ (+) | 1.83 × 10⁻⁴ (+) | 1.83 × 10⁻⁴ (+) | 1.83 × 10⁻⁴ (+) | 1.83 × 10⁻⁴ (+) | 3.30 × 10⁻⁴ (+) | 1.83 × 10⁻⁴ (+) |
| F22 | - | 1.71 × 10⁻³ (+) | 3.12 × 10⁻² (-) | 4.73 × 10⁻¹ (=) | 3.07 × 10⁻¹ (=) | 1.13 × 10⁻² (+) | 1.04 × 10⁻¹ (=) | 1.62 × 10⁻¹ (=) | 1.83 × 10⁻⁴ (+) | 5.83 × 10⁻⁴ (+) | 1.83 × 10⁻⁴ (+) |
| F23 | - | 1.83 × 10⁻⁴ (+) | 1.83 × 10⁻⁴ (+) | 1.31 × 10⁻³ (+) | 1.71 × 10⁻³ (+) | 1.83 × 10⁻⁴ (+) | 1.83 × 10⁻⁴ (+) | 1.83 × 10⁻⁴ (+) | 1.83 × 10⁻⁴ (+) | 1.83 × 10⁻⁴ (+) | 1.83 × 10⁻⁴ (+) |
| F24 | - | 1.83 × 10⁻⁴ (+) | 1.83 × 10⁻⁴ (+) | 3.30 × 10⁻⁴ (+) | 5.83 × 10⁻⁴ (+) | 1.83 × 10⁻⁴ (+) | 1.83 × 10⁻⁴ (+) | 1.83 × 10⁻⁴ (+) | 1.83 × 10⁻⁴ (+) | 1.83 × 10⁻⁴ (+) | 1.83 × 10⁻⁴ (+) |
| F25 | - | 1.83 × 10⁻⁴ (+) | 2.20 × 10⁻³ (-) | 2.20 × 10⁻³ (+) | 4.59 × 10⁻³ (+) | 1.83 × 10⁻⁴ (+) | 1.83 × 10⁻⁴ (+) | 1.83 × 10⁻⁴ (+) | 1.83 × 10⁻⁴ (+) | 1.83 × 10⁻⁴ (+) | 3.30 × 10⁻⁴ (+) |
| F26 | - | 2.11 × 10⁻² (+) | 2.20 × 10⁻³ (+) | 7.57 × 10⁻² (=) | 2.11 × 10⁻² (+) | 1.83 × 10⁻⁴ (+) | 2.20 × 10⁻³ (+) | 2.20 × 10⁻³ (+) | 1.83 × 10⁻⁴ (+) | 1.83 × 10⁻⁴ (+) | 1.73 × 10⁻² (+) |
| F27 | - | 1.83 × 10⁻⁴ (+) | 1.83 × 10⁻⁴ (+) | 3.30 × 10⁻⁴ (+) | 4.40 × 10⁻⁴ (+) | 1.83 × 10⁻⁴ (+) | 1.83 × 10⁻⁴ (+) | 3.30 × 10⁻⁴ (+) | 1.83 × 10⁻⁴ (+) | 1.83 × 10⁻⁴ (+) | 1.83 × 10⁻⁴ (+) |
| F28 | - | 3.30 × 10⁻⁴ (+) | 6.40 × 10⁻² (=) | 2.11 × 10⁻² (+) | 3.30 × 10⁻⁴ (+) | 7.69 × 10⁻⁴ (+) | 1.83 × 10⁻⁴ (+) | 1.83 × 10⁻⁴ (+) | 1.83 × 10⁻⁴ (+) | 1.31 × 10⁻³ (+) | 6.78 × 10⁻¹ (=) |
| F29 | - | 1.83 × 10⁻⁴ (+) | 3.30 × 10⁻⁴ (+) | 1.83 × 10⁻⁴ (+) | 1.83 × 10⁻⁴ (+) | 1.83 × 10⁻⁴ (+) | 1.83 × 10⁻⁴ (+) | 2.46 × 10⁻⁴ (+) | 1.83 × 10⁻⁴ (+) | 1.83 × 10⁻⁴ (+) | 1.83 × 10⁻⁴ (+) |
| F30 | - | 1.83 × 10⁻⁴ (+) | 1.83 × 10⁻⁴ (+) | 1.83 × 10⁻⁴ (+) | 3.30 × 10⁻⁴ (+) | 1.83 × 10⁻⁴ (+) | 1.83 × 10⁻⁴ (+) | 5.83 × 10⁻⁴ (+) | 1.83 × 10⁻⁴ (+) | 2.46 × 10⁻⁴ (+) | 1.83 × 10⁻⁴ (+) |
| Total +/=/− | - | 30/0/0 | 25/3/2 | 24/5/1 | 27/3/0 | 28/2/0 | 29/1/0 | 26/4/0 | 30/0/0 | 29/1/0 | 26/4/0 |
Table A2.
Wilcoxon Test of Various Algorithms in CEC2017 Dim 50.
Table A2.
Wilcoxon Test of Various Algorithms in CEC2017 Dim 50.
| MGOA | WOA | HHO | AO | DBO | BKA | NRBO | IAO | BTO | TOC | CPO | |
|---|---|---|---|---|---|---|---|---|---|---|---|
| F1 | - | 1.83 × 10⁻⁴ (+) | 1.83 × 10⁻⁴ (+) | 1.83 × 10⁻⁴ (+) | 1.31 × 10⁻³ (+) | 1.83 × 10⁻⁴ (+) | 1.83 × 10⁻⁴ (+) | 1.83 × 10⁻⁴ (+) | 1.83 × 10⁻⁴ (+) | 1.83 × 10⁻⁴ (+) | 2.73 × 10⁻¹ (=) |
| F2 | - | 1.83 × 10⁻⁴ (+) | 2.12 × 10⁻¹ (=) | 4.59 × 10⁻³ (+) | 1.83 × 10⁻⁴ (+) | 7.69 × 10⁻⁴ (+) | 1.83 × 10⁻⁴ (+) | 1.83 × 10⁻⁴ (+) | 1.83 × 10⁻⁴ (+) | 2.46 × 10⁻⁴ (+) | 1.83 × 10⁻⁴ (-) |
| F3 | - | 1.83 × 10⁻⁴ (+) | 1.83 × 10⁻⁴ (+) | 1.83 × 10⁻⁴ (+) | 1.83 × 10⁻⁴ (+) | 1.83 × 10⁻⁴ (+) | 1.83 × 10⁻⁴ (+) | 1.83 × 10⁻⁴ (+) | 1.83 × 10⁻⁴ (+) | 1.83 × 10⁻⁴ (+) | 1.83 × 10⁻⁴ (+) |
| F4 | - | 1.83 × 10⁻⁴ (+) | 5.83 × 10⁻⁴ (+) | 1.83 × 10⁻⁴ (+) | 4.40 × 10⁻⁴ (+) | 4.40 × 10⁻⁴ (+) | 1.83 × 10⁻⁴ (+) | 1.83 × 10⁻⁴ (+) | 1.83 × 10⁻⁴ (+) | 1.83 × 10⁻⁴ (+) | 1.13 × 10⁻² (+) |
| F5 | - | 4.40 × 10⁻⁴ (+) | 5.83 × 10⁻⁴ (+) | 3.76 × 10⁻² (=) | 3.61 × 10⁻³ (+) | 4.40 × 10⁻⁴ (+) | 1.83 × 10⁻⁴ (+) | 1.83 × 10⁻⁴ (+) | 1.83 × 10⁻⁴ (+) | 1.83 × 10⁻⁴ (+) | 3.30 × 10⁻⁴ (+) |
| F6 | - | 1.83 × 10⁻⁴ (+) | 1.83 × 10⁻⁴ (+) | 1.83 × 10⁻⁴ (+) | 1.83 × 10⁻⁴ (+) | 1.83 × 10⁻⁴ (+) | 1.83 × 10⁻⁴ (+) | 1.83 × 10⁻⁴ (+) | 1.83 × 10⁻⁴ (+) | 1.83 × 10⁻⁴ (+) | 1.83 × 10⁻⁴ (+) |
| F7 | - | 1.83 × 10⁻⁴ (+) | 1.83 × 10⁻⁴ (+) | 1.83 × 10⁻⁴ (+) | 1.73 × 10⁻² (+) | 1.83 × 10⁻⁴ (+) | 1.83 × 10⁻⁴ (+) | 1.83 × 10⁻⁴ (+) | 1.83 × 10⁻⁴ (+) | 1.83 × 10⁻⁴ (+) | 1.83 × 10⁻⁴ (+) |
| F8 | - | 2.83 × 10⁻³ (+) | 7.28 × 10⁻³ (+) | 2.12 × 10⁻¹ (=) | 1.31 × 10⁻³ (+) | 7.28 × 10⁻³ (+) | 1.83 × 10⁻⁴ (+) | 1.83 × 10⁻⁴ (+) | 1.83 × 10⁻⁴ (+) | 4.40 × 10⁻⁴ (+) | 1.83 × 10⁻⁴ (+) |
| F9 | - | 2.57 × 10⁻² (+) | 1.61 × 10⁻¹ (=) | 5.71 × 10⁻¹ (=) | 6.78 × 10⁻¹ (=) | 9.70 × 10⁻¹ (=) | 1.86 × 10⁻¹ (=) | 2.73 × 10⁻¹ (=) | 1.83 × 10⁻⁴ (+) | 5.21 × 10⁻¹ (=) | 8.50 × 10⁻¹ (=) |
| F10 | - | 2.12 × 10⁻¹ (=) | 2.11 × 10⁻² (-) | 5.80 × 10⁻³ (-) | 5.39 × 10⁻² (=) | 2.83 × 10⁻³ (-) | 4.52 × 10⁻² (+) | 7.91 × 10⁻¹ (=) | 1.83 × 10⁻⁴ (+) | 5.71 × 10⁻¹ (=) | 1.62 × 10⁻¹ (=) |
| F11 | - | 1.83 × 10⁻⁴ (+) | 6.40 × 10⁻² (=) | 2.57 × 10⁻² (+) | 7.69 × 10⁻⁴ (+) | 5.83 × 10⁻⁴ (+) | 1.83 × 10⁻⁴ (+) | 1.83 × 10⁻⁴ (+) | 1.83 × 10⁻⁴ (+) | 1.83 × 10⁻⁴ (+) | 2.73 × 10⁻¹ (=) |
| F12 | - | 1.83 × 10⁻⁴ (+) | 1.83 × 10⁻⁴ (+) | 1.83 × 10⁻⁴ (+) | 1.83 × 10⁻⁴ (+) | 1.83 × 10⁻⁴ (+) | 1.83 × 10⁻⁴ (+) | 1.83 × 10⁻⁴ (+) | 1.83 × 10⁻⁴ (+) | 1.83 × 10⁻⁴ (+) | 3.30 × 10⁻⁴ (+) |
| F13 | - | 1.83 × 10⁻⁴ (+) | 1.83 × 10⁻⁴ (+) | 1.83 × 10⁻⁴ (+) | 1.83 × 10⁻⁴ (+) | 1.83 × 10⁻⁴ (+) | 1.83 × 10⁻⁴ (+) | 1.83 × 10⁻⁴ (+) | 1.83 × 10⁻⁴ (+) | 1.83 × 10⁻⁴ (+) | 1.83 × 10⁻⁴ (+) |
| F14 | - | 1.83 × 10⁻⁴ (+) | 1.83 × 10⁻⁴ (+) | 1.83 × 10⁻⁴ (+) | 1.83 × 10⁻⁴ (+) | 1.83 × 10⁻⁴ (+) | 1.83 × 10⁻⁴ (+) | 3.12 × 10⁻² (=) | 1.83 × 10⁻⁴ (+) | 1.83 × 10⁻⁴ (+) | 1.83 × 10⁻⁴ (+) |
| F15 | - | 1.83 × 10⁻⁴ (+) | 1.83 × 10⁻⁴ (+) | 1.83 × 10⁻⁴ (+) | 1.83 × 10⁻⁴ (+) | 1.83 × 10⁻⁴ (+) | 1.83 × 10⁻⁴ (+) | 4.40 × 10⁻⁴ (+) | 1.83 × 10⁻⁴ (+) | 4.40 × 10⁻⁴ (+) | 5.83 × 10⁻⁴ (+) |
| F16 | - | 1.83 × 10⁻⁴ (+) | 4.40 × 10⁻⁴ (+) | 2.83 × 10⁻³ (+) | 1.71 × 10⁻³ (+) | 3.30 × 10⁻⁴ (+) | 1.83 × 10⁻⁴ (+) | 2.46 × 10⁻⁴ (+) | 1.83 × 10⁻⁴ (+) | 2.46 × 10⁻⁴ (+) | 2.46 × 10⁻⁴ (+) |
| F17 | - | 1.83 × 10⁻⁴ (+) | 5.83 × 10⁻⁴ (+) | 5.80 × 10⁻³ (+) | 1.83 × 10⁻⁴ (+) | 3.61 × 10⁻³ (+) | 1.83 × 10⁻⁴ (+) | 1.01 × 10⁻³ (+) | 1.83 × 10⁻⁴ (+) | 1.83 × 10⁻⁴ (+) | 1.83 × 10⁻⁴ (+) |
| F18 | - | 1.83 × 10⁻⁴ (+) | 1.83 × 10⁻⁴ (+) | 1.83 × 10⁻⁴ (+) | 1.83 × 10⁻⁴ (+) | 1.83 × 10⁻⁴ (+) | 1.83 × 10⁻⁴ (+) | 1.83 × 10⁻⁴ (+) | 1.83 × 10⁻⁴ (+) | 1.83 × 10⁻⁴ (+) | 1.83 × 10⁻⁴ (+) |
| F19 | - | 1.83 × 10⁻⁴ (+) | 1.83 × 10⁻⁴ (+) | 1.83 × 10⁻⁴ (+) | 1.83 × 10⁻⁴ (+) | 1.83 × 10⁻⁴ (+) | 1.83 × 10⁻⁴ (+) | 1.83 × 10⁻⁴ (+) | 1.83 × 10⁻⁴ (+) | 1.83 × 10⁻⁴ (+) | 1.83 × 10⁻⁴ (+) |
| F20 | - | 1.71 × 10⁻³ (+) | 1.40 × 10⁻² (+) | 1.40 × 10⁻¹ (=) | 2.83 × 10⁻³ (+) | 2.41 × 10⁻¹ (=) | 1.83 × 10⁻⁴ (+) | 3.85 × 10⁻¹ (=) | 1.83 × 10⁻⁴ (+) | 5.80 × 10⁻³ (+) | 1.83 × 10⁻⁴ (+) |
| F21 | - | 3.30 × 10⁻⁴ (+) | 1.83 × 10⁻⁴ (+) | 2.12 × 10⁻¹ (=) | 2.46 × 10⁻⁴ (+) | 4.40 × 10⁻⁴ (+) | 1.83 × 10⁻⁴ (+) | 1.83 × 10⁻⁴ (+) | 1.83 × 10⁻⁴ (+) | 4.40 × 10⁻⁴ (+) | 1.83 × 10⁻⁴ (+) |
| F22 | - | 2.11 × 10⁻² (+) | 7.57 × 10⁻² (=) | 9.70 × 10⁻¹ (=) | 1.21 × 10⁻¹ (=) | 3.85 × 10⁻¹ (=) | 3.30 × 10⁻⁴ (+) | 2.83 × 10⁻³ (+) | 1.83 × 10⁻⁴ (+) | 5.80 × 10⁻³ (+) | 4.27 × 10⁻¹ (=) |
| F23 | - | 1.83 × 10⁻⁴ (+) | 1.83 × 10⁻⁴ (+) | 1.01 × 10⁻³ (+) | 5.80 × 10⁻³ (+) | 1.83 × 10⁻⁴ (+) | 1.83 × 10⁻⁴ (+) | 1.83 × 10⁻⁴ (+) | 1.83 × 10⁻⁴ (+) | 1.83 × 10⁻⁴ (+) | 1.83 × 10⁻⁴ (+) |
| F24 | - | 1.83 × 10⁻⁴ (+) | 1.83 × 10⁻⁴ (+) | 1.83 × 10⁻⁴ (+) | 4.40 × 10⁻⁴ (+) | 1.83 × 10⁻⁴ (+) | 1.83 × 10⁻⁴ (+) | 1.83 × 10⁻⁴ (+) | 1.83 × 10⁻⁴ (+) | 1.83 × 10⁻⁴ (+) | 1.83 × 10⁻⁴ (+) |
| F25 | - | 1.83 × 10⁻⁴ (+) | 1.31 × 10⁻³ (+) | 1.31 × 10⁻³ (+) | 2.57 × 10⁻² (+) | 1.83 × 10⁻⁴ (+) | 1.83 × 10⁻⁴ (+) | 1.83 × 10⁻⁴ (+) | 1.83 × 10⁻⁴ (+) | 1.83 × 10⁻⁴ (+) | 2.57 × 10⁻² (+) |
| F26 | - | 1.83 × 10⁻⁴ (+) | 7.28 × 10⁻³ (+) | 6.23 × 10⁻¹ (=) | 1.71 × 10⁻³ (+) | 2.83 × 10⁻³ (+) | 2.46 × 10⁻⁴ (+) | 1.83 × 10⁻⁴ (+) | 1.83 × 10⁻⁴ (+) | 3.12 × 10⁻² (+) | 9.11 × 10⁻³ (+) |
| F27 | - | 1.83 × 10⁻⁴ (+) | 1.83 × 10⁻⁴ (+) | 4.40 × 10⁻⁴ (+) | 5.83 × 10⁻⁴ (+) | 2.46 × 10⁻⁴ (+) | 1.83 × 10⁻⁴ (+) | 1.83 × 10⁻⁴ (+) | 1.83 × 10⁻⁴ (+) | 5.83 × 10⁻⁴ (+) | 1.83 × 10⁻⁴ (+) |
| F28 | - | 1.83 × 10⁻⁴ (+) | 1.83 × 10⁻⁴ (+) | 1.71 × 10⁻³ (+) | 3.30 × 10⁻⁴ (+) | 1.83 × 10⁻⁴ (+) | 1.83 × 10⁻⁴ (+) | 1.83 × 10⁻⁴ (+) | 1.83 × 10⁻⁴ (+) | 1.83 × 10⁻⁴ (+) | 3.76 × 10⁻² (+) |
| F29 | - | 1.83 × 10⁻⁴ (+) | 3.30 × 10⁻⁴ (+) | 4.40 × 10⁻⁴ (+) | 2.46 × 10⁻⁴ (+) | 1.83 × 10⁻⁴ (+) | 1.83 × 10⁻⁴ (+) | 1.83 × 10⁻⁴ (+) | 1.83 × 10⁻⁴ (+) | 1.83 × 10⁻⁴ (+) | 2.83 × 10⁻³ (+) |
| F30 | - | 1.83 × 10⁻⁴ (+) | 1.83 × 10⁻⁴ (+) | 1.83 × 10⁻⁴ (+) | 1.83 × 10⁻⁴ (+) | 1.83 × 10⁻⁴ (+) | 1.83 × 10⁻⁴ (+) | 1.83 × 10⁻⁴ (+) | 1.83 × 10⁻⁴ (+) | 1.83 × 10⁻⁴ (+) | 1.83 × 10⁻⁴ (+) |
| Total +/=/− | - | 29/1/0 | 24/6/0 | 20/10/0 | 28/2/0 | 27/3/0 | 29/1/0 | 25/5/0 | 30/0/0 | 28/2/0 | 22/8/0 |
Table A3.
Wilcoxon Test of Various Algorithms in CEC2017 Dim 100.
Table A3.
Wilcoxon Test of Various Algorithms in CEC2017 Dim 100.
| MGOA | WOA | HHO | AO | DBO | BKA | NRBO | IAO | BTO | TOC | CPO | |
|---|---|---|---|---|---|---|---|---|---|---|---|
| F1 | - | 4.73 × 10⁻¹ (=) | 4.73 × 10⁻¹ (=) | 4.73 × 10⁻¹ (=) | 5.71 × 10⁻¹ (=) | 3.30 × 10⁻⁴ (+) | 1.83 × 10⁻⁴ (+) | 1.83 × 10⁻⁴ (+) | 1.83 × 10⁻⁴ (+) | 5.21 × 10⁻¹ (=) | 1.83 × 10⁻⁴ (-) |
| F2 | - | 1.83 × 10⁻⁴ (+) | 2.41 × 10⁻¹ (=) | 3.30 × 10⁻⁴ (+) | 1.83 × 10⁻⁴ (+) | 4.40 × 10⁻⁴ (+) | 1.83 × 10⁻⁴ (+) | 1.83 × 10⁻⁴ (+) | 1.83 × 10⁻⁴ (+) | 1.83 × 10⁻⁴ (+) | 1.83 × 10⁻⁴ (-) |
| F3 | - | 1.83 × 10⁻⁴ (+) | 1.83 × 10⁻⁴ (+) | 1.83 × 10⁻⁴ (+) | 1.83 × 10⁻⁴ (+) | 1.83 × 10⁻⁴ (+) | 1.83 × 10⁻⁴ (+) | 1.83 × 10⁻⁴ (+) | 1.83 × 10⁻⁴ (+) | 1.83 × 10⁻⁴ (+) | 1.83 × 10⁻⁴ (+) |
| F4 | - | 5.71 × 10⁻¹ (=) | 5.39 × 10⁻² (=) | 2.41 × 10⁻¹ (=) | 3.07 × 10⁻¹ (=) | 1.01 × 10⁻³ (+) | 1.83 × 10⁻⁴ (+) | 1.83 × 10⁻⁴ (+) | 1.83 × 10⁻⁴ (+) | 1.40 × 10⁻¹ (=) | 1.01 × 10⁻³ (+) |
| F5 | - | 1.31 × 10⁻³ (+) | 1.01 × 10⁻³ (+) | 3.85 × 10⁻¹ (=) | 1.83 × 10⁻⁴ (+) | 1.62 × 10⁻¹ (=) | 1.83 × 10⁻⁴ (+) | 1.83 × 10⁻⁴ (+) | 1.83 × 10⁻⁴ (+) | 1.83 × 10⁻⁴ (+) | 1.62 × 10⁻¹ (=) |
| F6 | - | 2.20 × 10⁻³ (+) | 2.83 × 10⁻³ (+) | 4.59 × 10⁻³ (+) | 2.83 × 10⁻³ (+) | 1.13 × 10⁻² (+) | 1.83 × 10⁻⁴ (+) | 5.83 × 10⁻⁴ (+) | 1.83 × 10⁻⁴ (+) | 1.71 × 10⁻³ (+) | 1.73 × 10⁻² (+) |
| F7 | - | 1.83 × 10⁻⁴ (+) | 1.83 × 10⁻⁴ (+) | 7.28 × 10⁻³ (+) | 2.73 × 10⁻¹ (=) | 1.83 × 10⁻⁴ (+) | 1.83 × 10⁻⁴ (+) | 1.83 × 10⁻⁴ (+) | 1.83 × 10⁻⁴ (+) | 1.83 × 10⁻⁴ (+) | 7.57 × 10⁻² (=) |
| F8 | - | 1.71 × 10⁻³ (+) | 5.80 × 10⁻³ (+) | 6.78 × 10⁻¹ (=) | 1.73 × 10⁻² (+) | 2.57 × 10⁻² (+) | 1.83 × 10⁻⁴ (+) | 1.83 × 10⁻⁴ (+) | 1.83 × 10⁻⁴ (+) | 4.40 × 10⁻⁴ (+) | 5.21 × 10⁻¹ (=) |
| F9 | - | 2.57 × 10⁻² (+) | 2.46 × 10⁻⁴ (+) | 1.83 × 10⁻⁴ (+) | 2.20 × 10⁻³ (+) | 1.83 × 10⁻⁴ (+) | 1.86 × 10⁻¹ (=) | 2.46 × 10⁻⁴ (+) | 1.73 × 10⁻² (+) | 4.40 × 10⁻⁴ (+) | 8.50 × 10⁻¹ (=) |
| F10 | - | 3.85 × 10⁻¹ (=) | 8.50 × 10⁻¹ (=) | 3.07 × 10⁻¹ (=) | 7.34 × 10⁻¹ (=) | 8.50 × 10⁻¹ (=) | 2.20 × 10⁻³ (+) | 1.40 × 10⁻¹ (=) | 1.83 × 10⁻⁴ (+) | 2.73 × 10⁻¹ (=) | 6.40 × 10⁻² (=) |
| F11 | - | 1.83 × 10⁻⁴ (+) | 1.73 × 10⁻² (+) | 1.83 × 10⁻⁴ (+) | 1.83 × 10⁻⁴ (+) | 1.83 × 10⁻⁴ (+) | 1.83 × 10⁻⁴ (+) | 1.83 × 10⁻⁴ (+) | 1.83 × 10⁻⁴ (+) | 1.83 × 10⁻⁴ (+) | 1.31 × 10⁻³ (+) |
| F12 | - | 9.10 × 10⁻¹ (=) | 1.00 (=) | 1.00 (=) | 1.00 (=) | 2.12 × 10⁻¹ (=) | 1.83 × 10⁻⁴ (+) | 1.83 × 10⁻⁴ (+) | 1.83 × 10⁻⁴ (+) | 5.71 × 10⁻¹ (=) | 9.10 × 10⁻¹ (=) |
| F13 | - | 2.83 × 10⁻³ (+) | 2.83 × 10⁻³ (+) | 2.83 × 10⁻³ (+) | 2.83 × 10⁻³ (+) | 2.83 × 10⁻³ (+) | 4.40 × 10⁻⁴ (+) | 1.83 × 10⁻⁴ (+) | 1.83 × 10⁻⁴ (+) | 2.83 × 10⁻³ (+) | 4.73 × 10⁻¹ (=) |
| F14 | - | 1.83 × 10⁻⁴ (+) | 1.83 × 10⁻⁴ (+) | 1.83 × 10⁻⁴ (+) | 1.83 × 10⁻⁴ (+) | 1.83 × 10⁻⁴ (+) | 1.83 × 10⁻⁴ (+) | 1.83 × 10⁻⁴ (+) | 1.83 × 10⁻⁴ (+) | 1.83 × 10⁻⁴ (+) | 1.83 × 10⁻⁴ (+) |
| F15 | - | 2.83 × 10⁻³ (+) | 2.83 × 10⁻³ (+) | 2.83 × 10⁻³ (+) | 2.83 × 10⁻³ (+) | 1.31 × 10⁻³ (+) | 1.83 × 10⁻⁴ (+) | 1.83 × 10⁻⁴ (+) | 1.83 × 10⁻⁴ (+) | 2.83 × 10⁻³ (+) | 2.11 × 10⁻² (+) |
| F16 | - | 1.83 × 10⁻⁴ (+) | 2.46 × 10⁻⁴ (+) | 1.83 × 10⁻⁴ (+) | 4.40 × 10⁻⁴ (+) | 4.40 × 10⁻⁴ (+) | 1.83 × 10⁻⁴ (+) | 1.83 × 10⁻⁴ (+) | 1.83 × 10⁻⁴ (+) | 1.83 × 10⁻⁴ (+) | 5.83 × 10⁻⁴ (+) |
| F17 | - | 1.83 × 10⁻⁴ (+) | 1.01 × 10⁻³ (+) | 5.83 × 10⁻⁴ (+) | 3.30 × 10⁻⁴ (+) | 9.11 × 10⁻³ (+) | 1.83 × 10⁻⁴ (+) | 1.83 × 10⁻⁴ (+) | 1.83 × 10⁻⁴ (+) | 3.30 × 10⁻⁴ (+) | 6.23 × 10⁻¹ (=) |
| F18 | - | 1.83 × 10⁻⁴ (+) | 1.83 × 10⁻⁴ (+) | 1.83 × 10⁻⁴ (+) | 1.83 × 10⁻⁴ (+) | 1.83 × 10⁻⁴ (+) | 1.83 × 10⁻⁴ (+) | 1.83 × 10⁻⁴ (+) | 1.83 × 10⁻⁴ (+) | 1.83 × 10⁻⁴ (+) | 1.83 × 10⁻⁴ (+) |
| F19 | - | 4.73 × 10⁻¹ (=) | 4.73 × 10⁻¹ (=) | 4.73 × 10⁻¹ (=) | 7.34 × 10⁻¹ (=) | 4.73 × 10⁻¹ (=) | 2.12 × 10⁻¹ (=) | 1.04 × 10⁻¹ (=) | 1.83 × 10⁻⁴ (+) | 4.73 × 10⁻¹ (=) | 5.71 × 10⁻¹ (=) |
| F20 | - | 2.57 × 10⁻² (+) | 1.04 × 10⁻¹ (=) | 9.10 × 10⁻¹ (=) | 3.07 × 10⁻¹ (=) | 8.50 × 10⁻¹ (=) | 3.61 × 10⁻³ (+) | 9.70 × 10⁻¹ (=) | 1.83 × 10⁻⁴ (+) | 7.57 × 10⁻² (=) | 1.21 × 10⁻¹ (=) |
| F21 | - | 1.83 × 10⁻⁴ (+) | 1.83 × 10⁻⁴ (+) | 3.30 × 10⁻⁴ (+) | 2.83 × 10⁻³ (+) | 1.83 × 10⁻⁴ (+) | 1.83 × 10⁻⁴ (+) | 1.83 × 10⁻⁴ (+) | 1.83 × 10⁻⁴ (+) | 1.83 × 10⁻⁴ (+) | 1.83 × 10⁻⁴ (+) |
| F22 | - | 1.00 (=) | 7.34 × 10⁻¹ (=) | 1.04 × 10⁻¹ (=) | 1.40 × 10⁻¹ (=) | 1.04 × 10⁻¹ (=) | 1.71 × 10⁻³ (+) | 1.00 (=) | 1.83 × 10⁻⁴ (+) | 9.70 × 10⁻¹ (=) | 5.39 × 10⁻² (=) |
| F23 | - | 1.83 × 10⁻⁴ (+) | 1.83 × 10⁻⁴ (+) | 1.83 × 10⁻⁴ (+) | 1.83 × 10⁻⁴ (+) | 1.83 × 10⁻⁴ (+) | 1.83 × 10⁻⁴ (+) | 1.83 × 10⁻⁴ (+) | 1.83 × 10⁻⁴ (+) | 1.83 × 10⁻⁴ (+) | 1.83 × 10⁻⁴ (+) |
| F24 | - | 1.83 × 10⁻⁴ (+) | 1.83 × 10⁻⁴ (+) | 1.83 × 10⁻⁴ (+) | 1.71 × 10⁻³ (+) | 1.83 × 10⁻⁴ (+) | 1.83 × 10⁻⁴ (+) | 1.83 × 10⁻⁴ (+) | 1.83 × 10⁻⁴ (+) | 1.83 × 10⁻⁴ (+) | 1.83 × 10⁻⁴ (+) |
| F25 | - | 2.57 × 10⁻² (+) | 1.00 (=) | 6.23 × 10⁻¹ (=) | 1.73 × 10⁻² (+) | 5.83 × 10⁻⁴ (+) | 1.83 × 10⁻⁴ (+) | 1.83 × 10⁻⁴ (+) | 1.83 × 10⁻⁴ (+) | 3.61 × 10⁻³ (+) | 4.40 × 10⁻⁴ (+) |
| F26 | - | 1.83 × 10⁻⁴ (+) | 7.69 × 10⁻⁴ (+) | 2.73 × 10⁻¹ (=) | 1.21 × 10⁻¹ (=) | 2.57 × 10⁻² (+) | 2.46 × 10⁻⁴ (+) | 1.83 × 10⁻⁴ (+) | 1.83 × 10⁻⁴ (+) | 1.83 × 10⁻⁴ (+) | 6.78 × 10⁻¹ (=) |
| F27 | - | 1.83 × 10⁻⁴ (+) | 2.46 × 10⁻⁴ (+) | 1.01 × 10⁻³ (+) | 7.69 × 10⁻⁴ (+) | 1.83 × 10⁻⁴ (+) | 1.83 × 10⁻⁴ (+) | 1.83 × 10⁻⁴ (+) | 1.83 × 10⁻⁴ (+) | 1.83 × 10⁻⁴ (+) | 3.30 × 10⁻⁴ (+) |
| F28 | - | 1.73 × 10⁻² (+) | 6.23 × 10⁻¹ (=) | 1.00 (=) | 1.13 × 10⁻² (+) | 1.71 × 10⁻³ (+) | 1.71 × 10⁻³ (+) | 1.83 × 10⁻⁴ (+) | 1.83 × 10⁻⁴ (+) | 6.40 × 10⁻² (=) | 3.30 × 10⁻⁴ (+) |
| F29 | - | 1.83 × 10⁻⁴ (+) | 3.30 × 10⁻⁴ (+) | 4.40 × 10⁻⁴ (+) | 2.46 × 10⁻⁴ (+) | 1.83 × 10⁻⁴ (+) | 1.83 × 10⁻⁴ (+) | 1.83 × 10⁻⁴ (+) | 1.83 × 10⁻⁴ (+) | 1.83 × 10⁻⁴ (+) | 2.83 × 10⁻³ (+) |
| F30 | - | 1.00 (=) | 1.00 (=) | 1.00 (=) | 6.78 × 10⁻¹ (=) | 1.00 (=) | 1.83 × 10⁻⁴ (+) | 2.46 × 10⁻⁴ (+) | 1.83 × 10⁻⁴ (+) | 1.00 (=) | 3.07 × 10⁻¹ (=) |
| Total +/=/− | - | 22/8/0 | 18/12/0 | 15/15/0 | 21/9/0 | 20/10/0 | 30/0/0 | 26/4/0 | 30/0/0 | 22/8/0 | 16/14/0 |
References
- Nadimi-Shahraki, M.H.; Taghian, S.; Javaheri, D.; Sadiq, A.S.; Khodadadi, N.; Mirjalili, S. MTV-SCA: Multi-trial vector-based sine cosine algorithm. Clust. Comput. 2024, 27, 13471–13515. [Google Scholar] [CrossRef]
- Li, S.; Geng, Z. Bicriteria scheduling on an unbounded parallel-batch machine for minimizing makespan and maximum cost. Inf. Process. Lett. 2023, 180, 106343. [Google Scholar] [CrossRef]
- Li, R.; Wu, X.; Tian, H.; Yu, N.; Wang, C. Hybrid memetic pretrained factor analysis-based deep belief networks for transient electromagnetic inversion. IEEE Trans. Geosci. Remote Sens. 2022, 60, 1–20. [Google Scholar] [CrossRef]
- Wang, H.; Gao, Q.; Li, H.; Wang, H.; Yan, L.; Liu, G. A structural evolution-based anomaly detection method for generalized evolving social networks. Comput. J. 2022, 65, 1189–1199. [Google Scholar] [CrossRef]
- Ye, M.; Wang, X.; Guo, Z.; Hu, B.; Wang, L. A Multi-Strategy Improved Red-Billed Blue Magpie Optimizer for Global Optimization. Biomimetics 2025, 10, 557. [Google Scholar] [CrossRef] [PubMed]
- Mason, L.; Baxter, J.; Bartlett, P.; Frean, M. Boosting algorithms as gradient descent. Adv. Neural Inf. Process. Syst. 1999, 12. Available online: https://proceedings.neurips.cc/paper_files/paper/1999/file/96a93ba89a5b5c6c226e49b88973f46e-Paper.pdf (accessed on 11 November 2025).
- Kelley, C.T. Solving Nonlinear Equations with Newton’s Method; Society for Industrial and Applied Mathematics: Philadelphia, PA, USA, 2003. [Google Scholar]
- Bertsekas, D.P. Constrained Optimization and Lagrange Multiplier Methods; Academic Press: Cambridge, MA, USA, 2014. [Google Scholar]
- Bertsimas, D.; Tsitsiklis, J. Simulated annealing. Stat. Sci. 1993, 8, 10–15. [Google Scholar] [CrossRef]
- Tian, J.; Sun, C.; Tan, Y.; Zeng, J. Granularity-based surrogate-assisted particle swarm optimization for high-dimensional expensive optimization. Knowl.-Based Syst. 2020, 187, 104815. [Google Scholar] [CrossRef]
- Ji, X.F.; Zhang, Y.; He, C.L.; Cheng, J.X.; Gong, D.W.; Gao, X.Z.; Guo, Y.N. Surrogate and autoencoder-assisted multitask particle swarm optimization for high-dimensional expensive multimodal problems. IEEE Trans. Evol. Comput. 2023, 28, 1009–1023. [Google Scholar] [CrossRef]
- Dong, R.; Chen, H.; Heidari, A.A.; Turabieh, H.; Mafarja, M.; Wang, S. Boosted kernel search: Framework, analysis and case studies on the economic emission dispatch problem. Knowl.-Based Syst. 2021, 233, 107529. [Google Scholar] [CrossRef]
- Pohlak, M.; Majak, J.; Karjust, K.; Küttner, R. Multi-criteria optimization of large composite parts. Compos. Struct. 2010, 92, 2146–2152. [Google Scholar] [CrossRef]
- Herranen, H.; Pabut, O.; Eerme, M.; Majak, J.; Pohlak, M.; Kers, J.; Saarna, M.; Allikas, G.; Aruniit, A. Design and testing of sandwich structures with different core materials. Mater. Sci. 2012, 18, 45–50. [Google Scholar] [CrossRef]
- Katoch, S.; Chauhan, S.S.; Kumar, V. A review on genetic algorithm: Past, present, and future. Multimed. Tools Appl. 2021, 80, 8091–8126. [Google Scholar] [CrossRef] [PubMed]
- Parsopoulos, K.E.; Vrahatis, M.N. Recent approaches to global optimization problems through particle swarm optimization. Nat. Comput. 2002, 1, 235–306. [Google Scholar] [CrossRef]
- Dokeroglu, T.; Sevinc, E.; Kucukyilmaz, T.; Cosar, A. A survey on new generation metaheuristic algorithms. Comput. Ind. Eng. 2019, 137, 106040. [Google Scholar] [CrossRef]
- Cebeci, C.; Timur, O. Deterministic Parameter Control Methods for Genetic Algorithms: Benchmarking on Test Functions and Boost Converter Design Optimisation. Appl. Sci. 2025, 15, 11093. [Google Scholar] [CrossRef]
- Lambora, A.; Gupta, K.; Chopra, K. Genetic algorithm-A literature review. In Proceedings of the 2019 International Conference on Machine Learning, Big Data, Cloud and Parallel Computing (COMITCon), Faridabad, India, 14–16 February 2019; IEEE: Piscataway, NJ, USA, 2019; pp. 380–384. [Google Scholar]
- Price, K.V.; Storn, R.M.; Lampinen, J.A. The differential evolution algorithm. In Differential Evolution: A Practical Approach to Global Optimization; Springer: Berlin/Heidelberg, Germany, 2005; pp. 37–134. [Google Scholar]
- Sulaiman, M.H.; Mustaffa, Z.; Saari, M.M.; Daniyal, H.; Mirjalili, S. Evolutionary mating algorithm. Neural Comput. Appl. 2023, 35, 487–516. [Google Scholar] [CrossRef]
- Dong, Y.; Zhang, S.; Zhang, H.; Zhou, X.; Jiang, J. Chaotic evolution optimization: A novel metaheuristic algorithm inspired by chaotic dynamics. Chaos Solitons Fractals 2025, 192, 116049. [Google Scholar] [CrossRef]
- Nikolaev, A.G.; Jacobson, S.H. Simulated annealing. In Handbook of Metaheuristics; Springer: Boston, MA, USA, 2010; pp. 1–39. [Google Scholar]
- Abdel-Basset, M.; Mohamed, R.; Azeem, S.A.A.; Jameel, M.; Abouhawwash, M. Kepler optimization algorithm: A new metaheuristic algorithm inspired by Kepler’s laws of planetary motion. Knowl.-Based Syst. 2023, 268, 110454. [Google Scholar] [CrossRef]
- Su, H.; Zhao, D.; Heidari, A.A.; Liu, L.; Zhang, X.; Mafarja, M.; Chen, H. RIME: A physics-based optimization. Neurocomputing 2023, 532, 183–214. [Google Scholar] [CrossRef]
- Kashan, A.H. A new metaheuristic for optimization: Optics inspired optimization (OIO). Comput. Oper. Res. 2015, 55, 99–125. [Google Scholar] [CrossRef]
- Kennedy, J.; Eberhart, R. Particle swarm optimization. In Proceedings of the ICNN’95-International Conference on Neural Networks, Perth, WA, Australia, 27 November–1 December 1995; IEEE: Piscataway, NJ, USA, 1995; Volume 4, pp. 1942–1948. [Google Scholar]
- Dorigo, M.; Blum, C. Ant colony optimization theory: A survey. Theor. Comput. Sci. 2005, 344, 243–278. [Google Scholar] [CrossRef]
- Mohammed, B.O.; Aghdasi, H.S.; Salehpour, P. Dhole optimization algorithm: A new metaheuristic algorithm for solving optimization problems. Clust. Comput. 2025, 28, 430. [Google Scholar] [CrossRef]
- Braik, M.; Al-Hiary, H. Rüppell’s fox optimizer: A novel meta-heuristic approach for solving global optimization problems. Clust. Comput. 2025, 28, 292. [Google Scholar] [CrossRef]
- Wang, R.B.; Hu, R.B.; Geng, F.D.; Xu, L.; Chu, S.C.; Pan, J.S.; Meng, Z.-Y.; Mirjalili, S. The Animated Oat Optimization Algorithm: A nature-inspired metaheuristic for engineering optimization and a case study on Wireless Sensor Networks. Knowl.-Based Syst. 2025, 318, 113589. [Google Scholar] [CrossRef]
- Jia, H.; Zhou, X.; Zhang, J.; Mirjalili, S. Superb Fairy-wren Optimization Algorithm: A novel metaheuristic algorithm for solving feature selection problems. Clust. Comput. 2025, 28, 246. [Google Scholar] [CrossRef]
- Ahmadi, S.A. Human behavior-based optimization: A novel metaheuristic approach to solve complex optimization problems. Neural Comput. Appl. 2017, 28 (Suppl. 1), 233–244. [Google Scholar] [CrossRef]
- Bouchekara, H.R.E.H. Most valuable player algorithm: A novel optimization algorithm inspired from sport. Oper. Res. 2020, 20, 139–195. [Google Scholar] [CrossRef]
- Trojovský, P. A new human-based metaheuristic algorithm for solving optimization problems based on preschool education. Sci. Rep. 2023, 13, 21472. [Google Scholar] [CrossRef]
- Zhang, M.; Li, X. Understanding the relationship between coopetition and startups’ resilience: The role of entrepreneurial ecosystem and dynamic exchange capability. J. Bus. Ind. Mark. 2025, 40, 527–542. [Google Scholar] [CrossRef]
- Hagiu, A. Merchant or two-sided platform? Rev. Netw. Econ. 2007, 6. [Google Scholar] [CrossRef]
- Wu, G.; Mallipeddi, R.; Suganthan, P.N. Problem Definitions and Evaluation Criteria for the CEC 2017 Competition on Constrained Real-Parameter Optimization; Technical Report; National University of Defense Technology: Changsha, China; Kyungpook National University: Daegu, Republic of Korea; Nanyang Technological University: Singapore, 2017. [Google Scholar]
- Mirjalili, S.; Lewis, A. The whale optimization algorithm. Adv. Eng. Softw. 2016, 95, 51–67. [Google Scholar] [CrossRef]
- Heidari, A.A.; Mirjalili, S.; Faris, H.; Aljarah, I.; Mafarja, M.; Chen, H. Harris hawks optimization: Algorithm and applications. Future Gener. Comput. Syst. 2019, 97, 849–872. [Google Scholar] [CrossRef]
- Abualigah, L.; Yousri, D.; Abd Elaziz, M.; Ewees, A.A.; Al-Qaness, M.A.; Gandomi, A.H. Aquila optimizer: A novel meta-heuristic optimization algorithm. Comput. Ind. Eng. 2021, 157, 107250. [Google Scholar] [CrossRef]
- Xue, J.; Shen, B. Dung beetle optimizer: A new meta-heuristic algorithm for global optimization. J. Supercomput. 2023, 79, 7305–7336. [Google Scholar] [CrossRef]
- Wang, J.; Wang, W.C.; Hu, X.X.; Qiu, L.; Zang, H.F. Black-winged kite algorithm: A nature-inspired meta-heuristic for solving benchmark functions and engineering problems. Artif. Intell. Rev. 2024, 57, 98. [Google Scholar] [CrossRef]
- Sowmya, R.; Premkumar, M.; Jangir, P. Newton-Raphson-based optimizer: A new population-based metaheuristic algorithm for continuous optimization problems. Eng. Appl. Artif. Intell. 2024, 128, 107532. [Google Scholar] [CrossRef]
- Wu, X.; Li, S.; Jiang, X.; Zhou, Y. Information acquisition optimizer: A new efficient algorithm for solving numerical and constrained engineering optimization problems. J. Supercomput. 2024, 80, 25736–25791. [Google Scholar] [CrossRef]
- Shehadeh, H.A. Bermuda Triangle Optimizer (BTO): A Novel Metaheuristic Method for Global Optimization. Int. J. Adv. Soft Comput. Its Appl. 2025, 17. [Google Scholar] [CrossRef]
- Braik, M.; Al-Hiary, H.; Alzoubi, H.; Hammouri, A.; Azmi Al-Betar, M.; Awadallah, M.A. Tornado optimizer with Coriolis force: A novel bio-inspired meta-heuristic algorithm for solving engineering problems. Artif. Intell. Rev. 2025, 58, 123. [Google Scholar] [CrossRef]
- Guo, Z.; Liu, G.; Jiang, F. Chinese Pangolin Optimizer: A novel bio-inspired metaheuristic for solving optimization problems. J. Supercomput. 2025, 81, 517. [Google Scholar] [CrossRef]
- Bujok, P.; Kolenovsky, P. Eigen crossover in cooperative model of evolutionary algorithms applied to CEC 2022 single objective numerical optimisation. In Proceedings of the 2022 IEEE Congress on Evolutionary Computation (CEC), Padua, Italy, 18–23 July 2022; IEEE: Piscataway, NJ, USA, 2022; pp. 1–8. [Google Scholar]
- Sun, Z.; Sun, J.; Xie, X.; An, Z.; Hong, Y.; Sun, Z. Multi-population mutative moth-flame optimization algorithm for modeling and the identification of PEMFC parameters. Renew. Energy 2025, 240, 122238. [Google Scholar] [CrossRef]
- Fang, R.; Zhou, T.; Yu, B.; Li, Z.; Ma, L.; Zhang, Y. Dung Beetle Optimization Algorithm Based on Improved Multi-Strategy Fusion. Electronics 2025, 14, 197. [Google Scholar] [CrossRef]
- Grandhi, A.; Singh, S.K. Interrelated dynamic biased feature selection and classification model using enhanced gorilla troops optimizer for intrusion detection. Alex. Eng. J. 2025, 114, 312–330. [Google Scholar] [CrossRef]
- Rather, S.A.; Bala, P.S. Hybridization of constriction coefficient based particle swarm optimization and gravitational search algorithm for function optimization. In Proceedings of the International Conference on Advances in Electronics, Electrical & Computational Intelligence (ICAEEC), Prayagraj, India, 31 May–1 June 2019. [Google Scholar]
- Zhang, Z.; Wang, X.; Yue, Y. Heuristic optimization algorithm of black-winged kite fused with osprey and its engineering application. Biomimetics 2024, 9, 595. [Google Scholar] [CrossRef]
- Liu, S.; Xiang, Y.; Zhou, H. A deep learning-based approach for high-dimensional industrial steam consumption prediction to enhance sustainability management. Sustainability 2024, 16, 9631. [Google Scholar] [CrossRef]
- He, K.; Zhang, Y.; Wang, Y.K.; Zhou, R.H.; Zhang, H.Z. EABOA: Enhanced adaptive butterfly optimization algorithm for numerical optimization and engineering design problems. Alex. Eng. J. 2024, 87, 543–573. [Google Scholar] [CrossRef]
- Pham, V.H.S.; Nguyen, V.N.; Nguyen Dang, N.T. Hybrid whale optimization algorithm for enhanced routing of limited capacity vehicles in supply chain management. Sci. Rep. 2024, 14, 793. [Google Scholar] [CrossRef]
- Paulides, M.M.; Rodrigues, D.B.; Bellizzi, G.G.; Sumser, K.; Curto, S.; Neufeld, E.; Montanaro, H.; Kok, H.P.; Trefna, H.D. ESHO benchmarks for computational modeling and optimization in hyperthermia therapy. Int. J. Hyperth. 2021, 38, 1425–1442. [Google Scholar] [CrossRef]
- Hasanien, H.M.; Alsaleh, I.; Ullah, Z.; Alassaf, A. Probabilistic optimal power flow in power systems with renewable energy integration using enhanced walrus optimization algorithm. Ain Shams Eng. J. 2024, 15, 102663. [Google Scholar] [CrossRef]
Disclaimer/Publisher’s Note: The statements, opinions and data contained in all publications are solely those of the individual author(s) and contributor(s) and not of MDPI and/or the editor(s). MDPI and/or the editor(s) disclaim responsibility for any injury to people or property resulting from any ideas, methods, instructions or products referred to in the content. |
© 2025 by the authors. Licensee MDPI, Basel, Switzerland. This article is an open access article distributed under the terms and conditions of the Creative Commons Attribution (CC BY) license (https://creativecommons.org/licenses/by/4.0/).