Abstract
A reaction–diffusion susceptible–infectious–susceptible disease model with advection, vital dynamics (birth–death effects), and a standard incidence infection mechanism is carefully analyzed. Two distinct diffusion coefficients for the susceptible and infected populations are considered. The Lie symmetries and closed-form solutions for the RDA–SIS disease model are established. The derived solution allows to study dynamics of disease transmission. Our simulation clearly illustrates the evolution dynamics of the model by using the values of parameters from academic sources. A sensitivity analysis is performed, offering valuable perspectives that could inform future disease management policies.
1. Introduction
In recent years, there has been growing interest in reaction–diffusion–advection (RDA) systems, especially due to their diverse applications in epidemiological research and beyond. Numerous studies have utilized the susceptible–infected–susceptible (SIS) epidemic models, with a particular focus on RDA frameworks. These systems are utilized to study how spatial and temporal heterogeneities affect the dynamics of disease transmission. Researchers analyzed models with a variety of factors that affect the dynamics of disease transmission, including environmental conditions, reaction–diffusion processes, advection, different infection mechanisms, external sources, and demographic aspects, including birth and mortality rates. In this study, we start by considering a general RDA–SIS disease model with external sources, governed by a system of two non-linear partial differential equations (PDEs):
where , , L represents the spatial extent of the habitat, is located at the upstream end, and at the downstream end. The population densities of susceptible and infected individuals at time t and location x are given by and , respectively. stands for the diffusion coefficient of susceptible individuals, whereas represents the diffusion coefficient for infected individuals. The symbol denotes the advection rate, which corresponds to the effective speed of the current. The infection rate is represented by , denotes the recovery or removal rate, and is the mortality rate of infected population. The nonlinear function is infection mechanism, and indicates the density of the inflow and outflow of susceptible individuals in this model.
Cui and Lou [1,2,3] developed the RDA–SIS model (1) with a standard incidence infection mechanism , no external source (), and zero death rate (i.e., ). Cui and Lou [1] explored both the stability of the disease-free equilibrium (DFE) and the conditions for the existence of an endemic equilibrium (EE). This study reveals that, in a low-risk habitat, there is a critical value for the advection rate at which the stability of the DFE can change at least twice as the diffusion rate of infected individuals ranges from zero to infinity. When the advection rate exceeds this critical threshold, the DFE becomes unstable for any value of the diffusion rate of infected individuals. Cui et al. [2] extended the analysis by examining the dynamics and asymptotic profiles of steady states under extreme conditions, such as high advection and varying diffusion rates in both population groups. The high advection rates could lead to the concentration of populations at downstream locations, significantly affecting disease persistence or elimination [2]. Kuto et al. [3] focused on the concentration profiles of the endemic equilibrium. The study revealed that, under certain conditions such as high advection rates or low diffusion, the entire infected population could potentially vanish. This finding points to potential disease management approaches in complicated environments. Other studies [4,5,6,7,8] have explored the RDA–SIS model, incorporating saturated incidence, mass action, and spontaneous infection mechanisms, without considering external sources or death rates.
Many studies incorporate diffusion, advection, and demographic processes (external sources/birth–death effects) into epidemic models to examine the existence and stability of disease-free and endemic equilibria. A linear source term, , is considered in many studies [9,10,11,12,13]. The functions and represent the external recruitment rate and the mortality rate of the susceptible population, respectively. Huicong et al. [9,10] analyzed the SIS epidemic reaction–diffusion system with a linear source for without including advection effects. The study [9] addressed the standard incidence infection mechanism, and [10] focused on the mass action infection mechanism. According to Li et al. [9], changes in the total population can lead to a greater persistence of infectious diseases. Huicong et al. [10] performed qualitative analysis to examine the stability of the disease-free equilibrium and the global stability of the endemic equilibrium. A comparison was made with similar models. It was concluded that factors such as infection mechanisms, varying population, and population movement significantly impact the transmission dynamics of disease. These insights are valuable for disease control and prevention strategies. Rao et al. [11] studied the RDA–SIS with a linear source term and standard incidence infection mechanism. The study revealed that diseases in open advective environments can be eradicated by either increasing the advection speed or lowering the diffusion rate of infected individuals. Chen and Cui investigated the reaction–diffusion SIS model with standard incidence [12] and saturated incidence infection mechanisms [13] within advective environments, incorporating a linear source term in their analysis. The study provided the critical role of the basic reproduction number in disease persistence or elimination. A linear source can increase the likelihood of disease persistence and advection can lead to a concentration of infected individuals [12]. These studies highlight the crucial role that demographic variables play in epidemiological modeling.
Motivated by the literature, we consider the linear source term to capture the birth–death effects in the susceptible population. To track the model for the closed-form solutions, we consider , , , and as constant. We focus on standard incidence infection mechanism. The system of non-linear second-order PDEs governing our reaction–diffusion SIS epidemic model with vital dynamics (birth and death effects) in an advective environment is given as follows:
This system generalizes the model in Naz and Torrisi [14] by incorporating vital dynamics (birth–death effects). Moreover, two distinct diffusion coefficients for the susceptible and infected populations are considered, in contrast to [14]. In that paper, as in this work, the search for solutions is performed using Lie symmetry methods. The literature on searching for solutions via Lie methods is rich and broad. In this context, it is appropriate to refer to some key monographs by Bluman and Kumei [15], Ibragimov [16], Olver [17], and Ovsiannikov [18]. Hereman [19,20], Cheviakov [21], and Rocha Filho and Figueiredo [22] have developed software CODEs for efficiently computing the Lie symmetries of certain differential equations. Finally, we emphasize that specific applications of symmetry analysis are demonstrated in recent papers focused on heterogeneous epidemic or reaction systems [14,23,24,25,26,27,28], compartmental models [29], or multidimensional models [30,31].
The structure of the paper is organized as follows. In Section 2, we derive the Lie symmetries, reductions, and closed-form solutions for the RDA–SIS disease model with vital dynamics (2). Moreover, by utilizing biologically suitable Cauchy conditions, we determine the unknown constants that appear in certain special classes of closed-form solutions. Section 3 focuses on investigating the spread of the infectious disease using the obtained closed-form solutions. We utilize graphs to clearly illustrate the dynamics captured by the model, using the values of parameters from the literature. This section includes a sensitivity analysis, offering insights that can inform future policy guidelines for disease management. In Section 4, we present the conclusions.
2. RDA–SIS Disease Model with Vital Dynamics: Symmetry Derivation, Reductions, and Classes of Solutions
After setting , , and as constants, and keeping future applications in mind, we analyze the following general system within the framework of symmetry analysis:
2.1. Preliminaries
We consider here a family of invertible transformation :
which depend continuously on a parameter . If contains the identity transformation, inverse transformations of its elements, and their composition, then is said to form a continuous group for the system (3). It is a symmetry group if it leaves the form of (3) invariant.
A symmetry group is characterized by an infinitesimal operator that, for the class (3), is written as
The infinitesimal coordinates , , , and are obtained by applying the Lie infinitesimal criterion, which leads to the following invariance conditions:
denotes the second prolongation of X given by
Typically, the expressions for the coordinates , , , , and so on are written as (see, e.g., [15,16,17,18])
The operators and represent the total derivatives with respect to x and t, respectively.
2.2. Determining System
From (6), after some basic simplifications, we derive the following Lie symmetry determining equations:
As a preliminary remark, for arbitrary and , we have and . The principal Lie algebra [15,16] is spanned by space and time translations.
In order to obtain an extension of , we discuss the determining system.
By differentiating Equation (19) with respect to S and after having introduced the standard incidence infection mechanism , we obtain
Equations (24) and (25), with the aid of Equation (26), provide
which yields
By utilizing , , , from (29), the Lie symmetry-determining Equations (9)–(18) are satisfied. Equations (19) and (20), with , lead to
and
Equation (30) yields .
If , the final expressions for , , , are
and satisfies the quasi-linear first-order PDE
For , only space-time translations are allowed.
Remark 1.
It is important to mention here that, in an analogous way, we introduce a different incidence function in (19), as in [14]:
- , mass action incidence;
- , saturated incidence coefficient, where is the saturation coefficient.
One can look for the extensions of and their corresponding forms of Ψ.
2.3. Lie Symmetry Reductions
For , satisfying the quasi-linear first-order PDE (33), the RDA–SIS disease model with vital dynamics is then governed by
Then, the following basis of generators is derived:
The general infinitesimal operator X is obtained by taking the linear combinations of a basis of the Lie symmetry generators
Here, we utilize the infinitesimal generators X to obtain closed-form solutions for the RDA–SIS disease model with vital dynamics. The detailed procedure to find the reductions and solutions of differential equations is provided in the textbooks [15,16,17,18]. By employing the invariant-surface conditions, we obtain
When , Equation (37) leads to
where . With the aid of Equation (38), the system of PDEs (34) is transformed into the following system of two ODEs:
The system of ODEs (39) is obtained when , while the other two constants, and , may be zero or non-zero. It is challenging to construct closed-form general solutions of the system of second-order ODEs (39), that is, when , , and are all non-zero. In the following subsection, we explore traveling wave solutions by setting .
2.4. Traveling Waves via and
The traveling wave-type solutions are obtained using the Lie symmetries and , and they take the form
Setting in the system of ODEs (39) leads directly to the following reduced system:
Specifying and in (41) allows for the derivation of special solution classes. When and , we have
where and are arbitrary constants and
The final form for and , as derived from Equations (42) and (43), are
provided and , with . For the RDA–SIS disease model with vital dynamics given in Equation (34), the traveling wave solution for both population groups is
One can recover the solution provided by Naz and Torrisi [14] for the RDA–SIS disease model without vital dynamics by setting and in the traveling wave solution (45) for the susceptible and infected populations derived here.
2.5. The Closed-Form Solutions via Lie Symmetries and
In the previous subsections, reduction and the solution search were performed for the scenario where . Here, we explore the case when in the general symmetry generator X. When , Equation (36) yields the following group-invariant solution for system (34):
With and without loss of generality, we assign the symmetry constants as , . The system of PDEs (34) transforms into the following system of ODEs:
We derive the following expression for from the second equation in the reduced system of ODEs (47):
Using Equation (48), the first equation in the reduced system of ODEs (47) results in
After determining from (49), we use (48) to derive . Then, the closed-form solutions and to the system of ODEs (47) are given by
where and are arbitrary constants of integration.
Let and denote the initial values of susceptible and infected , respectively. Let represent the initial distributions of both population groups across the domain; then, the initial conditions are defined as follows:
3. Visualization of Closed-Form Solutions to Understand Transmission Dynamics of an Infectious Disease
This section focuses on visualizing the closed-form solution, as provided in Equation (55), for the RDA–SIS disease model with vital dynamics. Our analysis includes density plots, contour maps, heat maps, and two-dimensional representations of both population groups. We conducted a sensitivity analysis to understand the dynamic effects of the diffusion coefficient and advection rate on population profiles.
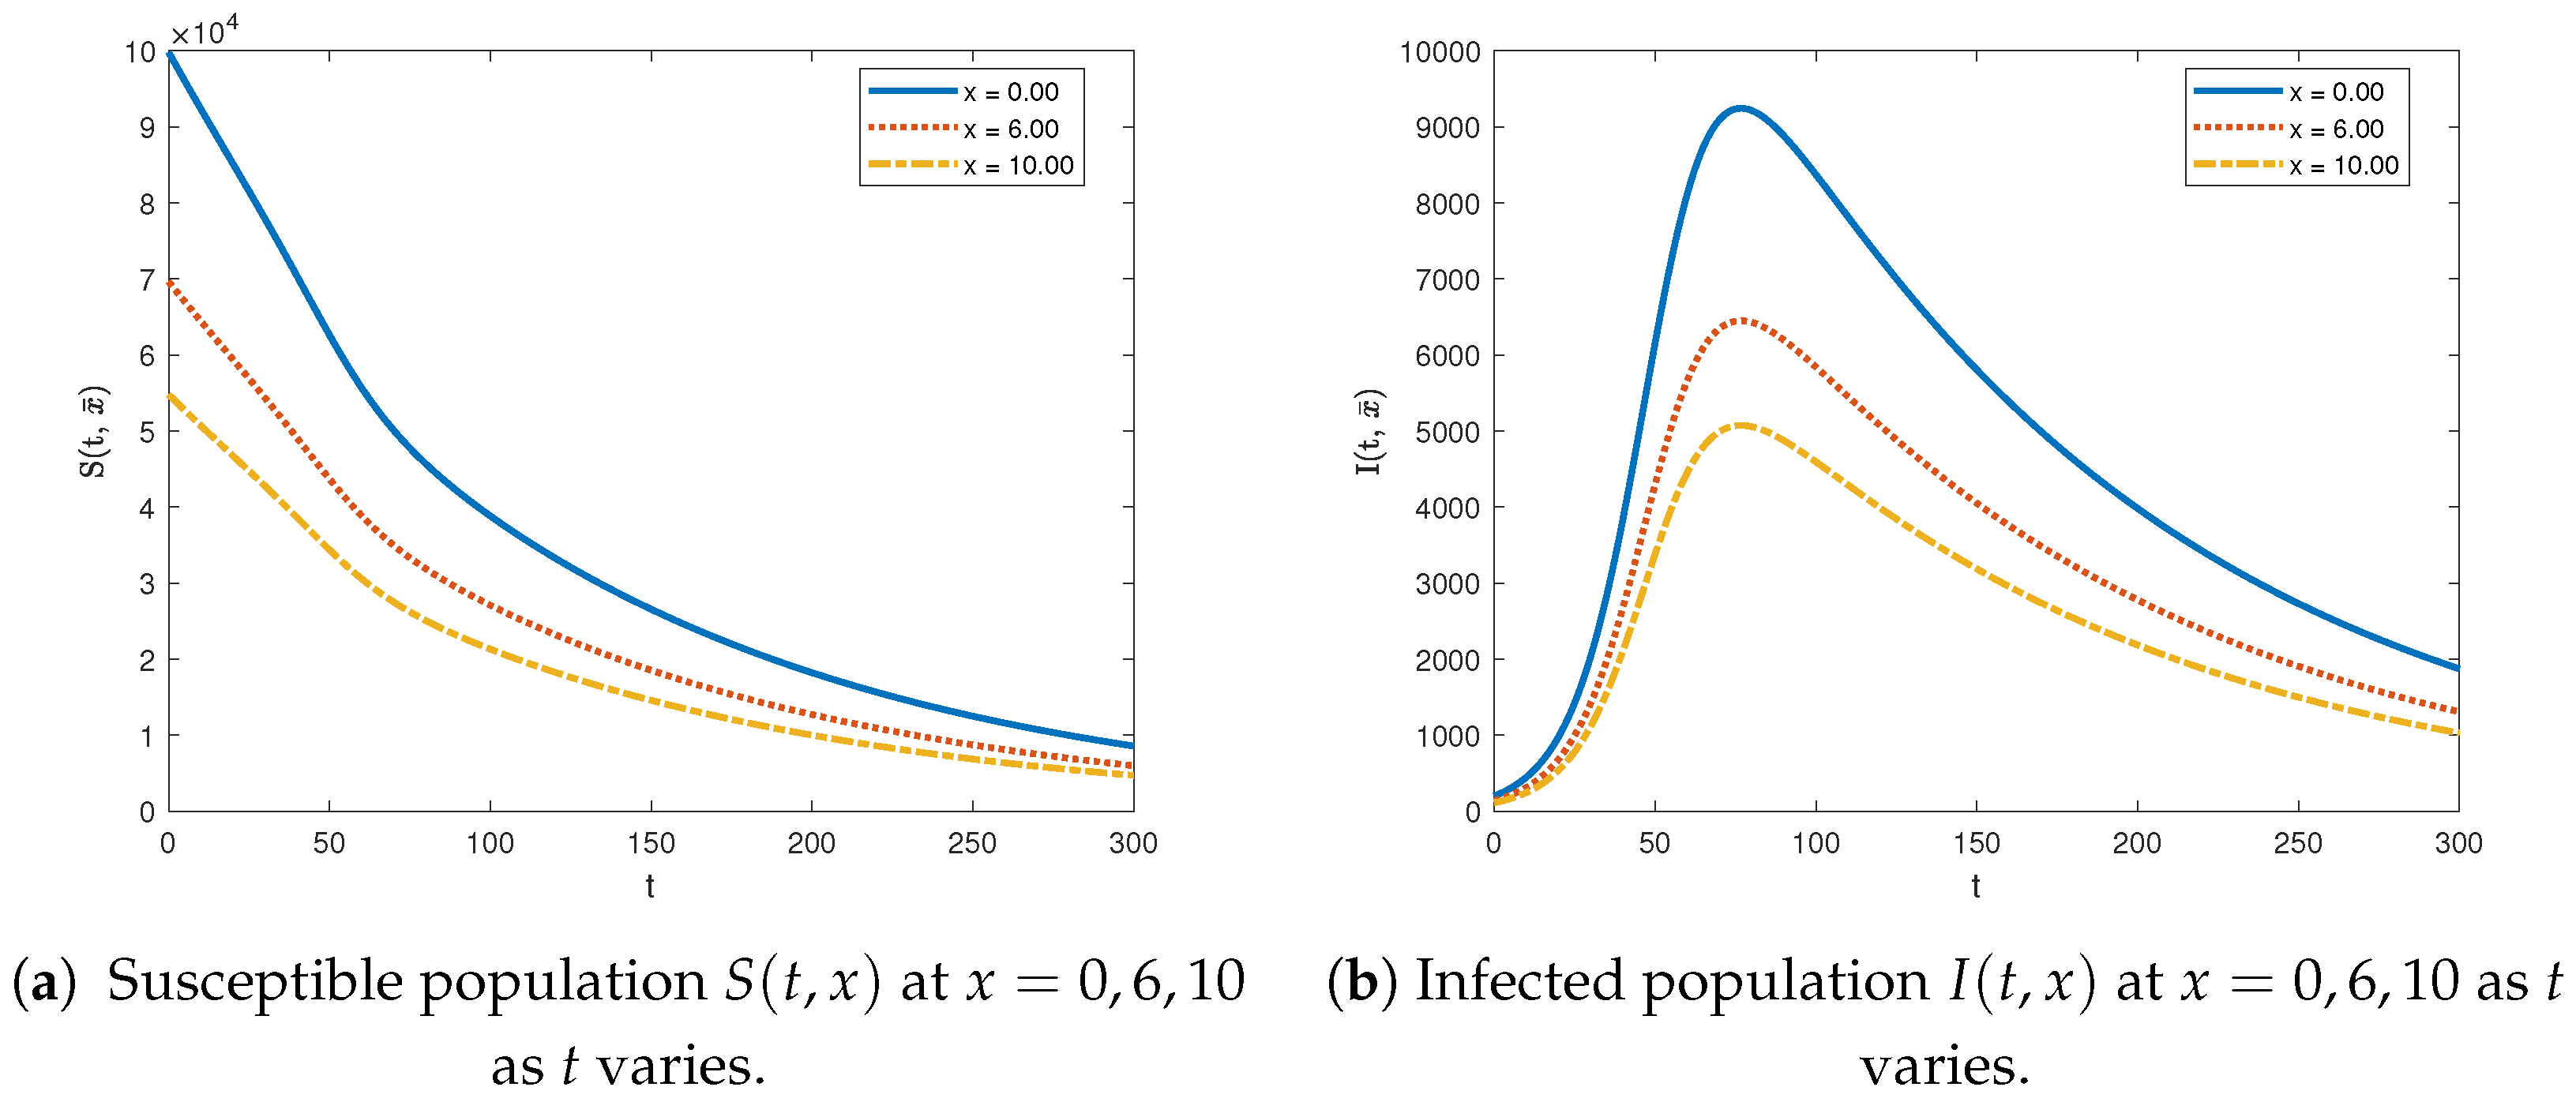
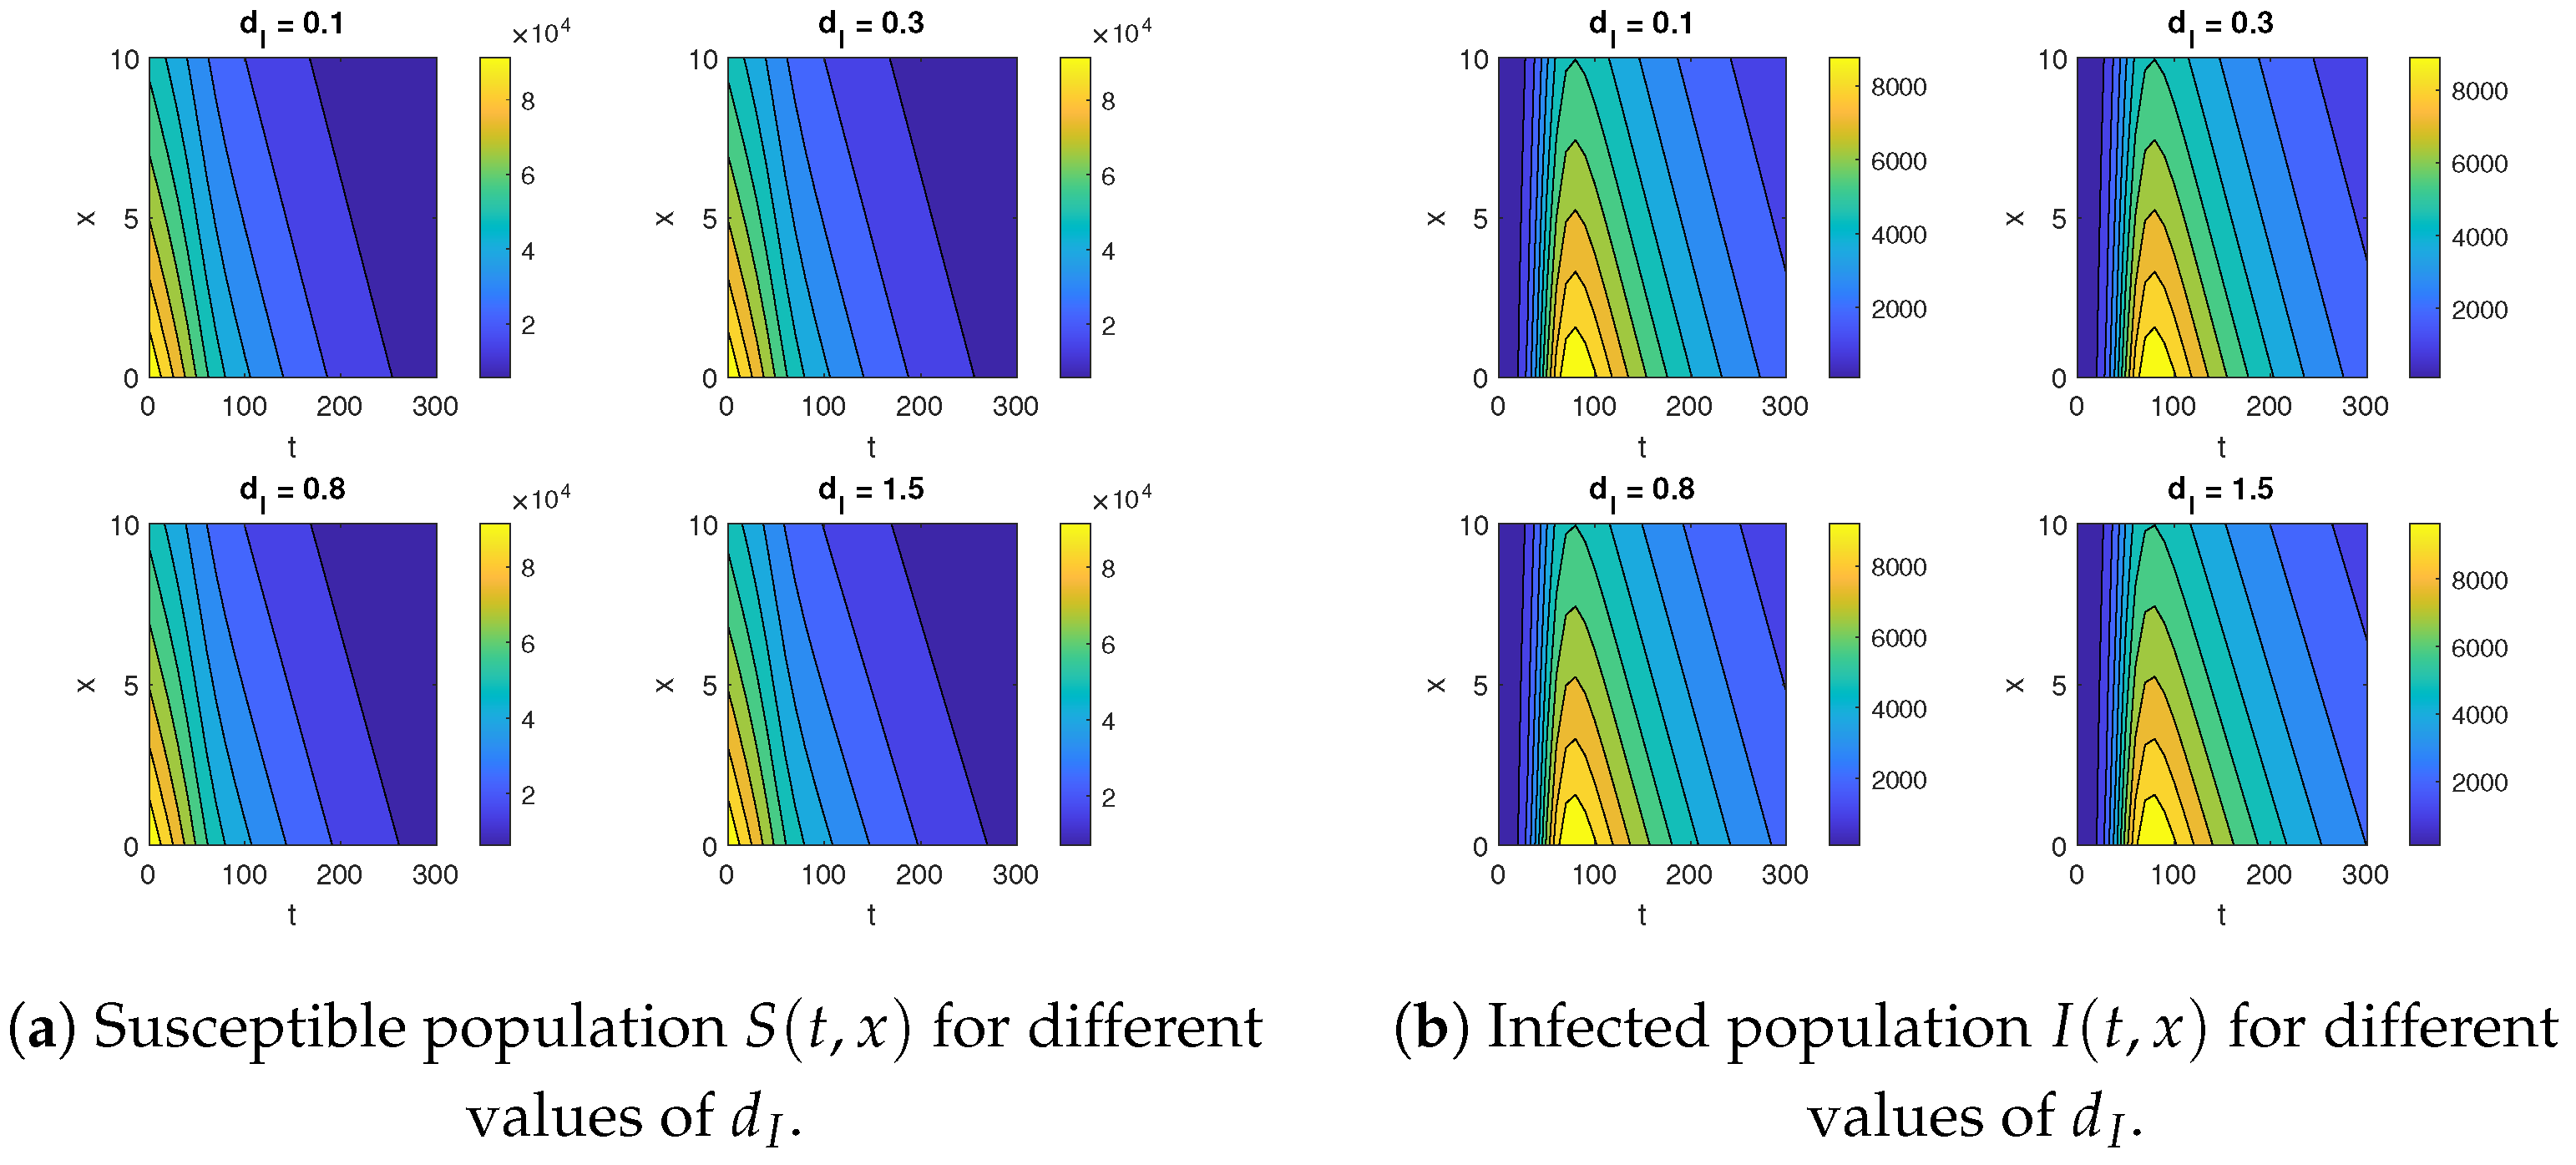
3.1. The Density Plot, Contour Map, Heat Map, and 2D Plots of Susceptible and Infected Populations: Figure 1, Figure 2 and Figure 3
The values of parameters employed are adopted from the established epidemiological literature [14,23,32,33] and references therein. The benchmark values of the initial densities of populations and the model parameters chosen for visualization are provided in Table 1.
Table 1.
Benchmark values of the initial densities of populations and parameters for the model.
Figure 1, Figure 2 and Figure 3 present the density plots, contour maps, heat maps, and two-dimensional plots of both populations: susceptible and infected.
Figure 1.
The density maps for susceptible and infected population groups for , , , , , , , , , over time interval and .
Figure 2.
The heat maps and contour maps of and for , , , , , , , , , over time interval and .
Figure 3.
Two-dimensional visualization of susceptible and infected population groups for , , , , , , , , , for and fixed values of .
We observe the trend in the susceptible population in Figure 1, Figure 2 and Figure 3. The susceptible population decreases over time t at the origin point where the disease emerges. The same trend is evident at other locations along x. As x increases, the number of susceptible members decreases. The trajectory of the susceptible population is highest at the origin and lowest at the point furthest from the disease source, . Naz and Torrisi [14] investigated RDA–SIS without vital dynamics. The population of susceptible individuals first decreases and then increases with respect to time t at the source of diseases and other locations as well.
For the infected population, Figure 1, Figure 2 and Figure 3 show that, at , the population increases, attains a peak, and then decreases. This pattern is consistent across other locations. The trajectory of the infected population is highest at and lowest at , which is further from the disease source. Naz and Torrisi [14], for RDA–SIS without vital dynamics, observed that the number of infected individuals increases rapidly at first, then shifts abruptly after a specific time period, and continues to increase at a steady pace thereafter.
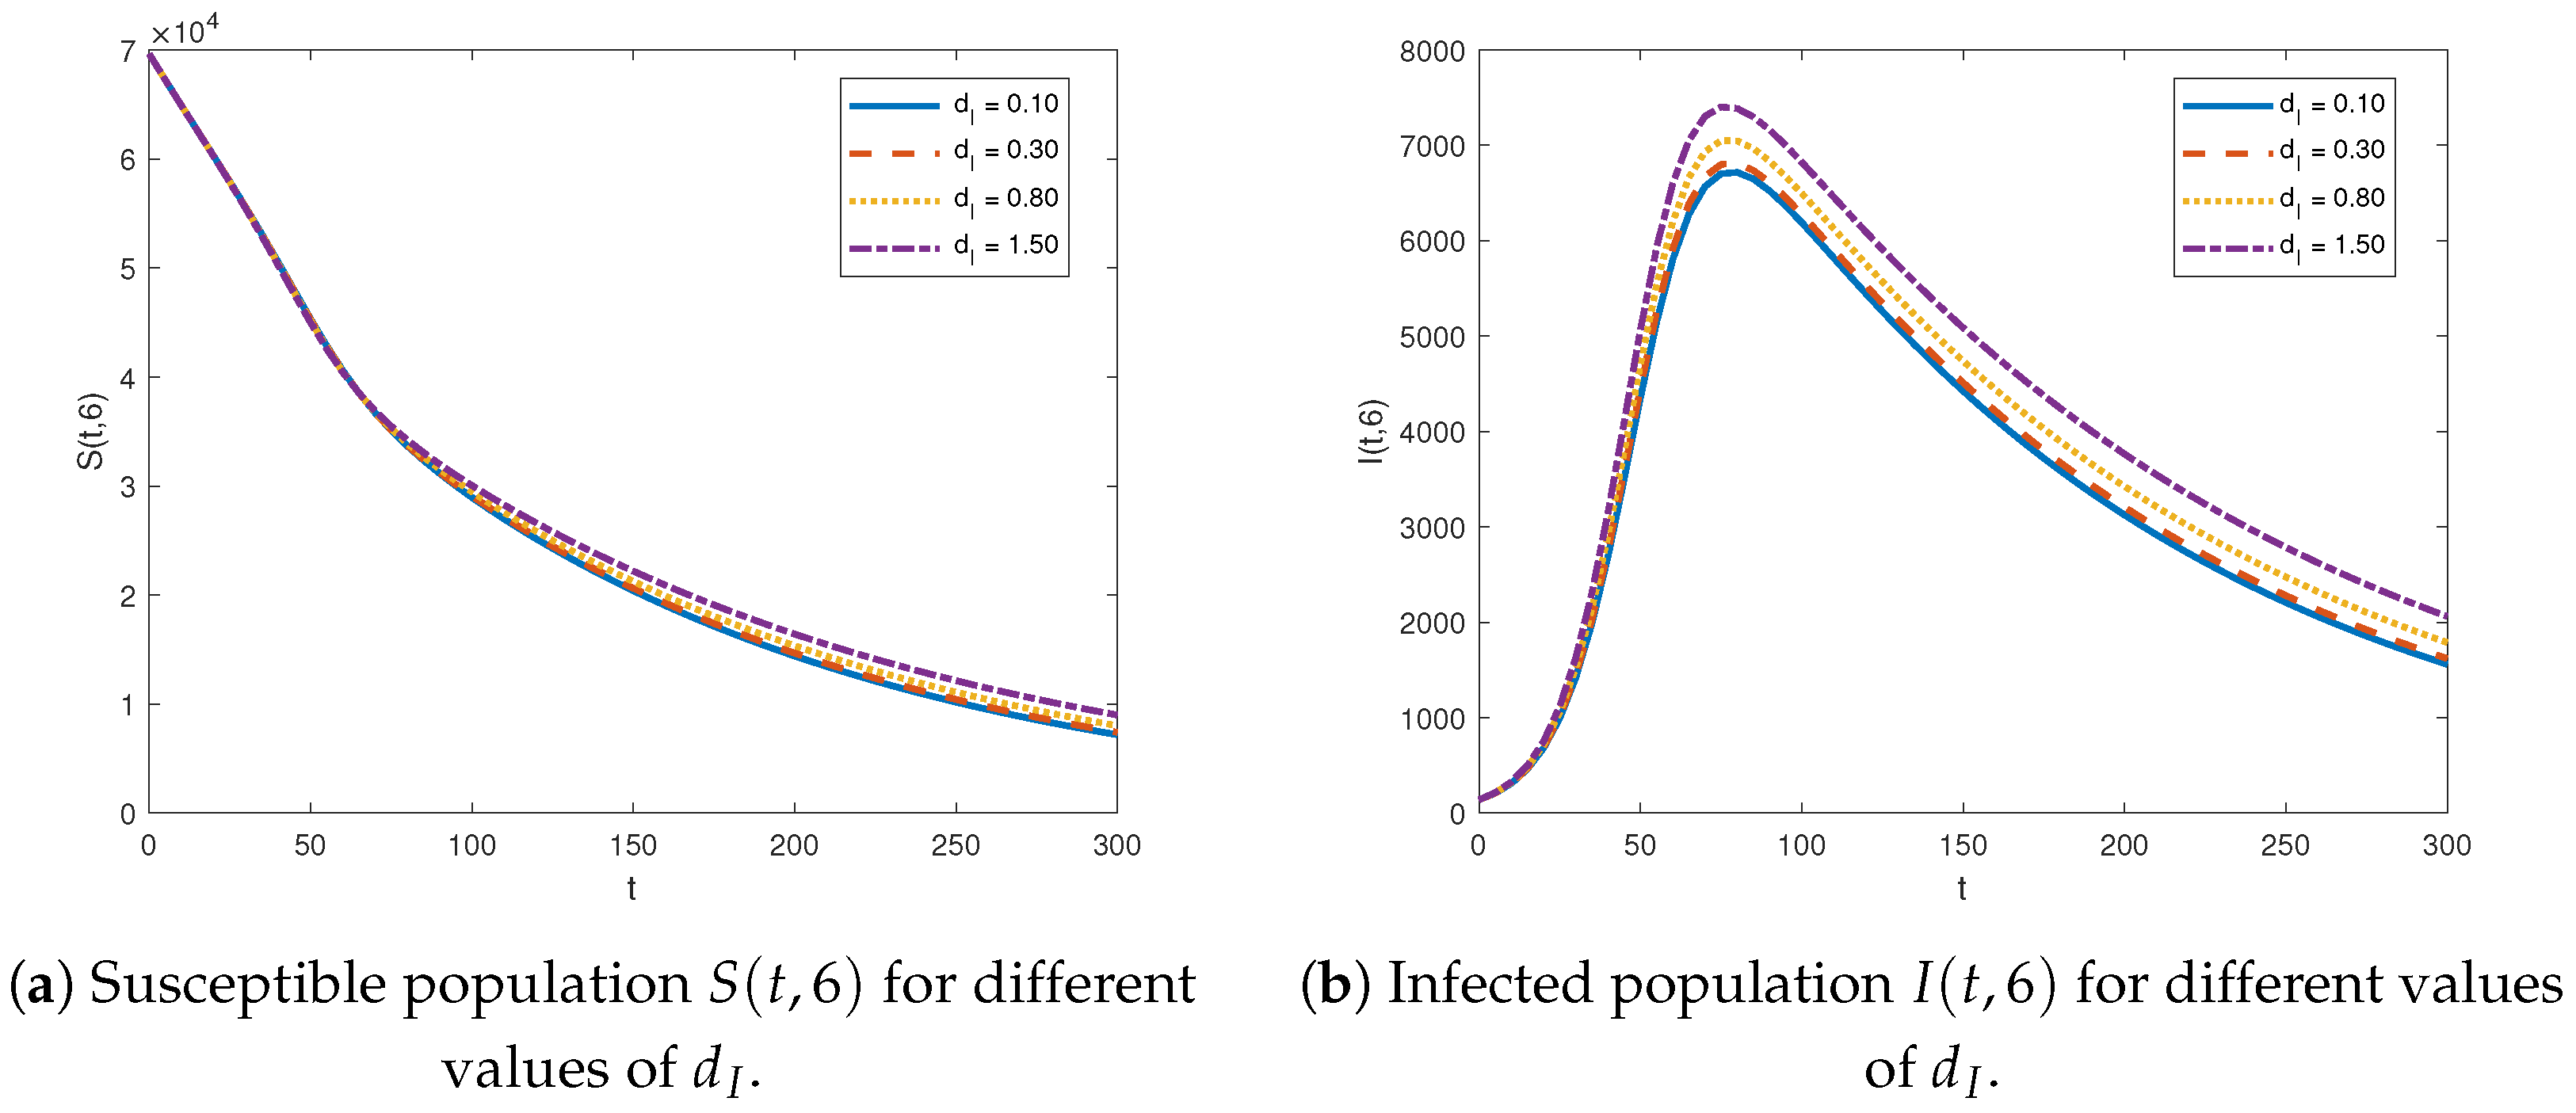
3.2. Dynamic Effects of Diffusion Coefficient on Infection Spread
By fixing all parameter values at the benchmark and varying the diffusion coefficient of the infected population, we generated Figure 4 and Figure 5. Figure 4 presents contour maps for both population groups across different values of the diffusion coefficient . In Figure 5, two-dimensional graphs of both population groups are shown for varying values of at a fixed location of . The upward shift in the graph of both population groups is observed as the diffusion coefficient for the infected increases. This means that higher diffusion coefficients result in higher values for both population groups. This upward shift is especially noticeable after the time t, when the epidemic peak is reached. A larger value of leads to an increased movement of individuals into the susceptible and infected compartments. A similar effect of varying the diffusion coefficient was observed in the RDA–SIS model without vital dynamics and equal diffusion rates, as shown in [14].
Figure 4.
Contour plots of susceptible and infected population groups for .
Figure 5.
Two-dimensional visualization of susceptible and infected for at fixed location .
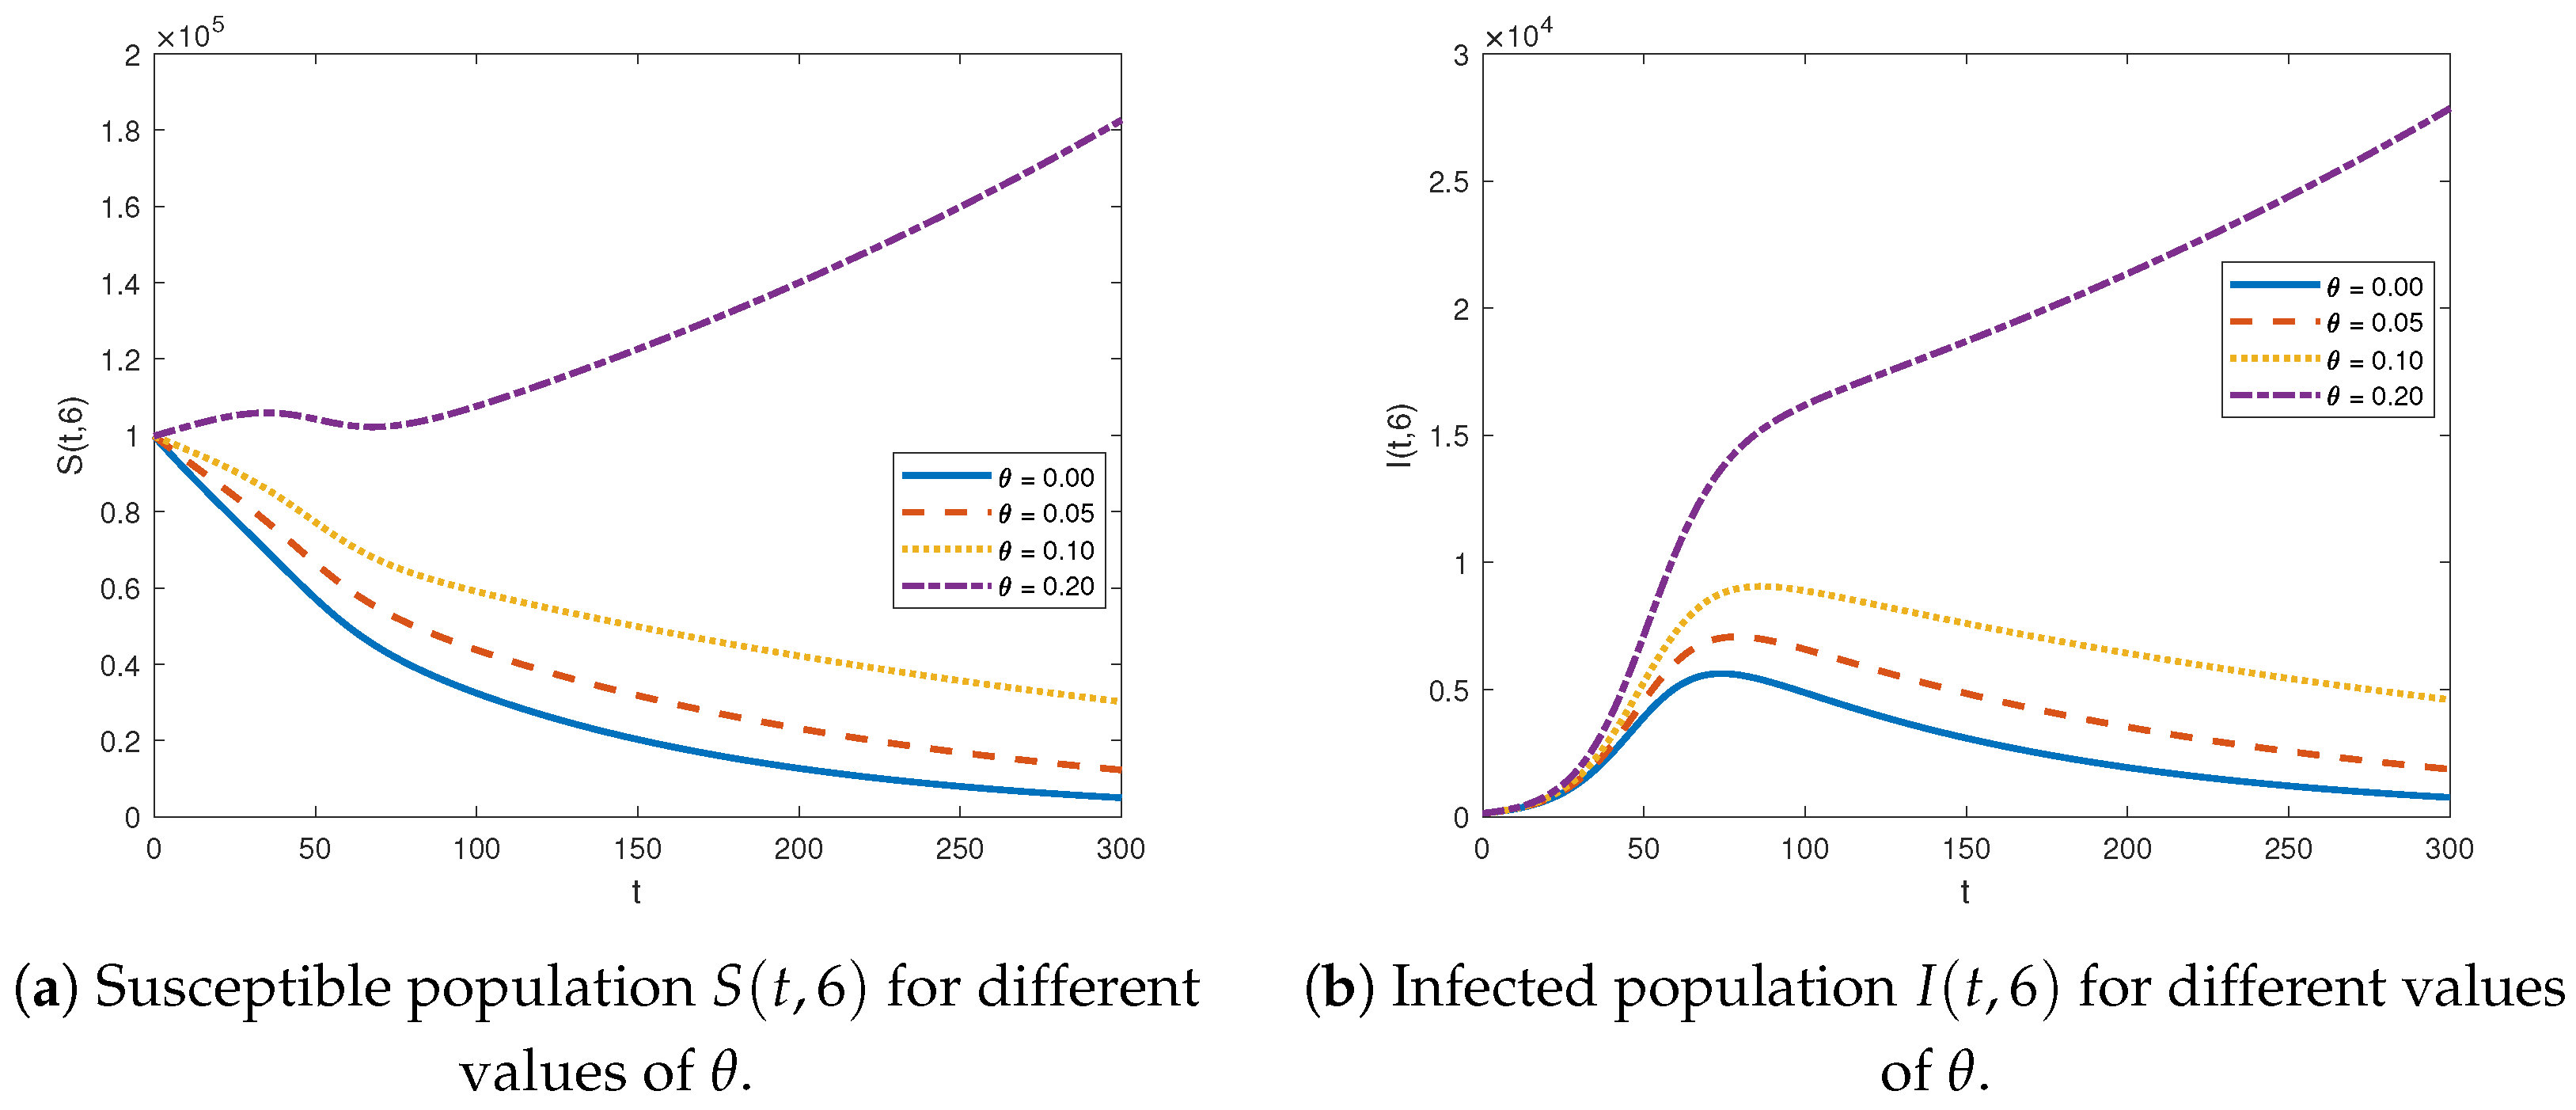
3.3. Dynamic Effects of Advection Rate on Infection Spread
We generated Figure 6 and Figure 7 by holding all parameter values at their benchmark levels while varying for susceptible and infected populations. Contour maps for the susceptible and infected population groups across varying advection rates, , are presented in Figure 6. At the fixed location , Figure 7 presents two-dimensional graphs of the susceptible and infected population groups for varying advection rates, . The graph of susceptible and infected population groups shifts upward as the advection rate increases, indicating that a higher advection rate leads to higher values for both populations. It is interesting to note that increasing the advection rate, , beyond a specific point results in significant changes in the trajectories of the susceptible population. When , the susceptible population decreases over time t, and the infected population increases, peaks, and then decreases. However, with , both populations abruptly shift and continue to rise over time. A similar dynamic effect of the advection rate was observed in the RDA–SIS model without vital dynamics and with equal diffusion rates, as demonstrated in [14].
Figure 6.
Contour plots of susceptible and infected population groups under varying advection velocities .
Figure 7.
Two-dimensional visualization of susceptible and infected at various advection velocities at fixed location .
4. Conclusions
In this paper, we investigated an RDA–SIS disease model, incorporating birth–death effects and a standard incidence infection mechanism. We searched for closed-form solutions by applying Lie group methods. Some linear combinations of Lie symmetries allowed us to reduce the system of second-order PDEs to systems of second-order ODEs. In this way, traveling wave solutions were derived by utilizing Lie symmetries and . A closed-form solution satisfying a Cauchy problem was established for the reduced system of first-order ODEs by using the combination of Lie symmetries and .
Moreover, we explored the closed-form solution associated with the Cauchy problem in detail to examine the spread mechanisms of the infectious disease. We selected the parameter values from the published studies to perform the graphical analysis. A sensitivity analysis was performed, providing insights that can inform prospective policy guidelines for disease management. The results were compared with those established for the RDA–SIS model with equal diffusion coefficients and without vital dynamics to understand how the birth–death factor affects the transmission dynamics of the infectious disease.
Since deriving closed-form solutions for complex mathematical models is challenging, we considered a one-dimensional model to enable analytical solutions. Modeling a multidimensional diffusive epidemic model and deriving solutions via group analysis remains an open question and will be considered in future work.
Author Contributions
Conceptualization, R.N., M.T. and A.I.; Methodology, R.N., M.T. and A.I.; Software, R.N., M.T. and A.I.; Formal analysis, R.N., M.T. and A.I.; Investigation, R.N., M.T. and A.I.; Resources, R.N., M.T. and A.I.; Writing—original draft, R.N., M.T. and A.I.; Writing—review and editing, R.N., M.T. and A.I.; Visualization, R.N., M.T. and A.I. All authors have read and agreed to the published version of the manuscript.
Funding
This research received no external funding.
Data Availability Statement
Data sharing not applicable to this article as no datasets were generated or analyzed during the current study. Data are contained within the article.
Acknowledgments
M.T. wrote this paper in the framework of G.N.F.M. of INdAM.
Conflicts of Interest
The authors declare that they have no known competing financial interests or personal relationships that could have appeared to influence the work reported in this paper.
References
- Cui, R.; Lou, Y. A spatial SIS model in advective heterogeneous environments. J. Differ. Equ. 2016, 261, 3305–3343. [Google Scholar] [CrossRef]
- Cui, R.; Lam, K.Y.; Lou, Y. Dynamics and asymptotic profiles of steady states of an epidemic model in advective environments. J. Differ. Equ. 2017, 263, 2343–2373. [Google Scholar] [CrossRef]
- Kuto, K.; Matsuzawa, H.; Peng, R. Concentration profile of endemic equilibrium of a reaction-diffusion-advection SIS epidemic model. Calc. Var. Partial. Differ. Equ. 2017, 56, 112. [Google Scholar] [CrossRef]
- Zhang, J.; Cui, R. Asymptotic behavior of an SIS reaction-diffusion-advection model with saturation and spontaneous infection mechanism. Z. Angew. Math. Und Phys. 2020, 71, 1–21. [Google Scholar] [CrossRef]
- Cui, R.; Li, H.; Peng, R.; Zhou, M. Concentration behavior of endemic equilibrium for a reaction-diffusion-advection SIS epidemic model with mass action infection mechanism. Calc. Var. Partial. Differ. 2021, 60, 184. [Google Scholar] [CrossRef]
- Cui, R. Asymptotic profiles of the endemic equilibrium of a reaction-diffusion-advection SIS epidemic model with saturated incidence rate. Discret. Contin. Dyn.-Syst.-Ser. 2021, 26, 2997–3022. [Google Scholar] [CrossRef]
- Lei, C.; Zhou, X. Concentration phenomenon of the endemic equilibrium of a reaction-diffusion-advection SIS epidemic model with spontaneous infection. Discret. Contin. Dyn.-Syst.-Ser. 2022, 27, 3077–3100. [Google Scholar] [CrossRef]
- Chen, X.; Cui, R. Analysis on a spatial SIS epidemic model with saturated incidence function in advective environments: I. Conserved Total Population. SIAM J. Appl. Math. 2023, 83, 2522–2544. [Google Scholar] [CrossRef]
- Li, H.; Peng, R.; Wang, F.B. Varying total population enhances disease persistence: Qualitative analysis on a diffusive SIS epidemic model. J. Differ. Equ. 2017, 262, 885–913. [Google Scholar] [CrossRef]
- Li, H.; Peng, R.; Wang, Z.A. On a diffusive susceptible-infected-susceptible epidemic model with mass action mechanism and birth-death effect: Analysis, simulations, and comparison with other mechanisms. SIAM J. Appl. Math. 2018, 78, 2129–2153. [Google Scholar] [CrossRef]
- Rao, X.; Zhang, G.; Wang, X. A reaction-diffusion-advection SIS epidemic model with linear external source and open advective environments. Discret. Contin. Dyn. Syst. B 2022, 27, 6655–6677. [Google Scholar] [CrossRef]
- Chen, X.; Cui, R. Qualitative analysis on a spatial SIS epidemic model with linear source in advective environments: I standard incidence. Z. Angew. Math. Physik 2022, 73, 150. [Google Scholar] [CrossRef]
- Chen, X.; Cui, R. Analysis on a spatial SIS epidemic model with saturated incidence function in advective environments: II. Varying total population. J. Differ. Equ. 2024, 402, 328–360. [Google Scholar] [CrossRef]
- Naz, R.; Torrisi, M. The Closed-Form Solutions of an SIS Epidemic Reaction-Diffusion Model with Advection in a One-Dimensional Space Domain. Symmetry 2024, 16, 948. [Google Scholar] [CrossRef]
- Bluman, G.W.; Kumei, S. Symmetries and Differential Equations; Springer: New York, NY, USA, 1989. [Google Scholar]
- Ibragimov, N.H. (Ed.) CRC Handbook of Lie Group Analysis of Differential Equations; CRC Press: Boca Raton, FL, USA, 1994–1996; Volume 1–3. [Google Scholar]
- Olver, P.J. Applications of Lie Groups to Differential Equations, 2nd ed.; Springer: New York, NY, USA, 1993. [Google Scholar]
- Ovsiannikov, L.V. Group Analysis of Differential Equations; Academic Press: New York, NY, USA, 1982. [Google Scholar]
- Hereman, W. Symbolic software for Lie symmetry analysis. In CRC Handbook of Lie Group Analysis of Differential Equations; CRC Press: Boca Raton, FL, USA, 1996; Volume 3, pp. 367–413. [Google Scholar] [CrossRef]
- Hereman, W. Review of symbolic software for Lie symmetry analysis. Math. Comput. Model. 1997, 25, 115–132. [Google Scholar] [CrossRef]
- Cheviakov, A.F. GeM software package for computation of symmetries and conservation laws of differential equations. Comput. Phys. Commun. 2007, 176, 48–61. [Google Scholar] [CrossRef]
- Rocha Filho, T.M.; Figueiredo, A. [SADE] a Maple package for the symmetry analysis of differential equations. Comput. Phys. Commun. 2011, 182, 467–476. [Google Scholar] [CrossRef]
- Naz, R.; Johnpillai, A.G.; Mahomed, F.M. The exact solutions of a diffusive SIR model via symmetry groups. J. Math. 2024, 2024, 4598831. [Google Scholar] [CrossRef]
- Torrisi, M.; Tracinà, R. An application of equivalence transformations to reaction diffusion equations. Symmetry 2015, 7, 1929–1944. [Google Scholar] [CrossRef]
- Cherniha, R.M.; Davydovych, V.V. A reaction-diffusion system with cross-diffusion: Lie symmetry, exact solutions and their applications in the pandemic modelling. Eur. J. Appl. Math. 2022, 33, 785–802. [Google Scholar] [CrossRef]
- Davydovych, V.; Dutka, V.; Cherniha, R. Reaction-Diffusion Equations in Mathematical Models Arising in Epidemiology. Symmetry 2023, 15, 2025. [Google Scholar] [CrossRef]
- Senthilvelan, M.; Torrisi, M. Potential symmetries and new solutions of a simplified model for reacting mixtures. J. Phys. Math. Gen. 2000, 33, 405. [Google Scholar] [CrossRef]
- Chaudhry, A.; Naz, R. The closed-form solutions for a model with technology diffusion via Lie symmetries. Discret. Contin. Dyn.-Syst. 2024. [Google Scholar] [CrossRef]
- Babei, N.A.; Kröger, M.; Özer, T. Dynamical behavior of the SEIARM-COVID-19 related models. Phys. Nonlinear Phenomena 2024, 468, 134291. [Google Scholar] [CrossRef]
- Seele, M.F.; Muatjetjeja, B.; Motsumi, T.G.; Adem, A.R. Invariance Analysis and Conservation Laws of a Modified (2 + 1)-Dimensional Ablowitz-Kaup-Newell-Segur Water Wave Dynamical Equation. J. Appl. Nonlinear Dyn. 2025, 14, 53–65. [Google Scholar]
- Mabenga, C.; Muatjetjeja, B.; Motsumi, T.G.; Adem, A.R. On the study of an extended coupled KdV system: Analytical solutions and conservation laws. Partial. Differ. Equ. Appl. Math. 2024, 11, 100849. [Google Scholar] [CrossRef]
- Thabet, H.; Kendre, S. Conformable mathematical modeling of the COVID-19 transmission dynamics: A more general study. Math. Methods Appl. Sci. 2023, 46, 18126–18149. [Google Scholar] [CrossRef]
- Cao, Q.; Liu, Y.; Yang, W. Global dynamics of a diffusive SIR epidemic model with saturated incidence rate and discontinuous treatments. Int. J. Dyn. Control 2022, 10, 1770–1777. [Google Scholar] [CrossRef]
Disclaimer/Publisher’s Note: The statements, opinions and data contained in all publications are solely those of the individual author(s) and contributor(s) and not of MDPI and/or the editor(s). MDPI and/or the editor(s) disclaim responsibility for any injury to people or property resulting from any ideas, methods, instructions or products referred to in the content. |
© 2024 by the authors. Licensee MDPI, Basel, Switzerland. This article is an open access article distributed under the terms and conditions of the Creative Commons Attribution (CC BY) license (https://creativecommons.org/licenses/by/4.0/).