Abstract
The q-rung orthopair fuzzy sets (q-ROFSs), a novel concept for processing vague information, offer a more potent and all-encompassing method compared to traditional fuzzy sets, intuitionistic fuzzy sets, and Pythagorean fuzzy sets. The inclusion of the parameter q allows for the q-rung orthopair fuzzy sets to capture a broader range of uncertainty of information. In this paper, we present two novel distance measures for q-ROFSs inspired by the Jensen–Shannon divergence, called and , and we analyze some properties they satisfy, such as non-degeneracy, symmetry, boundedness, and triangular inequality. Then, the normalized distance measures, called and , are proposed and we verify their rationality through numerical experiments. Finally, we apply the proposed distance measures to practical scenarios, including pattern recognition and multicriteria decision-making, and the results demonstrate the effectiveness of the proposed distance measures.
1. Introduction
The intricacies inherent in objective phenomena, combined with the constraints of human understanding, inevitably give rise to uncertainty [1,2]. A great number of theories have been proposed to model uncertainty, such as fuzzy sets [3,4], neutrosophic sets [5,6], rough sets [7,8], and evidence theory [2,9]. Fuzzy sets (FSs) [10], initially introduced by Zadeh, facilitate the handling of uncertainty by incorporating membership degree, offering a mathematical framework more adept at managing uncertainties. FSs have proven effective for addressing complexities and ambiguities. However, FSs represent only a certain level of uncertain information.
To encompass a broader spectrum and a higher degree of uncertainty, Atanassov [11] expanded upon this concept by introducing intuitionistic fuzzy sets (IFSs). IFSs include both membership () and non-membership () degrees, thereby providing a more detailed representation of uncertainty. Numerous researchers have explored various measures of distance or similarity between IFSs since the inception of the theory. Szmidt and Kacprzyk [12] introduced the Hamming distance and the Euclidean distance measures along with their normalized forms. Wang and Xin [13] formulated an expanded distance measure specifically for IFSs and effectively employed it to tackle pattern recognition challenges. Park et al. [14] introduced a new distance measure for IFSs, building upon the framework established by Wang and Xin [13]. Yang and Chiclana [15] introduced an innovative spherical distance measure specifically tailored for IFSs within a three-dimensional framework, effectively leveraging it in decision-making analysis for enhanced precision and accuracy. Further contributions include Son and Phong [16], who developed intuitionistic vector similarity measures, applying these measures to medical diagnosis. Ye [17] introduced two novel measures, i.e., cosine similarity and weighted cosine similarity, based on the cosine function, which effectively incorporate fuzzy information within the framework of IFSs. Xu [18] developed the Minkowski distance measure for IFSs and utilized it in solving pattern recognition and medical diagnosis. More recently, Xiao [19] introduced a novel distance measure based on the Jensen–Shannon divergence between IFSs. Li et al. [20] presented an intuitionistic fuzzy distance measure based on the Hellinger distance and applied it to pattern classification. These measures, however, face challenges when the sum of the membership and non-membership degrees exceeds one, complicating their applications.
Later, Yager [21] introduced an extension to IFSs, known as Pythagorean fuzzy sets (PFSs), which are characterized by membership and non-membership . In PFSs, the sum of the squares of these degrees does not exceed one, offering a richer representation of uncertainty. This development initiated numerous studies into the properties and applications of PFSs [22,23,24]. Liang and Xu [25] developed a measure for the TOPSIS within the context of PFSs. Wei and Lu [26] proposed a set of power-based aggregation functions tailored for PFSs. Wei [27] suggested some PF interaction aggregation functions with their utility in multicriteria decision-making (MCDM). Zhang and Xu developed a distance measure for PFSs that evaluates alternatives and introduced a modified TOPSIS method to tackle multicriteria decision-making. Zeng et al. [28] demonstrated the application of Pythagorean fuzzy measures to assess both distance and similarity in MCDM, underscoring the utility of these advanced fuzzy sets in complex decision-making scenarios. Farhadinia [29] introduced a variety of new similarity measures for PFSs. Xiao et al. [30] applied the distance measures based on the Jensen–Shannon divergence to the PFSs environment. Liu [31] proposed two Hellinger distance measures for PFSs. Senapati and Yager [32] further proposed Fermatean fuzzy sets (FFSs), which expand the constraint on the sum of membership and non-membership degrees to the cubic. A number of researchers have delved into FFSs to handle uncertain information. Zhou et al. [33] introduced a new distance measure based on the Jensen–Shannon divergence to the Fermatean fuzzy context. Deng and Wang [34] designed two distance measures for FFSs based on the Hellinger distance and the triangular divergence. Liu [35] proposed a new distance measure for FFSs to overcome the limitations of the previous triangular divergence. Recently, Liu [36] developed some Fermatean fuzzy similarity measures according to Tanimoto and Sørensen coefficients and applied them to various applications.
Expanding the field of fuzzy logic, Yager [37] introduced the concept of q-rung orthopair fuzzy sets (q-ROFSs), which enhance the representation of uncertainty by utilizing the adjustable parameter q. The key characteristics of q-ROFSs include membership and non-membership degrees, where the sum of their q powers does not exceed 1, expressed as . One significant benefit of q-ROFSs is their flexible and comprehensive depiction of uncertainty. By varying the q value, the granularity of the uncertainty representation can be adjusted over a wider spectrum, making q-ROFSs particularly suitable for more complex decision-making scenarios and handling a diverse range of information. Since their introduction, q-ROFSs have been extensively explored in the literature, with numerous studies contributing to their development. An increasing array of distance or similarity measures have been proposed, enhancing their utility. For example, Wang et al. [38] extended some similarity measure based on the cosine and cotangent functions from PFSs to q-ROFSs. Liu et al. [39] proposed a new similarity measure for q-ROFSs by combining cosine similarity and Euclidean distance. Singh [40] developed new correlation coefficients to assess the degree and nature of the correlation between q-ROFSs. Ali [41] proposed a new distance measure for q-ROFSs, rooted in the matrix norm and strictly monotonic functions. Rani et al. [42] developed a distance measure inspired by the Hausdorff distance for q-ROFSs. Du [43] introduced distance measures of the Minkowski type for q-ROFSs. Turkarslan [44] proposed a distance measure between q-ROFSs using the Choquet integral, and great results were achieved in pattern recognition.
Evidently, q-ROFSs possess a broader scope than both IFSs and PFSs, enabling them to encapsulate a richer array of fuzzy information and offer a more comprehensive representation of uncertainty and vagueness. However, there are challenges with some existing distance measures for q-ROFSs, such as producing identical results when assessing differences between distinct q-ROFSs, which can lead to unreasonable outcomes. This limits their discriminative capacity in more complex ambiguous environments. Therefore, it is logical to propose new solutions to address this limitation. Moreover, to date, the literature lacks examples of using the Jensen–Shannon divergence as a basis for defining a distance measure for q-ROFSs. Motivated by these gaps, we aim to introduce two novel distance measures for q-ROFSs that utilize the Jensen–Shannon divergence, potentially offering a more robust and effective tool for measuring differences within this framework.
The main contributions of this paper are displayed as follows:
- We propose two new distance measures, i.e., a two-dimensional distance measure of a q-ROFS, which considers membership and non-membership degrees, and a three-dimensional distance measure of q-ROFSs, considering membership, non-membership, and hesitancy degrees.
- We analyze some properties that the proposed distance measures satisfy, such as non-degeneracy, symmetry, boundedness, and triangle inequality.
- We apply the proposed distance measures to pattern recognition and multicriteria decision-making issues, and excellent results are obtained to verify their performance.
The rest of this paper is structured as follows. In Section 2, we review some essential knowledge of IFSs, PFSs, FFSs, and q-ROFSs briefly. In Section 3, we first introduce the concept of the Jensen–Shannon divergence. Then, we define two novel distance measures for q-ROFSs based on the Jensen–Shannon divergence and prove some properties. In Section 4, the effectiveness of the proposed measures is verified by some numerical examples. Subsequently, we apply the proposed measures to practical applications including pattern recognition and multicriteria decision-making in Section 5. We conclude this paper in Section 6.
2. Preliminaries
In this section, we will review the fundamental concepts related to IFSs, PFSs, FFSs, and q-ROFSs and introduce some existing q-ROFS distance measures.
2.1. Intuitionistic Fuzzy Sets
Definition 1.
[11] Let X be the universe of discourse (UOD), and an intuitionistic fuzzy set I in X is defined below:
where ,: denote the membership degree and non-membership degree of , respectively. For any , we have the following constraint:
The hesitancy degree is as follows:
2.2. Pythagorean Fuzzy Sets
Definition 2.
[21] Let X be the UOD, and a Pythagorean fuzzy set P in X is defined below:
where : represents the membership degree of and : expresses the non-membership degree of . For any , and meet the following:
The hesitancy degree of is determined below:
2.3. Fermatean Fuzzy Sets
Definition 3.
[32] Suppose that X is a finite UOD. The Fermatean fuzzy set F in X is defined below:
where : represents the membership degree of and : expresses the non-membership degree of . For any , and meet the following:
For any , the hesitancy degree of the element x is determined below:
2.4. Q-Rung Orthopair Fuzzy Sets
Definition 4.
[37] Let X be a finite UOD. The q-rung orthopair fuzzy set Q in X can be denoted as:
where : means the membership degree of and signifies the non-membership degree of . For any , and satisfy the following conditions:
The hesitancy degree can be formulated as:
2.5. Distance Measures for q-ROFSs
Let and be two q-rung orthopair fuzzy sets in the UOD X. and demonstrate a distance measure and a similarity measure between the q-ROFSs, respectively [38,45].
Definition 5.
Let and be two q-ROFSs, and the distance measures are listed below:
Definition 6.
Let and be two q-ROFSs, and the similarity measures are listed below:
Definition 7.
Let and be two q-ROFSs. According to the similarity measures above, there are some distance measures defined as follows:
3. Two New Distance Measures of -ROFSs
In this section, we propose two new distance measures specifically for q-ROFSs, drawing inspiration from the Jensen–Shannon divergence. Moreover, we deduce and prove the properties of these suggested measures, ensuring their accuracy and reliability.
3.1. Jensen–Shannon Divergence
Definition 8.
[19] Assuming that and are two probability distributions, the Jensen–Shannon divergence between them is formally defined in the following manner:
with
where KL(P,Q) represents the Kullback–Leibler divergence.
can alternatively be represented using the subsequent equation:
with
where , , and represent the Shannon entropy.
3.2. Two-Dimensional (2D) Distance Measure of q-ROFSs
Definition 9.
Suppose that and are two q-ROFSs in the UOD X. For any , then the distance between and is defined below:
Property 1.
Let , , and be three q-ROFSs in the UOD X, and the properties of are displayed as follows:
- 1.
- Non-degeneracy: , if and only if ;
- 2.
- Symmetry: ;
- 3.
- Boundedness: ;
- 4.
- Triangular inequality: .
Proof.
, if and only if .
Considering two q-ROFSs in the UOD X that meet the condition , we can obtain that:
Then, we have:
Hence, we obtain
When , we have:
Thus,
Hence, we obtain
□
Proof.
.
Given two q-ROFSs and in the UOD X, we have:
Thereby, we can prove that . □
Proof.
.
Given two q-ROFSs and in the UOD X, we can obtain that:
The proof for was established in [46].
Then, we have:
where is the variational distance.
As proven in [47],
Thereby, we can obtain:
Consequently, it is proved that .
□
Proof.
.
There exists three q-ROFSs , , and in X, considering assumptions for evaluation:
Given the assumptions and , it becomes evident that the triangle inequality holds true in the manner described below:
With assumption , we obtain:
Then, the calculation can be determined:
With assumption in place, it can be inferred that similarly:
As a result, the triangle inequality remains valid when founded on assumptions and , in which case
In a similar fashion, we can deduce that
Consequently, the triangle inequality property for has been proven, as shown by the following:
□
3.3. Three-Dimensional (3D) Distance Measure of q-ROFSs
Definition 10.
Let and be two q-ROFSs. The hesitancy grades of and are represented by and , respectively. For any , the distance measure between and is defined as follows:
Property 2.
Consider the three q-ROFSs , , and in the UOD X, and the properties that should satisfy are displayed by:
- 1.
- Non-degeneracy: , if and only if ;
- 2.
- Symmetry: ;
- 3.
- Boundedness: ;
- 4.
- Triangular inequality: .
Proof.
The proof of Property 2 is similar to Property 1. □
Definition 11.
Assume that and are two q-ROFSs in the UOD , and the normalized distance measures between and are defined as follows:
Property 3.
Consider the three q-ROFSs , , and in the UOD X, and the properties that and should satisfy are displayed by:
- 1.
- Non-degeneracy: , and , if and only if ;
- 2.
- Symmetry: , and ;
- 3.
- Boundedness: , and ;
- 4.
- Triangular inequality: , and .
Proof.
The proof of Property 3 is similar to Property 1. □
4. Numerical Examples
In the following section, we illustrate the properties of the two novel distance measures with some examples.
Example 1.
Given the three q-ROFSs , , and in , they are listed as follows:
If , according to Equations (19) and (20), the distance between the q-ROFSs , , and can be calculated as:
The values of are depicted as follows:
The values of are depicted as follows:
We can verify that the proposed measures satisfy the first two properties according to the calculated results.
Example 2.
There are three q-ROFSs , , and in , which are expressed as follows:
If , the values of the and distance measures are depicted as follows:
Then, it is calculated that
Thereby, this result verifies the property:
Example 3.
Consider two q-ROFSs and in X, where
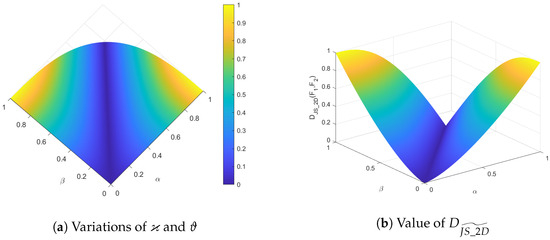
The range of the parameters ϰ and ϑ are and meet the requirement that . Equation (19) is used to compute the distance between and . (Assume .)
Figure 1a shows the variations of ϰ and ϑ. Figure 1b demonstrates that when ϰ and ϑ vary from 0 to 1, the values of vary within . When , the distance between and is 0. Moreover, when , has a maximum of 1. With these results, we can verify the property of the boundedness of .
Figure 1.
distance measure between and .
Example 4.
Let and be two q-ROFSs in X. To compare the experimental results of the proposed distance measures with the existing measures, two cases of q-ROFSs are employed, and the findings are presented in Table 1 (suppose q = 4).
From Table 1, we find that Case 1 and Case 2 are two different q-ROFSs. However, the values calculated by , , , , and are equal, which indicates that these existing distance measures will lead to counter-intuitive results. Additionally, , , , , , , and our proposed distance measures and can generate accurate results. This suggests that our proposed measures demonstrate remarkable efficacy in discriminating between distinct q-ROFSs.

Table 1.
Comparisons of various similarity measures in Example 4.
Table 1.
Comparisons of various similarity measures in Example 4.
| Distance | Case 1 | Case 2 |
|---|---|---|
| 0.0609 | 0.0609 | |
| 0.1148 | 0.1148 | |
| 0.1148 | 0.1148 | |
| 0.9637 | 0.6913 | |
| 0.0800 | 0.0587 | |
| 0.9121 | 0.5640 | |
| 0.4378 | 0.2427 | |
| 0.0914 | 0.0914 | |
| 0.0646 | 0.0467 | |
| 0.0914 | 0.0914 | |
| 0.0913 | 0.0902 | |
| 0.1894 | 0.1633 | |
| 0.1900 | 0.1654 |
5. Applications
In this section, we will present two examples involving the developed distance measures within a q-rung orthopair fuzzy environment. The measures introduced in this study are utilized in pattern recognition and multicriteria decision-making, showcasing the efficiency of these measures.
5.1. Pattern Recognition
Problem description: Given a finite UOD . There are k patterns . Every pattern is depicted by a q-ROFS denoted as (). For m test samples, are represented by q-ROFSs as (). The objective is to classify the test sample according to the designated pattern, ensuring accurate categorization.
Step 1: We use the suggested measures for measuring the distance between the known pattern and the test sample .
Step 2: The minimum distance among all the calculated distances between the pattern and the sample will be selected by using the equation below:
Step 3: The result of classifying the sample is determined as follows:
The pseudocode of the proposed algorithm is shown in Algorithm 1.
| Algorithm 1 Pattern classification algorithm. |
Example 5.
Assume that are four known patterns in . Each pattern is represented by a q-ROFS as and the sample Q is expressed as . The purpose is to categorize the sample Q based on the known patterns. The distance between Q and computed by different distance measures is displayed in Table 2, where .
Aiming to probe deeply into the flexibility and sensitivity characteristics of the parameter q, we choose a different value q to measure the distance between and Q, and the result is shown in Table 3.
Step 1: Different distance measures are employed to compute the distances between Q and . Table 2 shows the results.
Step 2: The minimum distances between Q and based on and are depicted as follows:
Step 3: The classification outcome of Q is determined as follows:
As shown in Table 2, it is obvious that there is a minimum distance between and Q calculated by the majority of the q-ROFS distance measures, including the suggested q-ROFS measures. Thus, the sample Q should be assigned to . Furthermore, we notice that and classify Q as . This does not align with our initial expectations. Therefore, the existing measures and make it difficult to obtain satisfactory results in practical application.
To assess the impact of altering the parameter q on the outcomes, we incorporate various values into the proposed distance measures. From Table 3 and Table 4, we can find that as the value of q rises, the distance between and Q remains consistently the smallest, which indicates that the sample Q should be allocated to the known pattern . Hence, we conclude that the distance measures we introduced are capable of achieving identical results as the existing measures and avoiding counter-intuitive results in the application of pattern recognition.
Table 2.
Compare with various distance measures for Example 5.
Table 2.
Compare with various distance measures for Example 5.
| Method | |||||
|---|---|---|---|---|---|
| 0.0514 | 0.0956 | 0.2982 | 0.0638 | ||
| 0.0975 | 0.1738 | 0.4360 | 0.1169 | ||
| 0.0978 | 0.1746 | 0.4593 | 0.1200 | ||
| 0.4141 | 0.6233 | 0.7383 | 0.5184 | ||
| 0.0789 | 0.1483 | 0.3285 | 0.0699 | ||
| 0.1030 | 0.1441 | 0.1750 | 0.1084 | ||
| 0.0379 | 0.0586 | 0.0719 | 0.0434 | ||
| 0.0775 | 0.1395 | 0.3721 | 0.0936 | ||
| 0.0624 | 0.1214 | 0.2637 | 0.0554 | ||
| 0.0852 | 0.1742 | 0.3955 | 0.0998 | ||
| 0.0845 | 0.1766 | 0.4316 | 0.1033 | ||
| 0.1003 | 0.1835 | 0.3140 | 0.1119 | ||
| 0.1016 | 0.1907 | 0.4302 | 0.1174 |
Table 3.
between Q and with different q value in Example 5.
Table 3.
between Q and with different q value in Example 5.
| q | |||||
|---|---|---|---|---|---|
| 3 | 0.1003 | 0.1835 | 0.3140 | 0.1119 | |
| 4 | 0.0831 | 0.1544 | 0.2999 | 0.0894 | |
| 5 | 0.0654 | 0.1233 | 0.2743 | 0.0691 | |
| 6 | 0.0501 | 0.0958 | 0.2458 | 0.0521 | |
| 7 | 0.0378 | 0.0733 | 0.2182 | 0.0387 | |
| 8 | 0.0282 | 0.0556 | 0.1930 | 0.0285 |
Table 4.
between Q and with different q value in Example 5.
Table 4.
between Q and with different q value in Example 5.
| q | |||||
|---|---|---|---|---|---|
| 3 | 0.1016 | 0.1907 | 0.4302 | 0.1174 | |
| 4 | 0.0834 | 0.1568 | 0.3575 | 0.0916 | |
| 5 | 0.0655 | 0.1242 | 0.3097 | 0.0698 | |
| 6 | 0.0501 | 0.0961 | 0.2692 | 0.0523 | |
| 7 | 0.0378 | 0.0734 | 0.2343 | 0.0388 | |
| 8 | 0.0282 | 0.0556 | 0.2045 | 0.0285 |
5.2. Multicriteria Decision-Making
In this study, we showcase the effectiveness of the proposed q-ROFS distance measures in tackling multicriteria decision-making issues that are inherently uncertain and ambiguous.
Problem description: We have m feasible alternatives expressed as and n criteria expressed as . The goal is to determine the best alternative.
Step 1: Construct the decision matrix that includes the data pertaining to the available options in relation to the criteria. In this matrix, signifies the extent to which option fulfills the criteria , whereas denotes the extent to which it falls short of satisfying the same criteria.
Step 2: Formulate the normalized decision matrix using Equation (23).
Step 3: Determine the q-ROFSs’s ideal opinion where and
Step 4: Compute the distance of the alternative from the q-ROFSs’s ideal solution utilizing the proposed q-ROFS distance measures and .
Step 5: Rank the alternatives in ascending order according to their distance, with the one having the minimum distance deemed as the most optimal alternative.
Example 6.
Considering the problem for choosing one among five different houses to purchase, a prospective homebuyer will take into account the following criteria when making a purchase decision.
: Ceiling height, : Design, : Location, : Purchase price, and : Ventilation.
Step 1: The details regarding the five houses based on the previously mentioned criteria are represented by q-ROFSs within Table 5.
Step 2: Given that attribute is the only cost attribute, we utilize Equation (23) to establish the normalized decision matrix, as depicted in Table 6.
Step 3: Assume that all the attributes have the same weight. Then, we will determine the q-ROFS’s ideal opinion where and . So, the q-ROFS’s ideal solution is expressed as:
Step 4: We compute the distance of each alternative from the q-ROFS’s ideal solution with the novel distance measures given in Equations (19) and (20). The result is shown in Table 7 (suppose ).
Step 5: In ascending order of distance, the final ranking of alternatives is depicted in Table 8.
Table 8 demonstrates that while the ranking outcomes derived from various distance measures may vary, the optimal alternative consistently remains , and the second most desirable choice is . Thus, we conclude that is the most feasible option considering all the proposed q-ROFS distance measures. This demonstrates that our proposed measures can attain consistent outcomes with the established measures when addressing multicriteria decision-making challenges. In other words, the two proposed q-ROFS distance measures are effective for evaluation.
Table 5.
Decision matrix.
Table 5.
Decision matrix.
Table 6.
Normalized decision matrix.
Table 6.
Normalized decision matrix.
Table 7.
The distance of each alternative from the q-ROFS ideal solution.
Table 7.
The distance of each alternative from the q-ROFS ideal solution.
| 0.2366 | 0.1302 | 0.3788 | 0.3362 | 0.3886 | |
| 0.3429 | 0.2100 | 0.5296 | 0.4711 | 0.5233 | |
| 0.3824 | 0.2304 | 0.5494 | 0.5032 | 0.5597 | |
| 0.5510 | 0.4658 | 0.7878 | 0.7680 | 0.7696 | |
| 0.2768 | 0.1485 | 0.4656 | 0.4260 | 0.4695 | |
| 0.2920 | 0.2486 | 0.6159 | 0.5134 | 0.4663 | |
| 0.1328 | 0.1166 | 0.2883 | 0.2405 | 0.2136 | |
| 0.2933 | 0.1739 | 0.4588 | 0.4075 | 0.4595 | |
| 0.2146 | 0.1482 | 0.3464 | 0.3148 | 0.3436 | |
| 0.2933 | 0.1739 | 0.4588 | 0.4075 | 0.4595 | |
| 0.2776 | 0.1697 | 0.4547 | 0.4020 | 0.4571 | |
| 0.2526 | 0.1839 | 0.4062 | 0.3876 | 0.3757 | |
| 0.2698 | 0.1854 | 0.4340 | 0.4013 | 0.4009 |
Table 8.
Ranking of the alternatives.
Table 8.
Ranking of the alternatives.
| Ranking | |
|---|---|
6. Conclusions
In this study, we proposed two new distance measures based on the Jensen–Shannon divergence, called and . The proposed measures comply with the fundamental definition of a distance measure, demonstrating its capability to accurately measure the variance between q-rung orthopair fuzzy sets. Furthermore, the normalized forms for the distance measure are also introduced. Numerical experiments show that the proposed measures can satisfy the axioms for distance measures. Finally, the application of the proposed measures across various fields has yielded accurate outcomes. By comparing with the existing methods, it verifies the feasibility and rationality of the proposed measures. Additionally, as the value of the rung q rises, q-ROFSs can be utilized to encompass a broader spectrum of decision-making information.
It is important to note that the proposed distance measures encounter several challenges. For instance, in practical applications, various attributes or criteria often carry differing levels of importance in decision-making processes. However, the current distance measures treat each attribute equally, which may not reflect the nuanced realities of these decisions. In the future, integrating these measures with weighted information could enhance their practicality and effectiveness in solving real-world problems. Additionally, there is an opportunity to extend the application of these distance measures to more complex decision-making environments.
Author Contributions
Conceptualization, Z.L.; methodology, Z.L.; software, D.W.; validation, D.W., Y.Y. and S.Z.; formal analysis, Z.L.; investigation, D.W. and Y.Y.; visualization, Y.Y., S.Z. and Z.S.; writing—original draft preparation, D.W., Y.Y. and S.Z.; writing—review and editing, Z.L. and Z.S.; supervision, Z.L. and Z.S. All authors have read and agreed to the published version of this manuscript.
Funding
This research received no external funding.
Data Availability Statement
Data are contained within this paper.
Conflicts of Interest
The authors declare no conflicts of interest.
References
- Liu, Z.; Letchmunan, S. Representing uncertainty and imprecision in machine learning: A survey on belief functions. J. King Saud-Univ.-Comput. Inf. Sci. 2024, 36, 101904. [Google Scholar] [CrossRef]
- Liu, Z.; Letchmunan, S. Enhanced fuzzy clustering for incomplete instance with evidence combination. ACM Trans. Knowl. Discov. Data 2024, 18, 1–20. [Google Scholar] [CrossRef]
- Noor, M.; Jamil, M.K.; Ullah, K.; Azeem, M.; Pamucar, D.; Almohsen, B. Energies of T-spherical fuzzy graph based on novel Aczel-Alsina T-norm and T-conorm with their applications in decision making. J. Intell. Fuzzy Syst. 2023, 45, 9363–9385. [Google Scholar] [CrossRef]
- Zhu, S.; Liu, Z.; Ur Rahman, A. Novel Distance Measures of Picture Fuzzy Sets and Their Applications. Arab. J. Sci. Eng. 2024, 1–14. [Google Scholar] [CrossRef]
- Imran, M.; Azeem, M.; Jamil, M.K.; Deveci, M. Exploring innovative single-value neutrosophic fuzzy topological graph parameters. Granul. Comput. 2024, 9, 37. [Google Scholar] [CrossRef]
- Liu, Z.; Qiu, H.; Letchmunan, S. Self-adaptive attribute weighted neutrosophic c-means clustering for biomedical applications. Alex. Eng. J. 2024, 96, 42–57. [Google Scholar] [CrossRef]
- Halder, B.; Mitra, S.; Mitra, M. Classification of complete myocardial infarction using rule-based rough set method and rough set explorer system. IETE J. Res. 2022, 68, 85–95. [Google Scholar] [CrossRef]
- Al-Shami, T.M.; Alshammari, I. Rough sets models inspired by supra-topology structures. Artif. Intell. Rev. 2023, 56, 6855–6883. [Google Scholar] [CrossRef]
- Liu, Z.; Huang, H.; Letchmunan, S.; Deveci, M. Adaptive weighted multi-view evidential clustering with feature preference. Knowl.-Based Syst. 2024, 294, 111770. [Google Scholar] [CrossRef]
- Zadeh, L.A. Fuzzy sets. Inf. Control. 1965, 8, 338–353. [Google Scholar] [CrossRef]
- Atanassov, K.T. Intuitionistic fuzzy sets. Fuzzy Sets Syst. 1986, 20, 87–96. [Google Scholar] [CrossRef]
- Szmidt, E.; Kacprzyk, J. Distances between intuitionistic fuzzy sets. Fuzzy Sets Syst. 2000, 114, 505–518. [Google Scholar] [CrossRef]
- Wang, W.; Xin, X. Distance measure between intuitionistic fuzzy sets. Pattern Recognit. Lett. 2005, 26, 2063–2069. [Google Scholar] [CrossRef]
- Park, J.H.; Lim, K.M.; Kwun, Y.C. Distance measure between intuitionistic fuzzy sets and its application to pattern recognition. J. Korean Inst. Intell. Syst. 2009, 19, 556–561. [Google Scholar] [CrossRef]
- Yang, Y.; Chiclana, F. Intuitionistic fuzzy sets: Spherical representation and distances. Int. J. Intell. Syst. 2009, 24, 399–420. [Google Scholar] [CrossRef]
- Son, L.H.; Phong, P.H. On the performance evaluation of intuitionistic vector similarity measures for medical diagnosis 1. J. Intell. Fuzzy Syst. 2016, 31, 1597–1608. [Google Scholar] [CrossRef]
- Ye, J. Similarity measures of intuitionistic fuzzy sets based on cosine function for the decision making of mechanical design schemes. J. Intell. Fuzzy Syst. 2016, 30, 151–158. [Google Scholar] [CrossRef]
- Xu, C. Improvement of the distance between intuitionistic fuzzy sets and its applications. J. Intell. Fuzzy Syst. 2017, 33, 1563–1575. [Google Scholar] [CrossRef]
- Xiao, F. A distance measure for intuitionistic fuzzy sets and its application to pattern classification problems. IEEE Trans. Syst. Man Cybern. Syst. 2021, 51, 3980–3992. [Google Scholar] [CrossRef]
- Li, X.; Liu, Z.; Han, X.; Liu, N.; Yuan, W. An intuitionistic fuzzy version of hellinger distance measure and its application to decision-making process. Symmetry 2023, 15, 500. [Google Scholar] [CrossRef]
- Yager, R.R. Pythagorean membership grades in multicriteria decision making. IEEE Trans. Fuzzy Syst. 2013, 22, 958–965. [Google Scholar] [CrossRef]
- Akram, M.; Ramzan, N.; Deveci, M. Linguistic Pythagorean fuzzy CRITIC-EDAS method for multiple-attribute group decision analysis. Eng. Appl. Artif. Intell. 2023, 119, 105777. [Google Scholar] [CrossRef]
- Akram, M.; Zahid, S.; Deveci, M. Enhanced CRITIC-REGIME method for decision making based on Pythagorean fuzzy rough number. Expert Syst. Appl. 2024, 238, 122014. [Google Scholar] [CrossRef]
- Zhao, C.; Tang, X.; Yuan, L. MAGDM method with Pythagorean 2-tuple linguistic information and applications in the HSE performance assessment of laboratory. Math. Probl. Eng. 2018, 2018, 3732808. [Google Scholar] [CrossRef]
- Liang, D.; Xu, Z. The new extension of TOPSIS method for multiple criteria decision making with hesitant Pythagorean fuzzy sets. Appl. Soft Comput. 2017, 60, 167–179. [Google Scholar] [CrossRef]
- Wei, G.; Lu, M. Pythagorean fuzzy power aggregation operators in multiple attribute decision making. Int. J. Intell. Syst. 2018, 33, 169–186. [Google Scholar] [CrossRef]
- Wei, G. Pythagorean fuzzy interaction aggregation operators and their application to multiple attribute decision making. J. Intell. Fuzzy Syst. 2017, 33, 2119–2132. [Google Scholar] [CrossRef]
- Zeng, W.; Li, D.; Yin, Q. Distance and similarity measures of Pythagorean fuzzy sets and their applications to multiple criteria group decision making. Int. J. Intell. Syst. 2018, 33, 2236–2254. [Google Scholar] [CrossRef]
- Farhadinia, B. Similarity-based multi-criteria decision making technique of pythagorean fuzzy sets. Artif. Intell. Rev. 2022, 55, 2103–2148. [Google Scholar] [CrossRef]
- Xiao, F.; Ding, W. Divergence measure of Pythagorean fuzzy sets and its application in medical diagnosis. Appl. Soft Comput. 2019, 79, 254–267. [Google Scholar] [CrossRef]
- Liu, Z. Hellinger distance measures on Pythagorean fuzzy environment via their applications. Int. J. Knowl.-Based Intell. Eng. Syst. 2024, 1–19. [Google Scholar] [CrossRef]
- Senapati, T.; Yager, R.R. Fermatean fuzzy sets. J. Ambient Intell. Humaniz. Comput. 2020, 11, 663–674. [Google Scholar] [CrossRef]
- Zhou, L.; Wan, S.; Dong, J. A Fermatean fuzzy ELECTRE method for multi-criteria group decision-making. Informatica 2022, 33, 181–224. [Google Scholar] [CrossRef]
- Deng, Z.; Wang, J. New distance measure for Fermatean fuzzy sets and its application. Int. J. Intell. Syst. 2022, 37, 1903–1930. [Google Scholar] [CrossRef]
- Liu, Z. A Distance Measure of Fermatean Fuzzy Sets Based on Triangular Divergence and its Application in Medical Diagnosis. J. Oper. Intell. 2024, 2, 167–178. [Google Scholar] [CrossRef]
- Liu, Z. Fermatean fuzzy similarity measures based on Tanimoto and Sørensen coefficients with applications to pattern classification, medical diagnosis and clustering analysis. Eng. Appl. Artif. Intell. 2024, 132, 107878. [Google Scholar] [CrossRef]
- Yager, R.R. Generalized orthopair fuzzy sets. IEEE Trans. Fuzzy Syst. 2016, 25, 1222–1230. [Google Scholar] [CrossRef]
- Wang, P.; Wang, J.; Wei, G.; Wei, C. Similarity measures of q-rung orthopair fuzzy sets based on cosine function and their applications. Mathematics 2019, 7, 340. [Google Scholar] [CrossRef]
- Liu, D.; Chen, X.; Peng, D. Some cosine similarity measures and distance measures between q-rung orthopair fuzzy sets. Int. J. Intell. Syst. 2019, 34, 1572–1587. [Google Scholar] [CrossRef]
- Singh, S.; Ganie, A.H. Some novel q-rung orthopair fuzzy correlation coefficients based on the statistical viewpoint with their applications. J. Ambient. Intell. Humaniz. Comput. 2022, 13, 2227–2252. [Google Scholar] [CrossRef]
- Ali, J. Norm-based distance measure of q-rung orthopair fuzzy sets and its application in decision-making. Comput. Appl. Math. 2023, 42, 184. [Google Scholar] [CrossRef]
- Rani, V.; Kumar, S. An innovative distance measure for quantifying the dissimilarity between Q-Rung orthopair fuzzy sets. Decis. Anal. J. 2024, 11, 100440. [Google Scholar] [CrossRef]
- Du, W.S. Minkowski-type distance measures for generalized orthopair fuzzy sets. Int. J. Intell. Syst. 2018, 33, 802–817. [Google Scholar] [CrossRef]
- Türkarslan, E.; Ünver, M.; Olgun, M.; Yardımcı, Ş. q-Rung Orthopair Fuzzy Points and Applications to q-Rung Orthopair Fuzzy Topological Spaces and Pattern Recognition. In Advances in Topology and Their Interdisciplinary Applications; Springer: Singapore, 2023; pp. 245–259. [Google Scholar]
- Peng, X.; Liu, L. Information measures for q-rung orthopair fuzzy sets. Int. J. Intell. Syst. 2019, 34, 1795–1834. [Google Scholar] [CrossRef]
- Gallager, R.G. Information Theory and Reliable Communication; Wiley: New York, NY, USA, 1968; Volume 588. [Google Scholar]
- Toussaint, G. Sharper lower bounds for discrimination information in terms of variation (Corresp.). IEEE Trans. Inf. Theory 1975, 21, 99–100. [Google Scholar] [CrossRef]
Disclaimer/Publisher’s Note: The statements, opinions and data contained in all publications are solely those of the individual author(s) and contributor(s) and not of MDPI and/or the editor(s). MDPI and/or the editor(s) disclaim responsibility for any injury to people or property resulting from any ideas, methods, instructions or products referred to in the content. |
© 2024 by the authors. Licensee MDPI, Basel, Switzerland. This article is an open access article distributed under the terms and conditions of the Creative Commons Attribution (CC BY) license (https://creativecommons.org/licenses/by/4.0/).