Abstract
The concentricity error of automotive brake piston components critically affects the stability and reliability of the brake system. Traditional contact-based concentricity measurement methods are inefficient. In order to address the issue of low detection efficiency, this paper proposes a non-contact concentricity measurement method based on the combination of machine vision and image processing technology. In this approach, an industrial camera is employed to capture images of the measured workpiece’s end face from the top of the spring. The edge contours are extracted through the implementation of image preprocessing algorithms, which are then followed by the calculation of the outer circle center and the fitting of the inner circle center. Finally, the concentricity error is calculated based on the coordinates of the inner and outer circle centers. The experimental results demonstrate that, in comparison to a coordinate measuring machine (CMM), this method exhibits a maximum error of only 0.0393 mm and an average measurement time of 3.9 s. This technology markedly enhances the efficiency of measurement and fulfills the industry’s requirement for automated inspection. The experiments confirmed the feasibility and effectiveness of this method in practical engineering applications, providing reliable technical support for the online inspection of automotive brake piston components. Moreover, this methodology can be extended to assess concentricity in other complex stepped shaft parts.
1. Introduction
The brake system is crucial for keeping the vehicle stationary, ensuring driving safety, and enhancing stability during the driving process. The automotive brake piston components are critical elements of the automotive braking system. Errors in manufactured parts are inevitable during the processing and manufacturing stages due to inherent precision limitations of the processing system and external environmental factors, such as machine vibrations. Concentricity can be regarded as a specific form of coaxiality, representing the degree of deviation between the two circle centers. The reduction of concentricity deviation in shaft parts has been demonstrated to be an effective method for improving both the precision of the assembly process and the quality of the resulting parts [1].
In the field of engineering, the accurate and rapid measurement of concentricity error has historically represented a significant challenge. Traditional contact-based methods for measuring concentricity typically involve the use of dial indicators, concentricity gauges, and coordinate measuring machines (CMMs). Although coordinate measuring machines (CMMs) provide high precision, they are inefficient and do not meet the demands of automated inspection in industrial environments [2,3,4].
Currently, non-contact measurement methods for concentricity and coaxiality primarily include laser rangefinders, laser displacement sensors, and line-structured light. Zhang et al. [1] employed a laser rangefinder to obtain distance data between the forged piece, the upsetting rod, and the rangefinder itself. Subsequently, the weighted least squares method was utilized to fit the center of the workpiece, facilitating the assessment of concentricity error in large forgings. Chai et al. [5] utilized a laser displacement sensor to obtain cross-sectional data of the measured part. They employed the least squares method to fit the center of the cross-section, thereby enabling the measurement of concentricity error in composite gears. Dou et al. [6] employed a laser scanner to obtain a three-dimensional point cloud model of the measured part. They then utilized an optimized Pratt circle fitting method to determine the center position of the cross-sections. Subsequently, the least squares method was employed to fit the center points of all cross-sections, thereby establishing the reference axis, and calculating the coaxial error of the crankshaft. Li et al. [7] proposed a coaxiality error measurement method for stepped shafts based on line-structured light. This method uses the least squares method to fit the center points of the cross-sections into a reference axis equation, thereby determining the coaxiality error of each shaft segment relative to the reference axis.
A review of the current research status of concentricity and coaxiality reveals that numerous non-contact measurement methods proposed by researchers have demonstrated high precision. Nevertheless, these methodologies are not suitable for measuring concentricity error in automotive brake piston components. The schematic diagram of the structure of automotive brake piston components is shown in Figure 1. Due to the unique structure of the spring part, the laser beam or light plane emitted by the laser sometimes hits the spring body, and sometimes the inside of the spring pitch during rotation. This uncertainty makes obtaining accurate data difficult. While 3D point cloud detection technology can handle complex geometries, it generates a large amount of data, involves complex processing, and has high operational requirements. In conclusion, there is currently no rapid and reliable method for measuring the concentricity error of these components.
Figure 1.
Schematic diagram of the structure of automotive brake piston components.
In recent years, with the rapid advancement of computer technology, machine vision inspection technology has garnered increasing attention within the field of intelligent manufacturing. The advantages of machine vision inspection technology include high automation, high precision, efficiency, and stability [8,9,10,11]. It has been employed by numerous researchers in a variety of engineering fields, including dimensional measurement and defect detection [12,13,14,15,16,17,18]. Furthermore, in the context of intelligent manufacturing, the ability to detect and provide feedback in real time is crucial for seamless production and quality control. Machine vision is a core technology that enables this process.
Research has demonstrated that the implementation of machine vision technology in the production of shaft components can enhance product consistency and accuracy, thereby promoting the achievement of zero-defect manufacturing [19]. Tan et al. [20] proposed a machine vision-based method for measuring shaft diameters, which achieves high precision with a measurement error of approximately 0.005 mm. Zhang et al. [21] proposed a machine vision-based method for measuring shaft straightness, roundness, and cylindricity. Li [22] proposed a geometric measurement system for shaft parts based on machine vision.
Although significant progress has been made in measuring the diameter, straightness, roundness, and cylindricity of shaft parts, relatively little research has been conducted on concentricity measurement. Therefore, this paper addresses the aforementioned gap by proposing a non-contact concentricity measurement method based on machine vision and image processing technology, integrated with production practice. This method not only enhances measurement efficiency and accuracy, but also aligns closely with the principles of intelligent manufacturing and automated production advocated by Industry 4.0 [23]. The main contributions of this research are as follows.
- (1)
- An innovative concentricity measurement algorithm is proposed, which can effectively measure the concentricity of complex stepped shaft-type parts by adjusting parameters.
- (2)
- A corresponding image acquisition system was designed to enable real-time detection of concentricity errors, providing reliable technical support for enterprises to measure concentricity errors online.
- (3)
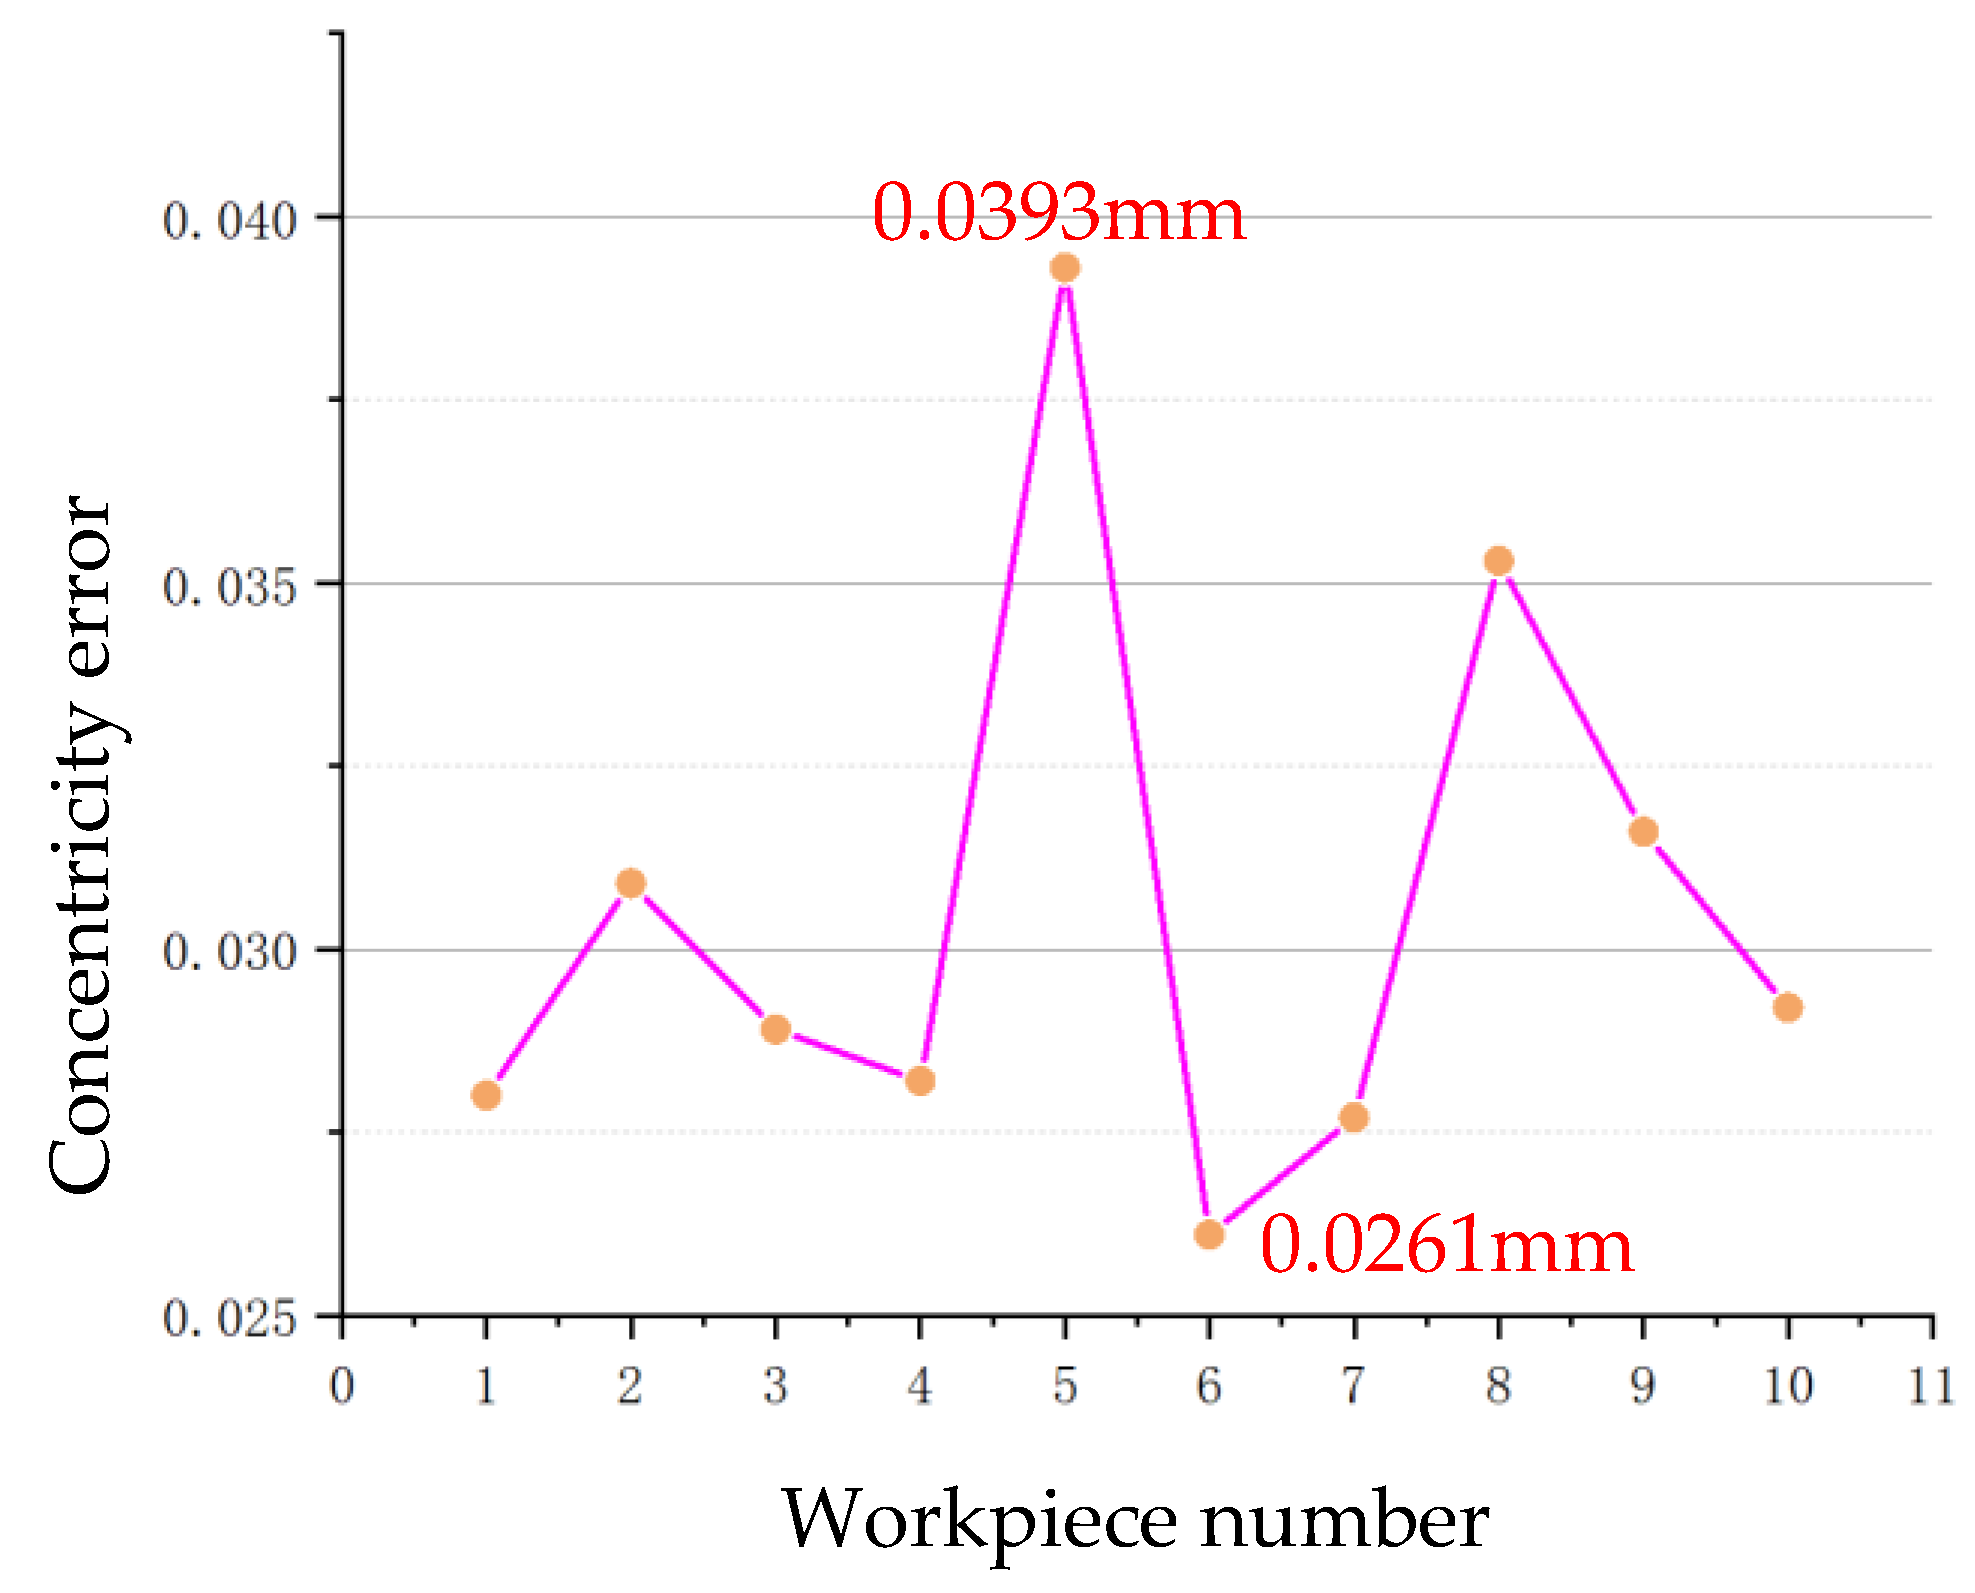
- The accuracy and effectiveness of the algorithm were verified through a comparative analysis with a three-coordinate measuring machine (CMM), showing a maximum error of only 0.0393 mm and an average measurement time of just 3.9 s. These results not only demonstrate the feasibility of the algorithm, but also offer a practical solution for the online inspection of automotive brake piston components, with broad application potential.
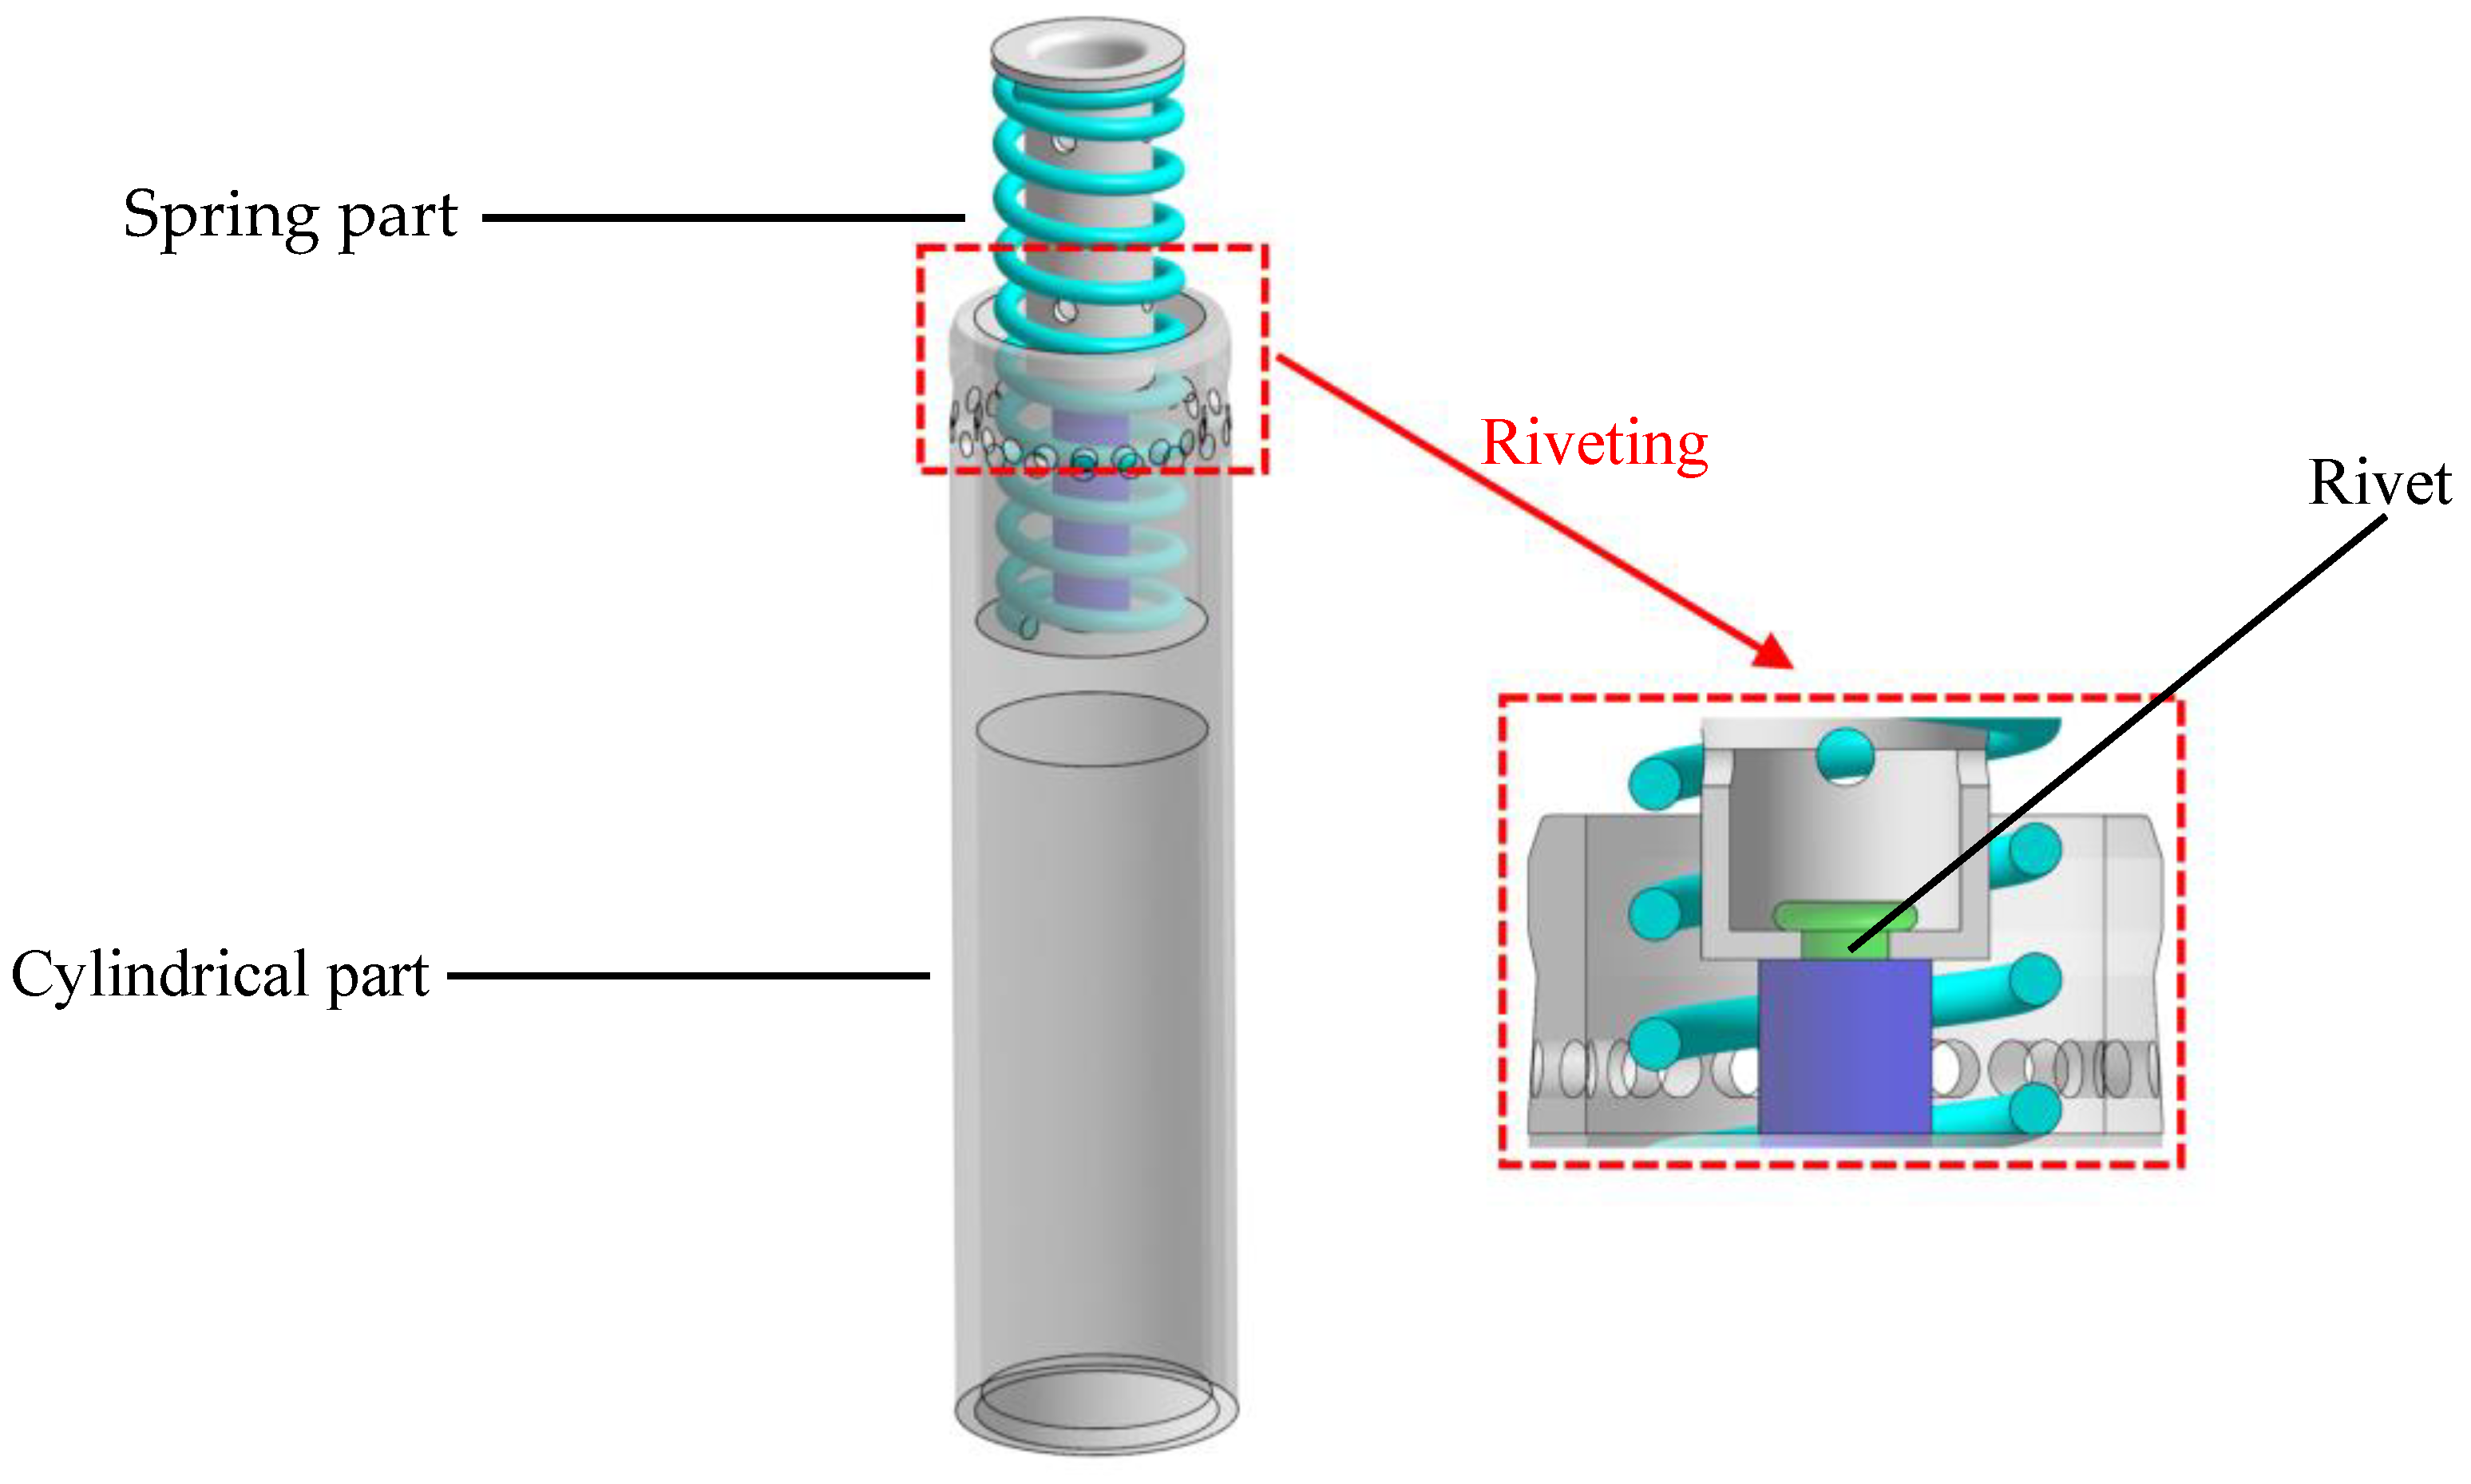
2. Concentricity Measurement Principles and Measurement Systems
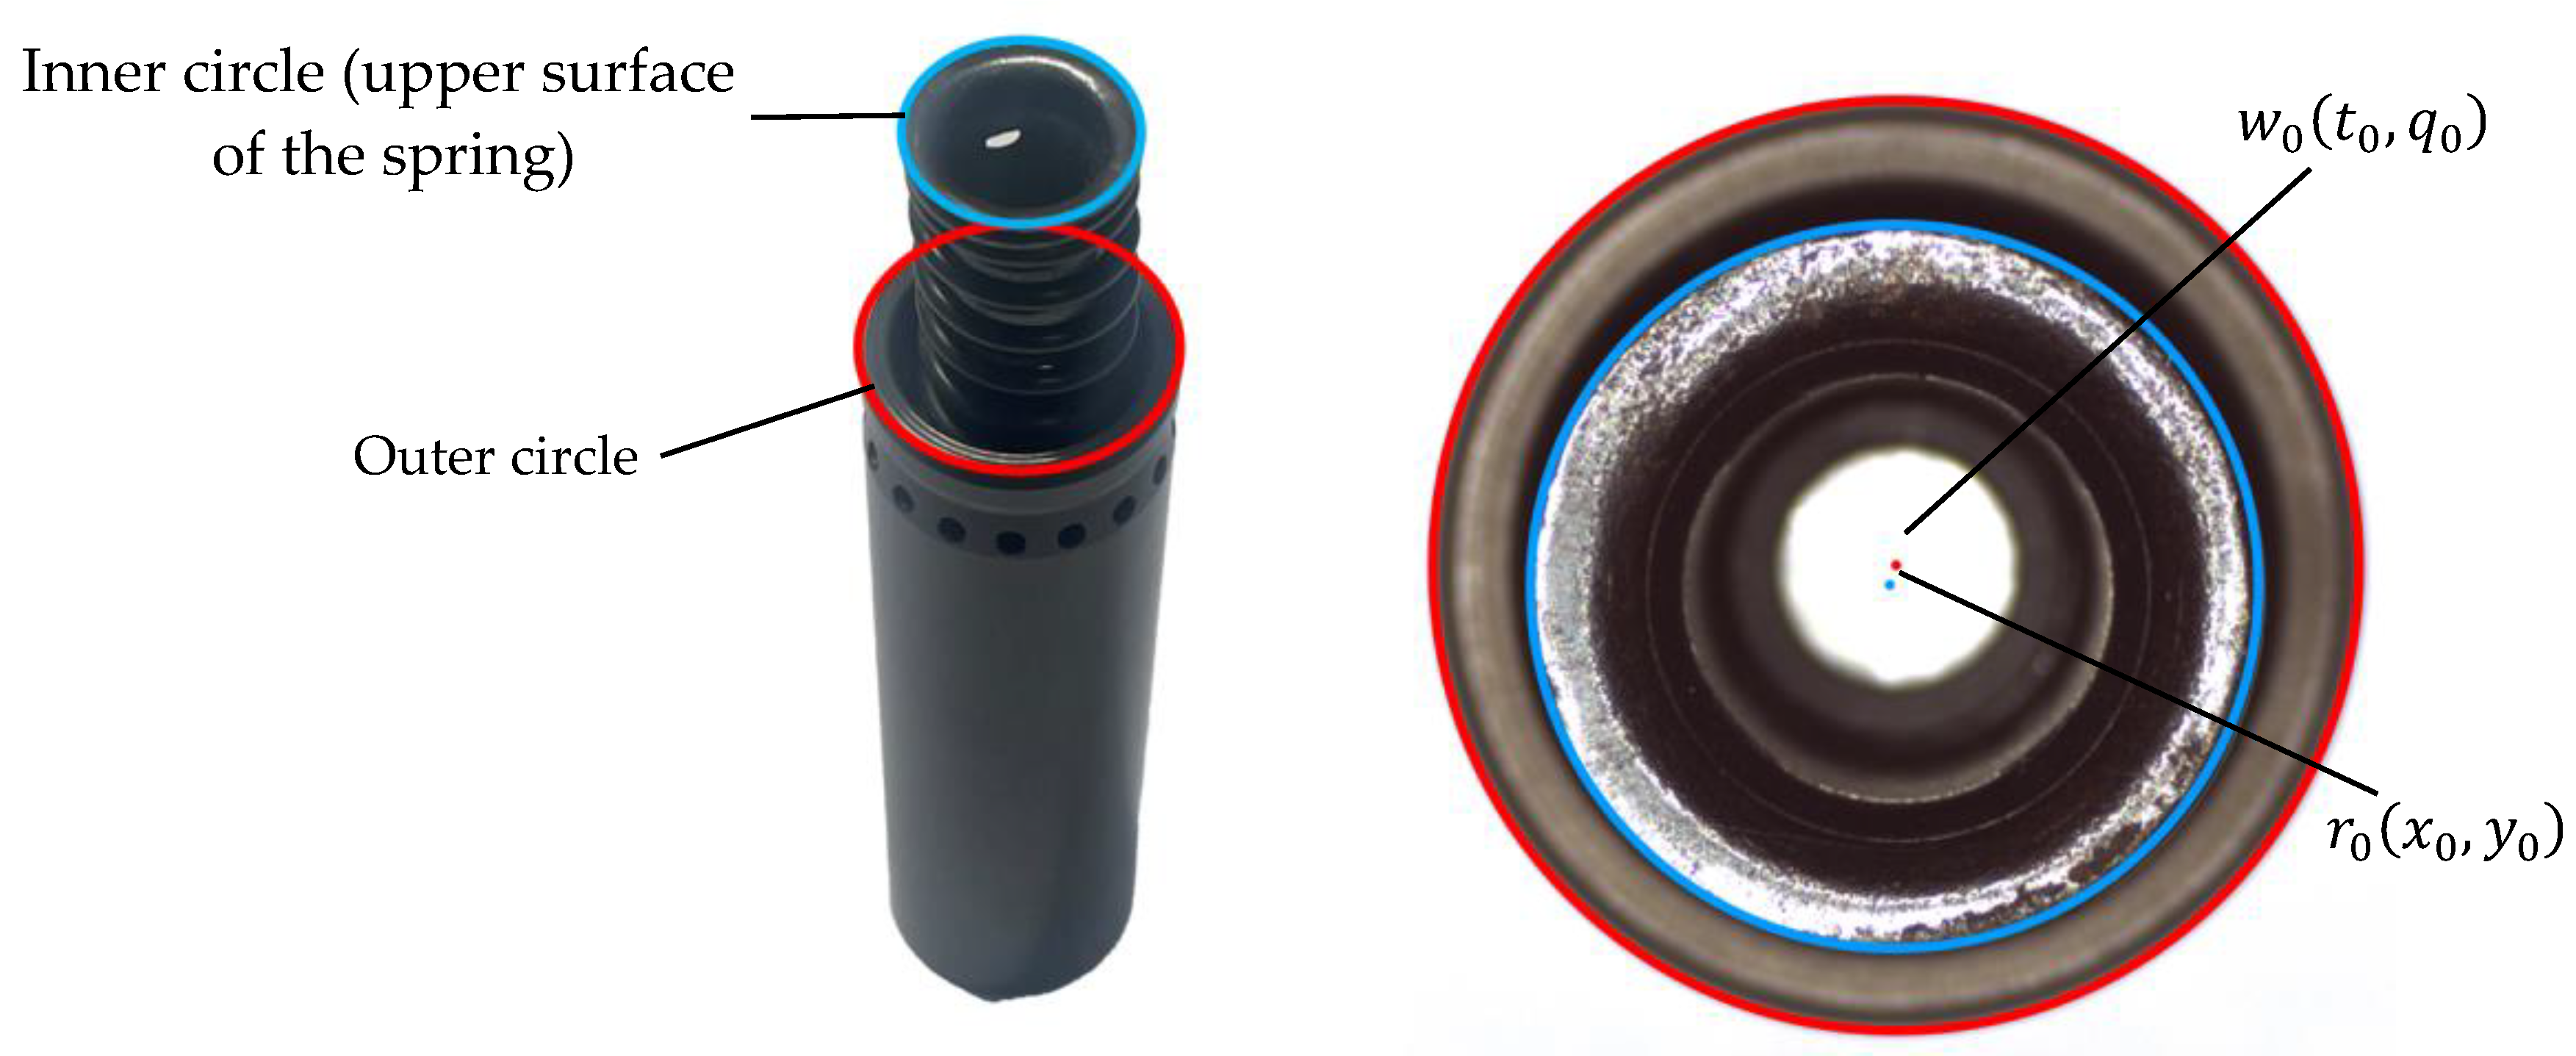
2.1. Measurement Principles
The schematic diagram of the concentricity measurement principle is shown in Figure 2. After the industrial camera captures the end face image of the measured part from the top of the spring, the edge contours are extracted through image preprocessing algorithms. Setting the cylindrical part as the outer circle contour, it can be seen from Figure 2 that the outer circle contour is a standard circle with obvious features, so the outer circle center can be directly calculated by extracting geometric feature points.
Figure 2.
Schematic diagram of concentricity measurement principle.
However, for the inner circle (the upper surface of the spring), due to assembly errors, its top view appears elliptical, making it impossible to directly calculate the inner circle center. Therefore, after extracting the geometric feature points of the inner circle edge, the least squares method needs to be used to fit the inner circle equation, thereby obtaining the inner circle center . Finally, the concentricity deviation of the measured part can be calculated using the coordinates of the outer circle center and the inner circle center. The detailed flowchart of the measurement and solution process is shown in Figure 3.
Figure 3.
Detailed flowchart of the measurement and solution process.
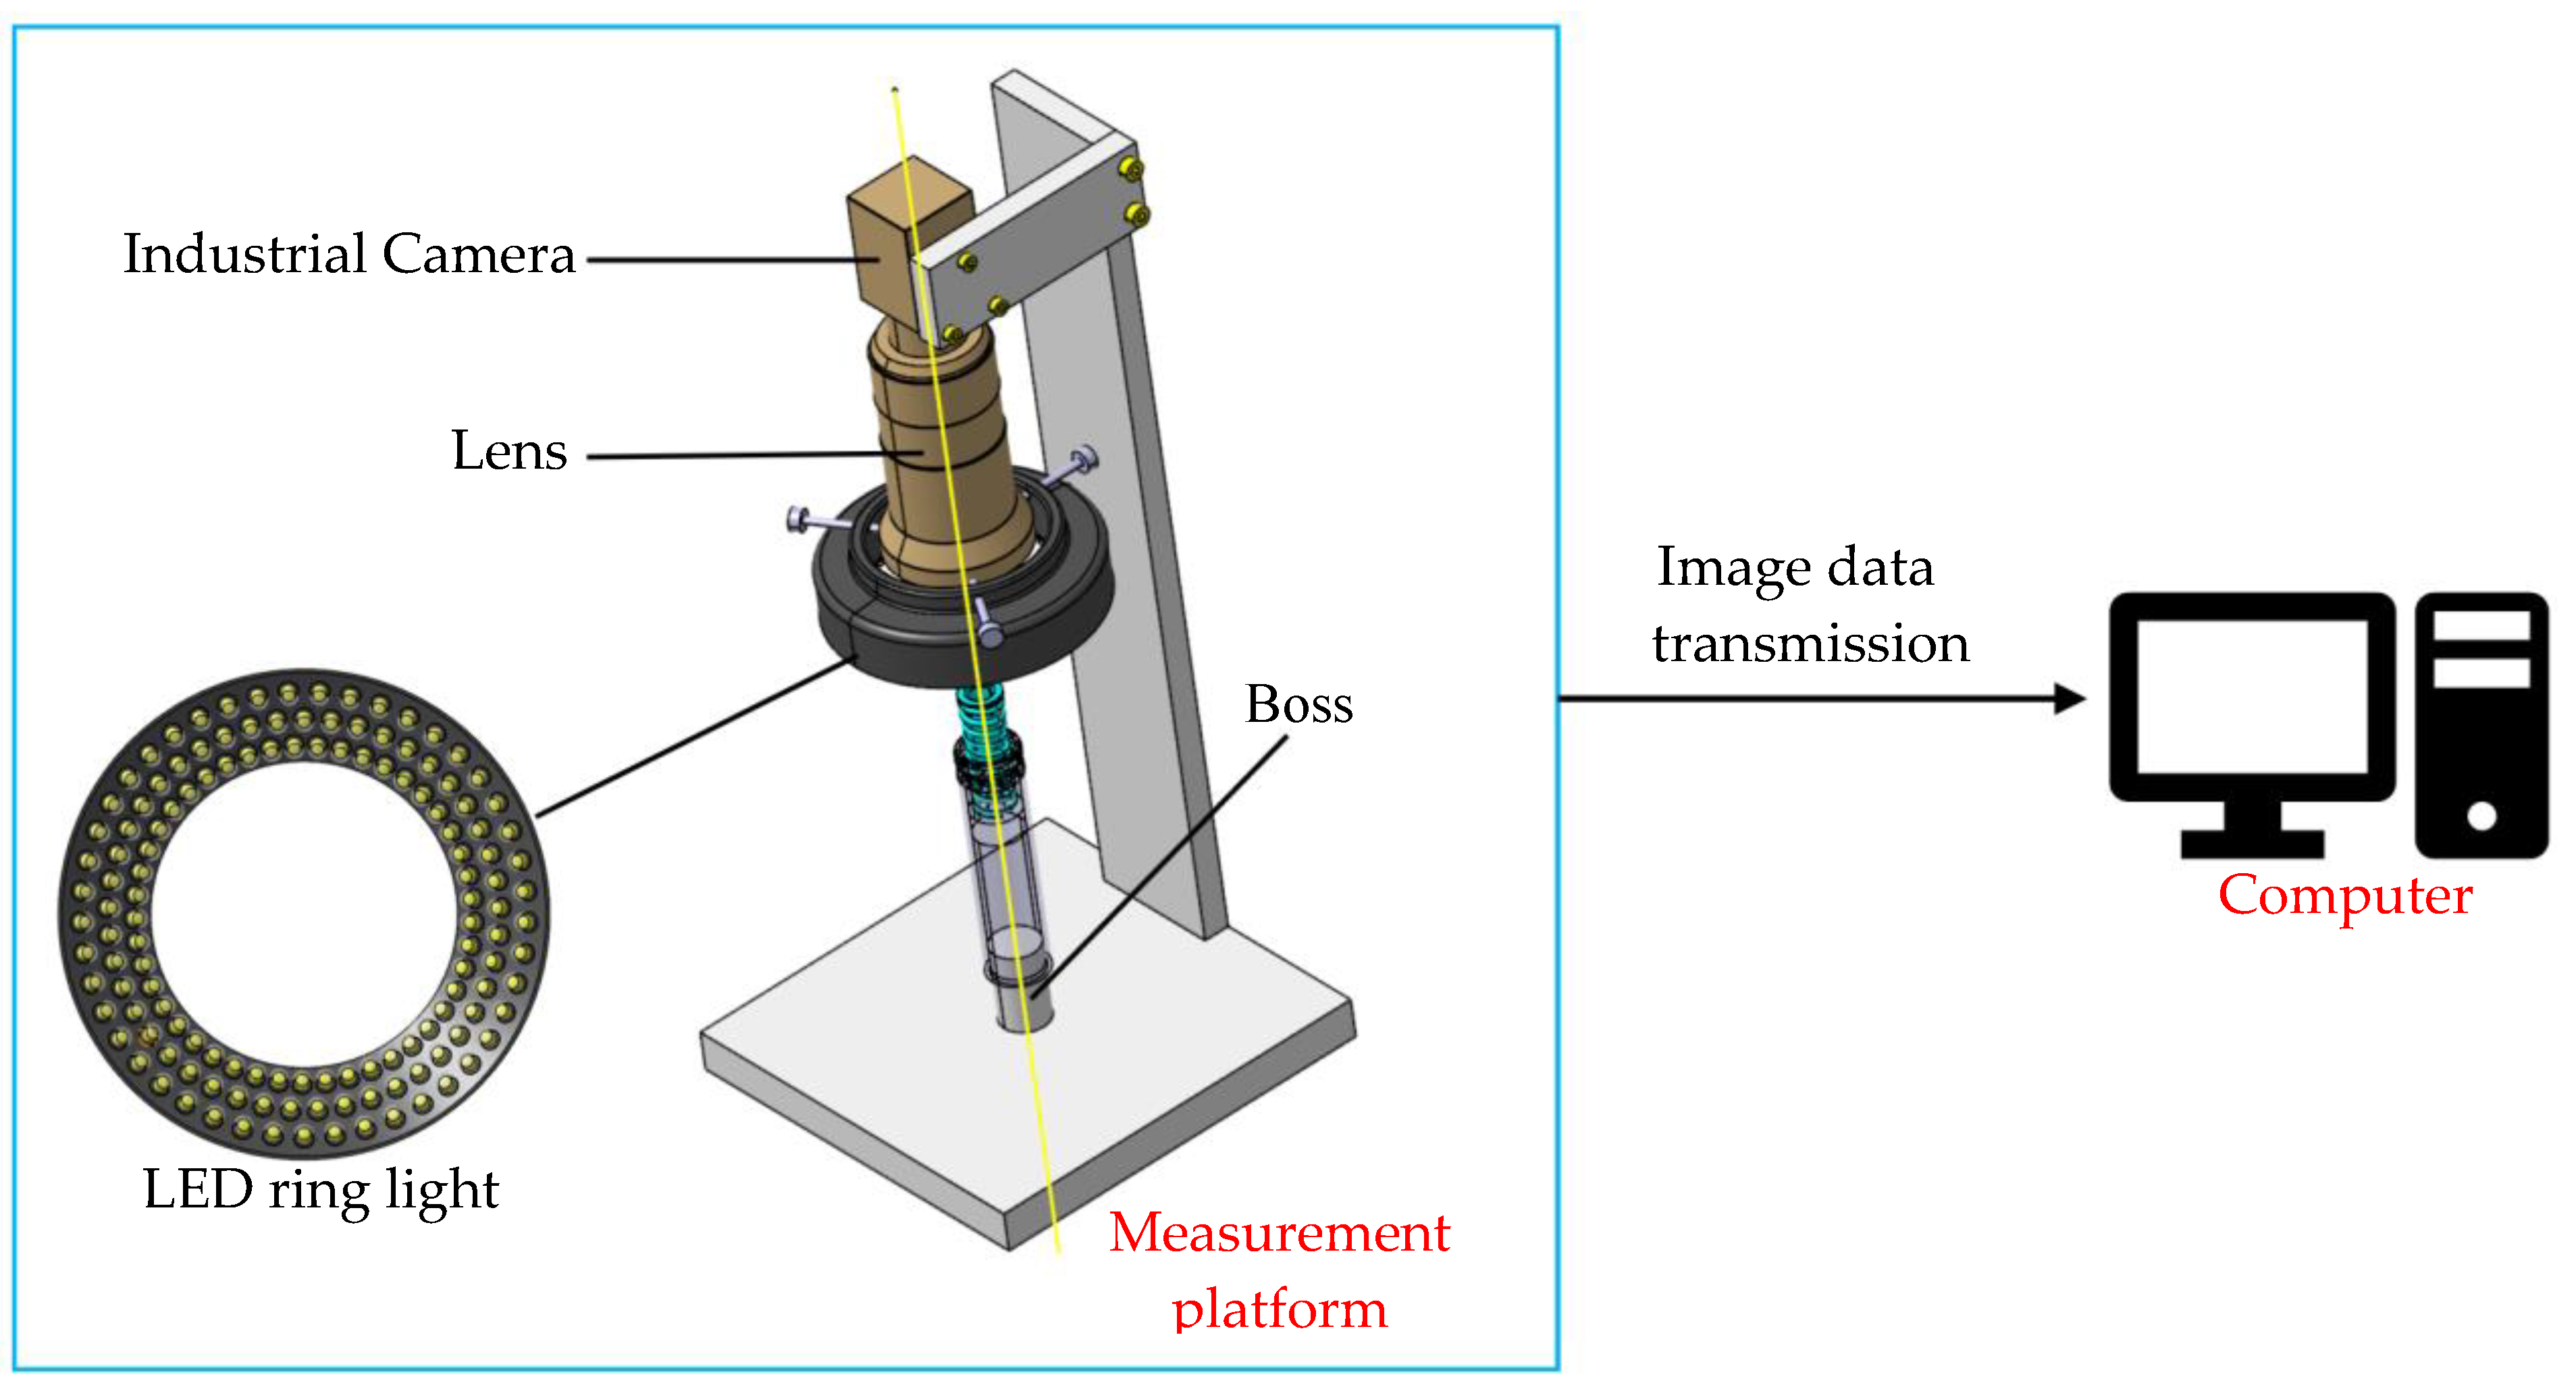
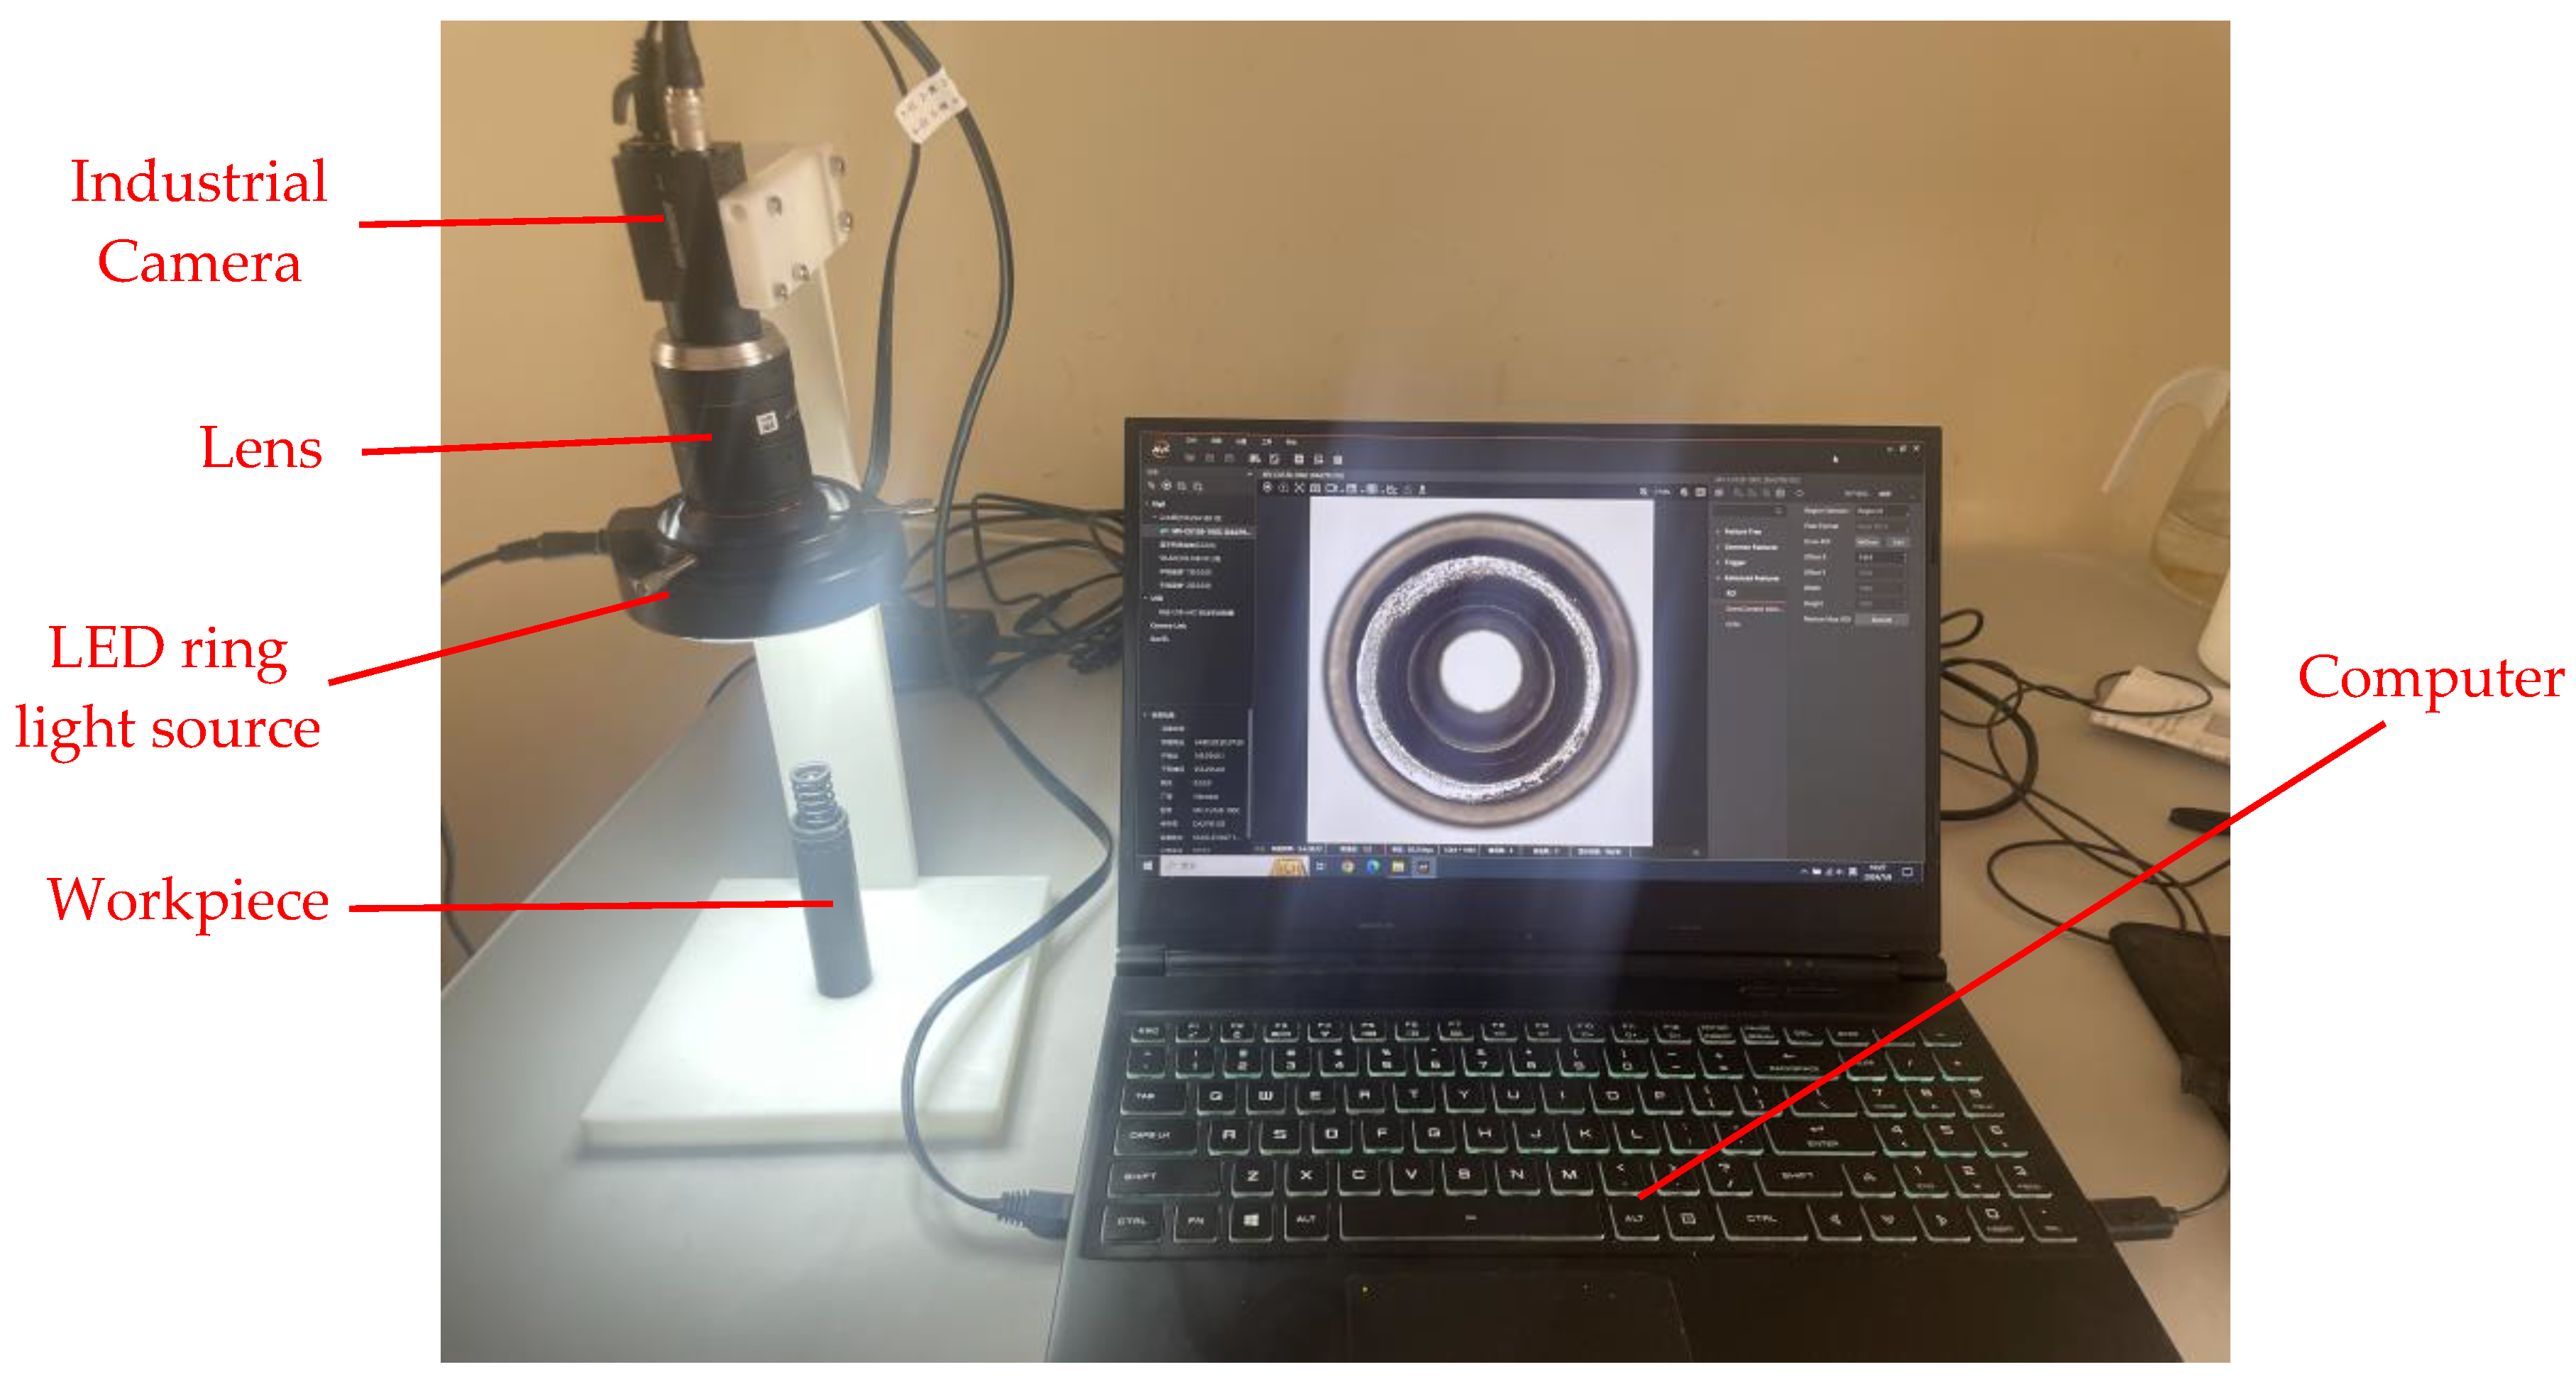
2.2. Design of Concentricity Measurement System
Based on the measurement principle, a concentricity measurement system was designed, as illustrated in Figure 4. It is often challenging to guarantee that the main optical axis of the industrial camera is perfectly collinear with the axis of the measured object when capturing top-view images. To address this issue, a boss structure was designed to reduce the impact of misalignment on measurement accuracy. The diameter of the boss is designed to match the inner diameter of the cylindrical part of the measured part. The measurement system consists of a measurement platform and a computer. The measurement platform is responsible for capturing images and subsequently transferring them to the computer for storage. The computer then processes the image data in order to obtain the concentricity error of the automotive brake piston components.
Figure 4.
Concentricity measurement system.
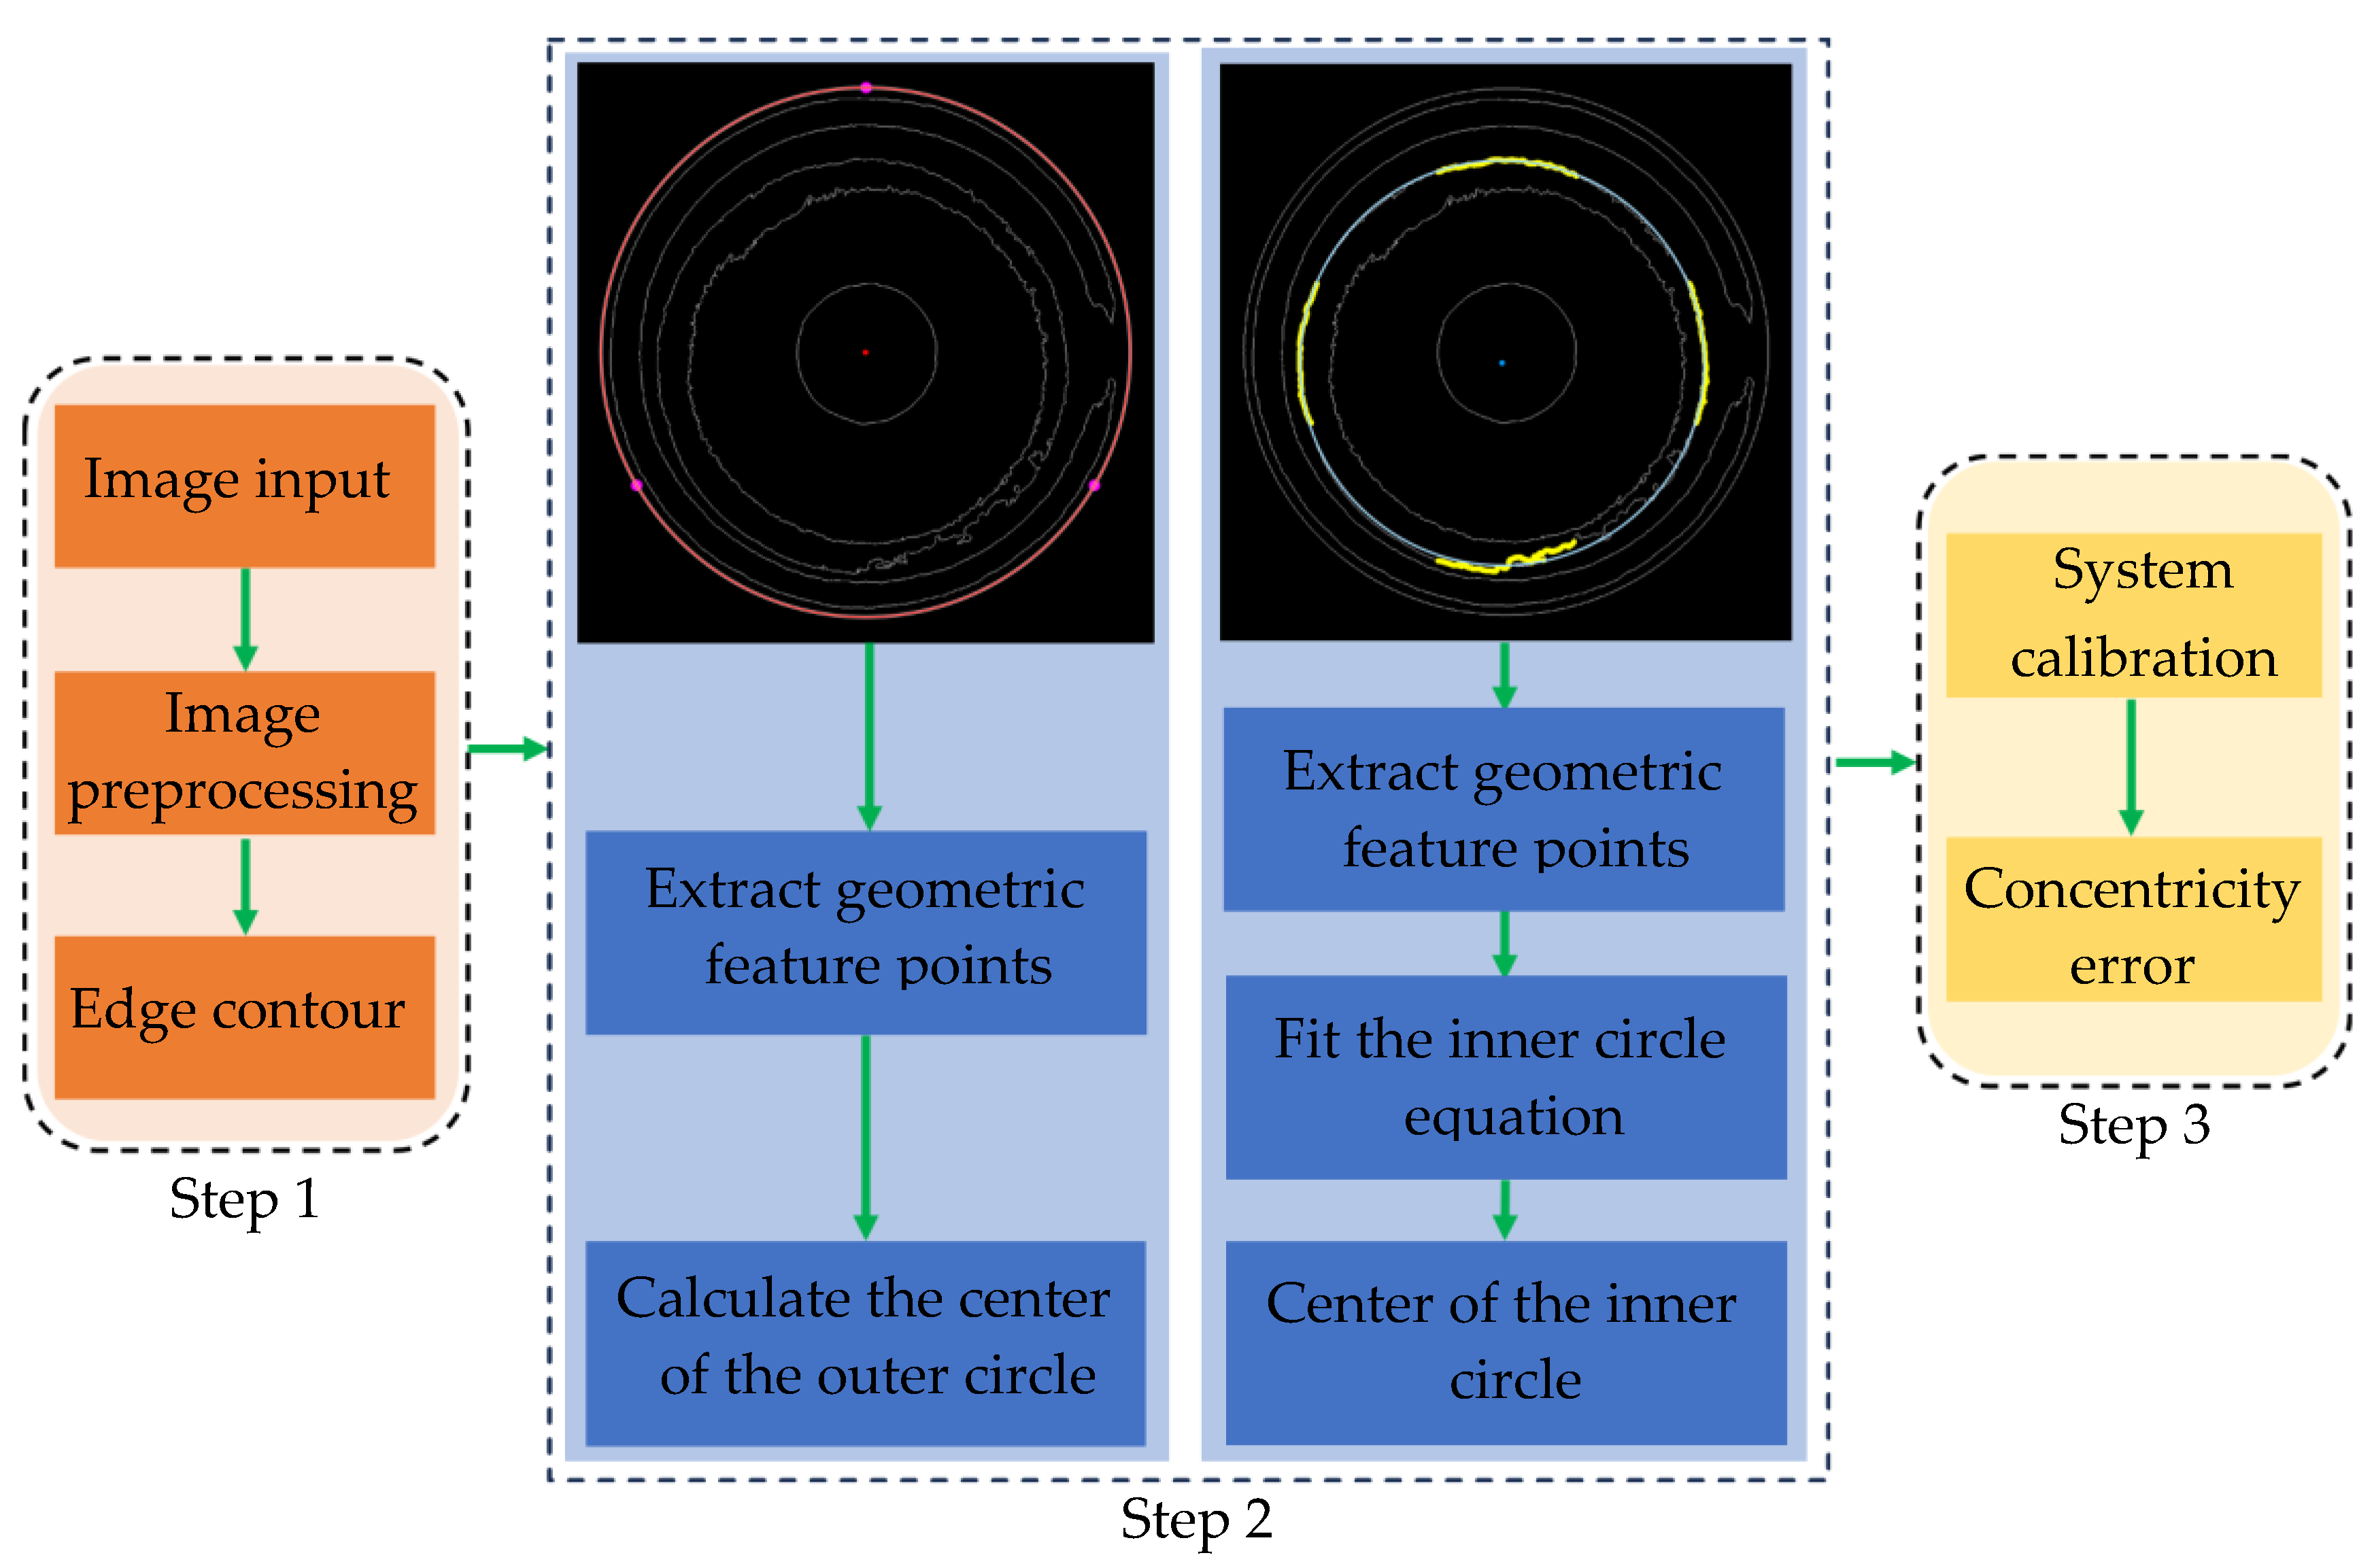
3. Concentricity Measurement Algorithm
The concentricity measurement algorithm proposed in this paper mainly includes three parts: First, a series of image preprocessing algorithms are used to extract the edge contour of the measured part, and then the coordinates of the center of the outer circle are calculated. Finally, the equation of the inner circle is fitted to obtain the coordinates of the center of the inner circle.
3.1. Image Preprocessing
The captured original image cannot be directly processed for image data analysis because it contains a lot of useless information. The image preprocessing flowchart is shown in Figure 5.
Figure 5.
Image preprocessing flowchart.
(1) The original captured image is shown in Figure 5a. To reduce computational load and enhance the efficiency of subsequent image processing, the original image must be converted into a grayscale image, as illustrated in Figure 5b.
(2) To highlight important information, the target area needs to be completely separated from the background. The grayscale image is defined as a two-dimensional function . Because the target region is darker and the background region is lighter, an appropriate threshold is selected to completely separate the target region from the background, thereby achieving binarization. The binarized image is shown in Figure 5c. The mathematical expression is as follows:
where is the binarized image.
(3) The binarized image often contains significant noise, therefore, a denoising process is necessary. Median filtering is widely adopted by researchers due to its simplicity and efficiency, as well as its effectiveness in preserving edge details in images [24,25,26,27]. In this study, a 5 × 5 median filter was selected for the purpose of filtering and denoising the binary image. The resulting denoised image is shown in Figure 5d. The mathematical expression is as follows:
where is the denoised image.
(4) In the denoised image, there are still some small connected regions that can significantly affect the accuracy of subsequent geometric feature point extraction. To address this issue, an area threshold (representing the number of pixels in the region) is first established. For all small connected regions, if their area is less than or equal to the area threshold , the pixel values of that region are set to the background pixel value 1; otherwise, they remain unchanged. The image after removing small connected regions is shown in Figure 5e.
The Laplacian of Gaussian (LoG) operator has the advantage of strong edge localization capabilities and high precision. Therefore, in this paper, the LoG operator is selected to extract the edge contour. The image after edge extraction is shown in Figure 5f.
3.2. Calculate the Outer Circle Center
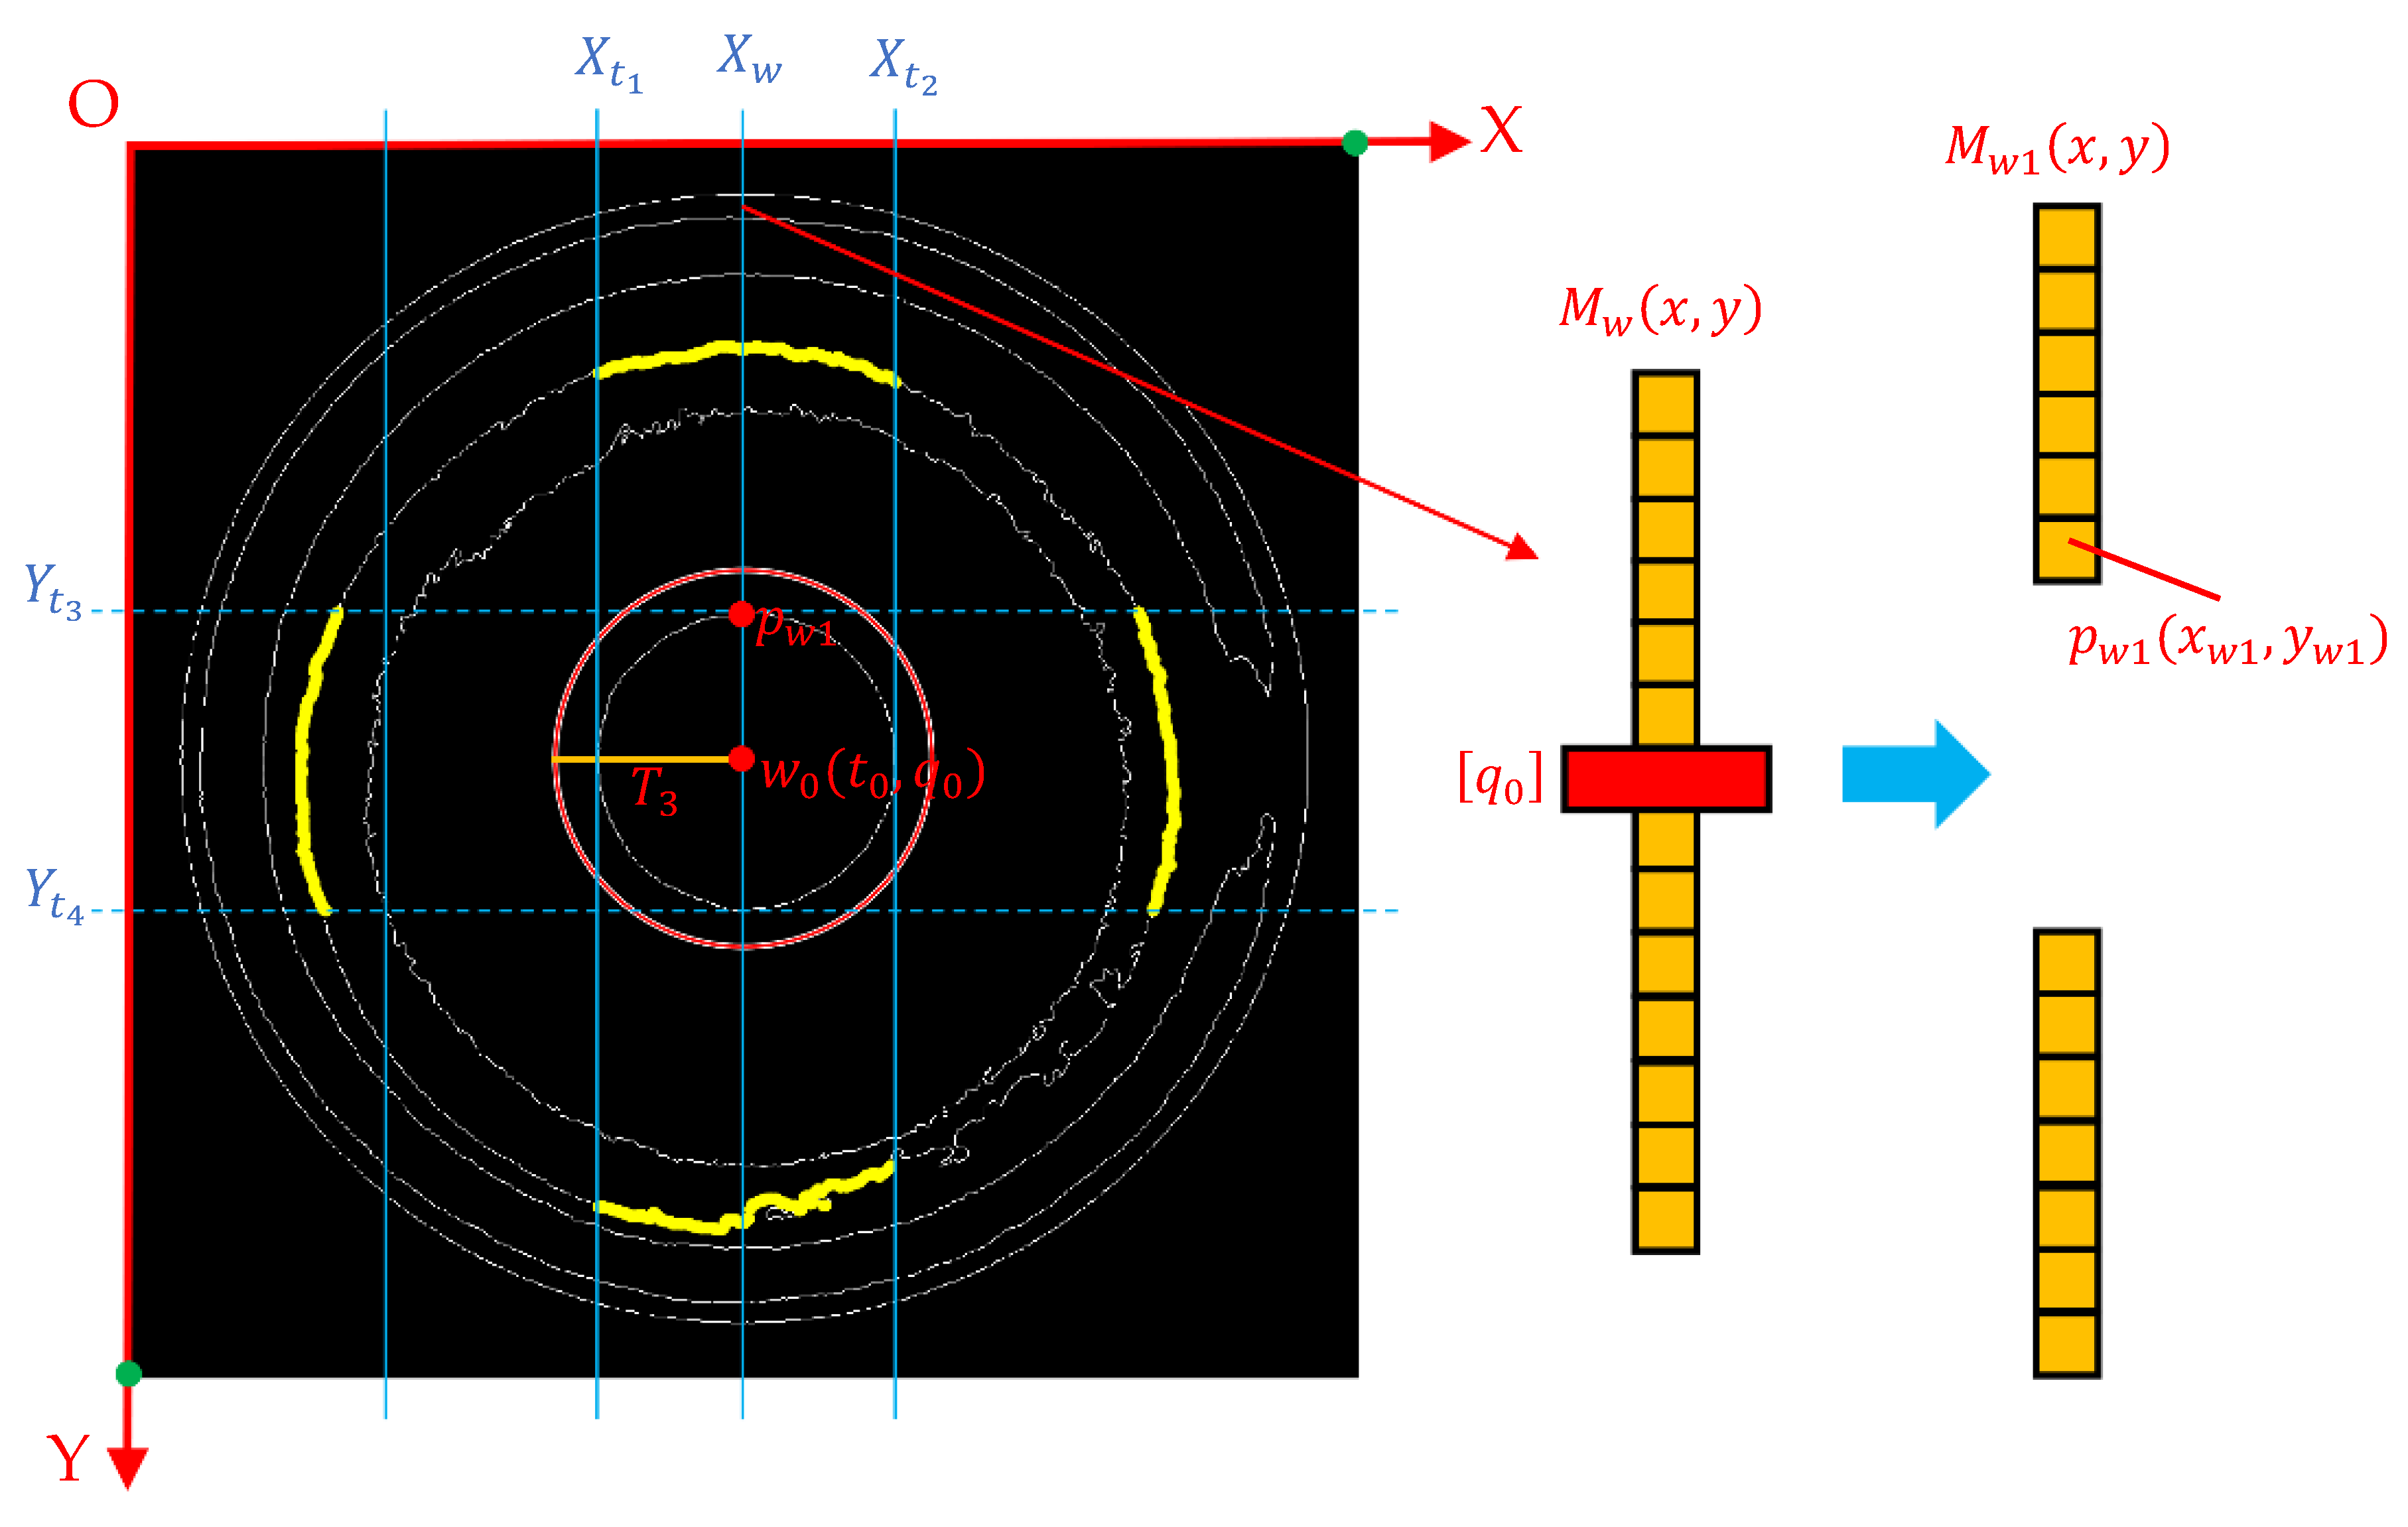
In conjunction with Figure 5f, the schematic diagram illustrating the principle for calculating the center of the outer circle is shown in Figure 6. The coordinates of and are calculated using four coordinate points with obvious positional features: , , , and . Then, the coordinates of the center of the outer circle are calculated using mathematical formulas. The detailed process of the algorithm is as follows:
Figure 6.
Schematic diagram of calculating the center of the outer circle.
- (1)
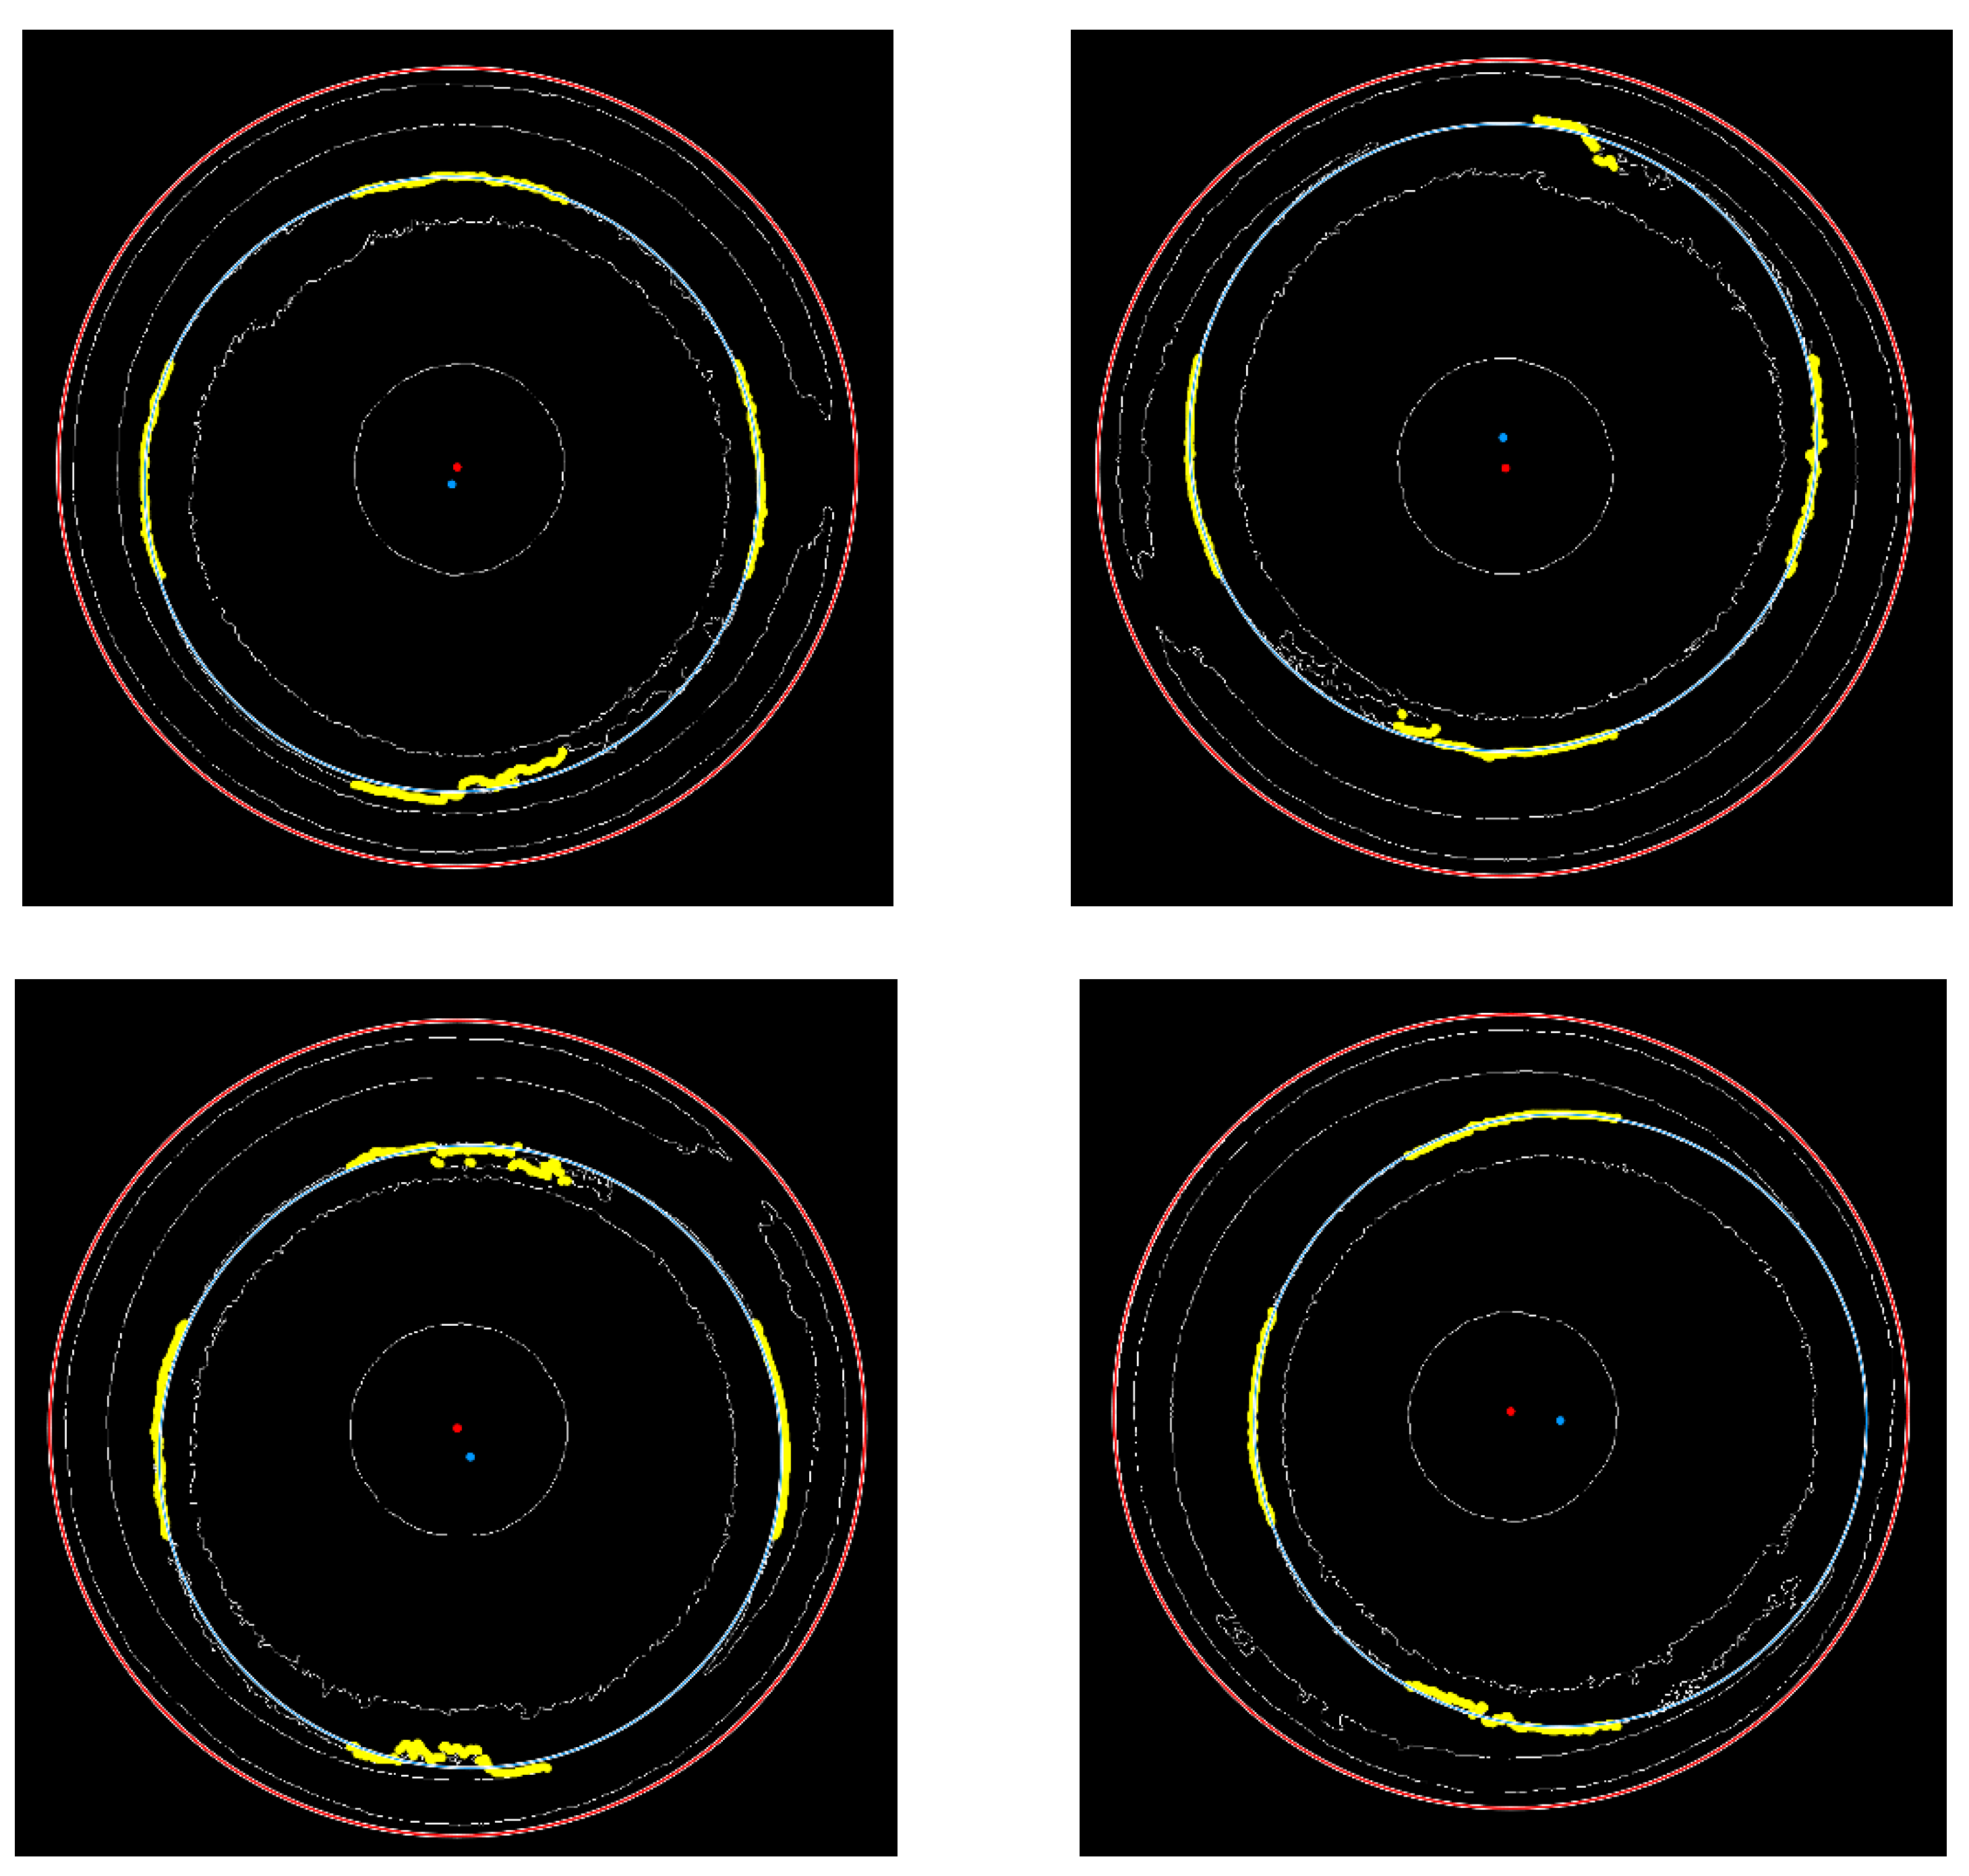
- The edge image is defined as a two-dimensional function . The pixel points that satisfy are extracted and stored in a two-dimensional array . Clearly, for and , their y-coordinates are the minimum and maximum y-coordinates in the two-dimensional array , respectively. For and , their x-coordinates are the minimum and maximum x-coordinates in the two-dimensional array , respectively. As shown in the detailed enlarged views a and b of Figure 6, the image edges are typically not single pixel points. Therefore, based on the aforementioned features, four sets of coordinate data will be extracted. In this paper, the median point of each set of coordinate data is selected as the geometric feature point of the outer circle. Ultimately, four geometric feature points of the outer circle are obtained: , , , and .
- (2)
- The y-coordinate of is defined as the average of the y-coordinates of points and . The y-coordinate of is defined as the average of the y-coordinates of points and . The y-coordinates of and are calculated using the following mathematical formulas:where and are the y-coordinates of and , respectively.
- (3)
- The line equation is defined as (because the average y-coordinate calculated through and is usually a decimal, and pixel coordinates are discrete data, the line equation must be represented in integer form). We extract the data with y-coordinates equal to from the two-dimensional array . This step will yield coordinate data points (where is the number of edge pixels with y-coordinates equal to ). Among these coordinate data points, the first data point is the coordinate of , denoted as .
- (4)
- Following the same method, the line equation is defined as . We extract the data with y-coordinates equal to from the two-dimensional array . This step will yield coordinate data points. Among these coordinates, the last data point is the coordinate of , denoted as .
- (5)
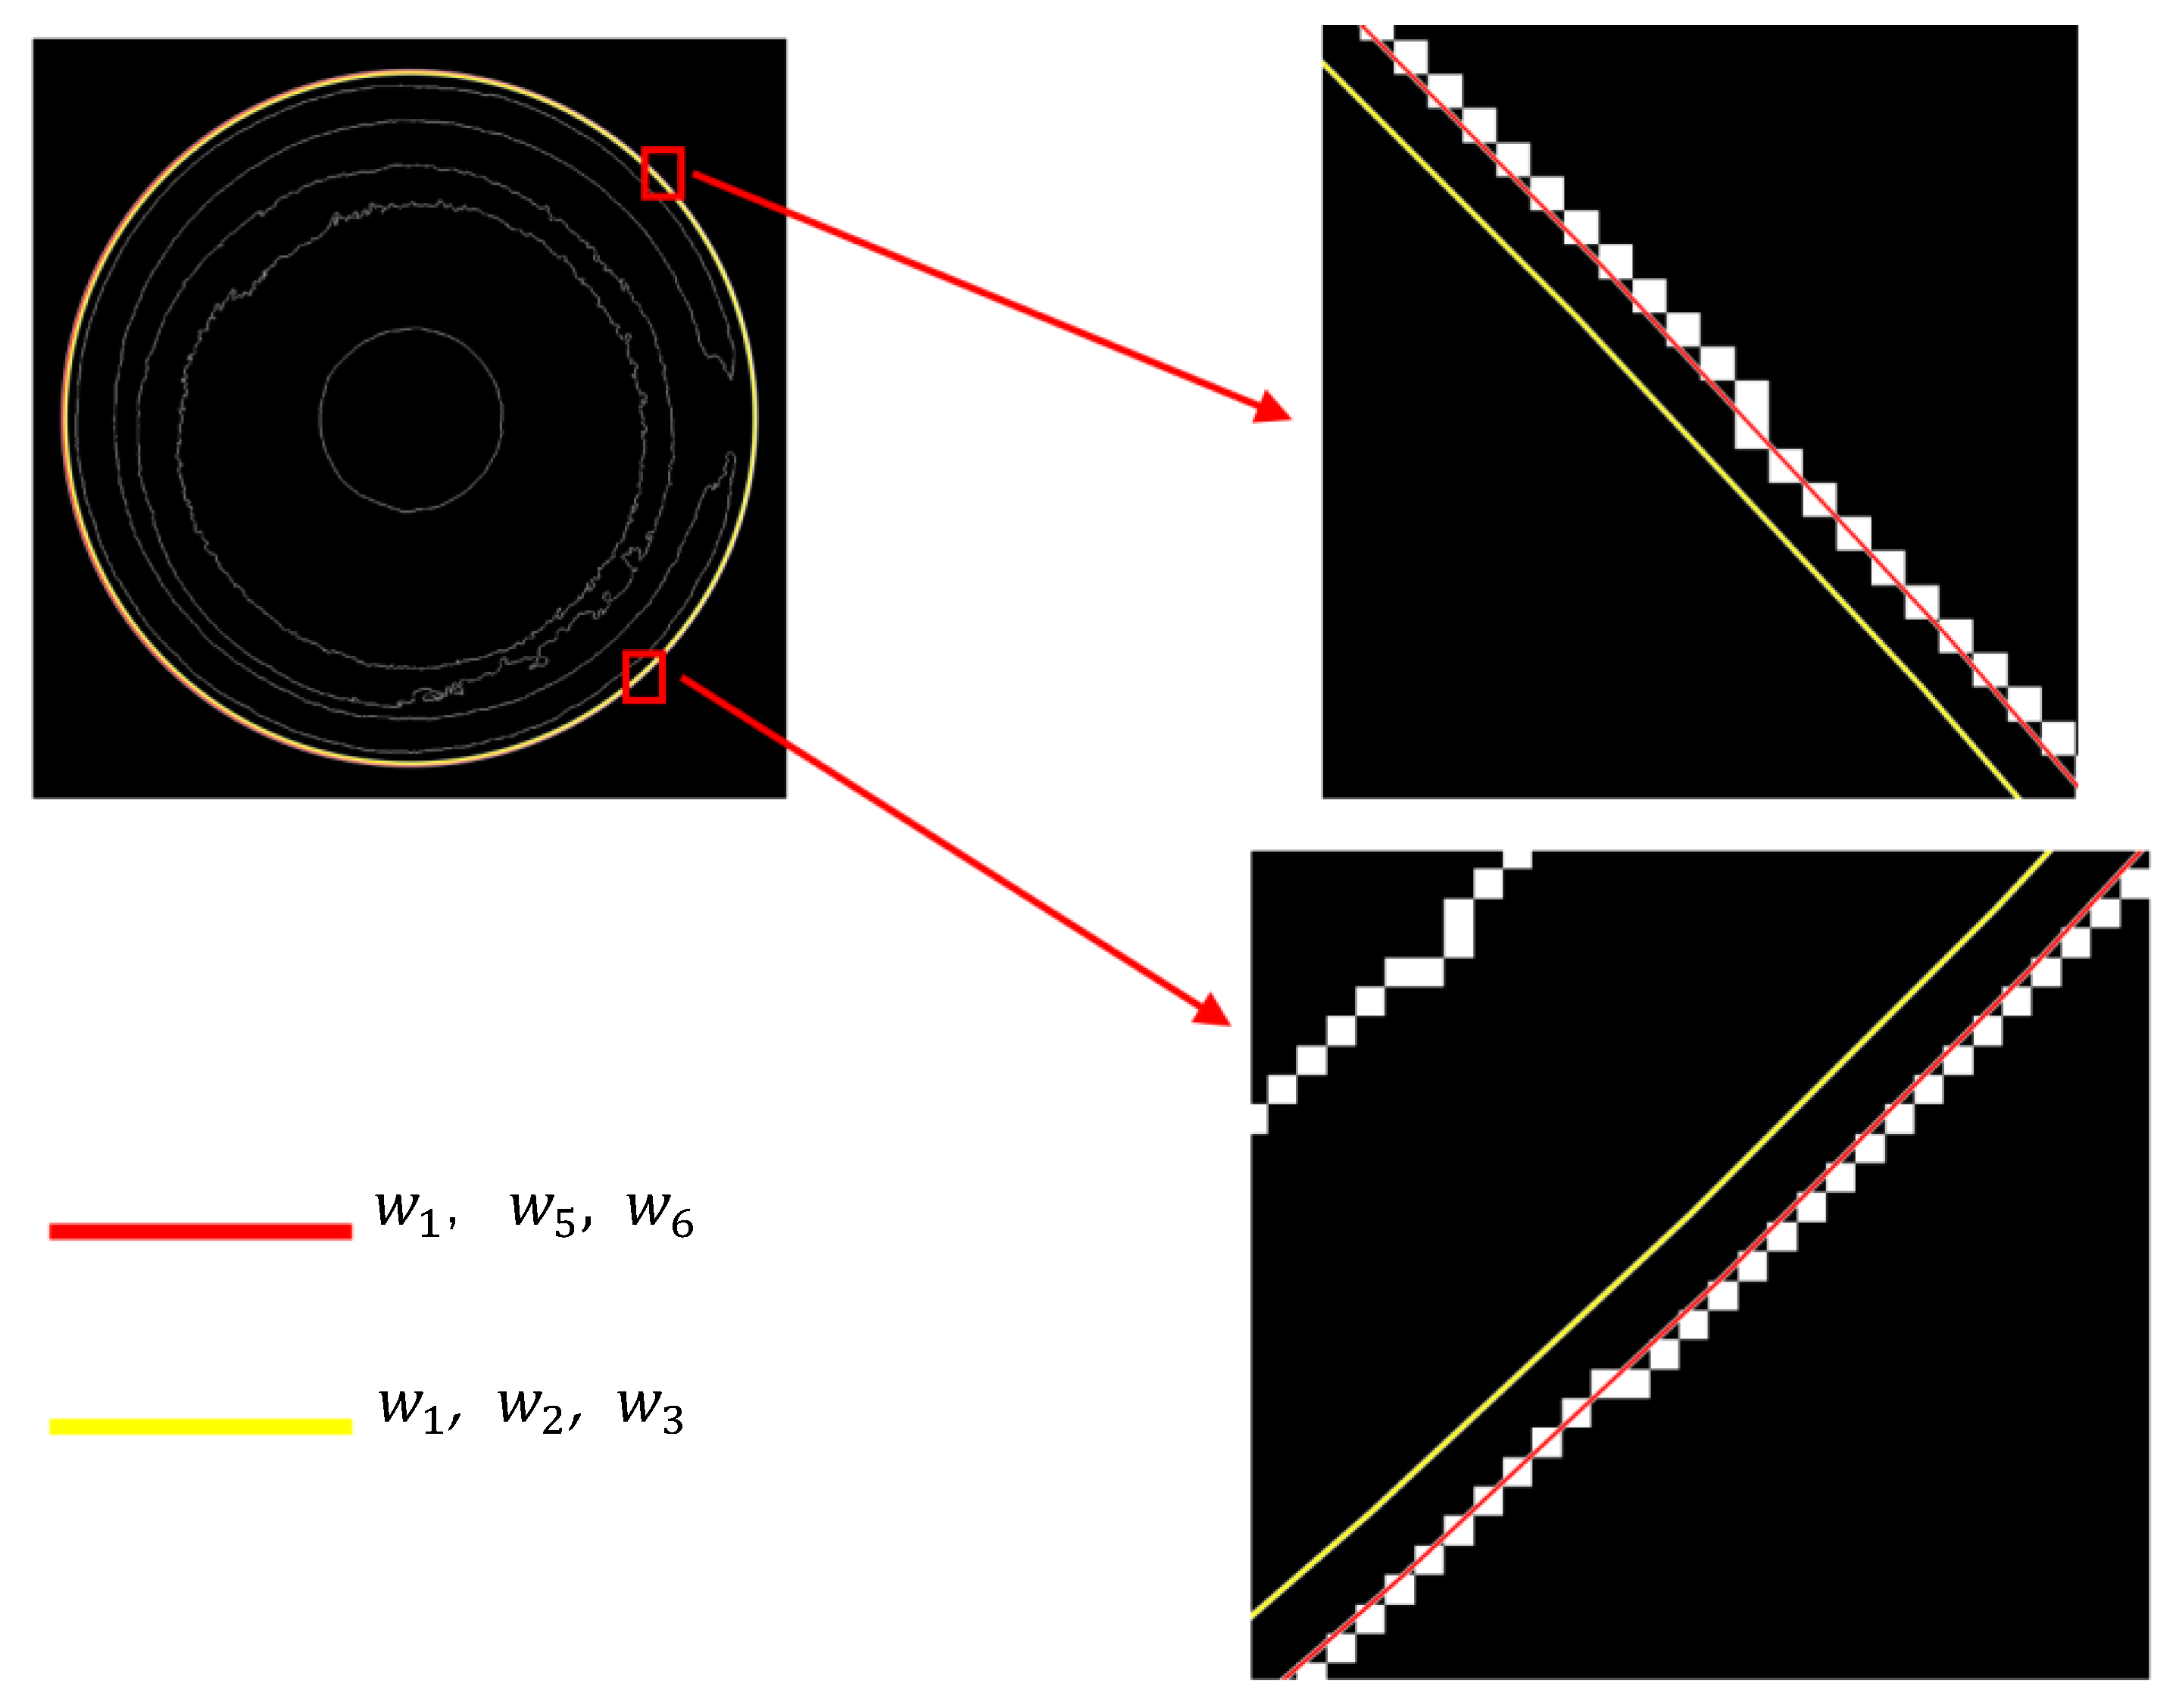
- In plane geometry, three non-collinear points can determine a unique circle. For , , and , although the center coordinates can also be calculated, the precision is relatively poor. In contrast, the points , , and can approximately form an equilateral triangle. In geometry, an equilateral triangle inscribed in a circle has the greatest symmetry and area. These advantages make the center coordinates calculated using , , and more accurate. A detailed comparison of the two methods for calculating the outer circle center is shown in Figure 7. The mathematical formula for calculating the outer circle center is as follows:
Figure 7. Detailed comparison of the two methods for calculating the outer circle center.
3.3. Determine the Range of Geometric Feature Points for the Inner Circle
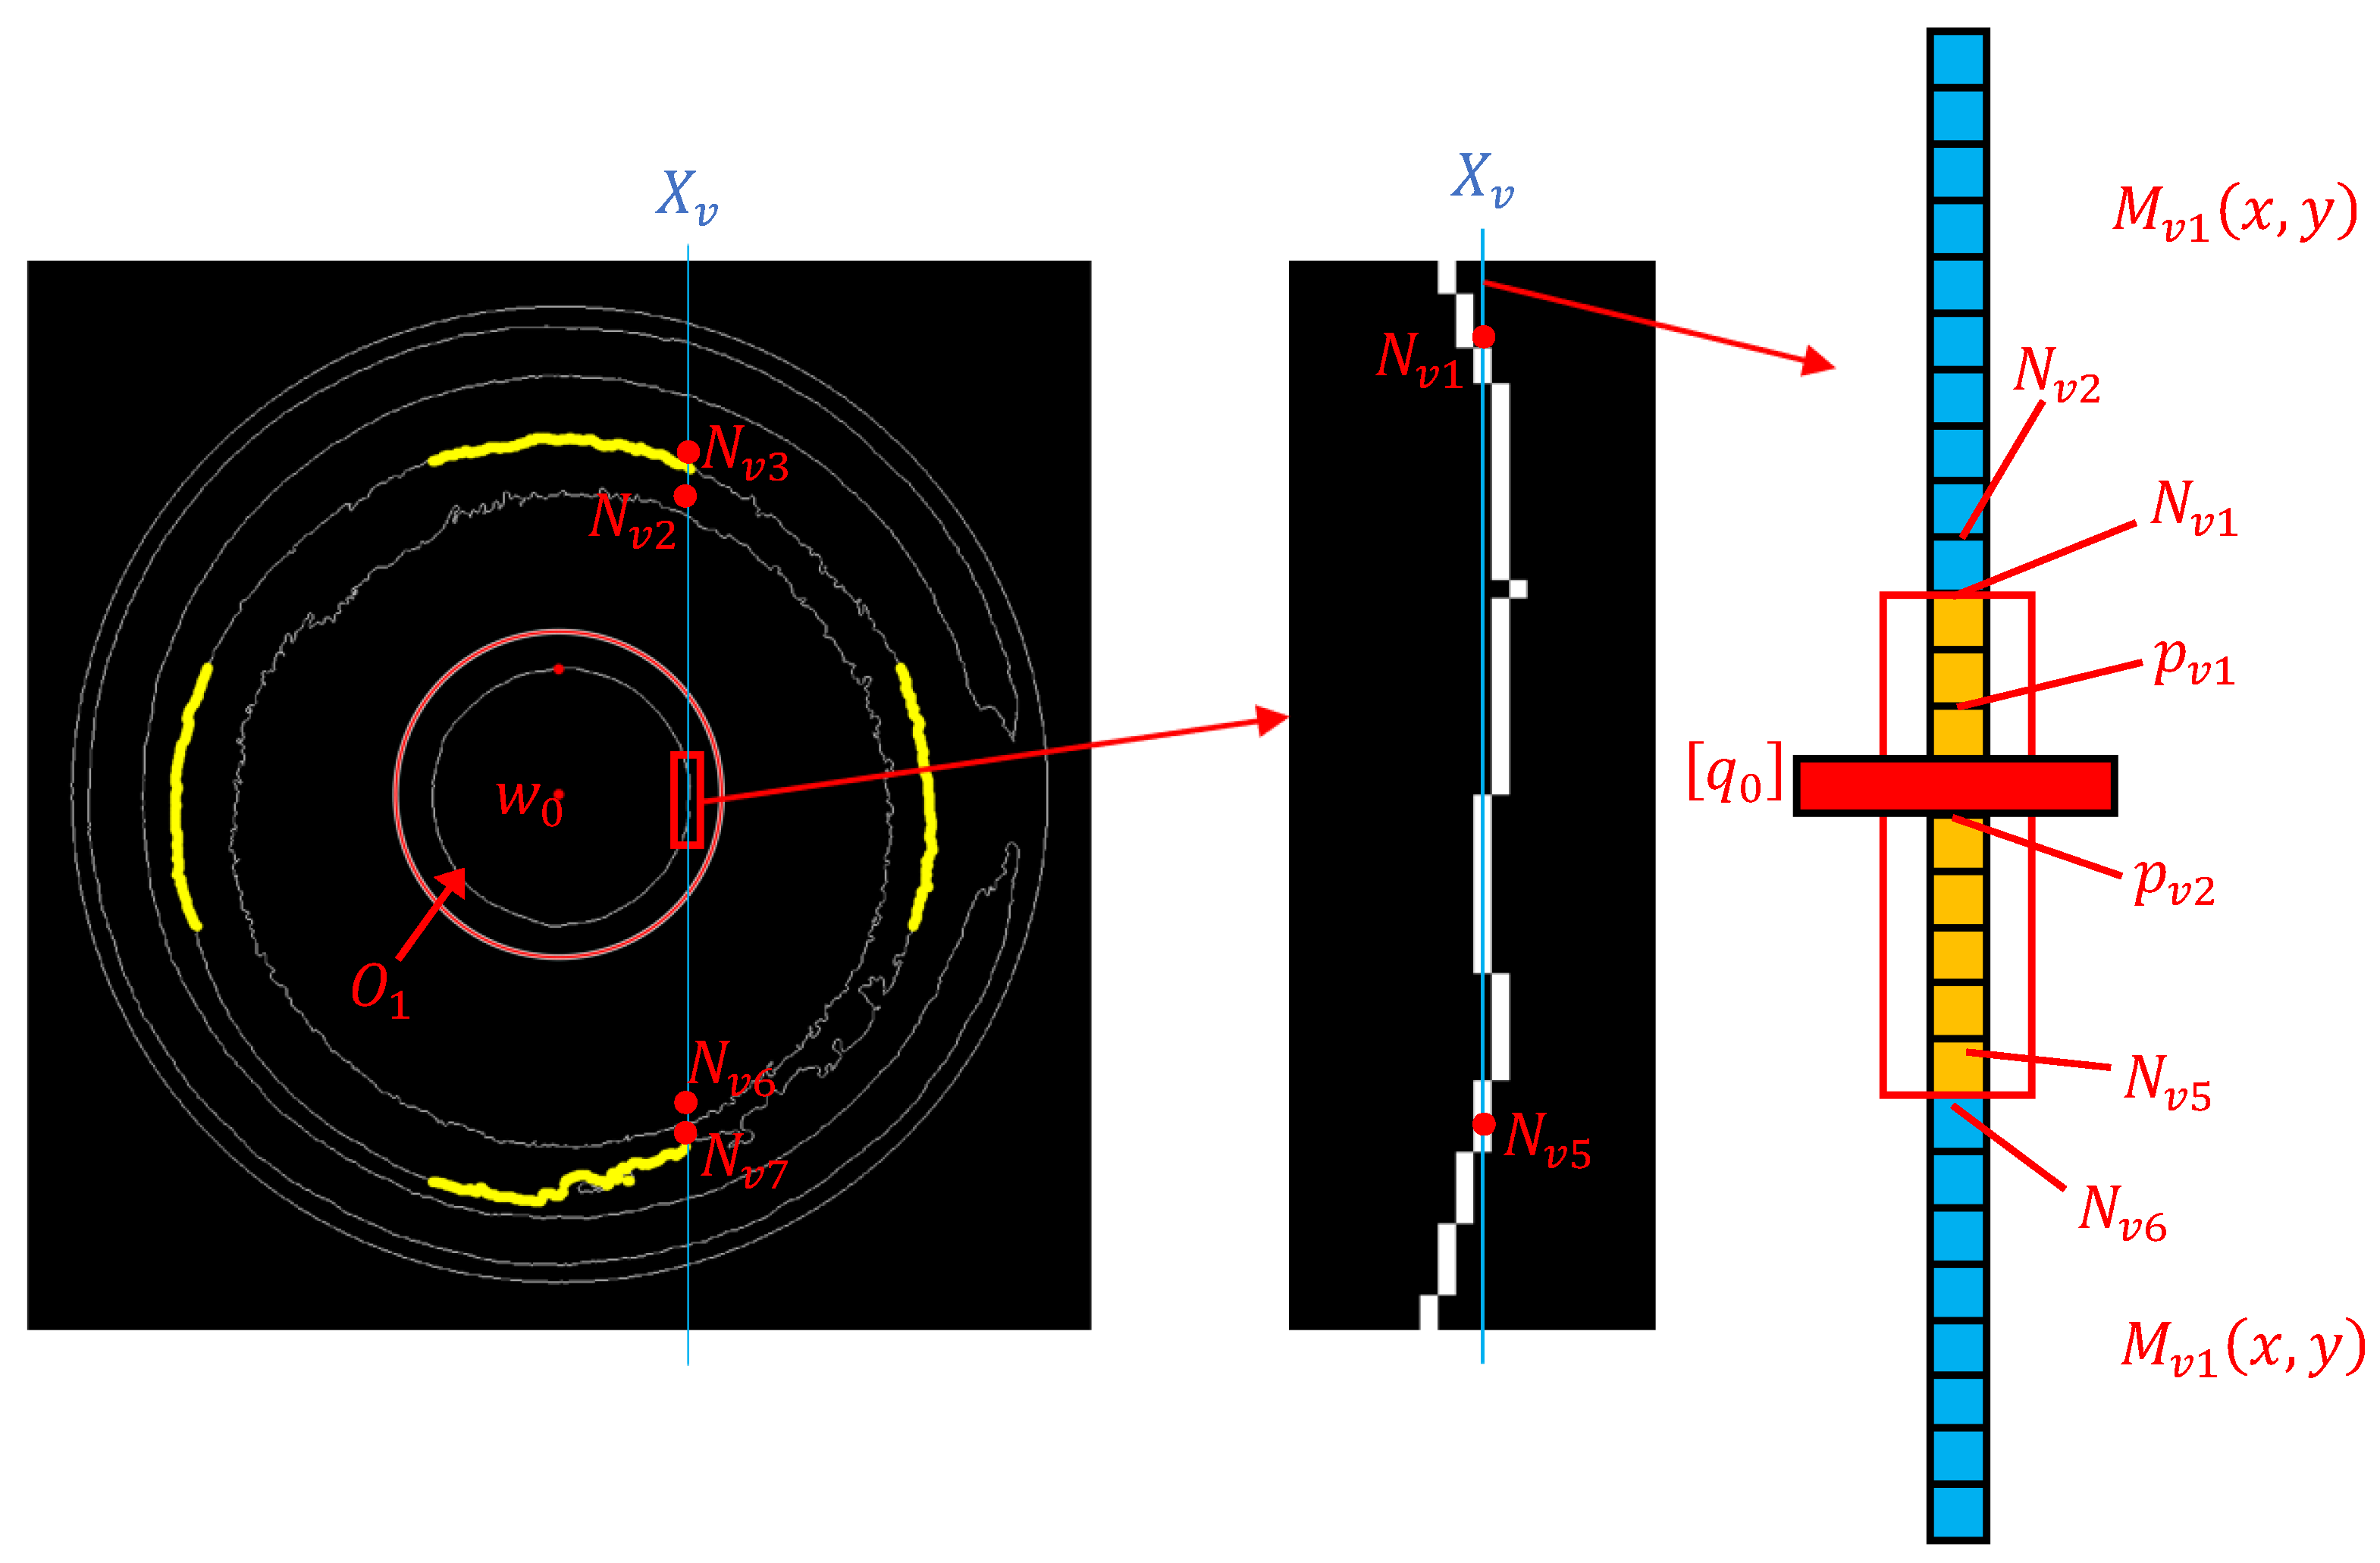
The edge contour of the measured part is relatively complex, so it is necessary to extract the inner circle coordinate data within a specific range. The process for determining the range of inner circle geometric feature points is illustrated in Figure 8. The detailed process of the algorithm is as follows:
Figure 8.
Determine the range of geometric feature points of the inner circle.
- (1)
- Extract the data with x-coordinates equal to from the two-dimensional array (where is the integer part of the x-coordinate of the outer circle center). This step results in a two-dimensional array containing coordinate data points. Using as the condition (where is the integer part of the y-coordinate of the outer circle center), when , a two-dimensional array is obtained. The last data point in is .
- (2)
- Define the distance threshold , where the value of should not be large.
- (3)
- Define the line equation as . Extract the data with x-coordinates equal to from . Traverse the image from left to right (where ). Each traversal yields a set of coordinate data. Then, calculate the distance between each coordinate in this set of data and the outer circle center .
- (4)
- For all line equations , the first occurrence of a coordinate with a distance to less than the threshold is defined as the vertical left boundary , and the last occurrence is defined as the vertical right boundary . Using the same method, the horizontal boundaries and of the inner circle’s geometric feature points can be determined.
3.4. Extract the Geometric Feature Points of the Inner Circle
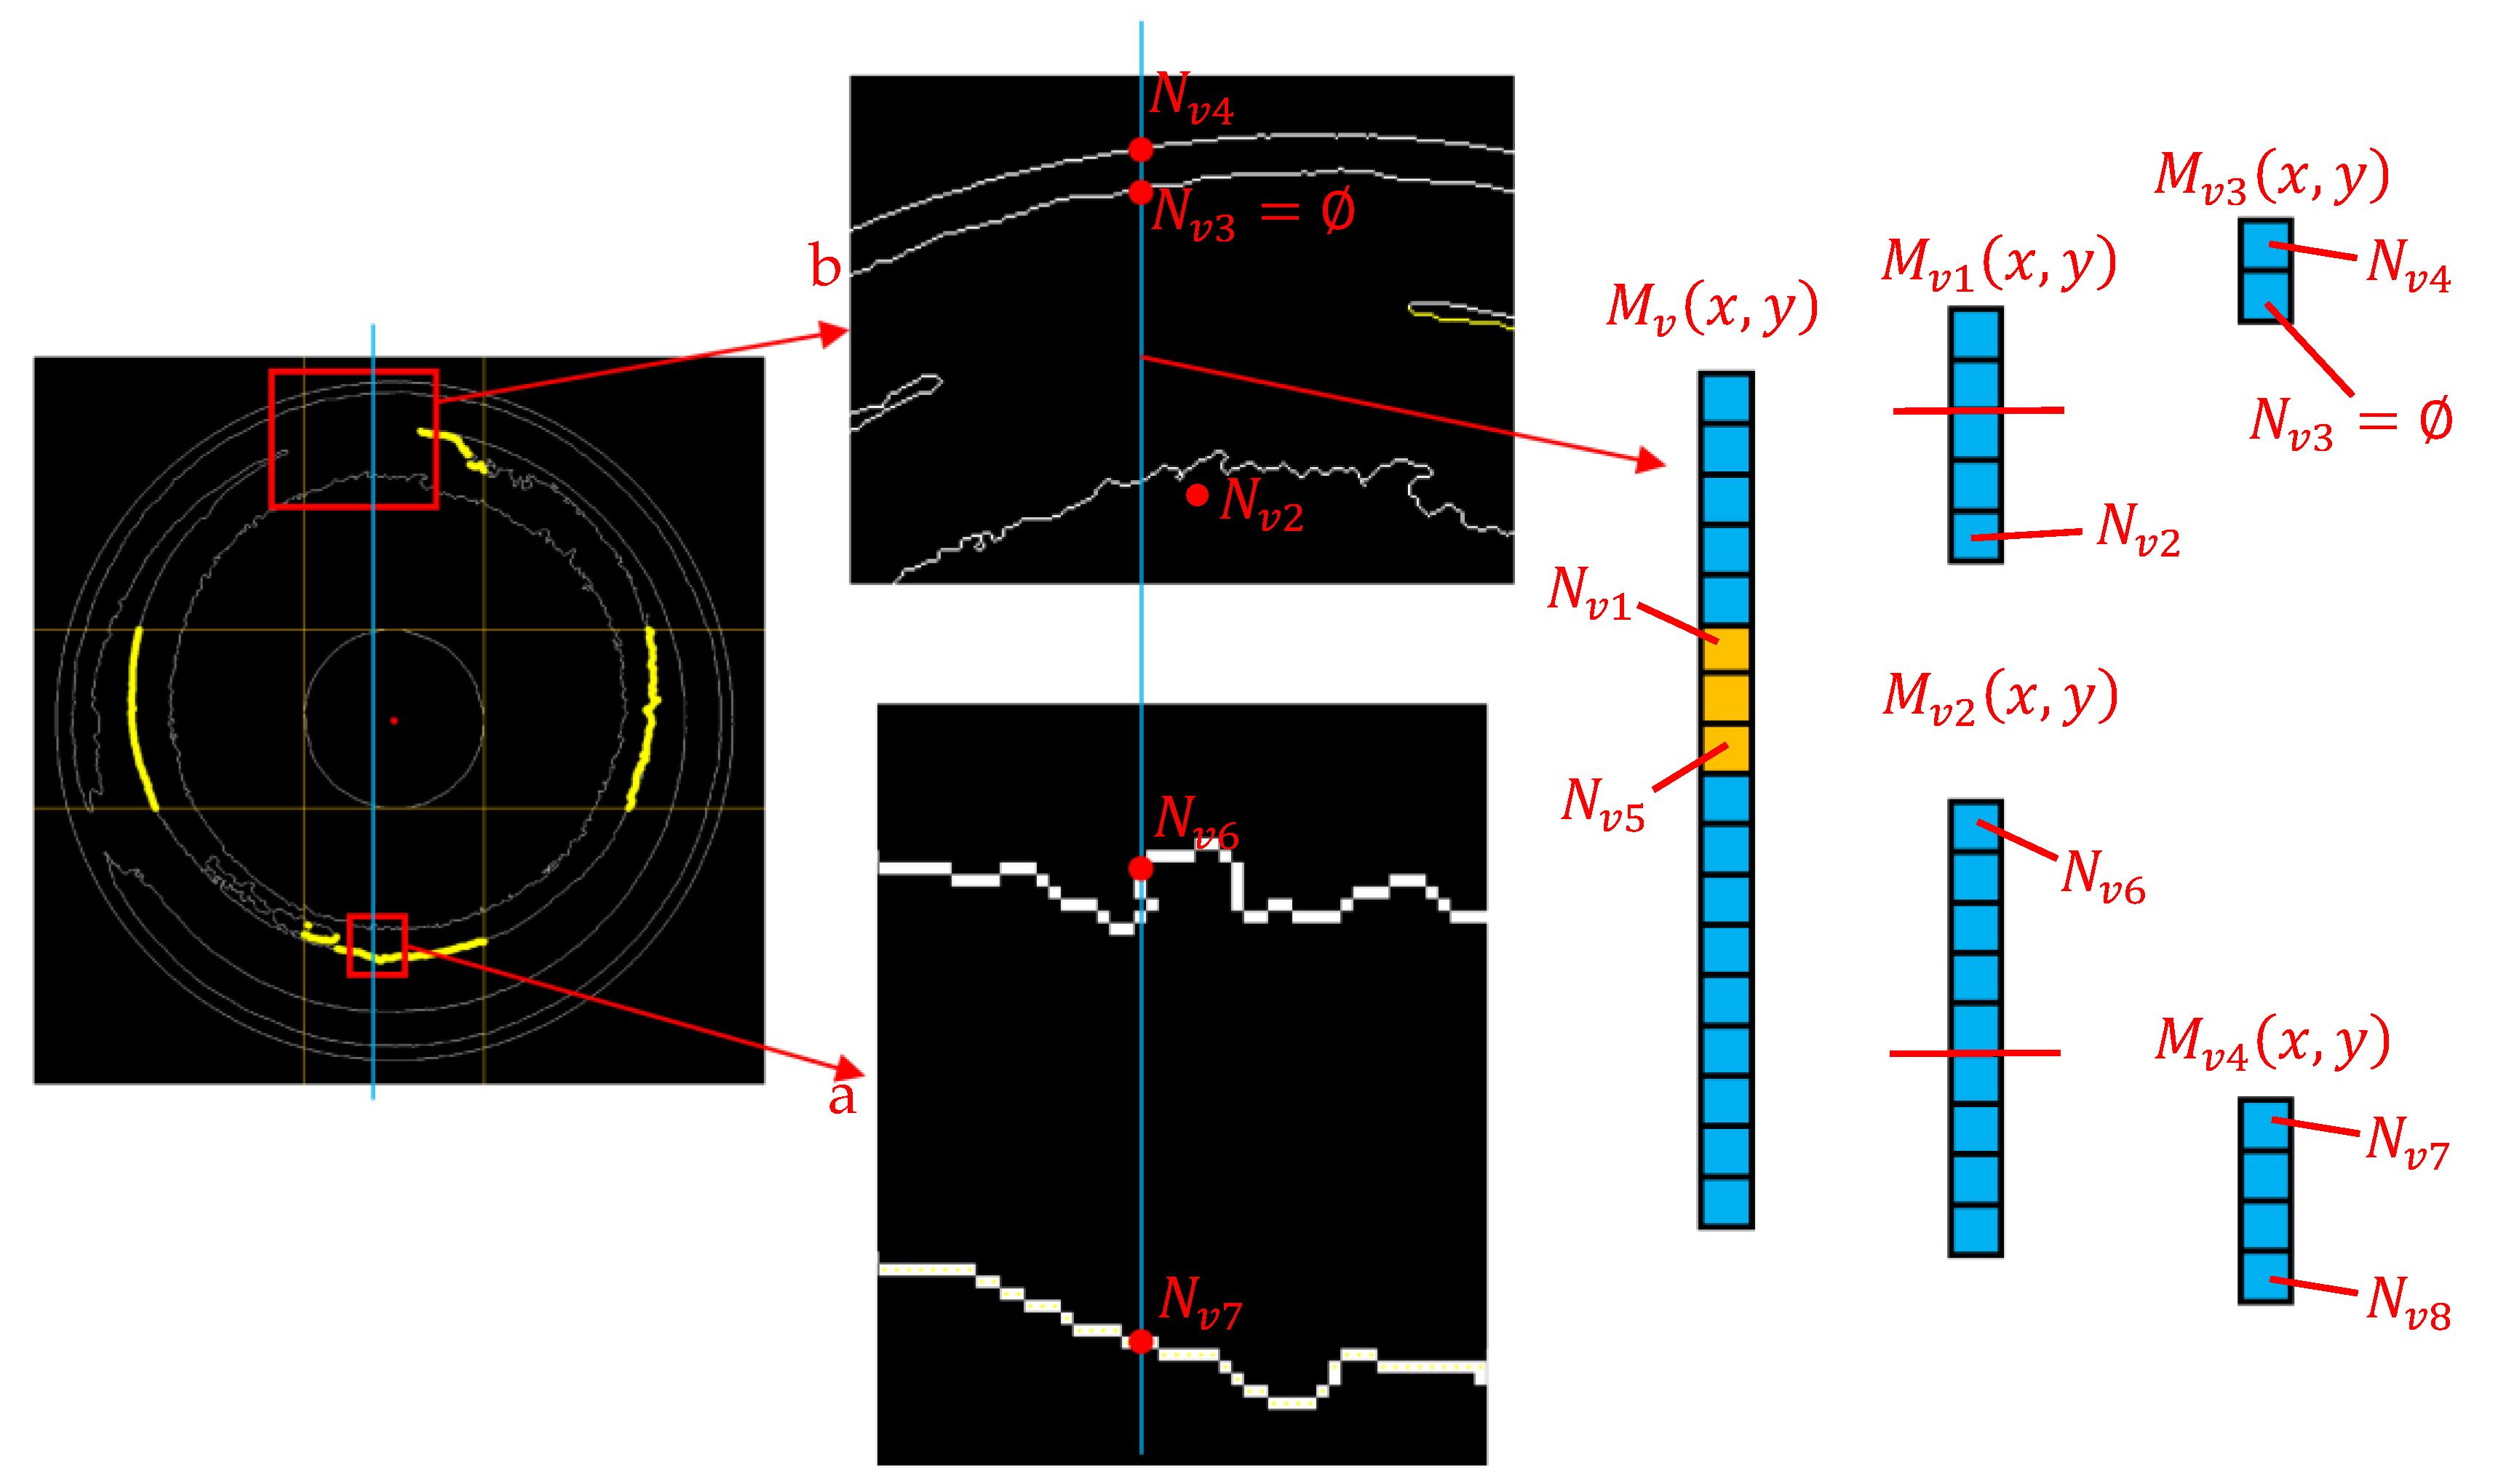
To accurately extract the coordinates of the inner circle’s geometric feature points, it is essential to rely on the positional information of reference points. The process of determining the position information of the reference point is shown in Figure 9. The detailed process of the algorithm is as follows:
Figure 9.
Determine the position information of the reference points.
- (1)
- The line equations are defined through the vertical boundaries and of the inner circle’s geometric feature points as follows:
- (2)
- Using the equation , traverse from to . Each traversal will yield a set of coordinate data . The and in this set of coordinate data are the required inner circle coordinate data. can be divided into two two-dimensional arrays using . However, as shown in the enlarged view of Figure 9, the contour of the reference circle is not a single pixel point, but a line composed of multiple pixel points. Therefore, determining the position information of and using the position information of and is not feasible.
- (3)
- Calculate the distance between each coordinate in and the outer circle center . Extract the coordinate data with distances less than the threshold . Set the first and last data points in this set of coordinates as the reference points and , respectively. Using the position information of the reference points and in , can be divided into and .
The process of extracting geometric feature points of the inner circle is shown in Figure 10. In , the last data point is ; in , the first data point is . As shown in the detailed enlarged view a of Figure 10, there are some regions with significant irregularities along the image edge. This often results in multiple edge pixel points existing between and . Similarly, multiple edge pixel points often exist between and as well.
Figure 10.
Extracting geometric feature points of the inner circle.
Define the distance threshold . Calculate the distance between each coordinate data point in the two-dimensional array and , and take the absolute value. Extract the coordinates with distances greater than the threshold . This step will yield a two-dimensional array containing coordinate data points. Similarly, calculate the distance between each coordinate in and , and extract the coordinates with distances greater than the threshold . This step will yield a two-dimensional array containing coordinate data points.
As shown in the enlarged view b of Figure 10, the inner circle contour is incomplete when the concentricity deviation of the measured part is large. Therefore, the last data point in and the first data point in cannot be strictly guaranteed to be the inner circle coordinate data and . To accurately extract the coordinate data for and , a second distance threshold needs to be introduced.
Define the second distance threshold . Calculate the distance between the last data point and the first data point in the two-dimensional array . If this distance is less than or equal to the threshold , the coordinate data of is not retained and is set to an empty set. Similarly, calculate the distance between the last data point and the first data point in . If this distance is less than or equal to the threshold , the coordinate data of is not retained and is set to an empty set. The mathematical expression for this process is:
3.5. Fit the Inner Circle Equation
Using the aforementioned method, all the geometric feature point coordinates of the inner circle in the vertical and horizontal directions can be obtained. Common methods for fitting the circle’s center include the centroid method [28], the weighted method, and the least squares method. The least squares method is the most mature of the three, has the highest fitting accuracy, and is the least affected by noise. As a result, it is widely used by many researchers [29,30,31]. The result of fitting the inner circle using the least squares method is shown in Figure 11. The mathematical formula for calculating the inner circle center is:
where is the number of geometric feature points obtained for the inner circle, is the radius of the fitted circle, and are the coordinates of the fitted inner circle center.
Figure 11.
Result of the inner circle fitting.
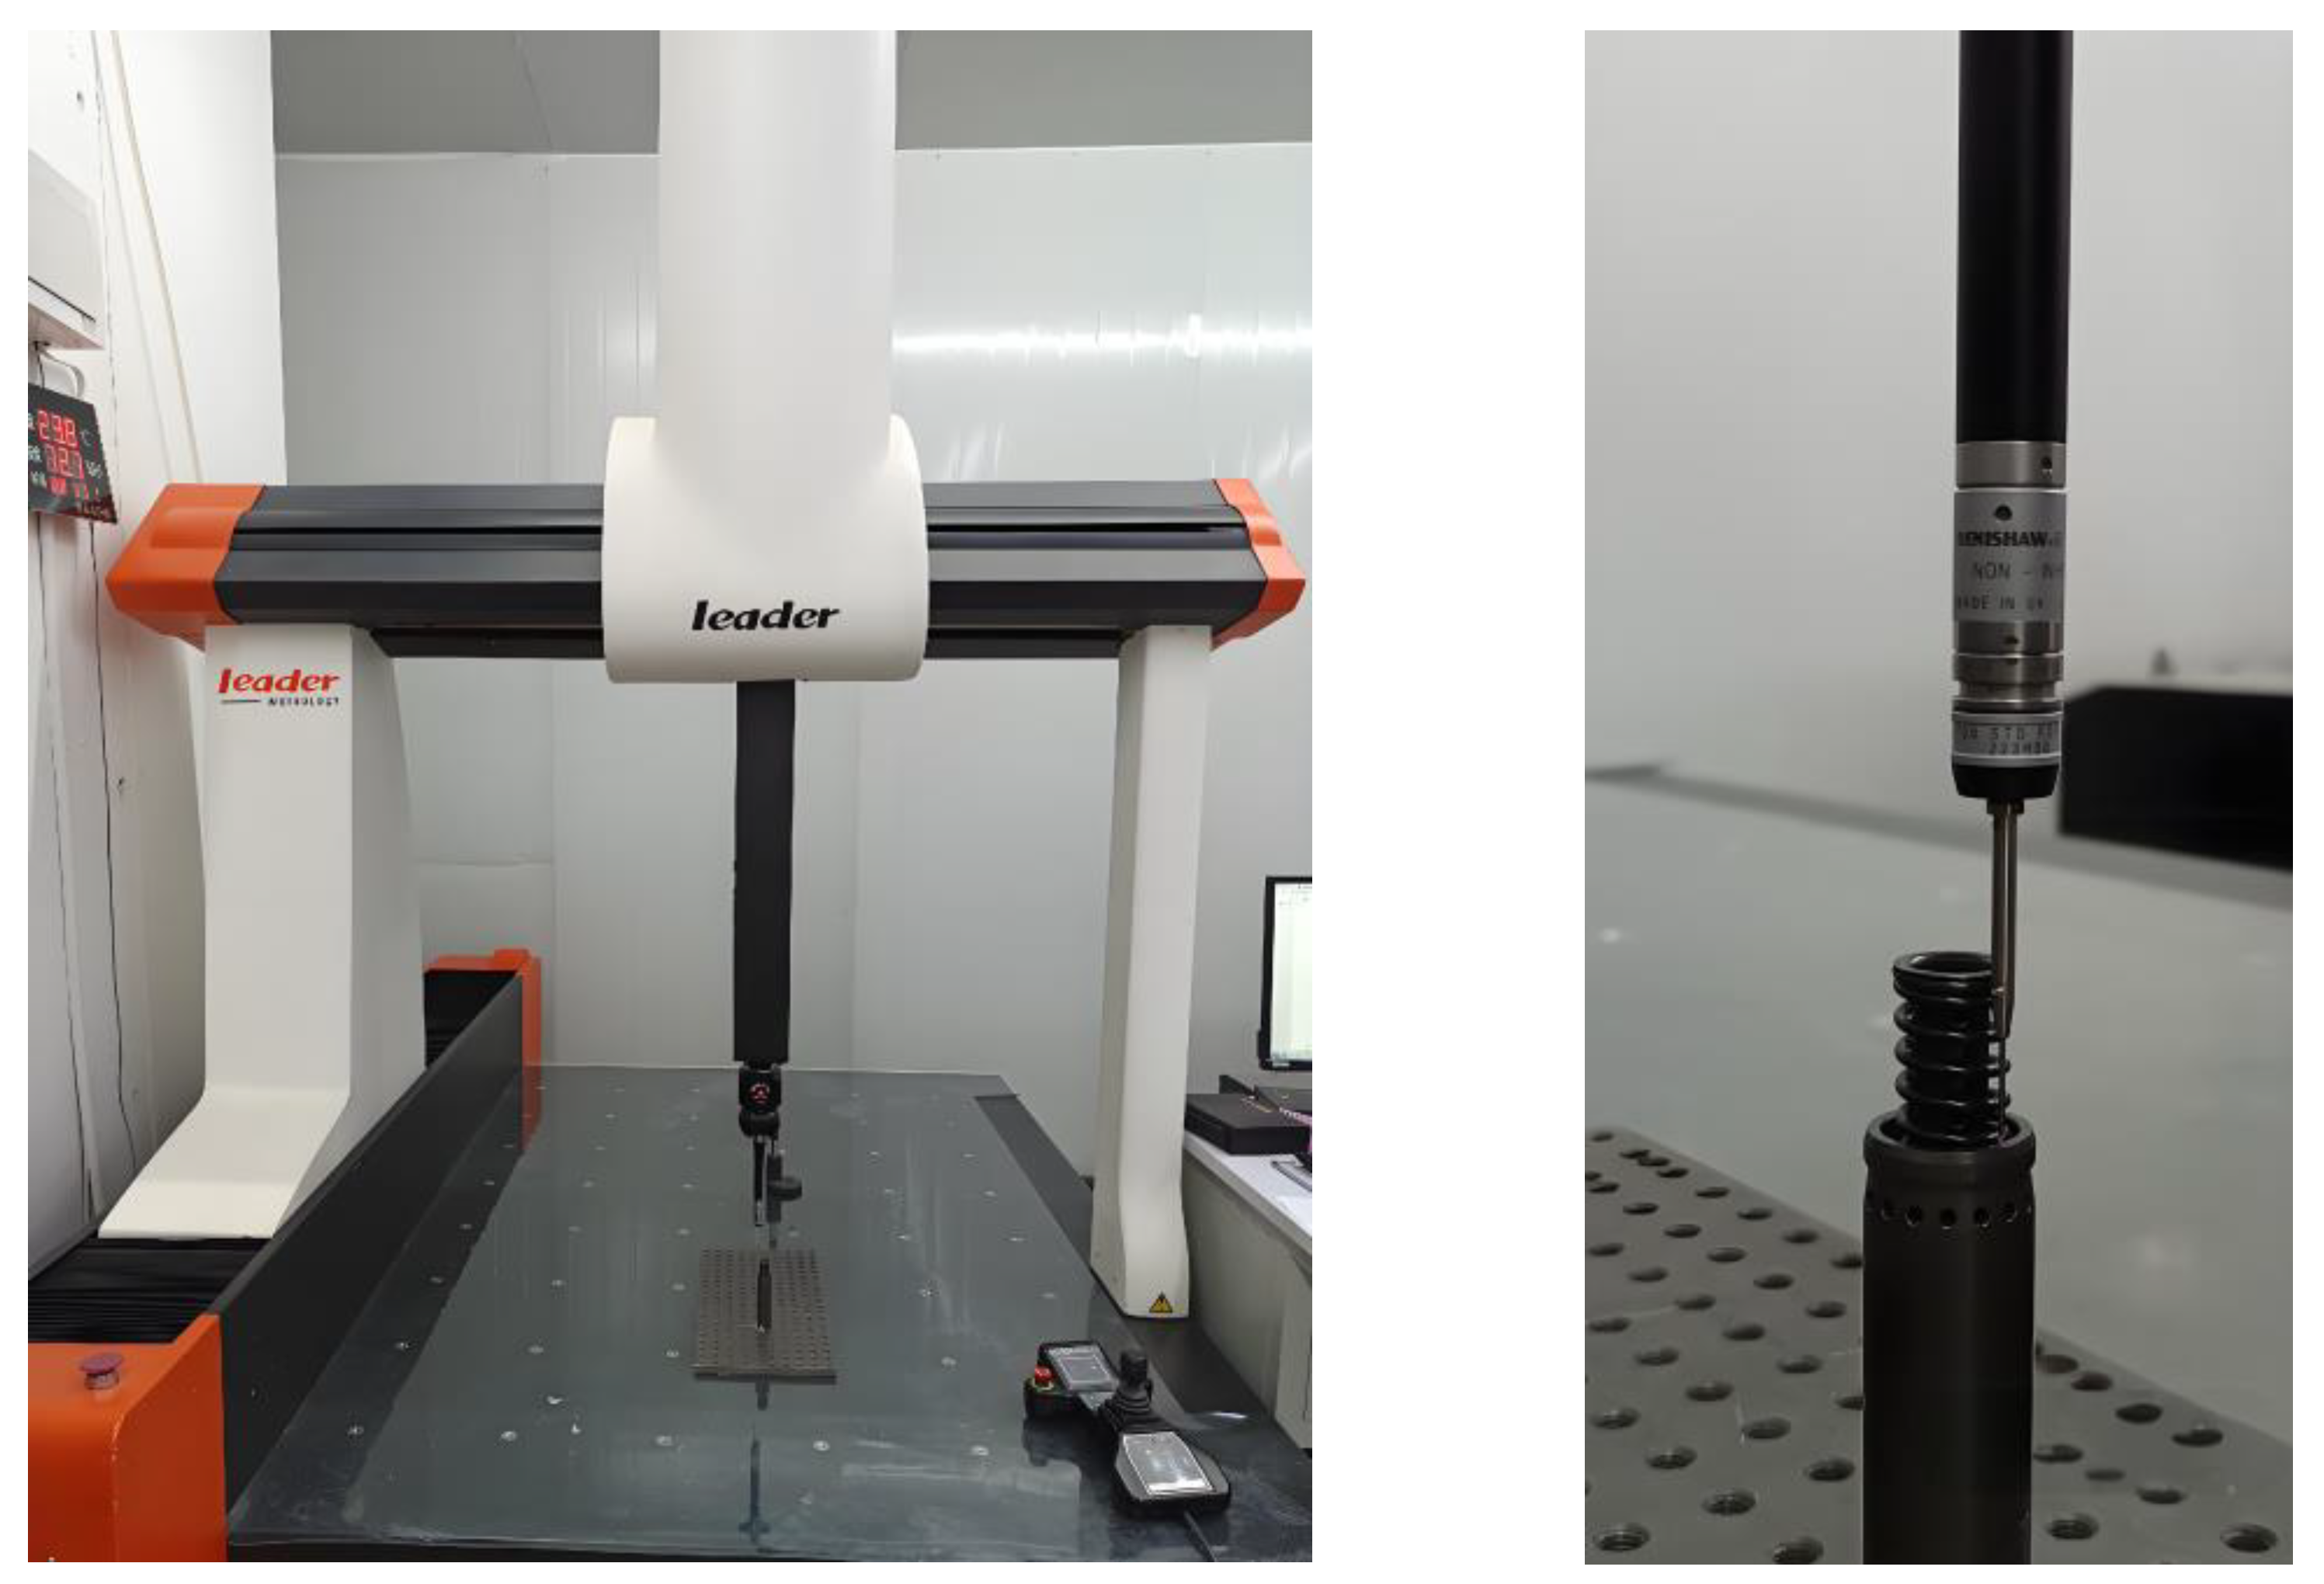
4. Experimental Verification
4.1. Experimental Setup
To verify the feasibility of the proposed method in practical engineering applications, a measurement system was established, as shown in Figure 12. The experimental equipment mainly consists of an industrial camera, lens, light source, and computer.
Figure 12.
Experimental equipment.
Considering the complex structure of the spring region, an LED ring light with a diameter of 90 mm was selected for illumination, with an illumination angle of 60°. This lighting method effectively reduces image shadow issues caused by the position and angle of the light source, resulting in clearer images captured by the industrial camera, and ultimately enhancing measurement accuracy.
The industrial camera used is the Hikvision MV-CU120-10GC color camera (resolution 4024 × 3036, frame rate 9.7 fps, signal-to-noise ratio 40.5 db). To reduce measurement errors caused by image distortion, the Hikvision MVL-KF3528M-12MPE high-definition, ultra-low distortion lens was selected, with a distortion rate of only −0.01%.
4.2. System Calibration and Concentricity Error Calculation
To measure the actual concentricity error, the system needs to be calibrated to determine the actual physical size corresponding to each pixel in the image. Because we use an ultra-low distortion, high-resolution lens with a distortion rate of only −0.01%, the impact of image distortion can be almost negligible. The pixel diameter of the outer circle is denoted as , and the mathematical formula is as follows:
where and are the pixel coordinate values of the center of the outer circle; and are the pixel coordinate values of the edge pixel point of the outer circle.
Therefore, the formula for calculating the pixel equivalent is:
where is the actual diameter of the outer circle. is the pixel diameter of the outer circle.
The concentricity error can be calculated using the inner circle center and the outer circle center . The mathematical calculation formula is:
4.3. Experimental Results and Analysis
The experiment selected 10 automotive brake piston components as test subjects, using the algorithm proposed in this paper to calculate concentricity errors. To verify the accuracy of the proposed algorithm, a coordinate measuring machine (CMM) was also employed, as shown in Figure 13. The results of both measurement methods are presented in Table 1, and the concentricity measurement errors are illustrated in Figure 14.
Figure 13.
Measuring the concentricity error of the workpiece using a CMM.
Table 1.
Concentricity error measurement results.
Figure 14.
Concentricity measurement error.
As illustrated in Figure 14, the methodology presented in this paper exhibits a high degree of correlation with the data obtained from the three-coordinate measuring machine. The maximum error for the ten experimental objects is 0.0393 mm, which is an acceptable error value for practical engineering applications. This proves the feasibility of the measurement method proposed in this paper. To further verify the stability and reliability of the algorithm, we conducted multiple image acquisitions for each test object, collecting a total of 200 images. The experimental results showed that all images successfully and accurately fit the inner circle equation. Furthermore, compared to conventional coordinate measuring machines, the methodology presented in this paper offers significant advantages in measurement efficiency. Using image processing and algorithmic calculations, measurement results can be obtained in a short time. Experimental results show that the average time required by this algorithm is approximately 3.9 s, thereby establishing a foundation for online inspection of the concentricity of automotive brake piston parts.
Additionally, we compared the proposed method with existing techniques for measuring concentricity and coaxiality, with a particular focus on measurement accuracy and algorithm speed. The comparison results, as shown in Table 2, demonstrate that the proposed method has significant advantages in both precision and efficiency, which further supports its effectiveness and reliability.
Table 2.
Comparison of accuracy and efficiency across different methods.
At the same time, we evaluated the technological maturity of the machine vision system proposed in this paper within the context of Industry 5.0, resulting in a maturity level of 3 [32]. This evaluation is mainly based on the support of multiple key factors, including the use of a color industrial camera for image acquisition, the ability to flexibly adjust algorithm parameters according to part size changes, and the design of corresponding software to enhance the adaptability of the system.
5. Conclusions
A non-contact concentricity measurement method for automotive brake piston components based on the combination of machine vision and image processing technology is proposed, and a corresponding image acquisition system is designed. The novelty of the proposed measurement method lies in its speed and flexibility. Experimental results demonstrate that the algorithm has an average processing time of only 3.9 s, and by modifying the algorithm parameters, the concentricity of other stepped shaft parts can be measured. The main conclusions of this paper are as follows:
(1) A non-contact measurement method was adopted in this paper. Through image processing and algorithmic calculation, the concentricity of automotive brake piston components was measured, avoiding the defects of contact measurement that can easily damage the workpiece surface. The designed image acquisition system and algorithm were able to accurately extract the geometric feature points of the outer and inner circles. The inner circle center was obtained by fitting using the least squares method, and the concentricity error was finally calculated.
(2) The proposed algorithm was compared with the measurement results of a coordinate measuring machine (CMM). The maximum error for the 10 experimental subjects was 0.0393 mm, meeting the detection requirements, and proving that the proposed method is feasible in practical engineering applications.
(3) Through multiple measurements of 10 experimental subjects, the algorithm was found to have an average processing time of only 3.9 s, significantly improving measurement efficiency and meeting the needs of automated inspection in industrial applications.
This method is not only suitable for the concentricity measurement of automotive brake piston components, but also has good scalability and can be applied to the concentricity measurement of other complex stepped shaft parts. Future research directions include further optimizing the algorithm to improve measurement accuracy and applying the algorithm to other more complex stepped shaft parts. The proposed machine vision-based concentricity measurement method meets the detection requirements in terms of both accuracy and efficiency, laying the foundation for the online detection of the concentricity of automotive brake piston components.
Author Contributions
Conceptualization, Q.L. and W.G.; methodology, W.G.; software, W.G.; validation, Q.L., W.G. and W.Z.; resources, Q.L. and T.X.; data curation, W.G.; writing—original draft preparation, W.G.; writing—review and editing, Q.L. and W.G.; visualization, S.Z. and T.X.; supervision, Q.L.; funding acquisition, T.X. and S.Z. All authors have read and agreed to the published version of the manuscript.
Funding
This project was supported by the Key Research and Development Projects of Jilin Province’s Science and Technology Development Plan (20220201043GX) and the Jilin Provincial Department of Education Science and Technology Research Projects (2024LY501L08).
Data Availability Statement
The data presented in this study are available on request from the corresponding author.
Conflicts of Interest
The authors declare no conflicts of interest.
References
- Zhang, Y.; Wang, Y.; Liu, Y.; Lv, D.; Fu, X.; Zhang, Y.; Li, J. A concentricity measurement method for large forgings based on laser ranging principle. Measurement 2019, 147, 106838. [Google Scholar] [CrossRef]
- Cheng, A.; Ye, J.; Yang, F.; Lu, S.; Gao, F. An Effective Coaxiality Measurement for Twist Drill Based on Line Structured Light Sensor. IEEE Trans. Instrum. Meas. 2022, 71, 7006517. [Google Scholar] [CrossRef]
- Gao, C.; Lu, Y.; Lu, Z.; Liu, X.; Zhang, J. Research on coaxiality measurement system of large-span small-hole system based on laser collimation. Measurement 2022, 191, 110765. [Google Scholar] [CrossRef]
- Li, W.; Li, F.; Jiang, Z.; Wang, H.; Huang, Y.; Liang, Q.; Huang, M.; Li, T.; Gao, X. A machine vision-based radial circular runout measurement method. Int. J. Adv. Manuf. Technol. 2023, 126, 3949–3958. [Google Scholar] [CrossRef]
- Chai, Z.; Lu, Y.; Li, X.; Cai, G.; Tan, J.; Ye, Z. Non-contact measurement method of coaxiality for the compound gear shaft composed of bevel gear and spline. Measurement 2021, 168, 108453. [Google Scholar] [CrossRef]
- Dou, Y.; Zheng, S.; Ren, H.; Gu, X.; Sui, W. Research on the measurement method of crankshaft coaxiality error based on three-dimensional point cloud. Meas. Sci. Technol. 2024, 35, 035202. [Google Scholar] [CrossRef]
- Li, C.; Xu, X.; Sun, H.; Miao, J.; Ren, Z. Coaxiality of Stepped Shaft Measurement Using the Structured Light Vision. Math. Probl. Eng. 2021, 2021, 5575152. [Google Scholar] [CrossRef]
- Poyraz, A.G.; Kacmaz, M.; Gurkan, H.; Dirik, A.E. Sub-Pixel counting based diameter measurement algorithm for industrial Machine vision. Measurement 2024, 225, 114063. [Google Scholar] [CrossRef]
- Wang, W.; Liu, W.; Zhang, Y.; Zhang, P.; Si, L.; Zhou, M. Illumination system optimal design for geometry measurement of complex cutting tools in machine vision. Int. J. Adv. Manuf. Technol. 2023, 125, 105–114. [Google Scholar] [CrossRef]
- Wei, G.; Tan, Q. Measurement of shaft diameters by machine vision. Appl. Opt. 2011, 50, 3246–3253. [Google Scholar] [CrossRef]
- Xiang, R.; He, W.; Zhang, X.; Wang, D.; Shan, Y. Size measurement based on a two-camera machine vision system for the bayonets of automobile brake pads. Measurement 2018, 122, 106–116. [Google Scholar] [CrossRef]
- Dong, L.; Chen, W.; Yang, S.; Yu, H. A new machine vision-based intelligent detection method for gear grinding burn. Int. J. Adv. Manuf. Technol. 2023, 125, 4663–4677. [Google Scholar] [CrossRef]
- Li, X.; Wang, S.; Xu, K. Automatic Measurement of External Thread at the End of Sucker Rod Based on Machine Vision. Sensors 2022, 22, 8276. [Google Scholar] [CrossRef] [PubMed]
- Qu, J.; Yue, C.; Zhou, J.; Xia, W.; Liu, X.; Liang, S.Y. On-machine detection of face milling cutter damage based on machine vision. Int. J. Adv. Manuf. Technol. 2024, 133, 1865–1879. [Google Scholar] [CrossRef]
- Tian, H.; Wang, D.; Lin, J.; Chen, Q.; Liu, Z. Surface Defects Detection of Stamping and Grinding Flat Parts Based on Machine Vision. Sensors 2020, 20, 4531. [Google Scholar] [CrossRef]
- Xiao, G.; Li, Y.; Xia, Q.; Cheng, X.; Chen, W. Research on the on-line dimensional accuracy measurement method of conical spun workpieces based on machine vision technology. Measurement 2019, 148, 106881. [Google Scholar] [CrossRef]
- Xu, J.; Zheng, S.; Sun, K.; Song, P. Research and Application of Contactless Measurement of Transformer Winding Tilt Angle Based on Machine Vision. Sensors 2023, 23, 4755. [Google Scholar] [CrossRef]
- Zhou, J.; Yu, J. Chisel edge wear measurement of high-speed steel twist drills based on machine vision. Comput. Ind. 2021, 128, 103436. [Google Scholar] [CrossRef]
- Powell, D.; Magnanini, M.C.; Colledani, M.; Myklebust, O. Advancing zero defect manufacturing: A state-of-the-art perspective and future research directions. Comput. Ind. 2022, 136, 103596. [Google Scholar] [CrossRef]
- Sun, Q.; Hou, Y.; Tan, Q.; Li, C. Shaft diameter measurement using a digital image. Opt. Lasers Eng. 2014, 55, 183–188. [Google Scholar] [CrossRef]
- Zhang, W.; Han, Z.; Li, Y.; Zheng, H.; Cheng, X. A Method for Measurement of Workpiece form Deviations Based on Machine Vision. Machines 2022, 10, 718. [Google Scholar] [CrossRef]
- Li, B. Research on geometric dimension measurement system of shaft parts based on machine vision. Eurasip J. Image Video Process. 2018, 2018, 101. [Google Scholar] [CrossRef]
- Konstantinidis, F.K.; Mouroutsos, S.G.; Gasteratos, A. The Role of Machine Vision in Industry 4.0: An automotive manufacturing perspective. In Proceedings of the IEEE International Conference on Imaging Systems and Techniques (IST), Electr Network, Kaohsiung, Taiwan, 24–26 August 2021. [Google Scholar]
- Draz, H.H.; Elashker, N.E.; Mahmoud, M.M.A. Optimized Algorithms and Hardware Implementation of Median Filter for Image Processing. Circuits Syst. Signal Process. 2023, 42, 5545–5558. [Google Scholar] [CrossRef]
- Lim, T.Y.; Ratnam, M.M. Edge detection and measurement of nose radii of cutting tool inserts from scanned 2-D images. Opt. Lasers Eng. 2012, 50, 1628–1642. [Google Scholar] [CrossRef]
- Sun, K.W.; Xu, J.Z.; Zheng, S.Y.; Zhang, N.S. Transformer High-Voltage Primary Coil Quality Detection Method Based on Machine Vision. Appl. Sci. 2023, 13, 1480. [Google Scholar] [CrossRef]
- Yan, G.; Zhang, J.; Zhou, J.; Han, Y.; Zhong, F.; Zhou, H. Research on Roundness Detection and Evaluation of Aluminum Hose Tail Based on Machine Vision. Int. J. Precis. Eng. Manuf. 2024, 25, 1127–1137. [Google Scholar] [CrossRef]
- Koren, M.; Mokros, M.; Bucha, T. Accuracy of tree diameter estimation from terrestrial laser scanning by circle-fitting methods. Int. J. Appl. Earth Obs. Geoinf. 2017, 63, 122–128. [Google Scholar] [CrossRef]
- Ahn, S.J.; Rauh, W.; Warnecke, H.J. Least-squares orthogonal distances fitting of circle, sphere, ellipse, hyperbola, and parabola. Pattern Recognit. 2001, 34, 2283–2303. [Google Scholar] [CrossRef]
- Cao, Z.-m.; Wu, Y.; Han, J. Roundness deviation evaluation method based on statistical analysis of local least square circles. Meas. Sci. Technol. 2017, 28, 105017. [Google Scholar] [CrossRef]
- Li, Q.; Ge, W.; Shi, H.; Zhao, W.; Zhang, S. Research on Coaxiality Measurement Method for Automobile Brake Piston Components Based on Machine Vision. Appl. Sci. 2024, 14, 2371. [Google Scholar] [CrossRef]
- Konstantinidis, F.K.; Myrillas, N.; Tsintotas, K.A.; Mouroutsos, S.G.; Gasteratos, A. A technology maturity assessment framework for Industry 5.0 machine vision systems based on systematic literature review in automotive manufacturing. Int. J. Prod. Res. 2023. [Google Scholar] [CrossRef]
Disclaimer/Publisher’s Note: The statements, opinions and data contained in all publications are solely those of the individual author(s) and contributor(s) and not of MDPI and/or the editor(s). MDPI and/or the editor(s) disclaim responsibility for any injury to people or property resulting from any ideas, methods, instructions or products referred to in the content. |
© 2024 by the authors. Licensee MDPI, Basel, Switzerland. This article is an open access article distributed under the terms and conditions of the Creative Commons Attribution (CC BY) license (https://creativecommons.org/licenses/by/4.0/).