Abstract
A large amount of sensitive information is generated in today’s evolving network environment. Some hackers utilize low-frequency attacks to steal sensitive information from users. This generates minority attack samples in real network traffic. As a result, the data distribution in real network traffic is asymmetric, with a large number of normal traffic and a rare number of attack traffic. To address the data imbalance problem, intrusion detection systems mainly rely on machine-learning-based methods to detect minority attacks. Although this approach can detect minority attacks, the performance is not satisfactory. To solve the above-mentioned problems, this paper proposes a novel high-performance multimodal deep learning method. The method is based on deep learning. It captures the features of minority class attacks based on generative adversarial networks, which in turn generate high-quality minority class sample attacks. Meanwhile, it uses the designed multimodal deep learning model to learn the features of minority attacks. The integrated classifier then utilizes the learned features for multi-class classification. This approach achieves 99.55% and 99.95% F-measure, 99.56% and 99.96% accuracy on the CICIDS2017 dataset and the NSL-KDD dataset, respectively, with the highest false positives at only 3.4%. This exceeds the performance of current state-of-the-art methods.
1. Introduction
1.1. Research Background
Although the internet has made our lives easier, its rapid growth has also made networks more complicated and vulnerable to hacker attacks, increasing the risk associated with network security [1]. Therefore, it is crucial to design symmetric and feasible intrusion detection architectures. Various types of attacks can be detected using a symmetric approach in a real network environment. However, the data distribution of real network traffic is asymmetric. It usually has a large amount of normal traffic and rare attack traffic. Since minority attack samples are very rare, it is a challenge to detect them accurately. So, keeping the data distribution symmetric can improve the detection rate of minority attacks.
When Anderson proposed a network security program in 1980, it was meant to monitor network activity and alert administrators to any suspicious or threatening behavior that went beyond system regulations. Intrusion detection (IDS) is a component of all network security defenses and is available in two main types: traffic anomaly-based IDS and signature-based IDS, depending on the kind of object detected. While signature-based intrusion detection systems look primarily for malicious activity using relevant attack signatures, anomaly-based IDS attempt to model typical user behavior and label any suspicious behavior that deviates from this as anomalous. In brief, intrusion detection systems are essentially a binary and multi-class classification problem composed of explicit classifiers that can distinguish between ordinary traffic and specific types of attacks. A new kind of intrusion detection system called hybrid IDS has surfaced [2]. It blends anomaly-based and signature-based IDS. The main objective of intrusion detection is ultimately to increase detection accuracy.
At the moment, different attacks are commonly classified using a range of traditional machine learning approaches in order to safeguard network security. On the other hand, traditional machine learning techniques are mostly focused on feature selection and have trouble correctly classifying different kinds of attacks in dynamic network environments. The majority of machine learning methods based on shallow learning are not suitable for handling high-dimensional prediction problems with large datasets, as the size of the dataset reduces the accuracy of multi-class classification. The more complex the model, the more hidden layers in the neural network, the more expansive the model parameters, and the larger the dataset, the better the experimental results. Deep learning therefore holds great potential for developing learning models that are more adept at extracting characteristics from datasets. With the increasing popularity of artificial intelligence and cybersecurity, more researchers are examining ways to use the advantages of deep learning in traffic classification jobs to improve classification outcomes.
1.2. The Contribution of the Work in this Paper
Since there is a large amount of normal traffic as well as rare attack traffic in real network traffic, with this asymmetric data distribution, it is very difficult to accurately detect the rare attack traffic. In the paper, a method is designed to solve the problem of asymmetric data distribution. Generate minority attack samples by using generative adversarial networks (GAN). Adding minority attack samples can solve the problem of asymmetric data distribution. Meanwhile, the method extracts features symmetrically from two perspectives using a multimodal approach. In brief, the method uses a symmetric approach to learn the features of minority attacks. The primary contributions of this proposed approach are as follows:
- A novel high-performance multimodal deep learning method is designed to address the low detection rate of minority attacks. The method consists of a generative adversarial network, a one-dimensional convolutional neural network, and a gated recurrent unit, called GOCG;
- A deep learning method based on multi-perspective learning is designed, and multi-class classification of minority attacks is performed using integrated classifiers;
- Achieved high performance in all metrics on the CICIDS 2017 and the NSL-KDD datasets. The strategy in this paper achieves better experimental results compared to the state-of-the-art.
The remaining structure of the paper is as follows: Section 2 describes the advanced work in the field of intrusion detection. Section 3 describes in detail the structure of each part of the model. Section 4 outlines the dataset used, hyperparameter settings, and evaluation metrics. Section 5 analyzes and discusses the experimental results. Section 6 summarizes the work of this paper.
2. Related Work
In this section, recent advances in intrusion detection techniques are highlighted. Trials in this field of study have demonstrated good results from the application of several deep learning approaches to intrusion detection [3,4,5,6,7,8,9,10,11,12]. Meanwhile, machine learning models tuned by meta-heuristic algorithms have also achieved good performance [13,14,15]. These methods include autoencoders, recurrent neural networks, convolutional neural networks, generative adversarial networks, long-short-term memory networks, etc. [16,17,18,19,20,21,22,23,24,25]. Long-short-term memory (LSTM) and gated recurrent units (GRU) are two types of recurrent neural networks (RNNs) that are employed in the [26] innovative intrusion detection system (IDS) framework to solve the challenges caused by unbalanced data. The authors also developed a novel feature selection method for XGBoost and evaluated it on two datasets. With 88.13% and 87.07% for binary classification and 86.93% and 78.40% for multiclass classification, the test results demonstrated good accuracy. This indicates that the proposed approach might be helpful in locating intrusions.
For an improved intrusion detection system, Pingale and Sutar presented a hybrid deep learning model using the Remora Whale optimization (RWO) algorithm. Convolutional neural networks (CNNs) are used in the suggested model to extract features, transform data, and preprocess the data, among other procedures. Next, a deep-maxout network and a deep auto-encoder are incorporated into the system to identify intrusions. The two halves of the RWO algorithm are the Whale optimization algorithm (WOA) and the Remora optimization algorithm (ROA). The testing results demonstrated exceptional accuracy, with a reported accuracy level of 93.80, underscoring the potential of this novel intrusion detection method [27]. To improve data accuracy, Min offers a new intrusion detection system (IDS) model that makes use of the memory augmented depth autoencoder (MemAE). To improve performance, the proposed MemAE approach incorporates a memory module between the encoder and decoder that learns and retains the prototype patterns of the input data. The effectiveness of the proposed technique in accurately identifying network intrusions is demonstrated by its better performance on three datasets in comparison to other existing models [28].
Maseer provided an analysis and description of ten machine learning (ML) methods for anomalous IDS (AIDS). Several popular techniques are employed by these algorithms, such as decision trees (DT), K-NN, and naive Bayes (NB). The results show that, out of all the algorithms examined, K-NN, DT, and NB perform at the highest levels [29]. A novel hybrid approach dubbed DiFF-RF, which combines randomly dividing binary trees, was proposed by Marteau. To solve a number of issues, they employed a semi-supervised methodology. To gauge the strategy’s effectiveness, they ran it over five different datasets. According to the experimental findings, the recommended approach is quite successful and produces favorable outcomes [30].
A four-deep learning model and an enhanced multi-class classification intrusion detection model (EIDM) were introduced by Elnakib. In this model, each classifier is assigned to a certain data class. In terms of detecting and classifying intrusions, the system attained a multi-class classification accuracy rate of 95% [31]. Abbas investigated a decision tree, logistic regression, and naive Bayes as the three components of an integration-based intrusion detection model. A voting classifier is used for classification in logistic regression. In multi-class classification, it successfully detected and categorized invasions with an accuracy of 88.96% [32].
For the first time, Sohi was able to identify complex patterns in attacks and create variants and matching attacks using recurrent neural networks (RNNs). Results from experiments demonstrate that the suggested strategy greatly raises the detection rate, demonstrating RNNs’ ability to identify intricate attack patterns [33]. Liu presented a new IDS model that uses LightGBM in conjunction with adaptive synthesis (ADASYN) oversampling techniques to address the issue of unbalanced data. The temporal complexity was further lowered by combining the learning model with LightGBM and employing ADASYN to oversample the minority class samples. Based on three datasets, the experimental results demonstrate a significant improvement in the accuracy of minority classes. The approach reduces time complexity and increases accuracy, demonstrating its potential in practical security scenarios [34].
A support vector machine (SVM) classifier and a naive Bayes feature transformation process make up Gu and Lu’s effective IDS methodology. The features of the dataset are transformed by naive Bayes to create data, which is subsequently classified by the SVM classifier. Based on evaluations on three datasets, the model performs excellently and has high levels of accuracy in spotting and categorizing invasions [35]. Khan developed a convolutional and recurrent neural network deep learning model. By incorporating variables from both spatial and temporal data, this model enhances intrusion detection. By using both CNN and RNN, the model produces results with greater detection performance and accuracy [36].
Gupta used a long-short-term memory (LSTM) classifier with an upgraded one-to-one technique (I-OVO) to create the LIO-IDS. There are two sections to the model. While the second half uses I-OVO and oversampling to improve a limited selection of data classes prior to multi-class classification, the first part uses LSTM for binary classification. Three datasets were used in the studies, and the model showed benefits such as quick consumption time and a high detection rate [37]. Araujo-Filho proposed an intrusion detection system based on a generative adversarial network (GAN) to identify any suspicious network behavior. The model integrates temporal convolutional networks (TCNs) with self-attention mechanisms. The outcomes demonstrate the GAN-based IDS’s effectiveness with a remarkable 97.07% accuracy rate [38].
The two main components of the Synthetic Attack Data Model were introduced by Kumar and Sinha. We employ the Was-Serstein conditional generative adversarial network (WCGAN) as the initial stage of the data production process. The generated data are then classified using the XGBoost classifier. The model performs exceptionally well on binary classification tests, suggesting that more precise modeling of attack data could lead to improved intrusion detection systems [39]. Yuan examined the B-GAN data balancing technique, which is based on a generative adversarial network (GAN). The technique balances the distribution of classes in the dataset and produces high-quality attack data by using long-short-term memory (LSTM) on both the generator and discriminator. The results showed the effectiveness of the B-GAN approach and its potential to improve intrusion detection systems’ performance [40].
The use of modified conditional generative adversarial networks (MCGAN) for intrusion detection was investigated by Babu and Rao. Bidirectional long-short-term memory (Bi-LSTM) is incorporated into the method for multiclass classification. The experimental study shows that combining these two methods results in an astounding 95.16% classification accuracy, indicating the possibility of improving intrusion detection accuracy [41]. Donko looked into an intrusion detection system technique based on enhanced long-short-term memory (ELSTM) and recurrent neural networks (RNN). They discovered intriguing findings after testing the approach on four distinct datasets [42].
Three distinct models were proposed by Altunay and Albayrak. These models consist of three components: CNN, CNN+LSTM, and long-short-term memory (LSTM). The best model among them is the hybrid CNN+LSTM model [43]. A revolutionary classification methodology was proposed by Han and Pak. Data processing is carried out via hierarchical long-short-term memory. By using this method, the rate of detection is greatly increased [44]. The SAnDT architecture (anomaly detector) was studied by Zavrak and Iskefiyeli. The newly constructed replicator neural networks are compared with EncDecAD, a kind of LSTM, in order to increase detection accuracy [45].
Data imbalance is a common feature of realistic, complex network systems; there are plenty of data samples for majority-class attacks and routine traffic but few examples for minority-class attacks. Due to their incapacity to comprehend the characteristics of minority attack classes, traditional NIDS models have poor detection accuracy and even fail to identify attacks using minority-class sample attacks, jeopardizing network security [46].
The above-mentioned methods, despite the proposed solutions, still have the problem of handling data imbalances. Some approaches perform well on specific datasets but may perform differently on different datasets; thus, further validation and experiments are needed. Traditional NIDS models may struggle to understand a few attack classes, leading to low detection accuracy and potentially jeopardizing network security. The presence of these limitations increases the difficulty of accurately detecting minority attacks.
To address these limitations, this study proposes a multi-modal approach to effectively detecting minority attacks. The method generates minority attack data through a generative adversarial network, thus addressing the limitation of data imbalance. Meanwhile, a designed multimodal framework is used to learn the characteristics of minority attacks from two different perspectives, thus completely understanding all aspects of the attacks. The detection rate of minority attacks has improved. The generalizability of the model is validated using two datasets. Therefore, it is well suited for applications that detect minority attacks.
3. Materials and Methods
The GOCG model proposed by the study incorporates feature extraction, categorization, preprocessing, and expansion of the data. Figure 1 could be a simplified depiction of the overall design of the model. Real-world attack samples are few, which makes detection challenging. In order to improve the accuracy of the model, a small number of attack samples in the training set were supplemented by using a GAN. Data preprocessing methods like redundancy reduction, normalization, and one-hot coding are applied after the improved samples are mixed with the original training dataset. The multimodal training approach is then fed into the preprocessed training set. The retrieved features from the various viewpoints are then combined and sent into the integrated classifier for classification. Lastly, the performance of the model is assessed using the original test set.
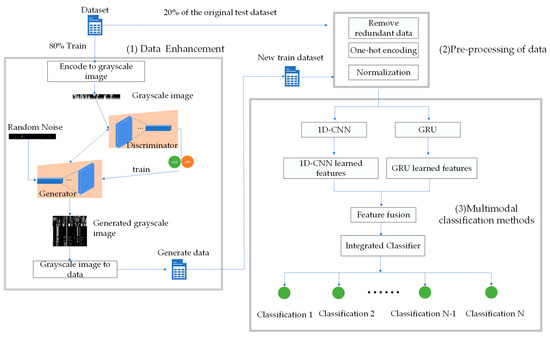
Figure 1.
The proposed GOCG architecture.
3.1. Data Enhancement
Each attack is first utilized in two rows as a group. Each attack’s 2 × 78 or 2 × 41 dimensions are successively transformed into grayscale pictures. After that, the generator and discriminator get input for training. In order to populate the dataset, grayscale images are created and converted into data. A convolutional layer makes up the discriminator model, unfolding two-dimensional matrices of dimensions 2 × 78 and 2 × 41 into 156 and 82, respectively. The convolutional layer, the LeakyReLU activation function, and the sigmoid activation function will all work together to produce a 0 to 1 probability. Unlike traditional ReLU activation functions, the LeakyReLU function uses a small slope when the input is negative. This not only avoids the “neuron death” situation but also provides better sensitivity to the model when the input is negative. It helps to improve the performance and stability of the discriminator. Therefore, the LeakyReLU activation function is used in the discriminator [47]. A deconvolution layer in the generator model receives an 82- or 156-dimensional tensor of random numbers with a Gaussian distribution as input. Then, the Tanh activation function, the ReLU activation function, and the deconvolution layer distribute the generated attack samples between −1 and 1. These methods guarantee the high quality of the attack samples that are created.
Produced attack samples are labeled as 0, whereas real attack samples are labeled as 1. Both true and false data are used to train the discriminator model in order to ascertain the discriminant value. The binary cross-entropy loss is computed using the discriminant value and the true sample label. The Adam optimizer is then used to optimize the result. During generator model training, the discriminant value of the generated attack samples is compared with the true label, which is maintained constant for the discriminator. In order to reduce the loss function, the model’s parameters are adjusted appropriately. Consequently, the discriminator faces increased difficulty in distinguishing between manufactured and real attack samples. Producing incredibly realistic attack samples is the goal achieved by this adversarial training.
Equation (1) displays the loss function used in the method of this paper. In this case, denotes the true distribution of samples, denotes the distribution of generated samples, and represents the mean value. indicates samples generated by the generator, while refers to the probability of correctly classifying a sample as true or false. The GAN’s training pseudocode is displayed in Algorithm 1. Figure 2 depicts the effect of the generated minority sample attack. The minority attack samples generated are used only for this experiment and are not used for any other purpose.

Figure 2.
Generated data effect.
| Algorithm 1 Training GAN |
| Input: Minority class attack samples |
| Output: Generated data |
| for G (Generator) |
| 2: Each iteration: |
| } |
| } |
| } |
| 6: Back propagation calculates the gradients of D, G |
| ) |
| ) |
| 9: Optimize the loss of D, G with Adam optimizer |
| 10: When the discriminator determines that the generated sample is true, the generated data are output |
3.2. Data Preprocessing
In this section, in order to improve the distribution of the dataset, it is first necessary to remove redundant data. Just the labels are not of a numeric type out of the 79 features in the CICIDS2017 dataset. The label encoder encodes the labels for one-hot encoding to perform the multiclass classification task. A dataset containing five categories is used in this paper. The encoded labels are [1,0,0,0,0], [0,1,0,0,0], [0,0,1,0,0], [0,0,0,1,0], and [0,0,0,0,1]. As with the above operation, convert the character data of the NSL-KDD dataset to numeric data.
When a sample’s feature values show a wide range, it can be difficult to perform effective training because some features with higher values might dominate others. To solve this problem, logarithmic scaling is applied to the features with significant differences, and then all feature values are normalized to be in the appropriate range using Equation (2). is denoted as the ith feature. denotes the minimum value of the ith feature. denotes the maximum value of the ith feature.
3.3. Feature Extraction and Classification
There are two components to this phase. In the first phase, a one-dimensional convolutional neural network (1DCNN) and gated recurrent unit (GRU) are used to learn the features of a few attacks from two angles. The features acquired from these two viewpoints are then combined, and the combined vectors are fed into the integrated classifier. Specifically, an integrated classifier that combines decision trees, naive Bayes, random forests, multilayer perceptron, and support vector machines is used for multi-class classification in the second section. Figure 3 depicts this phase’s organizational structure. The strategy for multimodality training is described in Algorithm 2. In this algorithm, represents the fused feature vector, represents the ith data in the dataset X, and denotes its corresponding grayscale image. represents its predicted value. and represent the loss value and gradient of 1DCNN, respectively. represents the learned feature vector of 1DCNN. represents the predicted value obtained through GRU forward propagation. and represent the loss value and gradient of the GRU, respectively, while represents the learned feature vector of the GRU.
| Algorithm 2 Training multimodal methods |
| Input: dataset X |
| 1: Data preprocessing: removing redundant data, One-hot coding, and normalization |
| 3: Circulation |
| 4: for number of epochs learned do |
| 7: gradient descent |
| 8: end for |
| 9: Until the loss function converges |
| 11: Circulation |
| 12: for number of epochs learned do |
| 13: for mini-batch quantities do |
| 16: gradient descent |
| 17: end for |
| 18: end for |
| 19: Until the loss function converges |
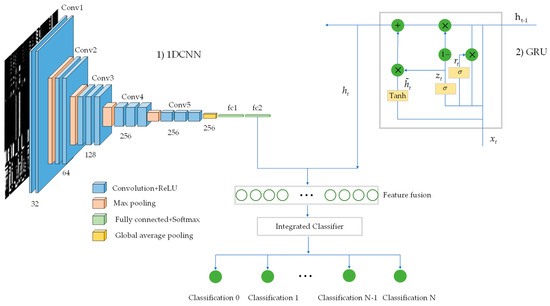
Figure 3.
Structure of the multimodal classification method.
In the multimodal approach, four convolutional layers are used in the constructed one-dimensional convolutional neural network, each of which uses a ReLU activation function. After a few convolutions, the number of channels rises to 64, 128, and 256 from the initial value of 32. Following every convolution, a maximum pooling layer is used. Unlike other techniques, a global average pooling layer is applied following the final convolution to provide improved feature extraction. Following a fully connected layer, the learned features are output and then merged with the features obtained from the gated recurrent unit.
In the gated recurrent unit, the sigmoid activation function () is applied, with representing the input at the current moment and denoting the output of the hidden layer at the previous moment. The weight matrices from the input layer to the hidden layer for the update gate and the reset gate are represented by and , while and denote the weight matrices between the hidden layers for the update gate and the reset gate. Additionally, and represent the deviation vectors of the update gate and the reset gate, respectively. denotes the weight matrix of the current memory content, denotes the weight matrix between the hidden layers of the current memory content, and b is the deviation vector of the current memory content. The Hadamard product is denoted by . The update gate is illustrated in Equation (3).
The reset gate () is represented in Equation (4)
The current memory content () is expressed in Equation (5).
The final memorized content () is expressed as in Equation (6).
Equation (7) shows the loss function for multi-class classification. Where is the number of samples, is the number of multiclass classifications, is the true value of the kth class of the ith input, and is the predicted value of the kth class of the ith input. n denotes the total number of samples.
Algorithm 3 outlines the method for training the integrated classifier, where represents the classification result, C represents the number of classifiers, and represents the predicted value of the fused features. denotes the fused feature vector.
| Algorithm 3 Training the Integrated Classifier |
| 1: Circulation |
| 2: for C = 1 in rang(1,6) |
| 4: backpropagation calculates the gradient and loss values |
| 5: gradient descent |
| 6: end for |
| 7: Until the loss function converges |
4. Experiments
In this study, experiments were conducted primarily on a personal laptop, the ASUS TUF Gaming A15. The personal computer configuration is the Windows 10 operating system, AMD Ryzen 7 6800H @ 3.20 GHz, 16 GB of RAM, accelerated with a GeForce RTX 3060 laptop GPU.
4.1. Dataset Description and Design
In this work, the training and testing phases were conducted using the CICIDS2017 dataset. In 2018, the CICIDS2017 dataset was first made accessible [48]. This CICIDS2017 dataset includes both classic and modern attacks. With the use of attack profiles that programmers have constructed to mimic the real network environment, the CICIDS2017 dataset injects attack scenarios to simulate a week’s worth of network activity. The dataset has 79 features in total (including labels), such as flow time, the number of forward packets, the number of reverse packets, the total size of forward packets, etc. The complete dataset’s information is shown in Table 1.

Table 1.
CICIDS2017 dataset.
In this dataset, in order to evaluate the performance of the model in consistently identifying specific types of sample attacks, in this paper, 10,000 samples were randomly selected from a huge amount of normal traffic data. Consequently, 10,000 data samples from the dataset were used, with 20% set aside for testing and the remaining 80% for training. The four attack types of sparse incidence and the dataset’s unequal distribution provide examples of how data distribution in a real network environment is more like an analogous system. Table 2 shows the enhanced CICIDS2017 dataset used.
Table 2.
Enhanced CICIDS2017 dataset.
Since 2009, the NSL-KDD dataset has been extensively utilized in intrusion detection research. Some of the shortcomings of earlier datasets are addressed. Each of the two testing sets (KDDTest+ and KDDTest-21) and the training set (KDDTrain+) comprises forty-three features, including label and score classes. For further details on the dataset, see Table 3. In this paper, the U2R category is chosen, and each of its attack categories is used to train and test the model in order to minimize the overall number of attack categories. Table 4 shows the enhanced NSL-KDD dataset used.
Table 3.
NSL-KDD dataset.
Table 4.
Enhanced NSL-KDD dataset.
External validity, i.e., generalizability, In the experiment, two datasets are used. By using different datasets, we can verify the generalization ability of the model. Experiments on different datasets gave similar results. This proves that the method in this paper has good generalization. The aim of the experiments is to accurately detect a few attacks, so both datasets use the least number of attacks. The other attack samples are larger in number, so they are not considered to be used.
4.2. Model Hyperparameters
This section presents the model’s optimal hyperparameters, which were determined after an extensive amount of experimentation. It is easy for researchers to read and replicate the work in this paper. Therefore, this paper will not explain in detail here how to change the parameters of the model. The optimal hyperparameters are presented in three parts.
4.2.1. Hyperparameters of the Data Enhancement Section
Six convolutional layers make up the discriminator. BatchNorm and LeakyReLU activations come after each convolution, and sigmoid activation is used in the final convolution. Binary cross-entropy loss is used in the loss function, and it is optimized using the Adam optimizer with the following parameters: beta1 = 0.5, beta2 = 0.999, and a learning rate of 0.0003 over 300 epochs with a batch size of 128.
The generator is made up of six deconvolution layers. Tanh activation is used for the final deconvolution after BatchNorm and ReLU activations for each layer. The loss function, which also makes use of binary cross-entropy loss, is optimized using the Adam optimizer across 300 epochs with a batch size of 128 and beta1 and beta2 set to 0.5 and 0.999, respectively.
4.2.2. Hyperparameters for Feature Extraction Part
One-dimensional convolutional neural networks and gated recurrent units are the main components of multimodal approaches. There are four convolutional layers in the one-dimensional convolutional neural network, and each one uses the ReLU activation function. After every convolution, features are extracted using a maximum pooling layer with a dropout set to 0.5. The fully connected layer employs the Softmax activation function, and a global average pooling layer is applied after the final convolution. The RMSProp optimizer is used to optimize the loss, and sparse categorical crossentropy is used in the loss function. With 32 batches, the model is trained across 100 epochs.
For gated recurrent units, the sigmoid activation function is employed at the input layer. With 80 nodes and a dropout of 0.2, all three hidden layers use the ReLU activation function. The activation function Softmax is used in the last layer. Using categorical crossentropy as the loss function, the loss is minimized using the Adam optimizer. With a 32-person batch size, training is carried out over 100 epochs.
4.2.3. Hyperparameters for the Classification Part
The ensemble classifier includes naive Bayes, decision trees, random forests, support vector machines, and multilayer perceptrons.
With an initial learning rate of 0.0005, the multilayer perceptron makes use of the Adam optimizer and the ReLU activation function. With 42 being the random state, 2000 is the maximum number of iterations that can be carried out. With the decision tree, the maximum depth is restricted to three, and the criterion is set to entropy. The remaining parameters are left at their default settings. The random forest’s estimators are set to 100, and the default values are applied to the remaining parameters. The other parameters for the support vector machine are set to their default values, and the random state is set to 1. Naive Bayes makes use of default settings.
4.3. Evaluation Measures
In the experiment, accuracy is used to assess the ability of the model to predict the data. The leakage rate and false alarm rate indicate that the model predicts the extent of attack data leakage and false alarms. If the recall is low, it indicates that more attack traffic is predicted as normal traffic. Lower precision indicates that more attack traffic is predicted as normal traffic. F-measure is used to control the balance between the two. When F-measure is higher, the better its model detection capability.
The basic terminology for the assessment measures needed to evaluate the methodology in this paper is as follows: “Attack classes” considered to be “attack classes” are called true positives (TP). The “normal classes” that are regarded as “attack classes” are known as false positives (FP). The “normal classes” that are considered “normal classes” are true negatives (TN). “Attack classes” that are taken to be “normal classes” are known as false negatives (FN). Accuracy is defined as the ratio of all projected results (TP + TN + FP + FN) to the correct classifications (TP + TN).
A recall can be defined as the ratio of correctly classified attack classes (TP), correctly classified attack classes (TP), and the number of attack classes classified as normal classes (FN).
The formula for calculating precision is to divide the total number of correctly categorized attack classes (TP) by the total number of normal classes (FP) that were also classified as attack classes.
The F-measure is the most important metric for assessing a model’s performance and striking a balance between recall and precision.
The ratio of samples in the normal class classified as attack class (FP) to all samples in the normal class (FP + TN) is known as the false positive rate (FPR).
The ratio of samples in which the attack class is classified as belonging to the normal class (FN) to the total number of samples in the attack class (FN + TP) is known as the false negative rate, or FNR.
5. Results and Discussion
There are three parts in this section. The GOCG method’s experimental results are presented in the first section, which also provides a thorough analysis of its performance using a variety of assessment criteria. While an ablation experiment is carried out in the third section, the second portion compares the most recent state-of-the-art techniques.
5.1. Analysis of Experimental Results
Table 5 and Table 6 illustrate the performance of detecting a small number of attacks on the two datasets, respectively. Additionally, Table 7 and Table 8 represent the false alarm rate and the leakage alarm rate for detecting a few attacks on the two datasets, respectively. The experimental results show that the method in this paper has strong performance and stability.
Table 5.
Detection performance of a few attacks on NSL-KDD dataset.
Table 6.
Detection performance of a few attacks on CICIDS2017 dataset.
Table 7.
False alarm and leakage rates on the NSL-KDD dataset.
Table 8.
False alarm and leakage rates on the CICIDS2017 dataset.
5.1.1. Analysis of Accuracy Results
It is found that the detection accuracy of various minority attacks in the NSL-KDD dataset is more than 99.90%. This shows that the method in this paper can adequately extract complex features from this dataset, thus improving the classification accuracy. On the other hand, in the CICIDS2017 dataset, it turned out that the overall accuracy was found to be more than 98.30%. In conclusion, the method in this paper has excellent overall accuracy and robustness.
5.1.2. Analysis of Precision Results
The total precision of the technique in this paper is more than 99.80% in the NSL-KDD dataset, which shows its ability to precisely detect minority attacks. Given the low precision of these attacks, the CICIDS 2017 dataset demonstrates that there is still room for improvement in the detection of SQL injection attacks. However, the method in this paper shows higher precision in detecting the class of minority attacks and is able to identify residual minority attacks with excellent precision.
5.1.3. Analysis of Recall Results
Incredible recall results were found on both datasets. The method in this paper can accurately detect attacks after learning from multiple perspectives. This shows that the method in this paper has excellent detection capability and stability, and the model performs well in detecting a small number of attacks.
5.1.4. Analysis of F-Measure Results
An important parameter for evaluating the effectiveness of a model is the F-measure, and the method in this paper achieves a good F-measure on both datasets, indicating that it can effectively identify a small number of attacks. This proves that the method in this paper has strong feature extraction and classification capabilities.
5.1.5. Analysis of FPR Results
The false alarm rate is particularly important for identifying a small number of attacks, since techniques with low false alarm rates can greatly reduce the workload for all parties concerned and accurately represent the model’s ability to identify such attacks. When comparing the results of the two datasets, it was found that the highest false alarm rate was only 3.4% and the lowest false alarm rate was 0%. Such a low false alarm rate not only indicates that the methodology of this paper is very effective but also greatly reduces the workload of the relevant staff.
5.1.6. Analysis of FNR Results
The leakage rate serves as a gauge of the model’s ability to identify these attacks. A lower leakage rate signifies that the model is more comprehensive in recognizing and avoiding the omission of certain attacks. Analysis of both datasets shows that many attacks have a 0% leakage rate. This situation illustrates the model’s ability to fully detect minority attacks.
5.2. Comparative Analysis of Different Methods
Table 9 shows the results of comparing the method of this paper with other state-of-the-art research methods, indicating that the method of this paper outperforms the state-of-the-art methods in terms of accuracy, precision, recall, and F-measure. Compared to the lowest accuracy of 86%, the technique in this paper significantly improves by about 13%. In addition, the technique in this paper still outperforms the best accuracy of 97.07% by about 2%. Similarly, in terms of precision, the method in this paper improves about 36% over the lowest precision of 63% and almost 2.9% over the highest pre-precision of 97.05%. In addition, the recall of this paper is improved by about 28% compared to the minimum recall of 71.75% and almost 2.9% compared to the maximum recall of 97.01%. Finally, compared with the minimum F-measure of 66.5%, the method in this paper shows significant improvement in the F-measure by about 33%, and, compared with the maximum F-measure of 97.07%, the method in this paper shows improvement by about 2.8%.
Table 9.
Comparative study.
The comparative results show that the method in this paper outperforms the state-of-the-art methods and improves the overall performance.
5.3. Ablation Experiment Analysis
To investigate the impact of each component of the GOCG model, ablation experiments were conducted in this paper, focusing on the following aspects:
- Classification Layer: Using only gated recurrent units for feature learning and integrated classifier classification, a few attack detections without data augmentation were first evaluated. This method is known as GRU;
- Classification layer following data augmentation: Data augmentation is performed by using a generative adversarial network. After that, the augmented data were fed into the gated recurrent unit for training, and an integrated classifier was used for classification. This method is known as GAN+GRU;
- Multimodal approach following data augmentation: following training dataset augmentation, the multimodal approach learns features from both the 1DCNN and GRU perspectives before classifying the results using an integrated classifier. The notation for this approach is GAN+GRU+1DCNN.
Figure 4 and Figure 5 show the outcomes of the ablation experiments conducted on the two datasets, respectively. Figure 4 shows improvements in a few assessment parameters, indicating that the GAN+GRU approach works better than GRU. The Web Attack-XSS attack, for example, shows improvements in accuracy of 7.64%, F-measure of 4.14%, and recall of 7.64%. This demonstrates the ability of enhanced attack data to improve model learning. Additionally, the multimodal technique improves the model’s learning capacity even more, demonstrating a continuous improvement in overall performance after feature extraction by the multimodal approach. The SQL injection attack shows a slight decline in precision (3.4%), but the other indicators show progress, suggesting steady performance. This highlights that the multimodal approach not only relies on features learned by GRU but also leverages features learned by 1DCNN, resulting in a more robust performance.
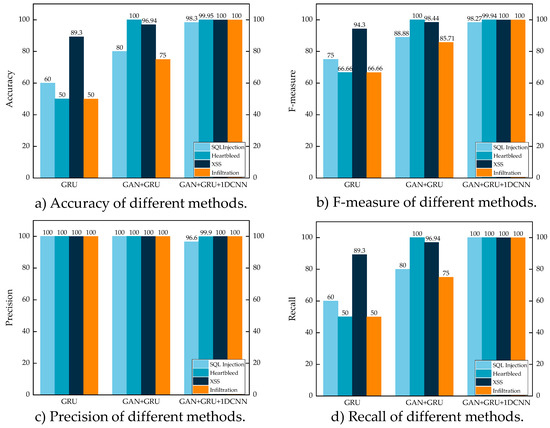
Figure 4.
Ablation experiments on the CICIDS2017 dataset.
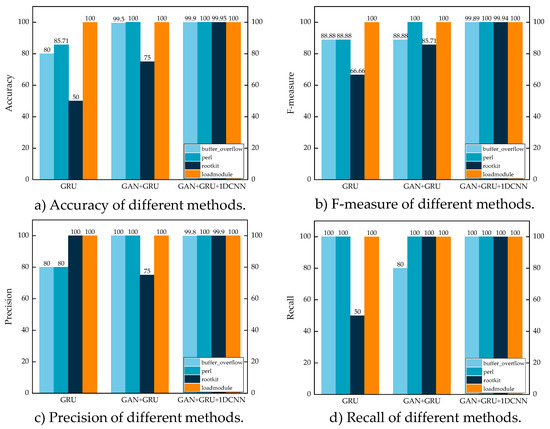
Figure 5.
Ablation experiments on the NSK-KDD dataset.
As seen in Figure 5, the GAN+GRU approach continues to perform better than GRU, greatly increasing the accuracy of a few attacks and increasing rootkit accuracy by about 25%. The F-measure likewise shows a trend of progressive development; the rootkit attack shows the greatest increase, increasing by 19.05%. The rootkit attack’s precision initially decreases, but after using the multimodal technique, it greatly improves. This demonstrates how the model can accurately classify attacks by thoroughly learning their characteristics from various angles.
6. Conclusions
In this paper, a multi-modal approach is developed to effectively identify minority attacks. A generative adversarial network is used to enlarge the training set, and the enlarged dataset is then preprocessed. The multimodal approach is then used to extract features from two perspectives from the preprocessed data. An integrated classifier receives this combined, extracted information as input for classification. The original data are fed into the trained model for categorization to test the model.
The proposed GOCG approach can detect a few classes of attacks with a low false alarm rate, according to the experimental results on the CICIDS2017 and NSL-KDD datasets. In terms of accuracy, precision, recall, and F-measure, it is compared with the most recent studies. By comparison, the method in this paper performs better than the state-of-the-art method.
Although the GOCG method can be effective in detecting minority attacks, there are still some limitations. First, the dataset used in the experiments is a public dataset and does not capture data from real network traffic for the experiments. Second, the designed method does not explore the ability to detect unknown attacks. Finally, due to the large dimension of the features after feature fusion, it increases the difficulty of the classification of the classifier.
In future work, this paper will provide the following researchable directions:
- Further explore a multimodal approach for detecting zero-day attacks;
- Conduct experiments using real network traffic data;
- Research on better multimodal techniques in real network detection scenarios;
- Dimensionality reduction using principal component analysis.
Author Contributions
Conceptualization, methodology, validation, and writing, L.Y. and L.X.; Conceptualization, Data curation, Formal analysis, X.J.; Supervision, funding acquisition, and review, L.Y., L.X. and X.J. All authors have read and agreed to the published version of the manuscript.
Funding
This research was funded by the Project of Key Research and Development Program of Anhui Province, grant number 202104d07020010 and the China National Natural Science Foundation, grant number 61572034.
Institutional Review Board Statement
Not applicable.
Informed Consent Statement
Not applicable.
Data Availability Statement
All datasets are available in the mentioned references.
Acknowledgments
Our thanks to the above projects for their support.
Conflicts of Interest
The authors declare no conflicts of interest.
References
- Papadimitriou, F. A nexus of Cyber-Geography and Cyber-Psychology: Topos/“Notopia” and identity in hacking. Comput. Hum. Behav. 2009, 25, 1331–1334. [Google Scholar] [CrossRef]
- Mishra, P.; Varadharajan, V.; Tupakula, U.; Pilli, E.S. A detailed investigation and analysis of using machine learning techniques for intrusion detection. IEEE Commun. Surv. Tutor. 2018, 21, 686–728. [Google Scholar] [CrossRef]
- Lansky, J.; Ali, S.; Mohammadi, M.; Majeed, M.K.; Karim, S.H.T.; Rashidi, S.; Hosseinzadeh, M.; Rahmani, A.M. Deep learning-based intrusion detection systems: A systematic review. IEEE Access 2021, 9, 101574–101599. [Google Scholar] [CrossRef]
- Feng, F.; Li, K.-C.; Shen, J.; Zhou, Q.; Yang, X. Using cost-sensitive learning and feature selection algorithms to improve the performance of imbalanced classification. IEEE Access 2020, 8, 69979–69996. [Google Scholar] [CrossRef]
- Zhang, H.; Huang, L.; Wu, C.Q.; Li, Z. An effective convolutional neural network based on SMOTE and Gaussian mixture model for intrusion detection in imbalanced dataset. Comput. Netw. 2020, 177, 107315. [Google Scholar] [CrossRef]
- Chuang, P.-J.; Wu, D.-Y. Applying deep learning to balancing network intrusion detection datasets. In Proceedings of the 2019 IEEE 11th International Conference on Advanced Infocomm Technology (ICAIT), Jinan, China, 18–20 October 2019; pp. 213–217. [Google Scholar]
- Louati, F.; Ktata, F.B. A deep learning-based multi-agent system for intrusion detection. SN Appl. Sci. 2020, 2, 675. [Google Scholar] [CrossRef]
- Wang, Z.; Liu, Y.; He, D.; Chan, S. Intrusion detection methods based on integrated deep learning model. Comput. Secur. 2021, 103, 102177. [Google Scholar] [CrossRef]
- Tama, B.A.; Rhee, K.-H. HFSTE: Hybrid feature selections and tree-based classifiers ensemble for intrusion detection system. IEICE Trans. Inf. Syst. 2017, 100, 1729–1737. [Google Scholar] [CrossRef]
- Peng, W.; Kong, X.; Peng, G.; Li, X.; Wang, Z. Network intrusion detection based on deep learning. In Proceedings of the 2019 International Conference on Communications, Information System and Computer Engineering (CISCE), Haikou, China, 5–7 July 2019; pp. 431–435. [Google Scholar]
- Salama, M.A.; Eid, H.F.; Ramadan, R.A.; Darwish, A.; Hassanien, A.E. Hybrid intelligent intrusion detection scheme. In Soft Computing in Industrial Applications; Springer: Berlin/Heidelberg, Germany, 2011; pp. 293–303. [Google Scholar]
- Mehmood, M.; Javed, T.; Nebhen, J.; Abbas, S.; Abid, R.; Bojja, G.R.; Rizwan, M. A hybrid approach for network intrusion detection. CMC-Comput. Mater. Contin 2022, 70, 91–107. [Google Scholar] [CrossRef]
- Savanović, N.; Toskovic, A.; Petrovic, A.; Zivkovic, M.; Damaševičius, R.; Jovanovic, L.; Bacanin, N.; Nikolic, B. Intrusion Detection in Healthcare 4.0 Internet of Things Systems via Metaheuristics Optimized Machine Learning. Sustainability 2023, 15, 12563. [Google Scholar] [CrossRef]
- Malibari, A.A.; Alotaibi, S.S.; Alshahrani, R.; Dhahbi, S.; Alabdan, R.; Al-wesabi, F.N.; Hilal, A.M. A novel metaheuristics with deep learning enabled intrusion detection system for secured smart environment. Sustain. Energy Technol. Assess. 2022, 52, 102312. [Google Scholar] [CrossRef]
- Saif, S.; Das, P.; Biswas, S.; Khari, M.; Shanmuganathan, V. HIIDS: Hybrid intelligent intrusion detection system empowered with machine learning and metaheuristic algorithms for application in IoT based healthcare. Microprocess. Microsyst. 2022, 104622. [Google Scholar] [CrossRef]
- Chalé, M.; Bastian, N.D. Generating realistic cyber data for training and evaluating machine learning classifiers for network intrusion detection systems. Expert Syst. Appl. 2022, 207, 117936. [Google Scholar] [CrossRef]
- Thakkar, A.; Lohiya, R. Fusion of statistical importance for feature selection in Deep Neural Network-based Intrusion Detection System. Inf. Fusion 2023, 90, 353–363. [Google Scholar] [CrossRef]
- Ho, S.; Al Jufout, S.; Dajani, K.; Mozumdar, M. A novel intrusion detection model for detecting known and innovative cyberattacks using convolutional neural network. IEEE Open J. Comput. Soc. 2021, 2, 14–25. [Google Scholar] [CrossRef]
- Andresini, G.; Appice, A.; De Rose, L.; Malerba, D. GAN augmentation to deal with imbalance in imaging-based intrusion detection. Future Gener. Comput. Syst. 2021, 123, 108–127. [Google Scholar] [CrossRef]
- Alqahtani, A.S. FSO-LSTM IDS: Hybrid optimized and ensembled deep-learning network-based intrusion detection system for smart networks. J. Supercomput. 2022, 78, 9438–9455. [Google Scholar] [CrossRef]
- Yin, C.; Zhu, Y.; Fei, J.; He, X. A deep learning approach for intrusion detection using recurrent neural networks. IEEE Access 2017, 5, 21954–21961. [Google Scholar] [CrossRef]
- Moizuddin, M.; Jose, M.V. A bio-inspired hybrid deep learning model for network intrusion detection. Knowl.-Based Syst. 2022, 238, 107894. [Google Scholar] [CrossRef]
- Muhammad, A.R.; Sukarno, P.; Wardana, A.A. Integrated Security Information and Event Management (SIEM) with Intrusion Detection System (IDS) for Live Analysis based on Machine Learning. Procedia Comput. Sci. 2023, 217, 1406–1415. [Google Scholar] [CrossRef]
- Daoud, M.A.; Dahmani, Y.; Bendaoud, M.; Ouared, A.; Ahmed, H. Convolutional neural network-based high-precision and speed detection system on CIDDS-001. Data Knowl. Eng. 2023, 144, 102130. [Google Scholar] [CrossRef]
- Nayyar, S.; Arora, S.; Singh, M. Recurrent neural network based intrusion detection system. In Proceedings of the 2020 International Conference on Communication and Signal Processing (ICCSP), Melmaruvathur, India, 28–30 July 2020; pp. 0136–0140. [Google Scholar]
- Kasongo, S.M. A deep learning technique for intrusion detection system using a Recurrent Neural Networks based framework. Comput. Commun. 2023, 199, 113–125. [Google Scholar] [CrossRef]
- Pingale, S.V.; Sutar, S.R. Remora whale optimization-based hybrid deep learning for network intrusion detection using CNN features. Expert Syst. Appl. 2022, 210, 118476. [Google Scholar] [CrossRef]
- Min, B.; Yoo, J.; Kim, S.; Shin, D.; Shin, D. Network anomaly detection using memory-augmented deep autoencoder. IEEE Access 2021, 9, 104695–104706. [Google Scholar] [CrossRef]
- Maseer, Z.K.; Yusof, R.; Bahaman, N.; Mostafa, S.A.; Foozy, C.F.M. Benchmarking of machine learning for anomaly based intrusion detection systems in the CICIDS2017 dataset. IEEE Access 2021, 9, 22351–22370. [Google Scholar] [CrossRef]
- Marteau, P.-F. Random partitioning forest for point-wise and collective anomaly detection—Application to network intrusion detection. IEEE Trans. Inf. Forensics Secur. 2021, 16, 2157–2172. [Google Scholar] [CrossRef]
- Elnakib, O.; Shaaban, E.; Mahmoud, M.; Emara, K. EIDM: Deep learning model for IoT intrusion detection systems. J. Supercomput. 2023, 79, 13241–13261. [Google Scholar] [CrossRef]
- Abbas, A.; Khan, M.A.; Latif, S.; Ajaz, M.; Shah, A.A.; Ahmad, J. A New Ensemble-Based Intrusion Detection System for Internet of Things. Arab. J. Sci. Eng. 2022, 47, 1805–1819. [Google Scholar] [CrossRef]
- Sohi, S.M.; Seifert, J.-P.; Ganji, F. RNNIDS: Enhancing network intrusion detection systems through deep learning. Comput. Secur. 2021, 102, 102151. [Google Scholar] [CrossRef]
- Liu, J.; Gao, Y.; Hu, F. A fast network intrusion detection system using adaptive synthetic oversampling and LightGBM. Comput. Secur. 2021, 106, 102289. [Google Scholar] [CrossRef]
- Gu, J.; Lu, S. An effective intrusion detection approach using SVM with naïve Bayes feature embedding. Comput. Secur. 2021, 103, 102158. [Google Scholar] [CrossRef]
- Khan, M.A. HCRNNIDS: Hybrid convolutional recurrent neural network-based network intrusion detection system. Processes 2021, 9, 834. [Google Scholar] [CrossRef]
- Gupta, N.; Jindal, V.; Bedi, P. LIO-IDS: Handling class imbalance using LSTM and improved one-vs-one technique in intrusion detection system. Comput. Netw. 2021, 192, 108076. [Google Scholar] [CrossRef]
- Araujo-Filho, P.F.d.; Naili, M.; Kaddoum, G.; Fapi, E.T.; Zhu, Z. Unsupervised GAN-Based Intrusion Detection System Using Temporal Convolutional Networks and Self-Attention. IEEE Trans. Netw. Serv. Manag. 2023, 20, 4951–4963. [Google Scholar] [CrossRef]
- Kumar, V.; Sinha, D. Synthetic attack data generation model applying generative adversarial network for intrusion detection. Comput. Secur. 2023, 125, 103054. [Google Scholar] [CrossRef]
- Yuan, L.; Yu, S.; Yang, Z.; Duan, M.; Li, K. A data balancing approach based on generative adversarial network. Future Gener. Comput. Syst. 2023, 141, 768–776. [Google Scholar] [CrossRef]
- Babu, K.S.; Rao, Y.N. MCGAN: Modified Conditional Generative Adversarial Network (MCGAN) for Class Imbalance Problems in Network Intrusion Detection System. Appl. Sci. 2023, 13, 2576. [Google Scholar] [CrossRef]
- Donkol, A.A.E.-B.; Hafez, A.G.; Hussein, A.I.; Mabrook, M.M. Optimization of Intrusion Detection Using Likely Point PSO and Enhanced LSTM-RNN Hybrid Technique in Communication Networks. IEEE Access 2023, 11, 9469–9482. [Google Scholar] [CrossRef]
- Altunay, H.C.; Albayrak, Z. A hybrid CNN+ LSTMbased intrusion detection system for industrial IoT networks. Eng. Sci. Technol. Int. J. 2023, 38, 101322. [Google Scholar] [CrossRef]
- Han, J.; Pak, W. Hierarchical LSTM-Based Network Intrusion Detection System Using Hybrid Classification. Appl. Sci. 2023, 13, 3089. [Google Scholar] [CrossRef]
- Zavrak, S.; Iskefiyeli, M. Flow-based intrusion detection on software-defined networks: A multivariate time series anomaly detection approach. Neural Comput. Appl. 2023, 35, 12175–12193. [Google Scholar] [CrossRef]
- Rekha, G.; Tyagi, A.K. Necessary information to know to solve class imbalance problem: From a user’s perspective. In Proceedings of the ICRIC 2019: Recent Innovations in Computing, Jammu, India, 8–9 March 2019; pp. 645–658. [Google Scholar]
- Dubey, A.K.; Jain, V. Comparative Study of Convolution Neural Network’s Relu and Leaky-Relu Activation Functions. In Applications of Computing, Automation and Wireless Systems in Electrical Engineering; Springer: Singapore, 2019; pp. 873–880. [Google Scholar]
- Sharafaldin, I.; Lashkari, A.H.; Ghorbani, A.A. Toward generating a new intrusion detection dataset and intrusion traffic characterization. ICISSp 2018, 1, 108–116. [Google Scholar] [CrossRef]
- Pandey, B.K.; Veeramanickam, M.; Ahmad, S.; Rodriguez, C.; Esenarro, D. ExpSSOA-Deep maxout: Exponential Shuffled shepherd optimization based Deep maxout network for intrusion detection using big data in cloud computing framework. Comput. Secur. 2023, 124, 102975. [Google Scholar] [CrossRef]
Disclaimer/Publisher’s Note: The statements, opinions and data contained in all publications are solely those of the individual author(s) and contributor(s) and not of MDPI and/or the editor(s). MDPI and/or the editor(s) disclaim responsibility for any injury to people or property resulting from any ideas, methods, instructions or products referred to in the content. |
© 2023 by the authors. Licensee MDPI, Basel, Switzerland. This article is an open access article distributed under the terms and conditions of the Creative Commons Attribution (CC BY) license (https://creativecommons.org/licenses/by/4.0/).