Abstract
Supercritical CO2 phase change fracturing technology has been widely used in rock engineering. However, the surface vibration characteristics induced by phase change rock breaking have not been sufficiently studied. In this paper, a model for calculating the surface vibration velocity induced by supercritical CO2 phase change was established based on the time-domain recursive method, and the reliability of the model was verified using LS-DYNA nonlinear finite element software; based on the model for calculating the blasting energy of a compressed gas and water vapor container, the surface vibration velocity and decay law induced by CO2 phase change fracturing and equivalent explosive blasting were compared and analyzed. The results show that the ground vibration velocity calculation model based on the time-domain recurrence method can better evaluate the ground vibration characteristics induced by supercritical CO2 phase change fracturing, and the vibration velocity decays exponentially with the fracture distance; the peak pressure of supercritical CO2 phase change is only 1/3.36 of that of explosive blasting, but the action time is 100 times longer than that of explosive blasting, and the peak vibration velocity is 1/74~1/78 of that of equivalent explosive blasting.
1. Introduction
With the development of water transportation projects, the mainline of the Yangtze River needs to be de-reefed and broken to widen the scale of the channel, for which safe and efficient rock-breaking methods are needed. Traditional explosives have the advantages of economy and high efficiency [1,2]; however, their high risk and high pollution make them subject to strict controls and even bans [3,4]. In contrast, supercritical CO2 phase change rock-breaking technology has received more and more attention in the field of rock-breaking due to the advantages of the spark-free fracturing process and pollution-free phase change products [5,6]. This technology is safer and more environmentally friendly than traditional explosive blasting, because the fracturing process is a physical one [7,8]; this is because the liquid CO2 is instantly vaporized by heating the heat pipe, and the gas inside the pipe expands to form the impact pressure and splitting pressure to break the rock effectively.
The vibration generated by blasting Inevitably affects adjacent buildings and the surrounding environment at different levels, and blasting vibration effects have therefore become an important research topic [9]. In practical engineering, vibration velocity and main vibration frequency are two key indicators of the blasting vibration safety criterion, and some tests have shown that the vibration velocity induced by CO2 phase change fracturing is only 20% of that of explosive blasting [10]. However, there are not many studies on the ground surface vibration law caused by CO2 phase change fracturing, and a corresponding ground surface vibration velocity calculation model has not been established.
Vibration velocity calculation plays a key role in blast vibration control. Previous studies on vibration velocity are mainly based on field vibration monitoring, and the peak particle velocity (PPV) is obtained from the monitoring data and used to characterize the vibration velocity [11]. At present, this research is mainly focused on the field of explosive blasting, and there are few studies on the vibration velocity of supercritical CO2 phase change fracturing. In order to obtain the PPV values, many empirical formulas for the vibration velocity due to explosive blasting have been proposed [12,13]; these are related to the explosive charge and geological conditions, and therefore have some limitations in use. With the rapid development of computer technology, the application of artificial intelligence has been extended to the field of vibration velocity prediction, and corresponding models such as the artificial neural network model, neuro-fuzzy model, and hidden Markov model have been applied to the study of blasting vibration velocity under different environments, one after another; certain application results have been achieved [14,15,16], and these have formed the direction of research concerning supercritical CO2 blasting vibration velocity for the future. At the same time, stress wave propagation theory has also been gradually applied to the field of supercritical CO2 blasting, and existing research methods of this theory mainly include the three basic conservation laws, the characteristic line method, and the displacement discontinuity method [17,18,19]. Li and Ma combined the momentum conservation theory and the displacement discontinuity method, and proposed the time-domain recursive analysis method (TDRM) [20], which avoids complex mathematical operations such as Fourier transform and effectively improves computational efficiency. Scholars have extended this method to analyze the propagation law of different types of stress waves in different rock masses, and fruitful research results have been achieved [21,22]. These reflect the effectiveness of this method, and also provide a good direction for future studies of supercritical CO2 phase change blast vibration velocity.
As mentioned earlier, current methods for calculating the ground vibration velocity mostly use field measurements and empirical formulas, which have certain limitations. In this paper, from the essential mechanism of ground vibration induced by supercritical CO2 phase change, we describe the process of supercritical CO2 blasting stress waves on rock bodies, based on stress wave theory and the time-domain recurrence method, and establish a model to calculate the ground vibration velocity after supercritical CO2 blasting, considering time change. Subsequently, LS-DYNA software was used to simulate the vibration velocity of supercritical CO2 blasting, and the calculation results were compared with the calculation formula of surface vibration velocity, as well as with the equivalent explosive blasting. The results of the study may provide a new calculation method for the calculation of surface vibration velocity induced by supercritical CO2 blasting.
2. Law of Surface Reflection Based on the Time-Domain Recursive Method
Before supercritical CO2 blasting, the fission tube is typically placed inside a pre-drilled hole, and then the hole is sealed for blasting. Figure 1 illustrates the arrangement of the fission tube, with a length of h2. The ground level is situated h1 above the fission tube, while the front represents the critical surface, and the remaining direction corresponds to the infinite rock body. Upon igniting the fission tube for supercritical CO2 blasting, a stress wave, specifically a P-wave, is generated in the rock body due to the impact pressure of the gas. The propagation process of the P-wave produces various effects on the ground surface, forming the basis for studying the velocity of the blasting vibration.
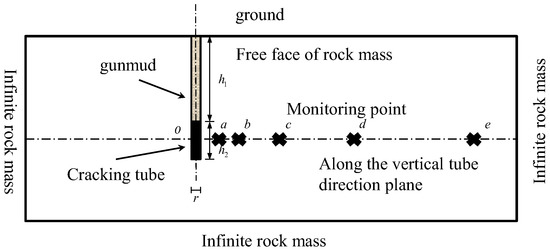
Figure 1.
Front view of the charging arrangement (including the free surface).
2.1. A Generalized Model of the Transmissivity Reflection of the Stress Wave on a Free Surface
Assuming that blasting induces a stress wave in the rock body, this wave propagates as a column surface wave. The fracturing tube’s blasting location is considered a point, from which the stress wave (referred to as the P wave) is emitted to the surrounding area. The P wave can approach the air and ground surfaces at arbitrary angles, and at each point of incidence, it undergoes reflection and generates corresponding transmitted P and S waves, as well as reflected P and S waves.
The distribution of the reflected and incident waves is symmetrical concerning the vertical line of the incident surface, as illustrated in Figure 2. This symmetry enables us to calculate the propagation direction of the reflected wave based on the angle of incidence. The propagation process of the incident P wave at the critical surface can be broadly divided into the following stages:
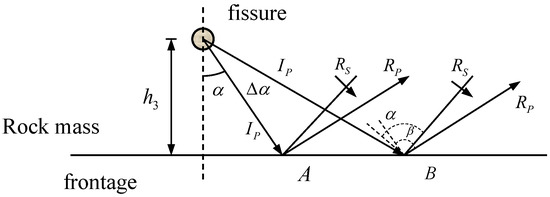
Figure 2.
Stress wave transmittance and reflection diagram at the free surface.
- The bursting of supercritical CO2 causes the emission of a spherical P wave that reaches the critical surface.The P wave undergoes reflection, generating a corresponding surface wave.
- The reflected surface wave propagates to the surface and overlaps and superimposes with the original emitted wave, resulting in surface vibrations.
The reflection angles during the transmission and reflection of stress waves all obey Snell’s theorem, i.e.,:
where Cp and Cs are the P-wave and S-wave velocity, and ν is Poisson’s ratio of intact rock.
2.2. Ground Vibration Velocity Based on the Time-Domain Recursive Method
Aiming to describe the vibration effect caused by a plane P wave on the free surface, the surface wave superposition expression is based on the time-domain recursive method, which states that the particle vibration velocity is equal to the superposition of the body wave reaching this point, and to the second surface wave generated by the velocity difference of all adjacent particles in front of the point, as follows:
where Vn(t) and Vτ(t) are the tangential and normal particle vibration velocities at the measuring point. Vnb(t) and Vτb(t) are the body wave of the tangential and normal velocities at the measuring point. Vns(t) and Vτs(t) are the tangential and normal particle vibration velocities of the surface wave, respectively, at the measuring point, which are caused by the difference in vibration velocities between adjacent particles.
According to the energy conservation of wavefront, the velocity of the body wave at the measuring point is affected by the geometric diffusion of wavefront material damping, and the calculation is as follows:
The second surface wave velocity caused by the vibration velocity difference between two adjacent particles will attenuate with the distance to the measuring point, as shown in the calculation formula:
where α and β represent the incident angle and reflection angle obtained using the Snell theorem, respectively. vIp(t) is the particle vibration velocity when the incident body wave arrives at the measuring point, and the velocity is mainly affected by the geometric diffusion of the wavefront and material damping.
3. Numerical Simulation Validation
3.1. Establishment of Numerical Model of Supercritical CO2 Cracking
To further verify the reliability of the theoretical model, LS-DYNA is used to establish the simulation model of phase change cracking, assuming that the rock mass is a complete elastic body. The specific parameters are as follows in Table 1:

Table 1.
Rock material parameters.
The supercritical CO2 cracking tubes are arranged in the manner shown in Figure 3. The buried depth of the fracturing tubes is 3 m, the resistance line from the free surface is 2 m, the model size is 4 × 6 × 0.01 m, and the fracturing hole diameter is 0.1 m. The non-reflective boundary is used to avoid the reflection of the stress wave on the calculated boundary, except on the free surface. We can calculate the ground vibration caused by CO2 fracturing by applying a fracturing pressure curve to the fracturing hole. Measuring points are set up at the horizontal distance of 0.5, 1.0, 1.52, 2.0, and 2.5 m to monitor the horizontal and vertical closing velocities at each point.
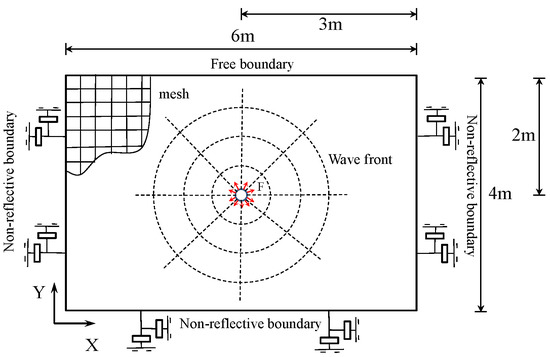
Figure 3.
Schematic representation of the proposed model.
In the modeling process, SOLID164 solid cells are used to simulate the rock mass; each cell has eight nodes, and the vibration effect of the rock mass can be fully displayed through the node displacement. After the trial analysis, the mesh size of the rock body near the rock burst hole is divided into 20 mm, the mesh size of the rock body far from the burst hole is divided into 100 mm, and the finite element model is shown in Figure 4. At the same time, in order to improve the calculation efficiency, we must fully consider the symmetry of the calculation model, and only let the 1/4 model be involved in the calculation. The calculation model is shown in Figure 5.
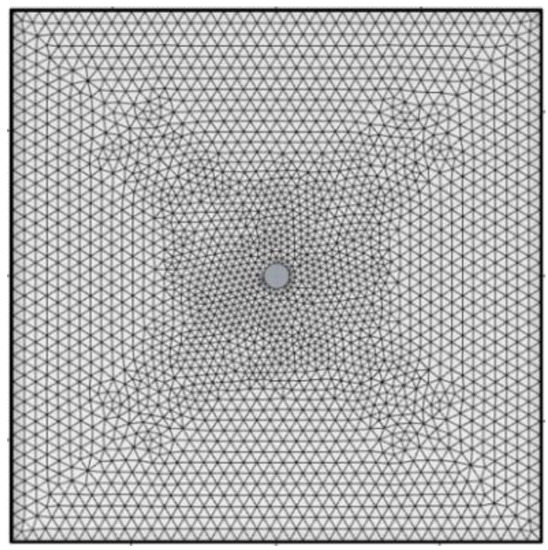
Figure 4.
Schematic diagram of finite element model.
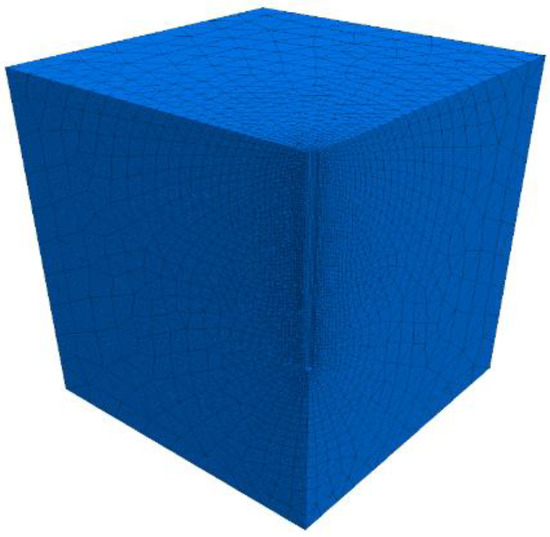
Figure 5.
Schematic diagram of the calculation model.
3.2. Analysis of Numerical Model Calculation Results
The numerical simulation results are shown in Figure 6. From the calculation, it can be seen that the wavefront excited by fracturing at the initial stage of fracturing diverges outward in the form of a concentric body wave at the center of the fracturing hole, and the vibration velocity of particles decays with the increase in transmission distance. When the wavefront is transmitted to the free surface, the vibration of the ground surface is caused by transmission and reflection.
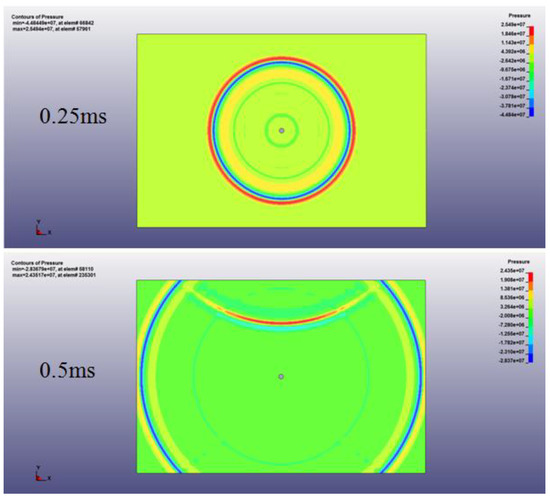
Figure 6.
LS−DYNA numerical simulation.
A monitoring point was set at (0.2,0.2,0) coordinates, i.e., 0.282 m from the center of the fracturing hole, to monitor the vibration velocity of the surface plasma point after supercritical CO2 blasting, and the time curve of the vibration velocity of the plasma point was obtained, as shown in Figure 7. As can be seen from the figure, the vibration velocity of the mass appeared two peak points, respectively, in 1.0 ms and 1.7 ms, the maximum vibration velocity of 3.56 cm/s. The second peak point is due to the vibration of the mass caused by the reflection of the stress wave at the critical surface and then returned to the measurement point.
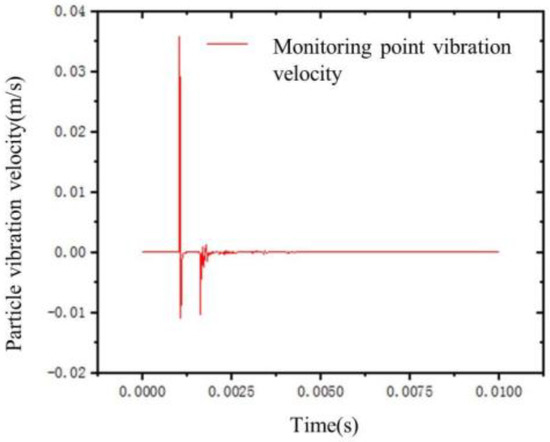
Figure 7.
Time course curve of the mass vibration velocity.
3.3. Comparison of Numerical Simulation and Theoretical Calculation
The vibration velocity of each point on the free surface is calculated using the time-domain recursive method programmed with Matlab, and using numerical simulation. Additionally, the normal (Y) and tangential (X) particle vibration velocities at each measuring point are shown in Figure 8.
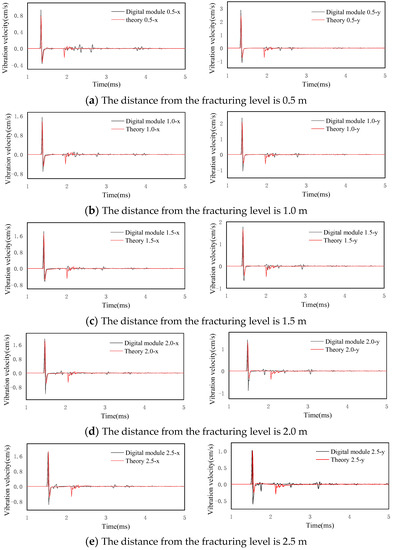
Figure 8.
Vibration velocity of surface points caused by supercritical CO2 phase change cracking.
According to the calculation results, the difference table between numerical simulation and theoretical calculation results can be obtained as follows in Table 2:
Table 2.
Difference between numerical simulation and theoretical calculation results.
It can be seen from Figure 8 that the horizontal and tangential velocity time history curves of each measuring point obtained using theoretical calculation and numerical simulation coincide, and the peak velocity difference between them is shown in Table 2; the maximum difference is 15.81%. It can be seen that the calculation formula based on the time-domain recursive method, used to achieve the superposition of the time domain through Matlab, can better calculate the surface vibration effect caused by supercritical CO2 phase change cracking.
The variation rule of the peak velocity of each measured point with fracturing distance obtained via the theoretical model and numerical simulation is shown in Figure 9. From the figure, it can be seen that the peak velocity obtained using theoretical calculation and numerical simulation is consistent; the normal velocity decreases linearly and rapidly with distance, the tangential velocity increases exponentially with distance, and the combined velocity decreases linearly.
Figure 9.
Particle peak vibration velocity under supercritical CO2 phase change cracking.
4. Comparison of Vibration Effects between Supercritical CO2 Cracking and Dynamite Blasting
4.1. Equivalent Substitution of Supercritical CO2 and Explosives
To compare the ground vibration velocity between phase change cracking and dynamite blasting, the energy released by supercritical CO2 phase change cracking was calculated using the calculation model of the blasting energy of a compressed gas and water vapor container [23], and then converted into an equivalent explosive. The energy released by supercritical CO2 phase change cracking can be calculated using the following formula:
where Eg is the energy of high-pressure gas blasting, kJ. P is the absolute pressure of gas in the liquid storage tank, MPa. V is the volume of the liquid storage tank; k is the adiabatic index of gas, and the adiabatic index of CO2 is 1.295.
The equivalent explosive TNT with the energy released by phase change cracking is calculated using the following formula:
where WTNT is the quality of chemical explosives. QTNT is the value of the energy of 1 kg TNT, which can be determined according to the selected explosive performance parameters.
Typical RDX-based explosives are selected as comparative chemical explosives. For chemical explosives, see the following Table 3 [24]. The value of QTNT is 5151 kJ.
Table 3.
Explosive parameters.
According to the results of the literature [25], the volume size of a type-85 fracturing tube is 1597.97 cm3, the liquid charge size is 1210 g, and the fracturing peak pressure is 242.09 mpa. The pressure–time curve of the type-85 fracturing tube in the process of fracturing the rock is shown in Figure 10, and it can be seen from the figure that the fracturing pressure is triangularly distributed, the peak fracturing pressure is about 242.09 MPa, and the pressure duration is 0.02 s.
Figure 10.
The time history plot of CO2 cracking pressure.
Using the node merging method, the parameters of a 0.25 kg typical RDX-based explosive and the drilling parameters of the same rock are calculated using LS-DYNA, and then the pressure–time history curve of the wall detonation of RDX-based explosives can be obtained, as shown in Figure 11. As shown in the figure, the explosion pressure is also triangular, but the peak pressure is about 812.5 MPa, and the fracturing pressure duration is about 200 us. It can be seen that the peak pressure of explosive blasting is 3.36 times that of phase change cracking, but its action time is only 1/100 of that of phase change cracking.
Figure 11.
Time history plot of the explosive pressure of explosives with equal energy.
4.2. Comparison of Vibration Velocities Caused by Supercritical CO2 and Explosives
Normal (Y) and tangential (X) particle vibration velocities are obtained by calculating the vibration effect of the free surface under the action of equivalent explosive blasting with the same calculation method. The normal and tangential peak particle vibration velocities of the free surface are shown in Figure 12. The evolutionary trend of the normal and tangential peak particle vibration velocities is consistent with supercritical CO2 phase change.
Figure 12.
Particle vibration on the ground surface caused by the explosive explosion.
However, the ground vibration caused by supercritical CO2 cracking is quite different from that caused by dynamite blasting after equivalent substitution. The following Figure 13 shows the attenuation curve of particles with increasing distance caused by supercritical CO2 cracking and dynamite blasting.
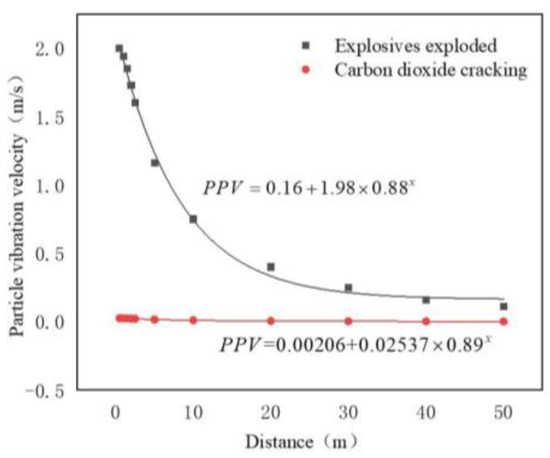
Figure 13.
Comparison of particle vibration between supercritical CO2 cracking and explosive explosion.
The difference in particle vibration velocities between the two cracking modes is shown in Table 4. It can be seen from the calculation results that the vibration velocities of supercritical CO2 phase change cracking are only 1/74~1/78 of those of explosive blasting. Compared with the particle vibration caused by the explosive explosion, supercritical CO2 cracking has an obvious vibration reduction effect when the energy of the two cracking modes is equal.
Table 4.
Comparison of particle vibration velocity between two cracking modes.
5. Conclusions
To investigate the effect of surface vibration induced by supercritical CO2 phase change fracturing, this paper describes the process of supercritical CO2 blasting stress waves on rock mass according to the stress wave theory and time-domain recurrence method, and establishes a model for calculating the surface vibration velocity after supercritical CO2 blasting, considering time variation; the LS-DYNA dynamic finite element program is used to establish a three-dimensional numerical model to verify the reliability of the established theoretical calculation model. The reliability of the established theoretical model was verified. Based on the blasting energy calculation models of compressed gas and water vapor containers, the ground vibration velocities and decay laws of supercritical CO2 phase change fracturing and equivalent explosive blasting were compared and analyzed.
- (1)
- The surface vibration induced by supercritical CO2 phase change blasting is divided into three stages: blasting-induced column surface waves, surface waves generated by trans reflection, and superposition of reflected waves and original waves, which in turn cause surface vibration.
- (2)
- The vibration velocity calculation model based on the time-domain recurrence method can better evaluate the surface vibration effect caused by supercritical CO2 phase change fracturing, and the maximum error between the theoretical model and the numerical simulation is 15.81%, demonstrating a good overall fit.
- (3)
- The surface vibration velocity under the effect of supercritical CO2 phase fracturing decays exponentially with the increase in fracture distance, but the maximum vibration velocity is only 3.56 cm/s.
- (4)
- The peak pressure of supercritical CO2 phase change is 1/3.36 times that of explosive blasting, the action time is 100 times that of explosive blasting, and the peak vibration velocity is only 1/74~1/78 of that of equivalent explosive blasting, which has a good vibration damping effect.
This paper focuses on supercritical CO2 fracturing technology and its ground vibration rate after blasting. Compared with dynamite blasting, supercritical CO2 fracturing technology is cheaper, and the blasting energy is more controllable; it also avoids the disadvantages of the loud noise and significant pollution produced by dynamite blasting. However, there is the phenomenon of “flying pipe” involved in its actual use, and there is a certain safety hazard, which is also a problem that needs to be solved in the future to improve the device. In addition, the vibration velocity characterization method for the use of this blasting technology on the ground surface has not been thoroughly studied, and most of monitoring is field-based; thus, at present, there is no perfect theoretical support for the process of its use. In this paper, a combination of theoretical methods and numerical simulations is used to study the vibration velocity of the ground surface during supercritical CO2 phase change blasting, and certain results have been obtained.
Author Contributions
Conceptualization, E.A. and J.Z.; Methodology, L.L., J.Z. and F.W.; Software, L.L. and Q.Z.; Formal analysis, E.A., L.L. and Q.Z.; Resources, E.A.; Data curation, Q.Z.; Writing—original draft, E.A. and L.L.; Writing—review & editing, J.Z., Q.Z. and F.W.; Visualization, L.L. and H.L.; Project administration, E.A. and J.Z.; Funding acquisition, E.A. and Q.Z. All authors have read and agreed to the published version of the manuscript.
Funding
This work was funded by the National Natural Science Foundation of China (41907261, 52279124), the Chongqing Natural Science Foundation for Academicians (CSTB2023NSCQ-MSX0913, CSTC2021YSZX-JCYJX0002), Chongqing Graduate Research Innovation Project CYB23253.
Data Availability Statement
No instructional records have been created or comfortable with the ongoing assessment data in this original copy.
Conflicts of Interest
The authors declare no conflict of interest.
References
- Saadatmand Hashemi, A.; Katsabanis, P. The Effect of Stress Wave Interaction and Delay Timing on Blast-Induced Rock Damage and Fragmentation. Rock Mech. Rock Eng. 2020, 53, 2327–2346. [Google Scholar] [CrossRef]
- Zhou, W.; Li, Z.; Wu, X.; Wang, S.; Lv, Y.; Lou, X.; Du, C.; Liang, R. A Novel Method to Evaluate the Effect of Slope Blasting under Impact Loading. Shock Vib. 2020, 2020, 6029190. [Google Scholar] [CrossRef]
- Zhang, Y.; Deng, J.; Deng, H.; Ke, B. Peridynamics simulation of rock fracturing under liquid carbon dioxide blasting. Int. J. Damage Mech. 2018, 28, 1038–1052. [Google Scholar] [CrossRef]
- Roy, M.P.; Mishra, A.K.; Agrawal, H.; Singh, P.K. Blast vibration dependence on total explosives weight in open-pit blasting. Arab. J. Geosci. 2020, 13, 531. [Google Scholar] [CrossRef]
- Zeng, Y.; Li, H.; Xia, X.; Deng, S.; Wu, R.; Liu, X. Experimental study on cavity pressure of carbon dioxide fracturing tube. J. Vibroeng. 2021, 23, 1602–1620. [Google Scholar] [CrossRef]
- Chen, Y.; Zhang, H.W.; Zhu, Z.J.; Ren, T.X.; Cao, C.; Zhu, F.; Li, Y.P. A new shock-wave test apparatus for liquid CO2 blasting and measurement analysis. Meas. Control 2019, 52, 399–408. [Google Scholar] [CrossRef]
- Chen, H.; Wang, Z.; Qi, L.; An, F. Effect of liquid carbon dioxide phase change fracturing technology on gas drainage. Arab. J. Geosci. 2017, 10, 314. [Google Scholar] [CrossRef]
- Gao, F.; Tang, L.; Zhou, K.; Zhang, Y.; Ke, B. Mechanism Analysis of Liquid Carbon Dioxide Phase Transition for Fracturing Rock Masses. Energies 2018, 11, 2909. [Google Scholar] [CrossRef]
- Xue, F.; Xia, C.; Li, G.; Jin, B.; He, Y.; Fu, Y. Safety Threshold Determination for Blasting Vibration of the Lining in Existing Tunnels under Adjacent Tunnel Blasting. Adv. Civ. Eng. 2019, 2019, 8303420. [Google Scholar] [CrossRef]
- Xia, X.; Li, H.; Wang, X. Experimental study of CO2 fracturing and explosive blasting ground vibration propagation law in nuclear power engineering. J. Rock Mech. Eng. 2021, 40, 1350–1356. [Google Scholar]
- Langefors, U.; Kihlstrom, B. The Modern Techniques of Rock Blasting; Wiley: New York, NY, USA, 1978; pp. 178–224. [Google Scholar]
- Monjezi, M.; Hasanipanah, M.; Khandelwal, M. Evaluation and prediction of blast-induced ground vibration at Shur River Dam, Iran, by artificial neural network. Neural Comput. Appl. 2012, 22, 1637–1643. [Google Scholar] [CrossRef]
- Yang, F.; Li, H.; Liu, Y. A comparative study on the vibration characteristics of rock masses from bench and pre-crack blasting. J. Coal 2012, 37, 1285–1291. [Google Scholar]
- Cai, C.; Qian, Q.; Fu, Y. Application of BAS-Elman neural network in prediction of blasting vibration velocity. Procedia Comput. Sci. 2020, 166, 491–495. [Google Scholar] [CrossRef]
- Hajihassani, M.; Jahed Armaghani, D.; Marto, A.; Tonnizam Mohamad, E. Ground vibration prediction in quarry blasting through an artificial neural network optimized by imperialist competitive algorithm. Bull. Eng. Geol. Environ. 2014, 74, 873–886. [Google Scholar] [CrossRef]
- Bayat, P.; Monjezi, M.; Rezakhah, M.; Armaghani, D.J. Artificial Neural Network and Firefly Algorithm for Estimation and Minimization of Ground Vibration Induced by Blasting in a Mine. Nat. Resour. Res. 2020, 29, 4121–4132. [Google Scholar] [CrossRef]
- Perino, A.; Zhu, J.B.; Li, J.C.; Barla, G.; Zhao, J. Theoretical Methods for Wave Propagation across Jointed Rock Masses. Rock Mech. Rock Eng. 2010, 43, 799–809. [Google Scholar] [CrossRef]
- Zhao, J.; Zhao, X.B.; Cai, J.G. A further study of P-wave attenuation across parallel fractures with linear deformational behaviour. Int. J. Rock Mech. Min. Sci. 2006, 43, 776–788. [Google Scholar] [CrossRef]
- Wang, R.; Hu, Z.; Zhang, D.; Wang, Q. Propagation of the Stress Wave Through the Filled Joint with Linear Viscoelastic Deformation Behavior Using Time-Domain Recursive Method. Rock Mech. Rock Eng. 2017, 50, 3197–3207. [Google Scholar] [CrossRef]
- Li, J.C.; Li, H.B.; Ma, G.W.; Zhao, J. A time-domain recursive method to analyse transient wave propagation across rock joints. Geophys. J. Int. 2012, 188, 631–644. [Google Scholar] [CrossRef]
- Chai, S.B.; Li, J.C.; Li, H.B. Study of planar P-wave incident on rock masses containing structural surfaces and inducing vibrations on the ground surface. J. Rock Mech. Eng. 2015, 34, 3888–3895. [Google Scholar]
- Yuan, W.X. Research on prediction of ground vibration velocity of tunnel boring blast. Highw. Transp. Technol. (Appl. Technol. Ed.) 2019, 15, 257–259. [Google Scholar]
- Dong, Q.X.; Wang, Z.F.; Han, Y.; Sun, S. TNT equivalent study of liquid CO2 phase change fracturing. Chin. J. Saf. Sci. 2014, 24, 84–88. [Google Scholar]
- Nan, Y.X.; Jiang, J.W.; Wang, S.Y.; Men, J.B. A method for determining the parameters of JWL equation with closed blast parameters. Explos. Impact 2015, 35, 157–163. [Google Scholar]
- Xiao, C.X.; Deng, S.C.; Li, H.B.; Xia, X.; Zhou, Q.Q.; Li, Z.W.; Zeng, Y.Q. Experimental study on phase change fracturing of liquid CO2. Coal Technol. 2018, 37, 190–192. [Google Scholar]
Disclaimer/Publisher’s Note: The statements, opinions and data contained in all publications are solely those of the individual author(s) and contributor(s) and not of MDPI and/or the editor(s). MDPI and/or the editor(s) disclaim responsibility for any injury to people or property resulting from any ideas, methods, instructions or products referred to in the content. |
© 2023 by the authors. Licensee MDPI, Basel, Switzerland. This article is an open access article distributed under the terms and conditions of the Creative Commons Attribution (CC BY) license (https://creativecommons.org/licenses/by/4.0/).