Article

An Adaptive Fatigue Detection System Based on 3D CNNs and Ensemble Models

1
Smart Systems Engineering Laboratory, College of Engineering, Prince Sultan University, Riyadh 11586, Saudi Arabia
2
Department of the Robotics and Intelligent Machines, Faculty of Artificial Intelligence, Kafrelsheikh University, Kafrelsheikh 33516, Egypt
3
Department of Information Technology, College of Computer and Information Sciences, Princess Nourah bint Abdulrahman University, Riyadh 11671, Saudi Arabia
*
Authors to whom correspondence should be addressed.
Symmetry 2023, 15(6), 1274; https://doi.org/10.3390/sym15061274
Submission received: 8 April 2023 / Revised: 25 May 2023 / Accepted: 5 June 2023 / Published: 16 June 2023
(This article belongs to the Special Issue Image Processing and Symmetry: Topics and Applications)

Abstract

:
Due to the widespread issue of road accidents, researchers have been drawn to investigate strategies to prevent them. One major contributing factor to these accidents is driver fatigue resulting from exhaustion. Various approaches have been explored to address this issue, with machine and deep learning proving to be effective in processing images and videos to detect asymmetric signs of fatigue, such as yawning, facial characteristics, and eye closure. This study proposes a multistage system utilizing machine and deep learning techniques. The first stage is designed to detect asymmetric states, including tiredness and non-vigilance as well as yawning. The second stage is focused on detecting eye closure. The machine learning approach employs several algorithms, including Support Vector Machine (SVM), k-Nearest Neighbor (KNN), Multi-layer Perceptron (MLP), Decision Tree (DT), Logistic Regression (LR), and Random Forest (RF). Meanwhile, the deep learning approach utilizes 2D and 3D Convolutional Neural Networks (CNNs). The architectures of proposed deep learning models are designed after several trials, and their parameters have been selected to achieve optimal performance. The effectiveness of the proposed methods is evaluated using video and image datasets, where the video dataset is classified into three states: alert, tired, and non-vigilant, while the image dataset is classified based on four facial symptoms, including open or closed eyes and yawning. A more robust system is achieved by combining the image and video datasets, resulting in multiple classes for detection. Simulation results demonstrate that the 3D CNN proposed in this study outperforms the other methods, with detection accuracies of 99 percent, 99 percent, and 98 percent for the image, video, and mixed datasets, respectively. Notably, this achievement surpasses the highest accuracy of 97 percent found in the literature, suggesting that the proposed methods for detecting drowsiness are indeed effective solutions.

1. Introduction

The issue of drivers falling asleep while operating a vehicle has received considerable attention from numerous researchers in the automotive field, who have dedicated their efforts toward developing a range of drowsiness detection systems. This is an active area of research that involves incorporating various components of the Internet of Things (IoT) and application technology [1], such as sensors, cloud computing, facilities, smartphones, and distributed data processing. To develop a reliable and effective fatigue detection system, researchers typically employ three primary methodologies: behavior-based, vehicle-based, and physical-based approaches [2]. Figure 1 presents an overview of the distinct characteristics of each of these methodologies.
Behavioral-based methods utilize computer vision and image processing techniques to evaluate images and videos of the operator, with the objective of assessing their level of alertness. This strategy is based on analyzing various essential physiological indicators, such as eye blinking, facial expressions such as lip movements, yawning, eye closure, nodding, and head posture, to ascertain whether the operator is awake, drowsy, or asleep [3].
A different approach, known as vehicle-based systems, involves incorporating a driver fatigue detection system into the steering wheel of the vehicle using embedded sensors and devices. This integrated system measures various indicators, including steering wheel velocity, steering wheel angle, steering wheel movement, hand position, lane departure, and hand absence [4].
The physical-based fatigue detection methods employ human bio-signals such as Electroencephalography (EEG), Electrooculography (EOC), and Electrocardiography (ECG) to monitor the driver behind the steering wheel. In addition, some signs are involved in these methods, such as breathing, respiratory, and pulse rates [5].

1.1. Related Work

The endeavors toward developing a system for detecting fatigue can be categorized into two primary groups: conventional algorithms and machine learning algorithms [6]. Among the machine learning algorithms, CNN and SVM are the most commonly employed and efficient classifiers [7]. Although SVM is quick and precise in analyzing small datasets, its accuracy and speed decrease when utilized for larger datasets. Conversely, CNN exhibits high accuracy and stability for both small and large datasets, but its training can be time-consuming when utilizing CPUs and may incur high processing costs when using GPUs [7].
The development of a fatigue detection system for driving is a crucial component in improving driving safety measures. Previous efforts to employ behavioral-based techniques entailed utilizing software to observe driving behavior by capturing real-time images of the driver using infrared illumination [8]. This approach considers multiple parameters, including PERCLOS, face position, blink frequency, nodding frequency, and eye closure duration, to monitor the driver’s conduct. A classifier evaluates these parameters to determine the driver’s level of alertness. Currently, this system surpasses other algorithms as it has the capability to observe and analyze a wide range of factors and collect data in both daytime and nighttime conditions.
Abtahi et al. [9] devised a simple method using image processing to detect signs of driver fatigue. This approach involves capturing facial features, such as eye and lip movements, to identify yawning and ocular languor and then monitoring the driver’s face in the image. The concept identifies changes in the geometric properties of the driver’s face to recognize fatigue. Flores et al. [10] put forth an Advanced Driver Assistance System (ADAS) in their investigation, which employs a technique for detecting tiredness by scrutinizing the driver’s face and eyes to evaluate their facial expressions and eye movements. The authors conducted real-time testing of the system under varying lighting conditions in contrast.
Several techniques, such as those described in references [11,12,13,14,15,16], strive to improve the precision of fatigue detection by identifying the same facial characteristics as described in reference [9]. To this end, Sigari et al. [17] developed a method that compares the driver’s present head orientation to a pre-existing facial template and projects the top half of the driver’s facial image horizontally to detect alterations in eye closure and eyelid distance. A fuzzy-based approach that integrates both parameters was used to automatically activate the algorithm, and it was found to be effective. Nonetheless, it faces difficulties during daylight hours and is incapable of detecting fatigue when the driver is wearing glasses.
In a prior investigation [18], a deep neural network architecture was proposed to address the challenge of identifying drowsiness. The approach involved analyzing the driver’s facial characteristics from RGB footage using a feature fusion architecture developed with three separate convolutional neural network models: VGG16, InceptionV3, and ResNet50. However, the accuracy of this approach was found to be limited, with a score of 78%. On the other hand, Galarza et al. [19] presented an interactive system for detecting drowsiness that incorporated behavioral data, such as eye position, head posture, and yawning frequency, utilizing an Android smartphone. This method offered several benefits, including consistent performance across different settings (e.g., lighting conditions and driver accessories, such as glasses, caps, or hearing aids) and an accurate detection rate of drowsiness, achieving a detection accuracy of 93.37%.
Bassi et al. [20] conducted a study wherein they developed a fatigue detection system that employed machine learning techniques, including local binary pattern, SVM, and Principal Component Analysis (PCA). The primary goal of the system was to enhance the performance of SVM by selecting the optimal linear, polynomial, and quadratic kernels and assessing their effectiveness. The SVM model’s accuracy differed for different kernels, with the polynomial kernel yielding the highest accuracy of 99%. However, this approach was deemed computationally intensive, and its testing necessitated a considerable amount of time, despite its efficacy.
In their study, Ouabida et al. [21] proposed a method for detecting driver fatigue using an optical correlator for driver-eye tracking. Specifically, they employed the Vander Lugt Correlator (VLC) to estimate the position of the eye center and filter out visual noise in challenging settings. Their approach yielded an impressive 95% accuracy rate. However, a notable disadvantage of this technique is its susceptibility to light reflections from external sources, such as other vehicles or streetlights.
An alternative approach to detecting driver fatigue was introduced by Maior et al. [22], who utilized computer vision and machine learning techniques to extract eye patterns and monitor blink movements from video streams. This method employed SVM, RF, and MLP algorithms and yielded a 94% accuracy rate. Nonetheless, this technique is associated with relatively lengthy processing times.
In their study, Saurav et al. [23] presented a system that utilizes video streaming technology to identify occurrences of yawning. To enhance the accuracy of fatigue detection, advanced deep learning models, specifically Bi-directional Long Short-Term Memory (Bi-LSTM) and CNN, were employed. The system also leverages a camera feed to capture data from the mouth area and distinguish between typical mouth movements and indications of fatigue. The effectiveness of the system was assessed by evaluating it against two datasets, the Yawning Detection Dataset (YawDD) [24] and the National Tsing Hua University Yawning Detection Dataset (NTHUDDD) [25]. The outcome of the evaluation showed a high accuracy rate of 96%.
Biswal et al. [26] have devised an intelligent monitoring system that can detect and caution against driver fatigue. The system relies on video streaming and blink analysis techniques to estimate the distance between the eye and the face, as well as the Eye Aspect Ratio (EAR). An advantage of this system is its ability to integrate with IoT modules for traffic incident alerts. Another approach proposed by Jeon et al. [27] combines vehicle-based and behavioral methods. This method captures data from the steering wheel and pedal pressure sensors and employs Convolutional Neural Networks (CNNs) for classification, with a reported success rate of 94%. However, this technique’s accuracy is susceptible to fluctuation due to alterations in the road environment, which is its primary limitation.
By contrast, a number of algorithms have incorporated machine learning and deep learning models to create physical techniques that rely on input from EEG [28,29], ECG [30], and EOG. These techniques represent a fusion of physical and behavioral strategies. For example, Ko et al. [31] proposed a system that extracts Differential Entropy (DE) from EEG signals and applies CNN for classification. This process generates hierarchical features and class-discriminative information, enabling the detection of sleepiness via a density-connected layer. Similarly, Zhu et al. [32] employed CNN to gather and analyze data from wearable EEG sensors. They employed a pre-trained AlexNet model with CNN to classify the collected EEG signals, resulting in a 94% accuracy rate. However, the primary difficulty associated with this approach lies in the time delay between acquiring EEG data and processing it with CNN.

1.2. Novelty and Contributions

Upon examination of the reviewed literature, it becomes evident that a multitude of feature extraction techniques were employed to extract the essential features from the input data. Additionally, various strategies were employed in the classification task to attain optimal detection accuracy. Many researchers investigated fatigue detection methods to prevent drivers from drowsiness [33,34,35], and others detect sleepiness from eye closure rate [36]. Nevertheless, despite using robust feature extraction and classification methods, the highest level of detection accuracy attained was 97% on a collected dataset using a driving simulator with an ensemble machine learning method. The objective of this article is to develop an enhanced system that can achieve a higher level of detection accuracy than the existing systems presented in previous literature. This objective is achieved using a cascaded decision system which comprises two stages. The first stage is requested to detect yawning and tiredness, while the second one detects the eye closure state.
In addition, we deployed machine learning and deep learning, which have been employed in various applications, including emotion recognition [37], speech recognition [38], image reconstruction [39], and medical diagnosis [40,41,42,43]. The present study suggests a deep learning approach based on 2D and 3D CNNs for identifying fatigue in images and videos. The proposed study’s contributions are as follows:
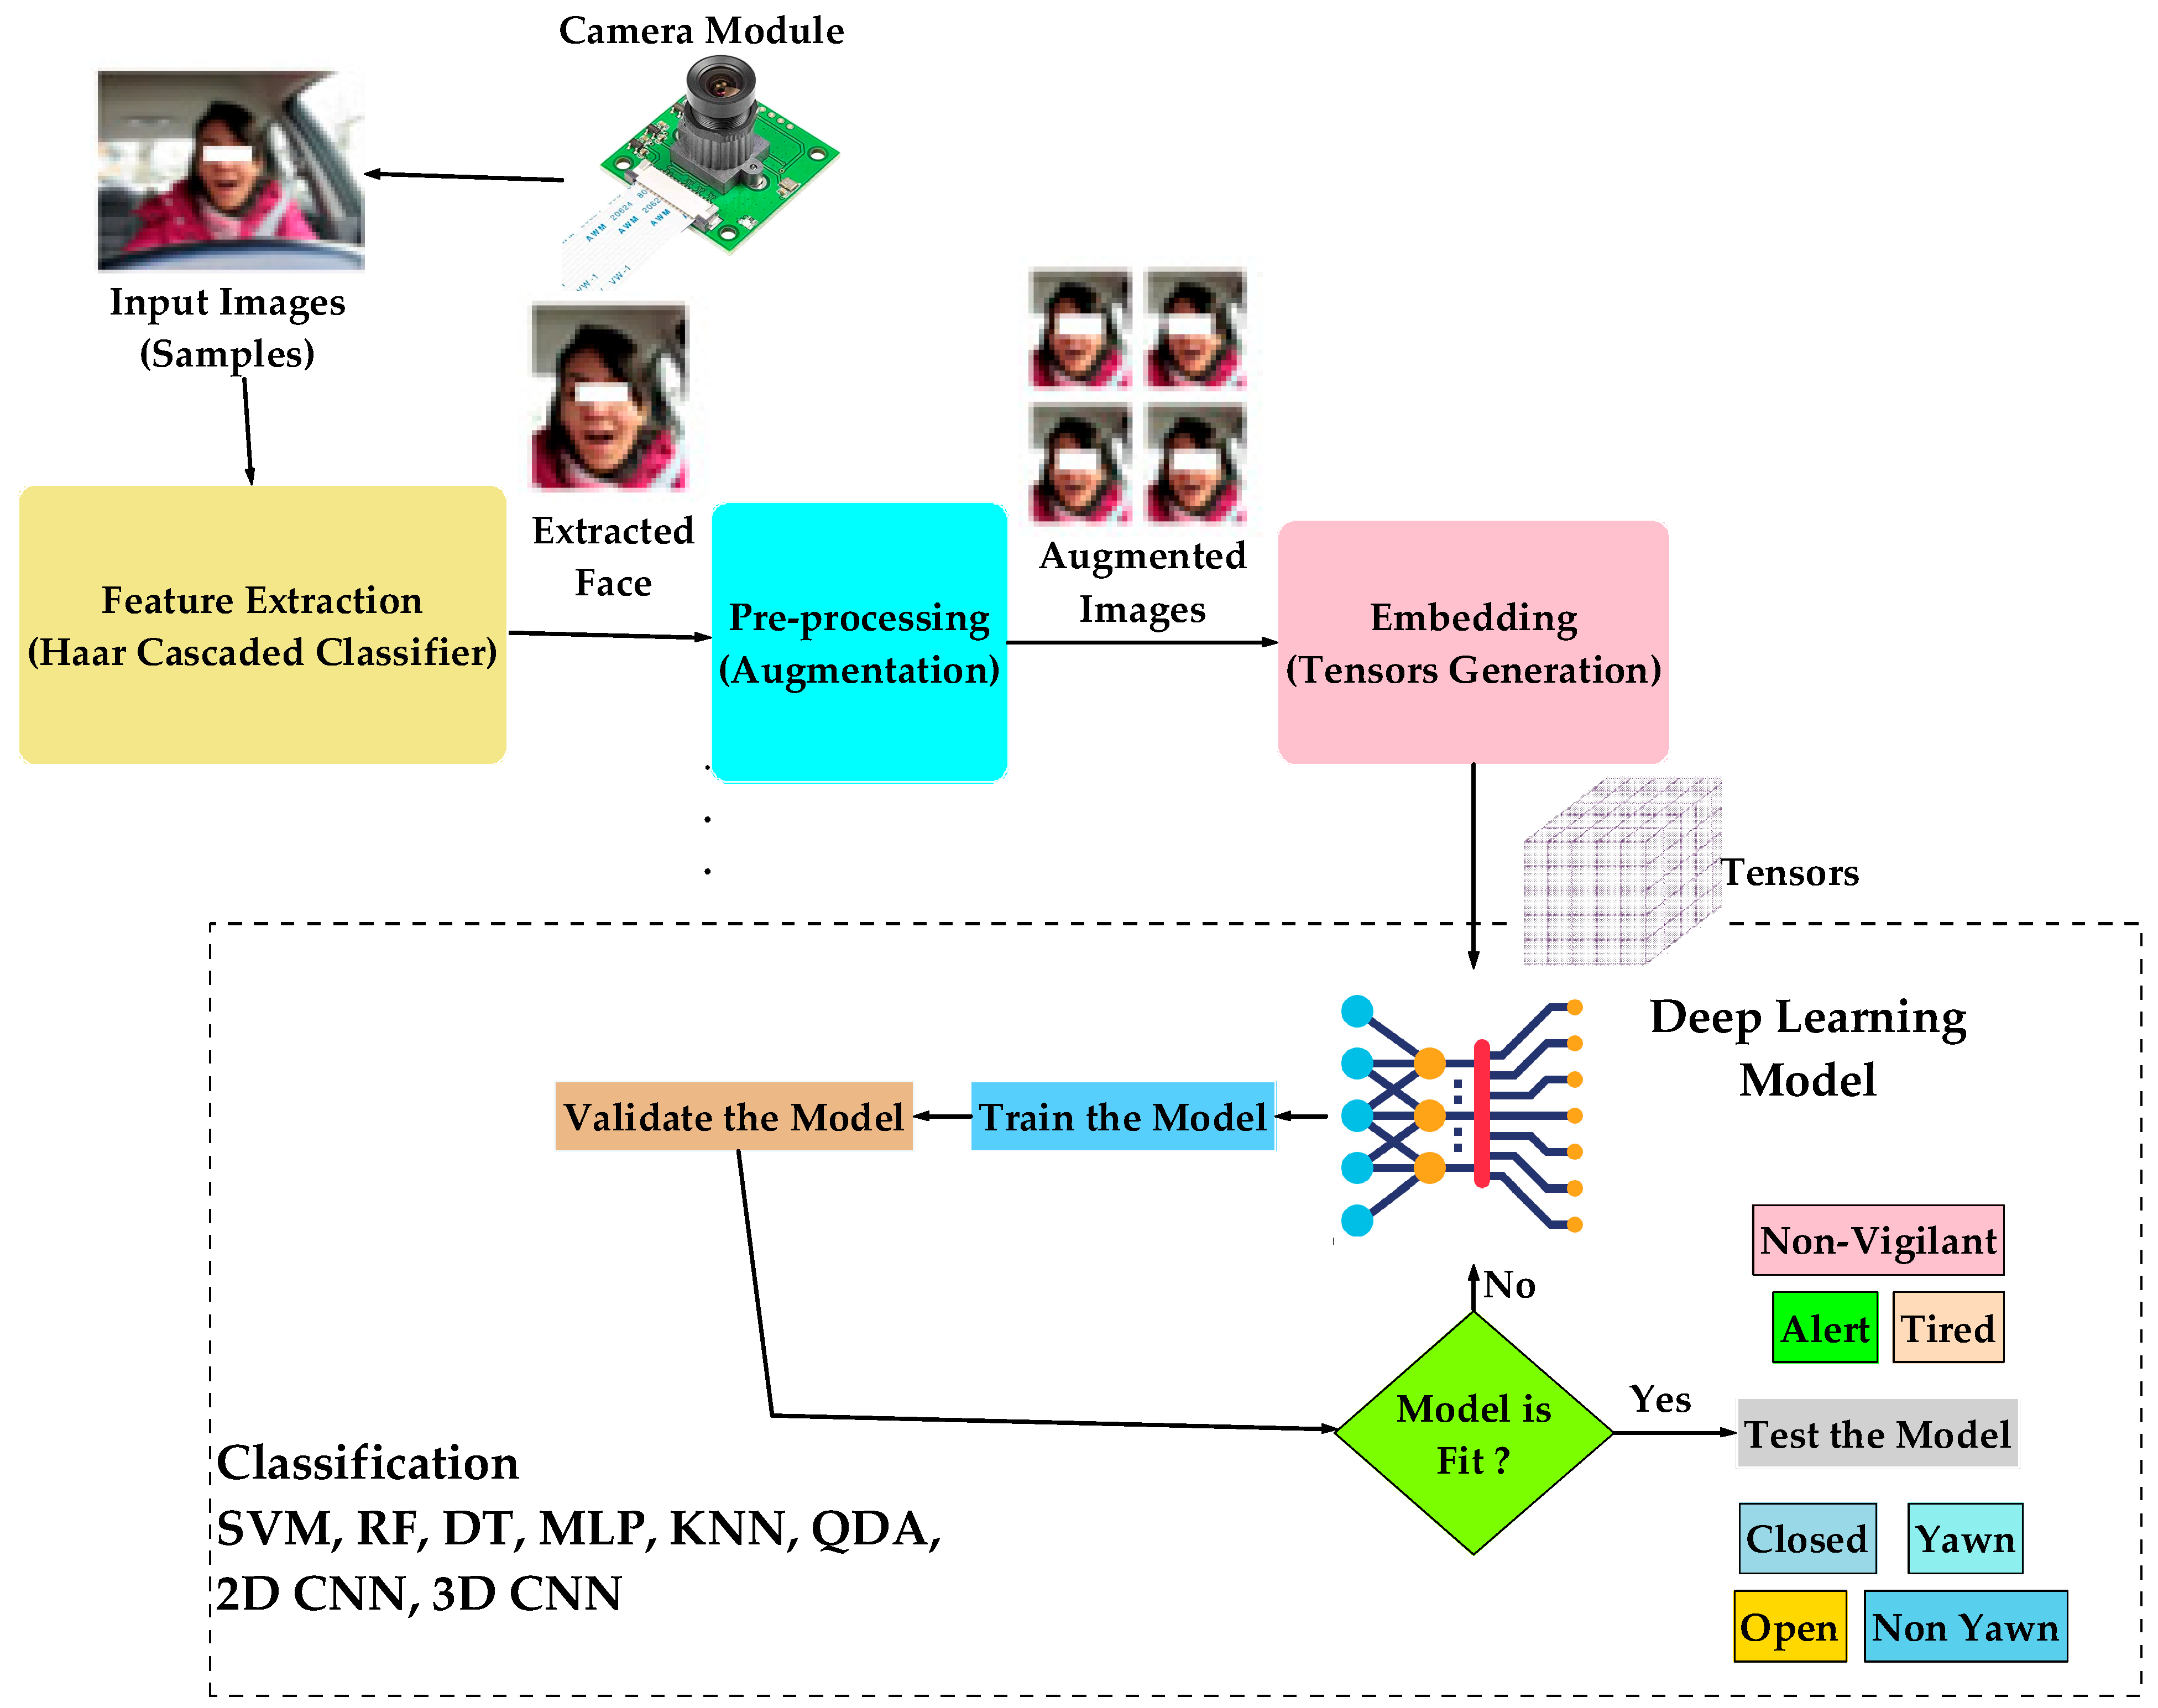
  • The process of feature extraction from images and videos is accomplished by the utilization of the Haar Cascaded Classifier (HCC).
  • To investigate a cascaded system that detects both tiredness and eye closure. This system is the first concern in this topic, to the best of the author’s knowledge.
  • To explore an improved approach to detect fatigue from images based on machine learning methods utilizing SVM, RF, DT, KNN, QDA, MLP, and LR.
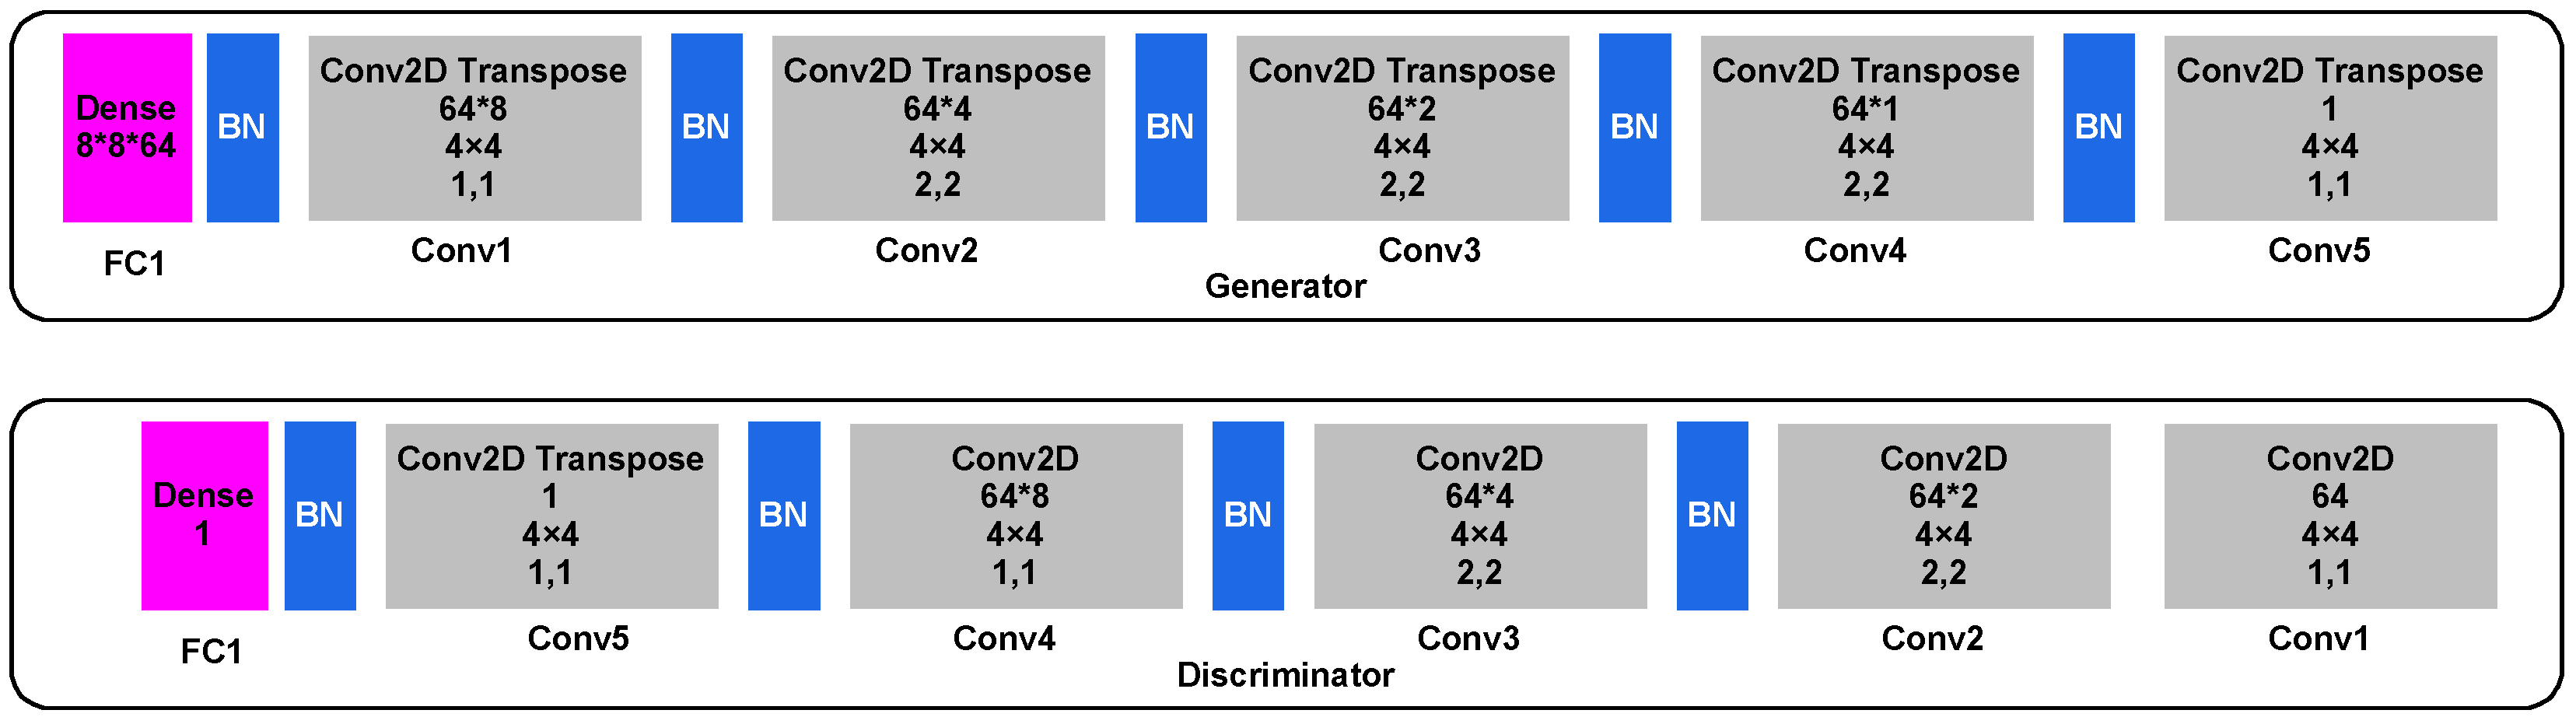
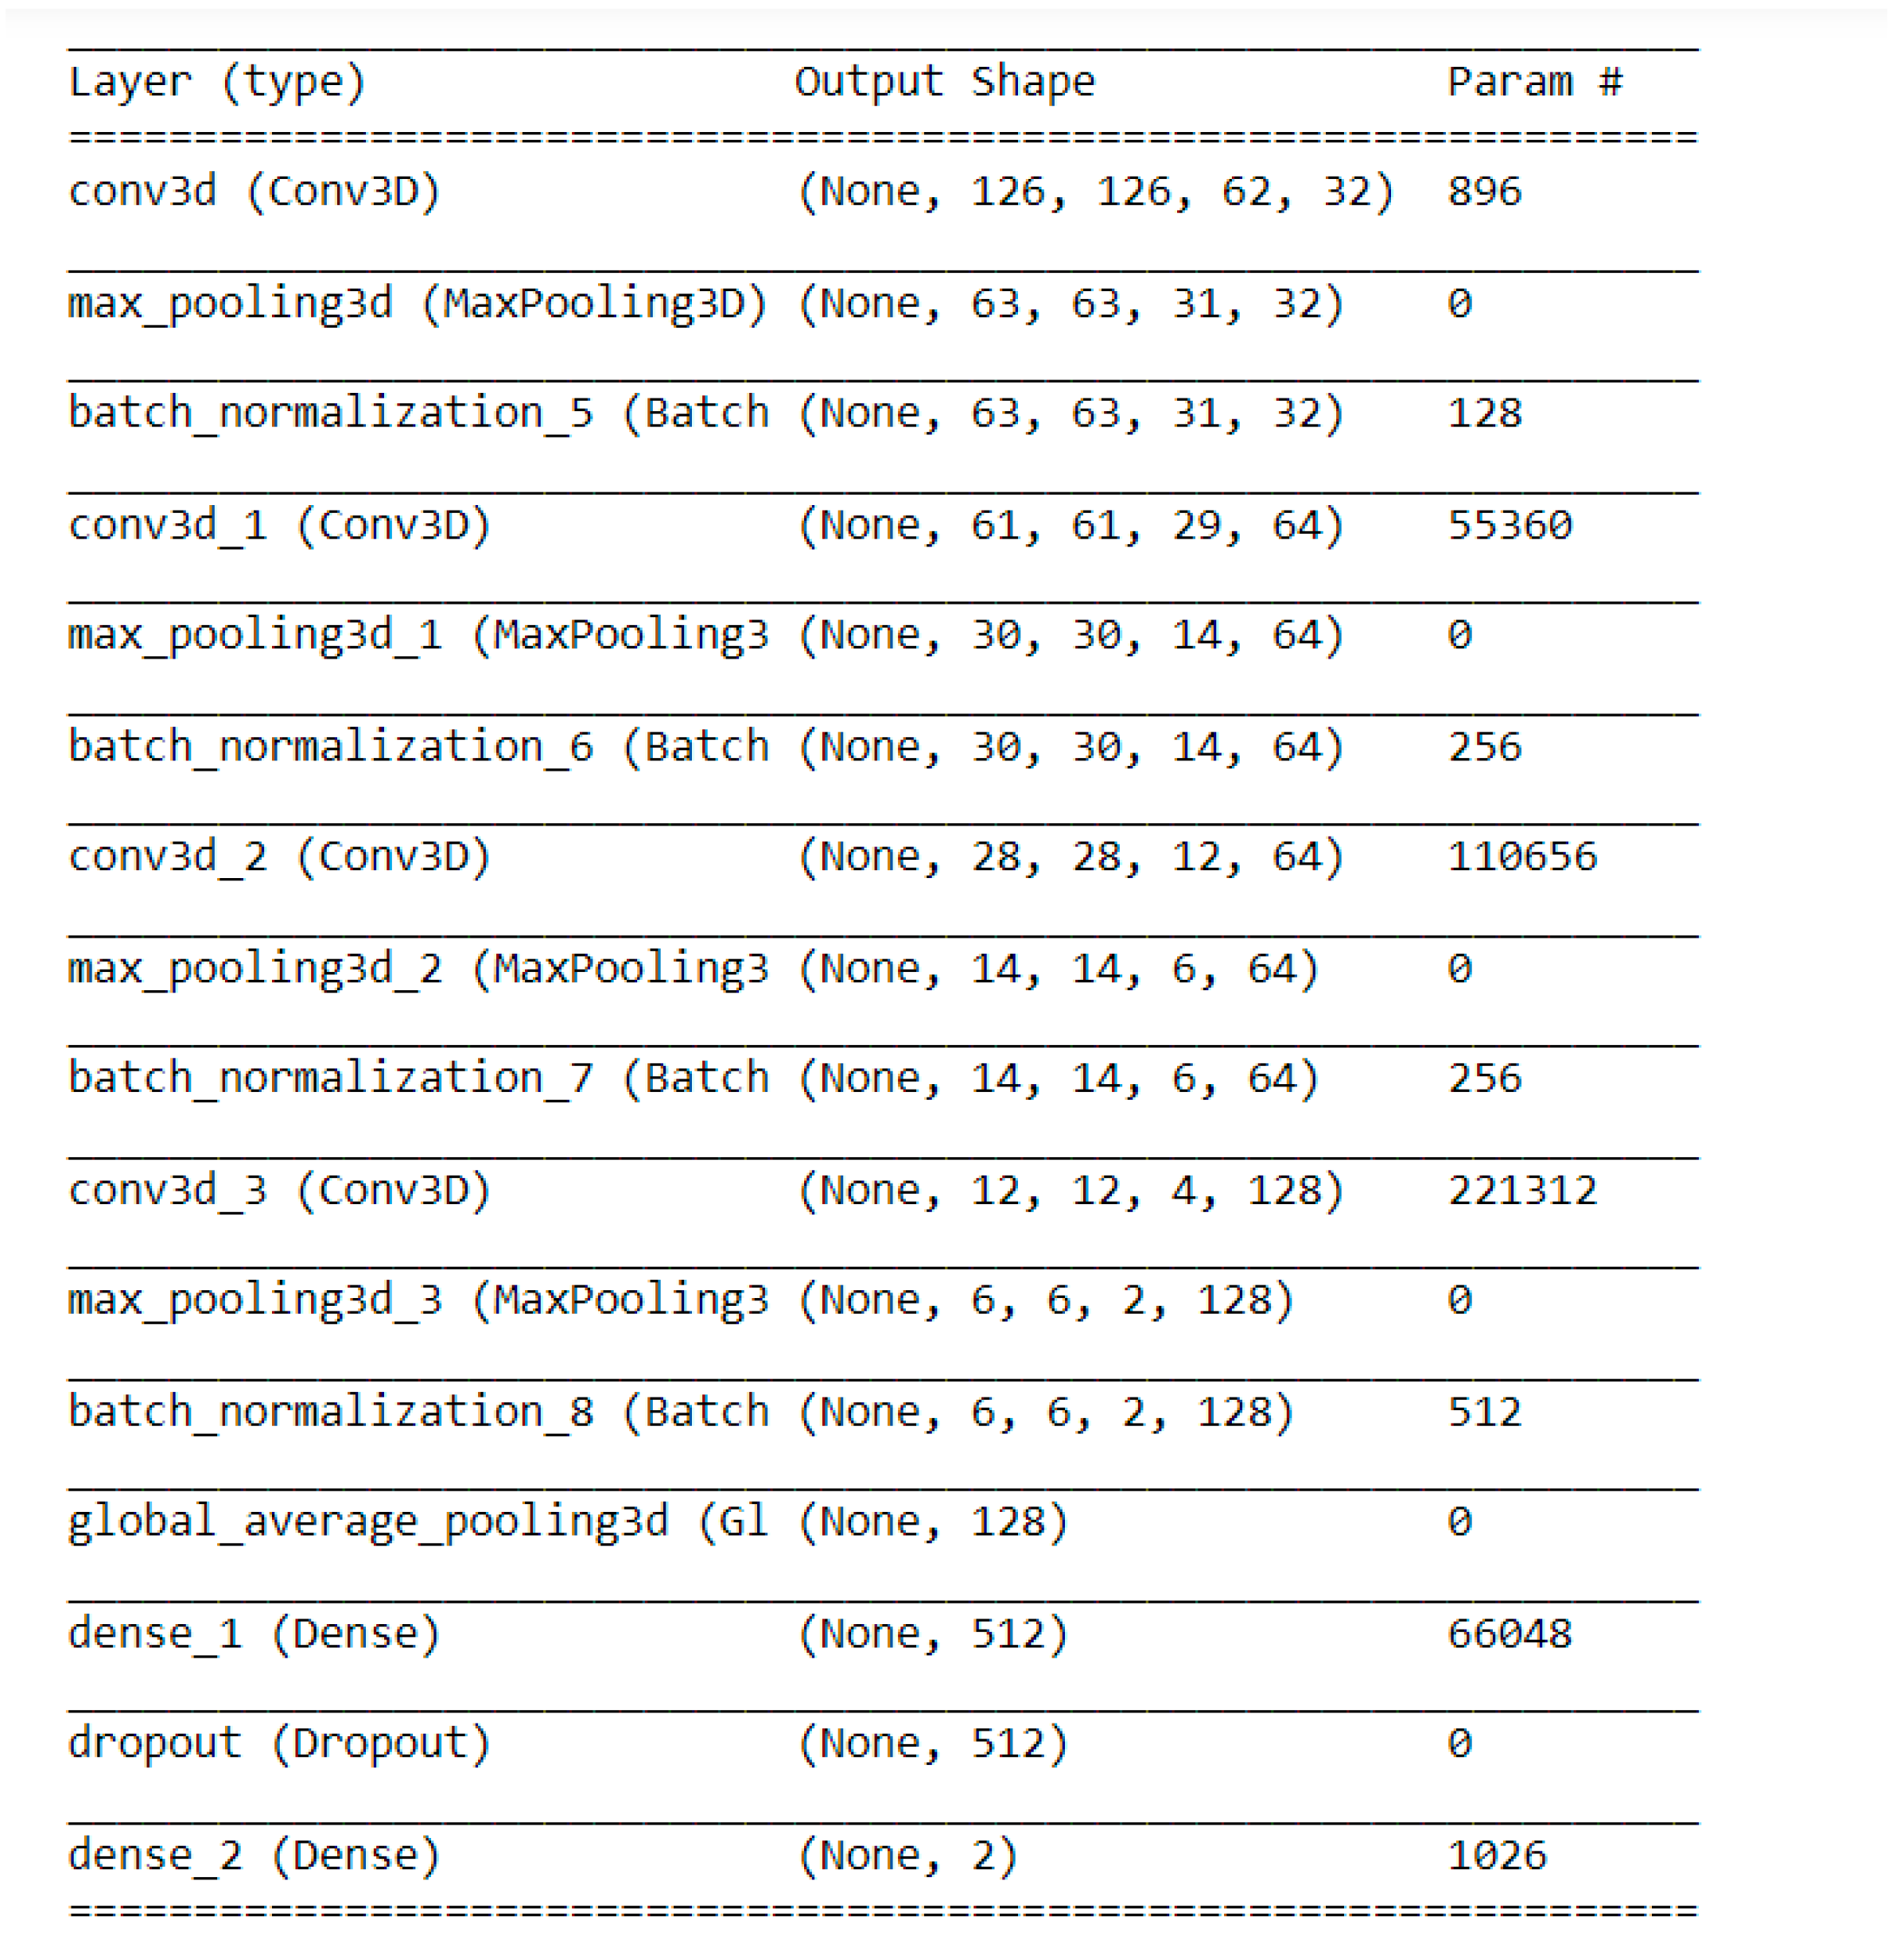
  • To design some deep learning models based on 2D and 3D CNNs to handle the input data in RGB modality with specific hyper-parameters.
  • A comparison is carried out among the proposed models, which presents the optimal one based on the accuracy of detection and testing time.
The remaining sections of this paper can be divided into four parts. Section 2 outlines the materials and proposed methods utilized in this study. Section 3 presents a comprehensive analysis of the results obtained from these methods. In Section 4, a brief comparison between the proposed methods and previous works in the literature is discussed. Lastly, Section 5 serves as the conclusion of this paper.

2. Materials and Methods

This introduces a method for detecting drowsiness, due to fatigue, among drivers by monitoring their conduct, specifically utilizing videos and images. The system is composed of four principal phases, including feature extraction, preprocessing, scaling, and classification. In the feature extraction phase, the Haar Cascaded Classifier is utilized to extract the driver’s facial and ocular features from the captured videos or images. Furthermore, the preprocessed facial images are enhanced by utilizing data augmentation techniques to increase the amount of input data for the classification procedure. Moreover, the enhanced data is standardized and scaled to be incorporated into the classification models. The overall architecture of the suggested system is depicted in Figure 2. The concept of the proposed system is to detect fatigue (tiredness), which is a primary cause of drowsiness. The algorithm of the proposed system is shown in Algorithm 1. First, the input video, which is recorded at a rate of 30 frames per second, is fed into the system. Then, the face is extracted from the video frame in the “Face extraction” step. The extracted faces are enrolled in to “Face detection” step for face and eye recognition. The classification process to detect drowsiness from facial symptoms and yawning is performed in Step 3, while the detection of drowsiness from the detected eyes is performed in Steps 4 and 5. We deployed HCC to detect them to be fed into the classifiers to detect their state, whether open or not. The steps of the proposed algorithm are as follows:
Algorithm 1: Steps of Drowsiness Detection in The Proposed System
Input Data
Step 1: Face extraction
Step 2: Face Detection
Step 3: Drowsiness Detection from face
if yawn;
Alert;
else if tired;
Alert;
end if;
else Go to step 5;
Step 4: Eye Detection
Step 5: Drowsiness detection from Eye
if yawn;
Alert;
else Go to step 1;
end if;

2.1. Image Augmentation

This paper presents a data augmentation technique based on a Generative Adversarial Network (GAN), which has been shown to be effective in several applications. In this study, we apply the Convolutional GAN (CGAN) method to augment the input images. Unlike the standard use of GANs, our study uses them solely for data augmentation and not for classification purposes.
Specifically, our CGAN comprises a generator network and a discriminator network, as shown in Figure 3. The generator consists of five convolutional transpose layers and a denoising fully connected layer to generate feature maps from input images. The discriminator comprises five convolutional layers and a denoising fully connected layer to reconstruct the original image. The generated images are used to augment the available dataset, improving the performance of the DLMs.

2.2. Classification

Classifiers such as DT, KNN, SVM, RF, and MLP with backpropagation, QDA, and LR are used in the machine learning approach. In addition, the hyperparameters of the proposed algorithms are mechanically chosen using the grid search method [44,45].
Additionally, the deep learning methodology consists of two deep learning models. The first model, namely the 3D CNN, comprises 16 layers. Its structure encompasses several duties, including feature extraction, feature reduction, full connectivity, and classification. The feature extraction stage employs four 3D convolutional layers with filter sizes 32, 64, 64, and 128. Furthermore, the feature reduction task is accomplished through four 3D Max pooling layers, using a window size of 2. Both these tasks operate on the 3D modality to handle the depth of the input images, where the input video frames are fed into the proposed model with an input shape of (162, 162, and 3). Consequently, this model intends to account for any color changes that may occur within the frame’s color channels.
Another objective is the fully connected task, which is managed by utilizing a 3D global average pooling (3D GAP) to process the output 3D feature map generated by the convolutional and pooling layers sequence. The GAP layer is subsequently followed by a series of dense layers that produce an eigenvector, which is then fed into the classification layer. This classification layer consists of a dense layer equipped with a softmax activation function. The architecture of the proposed 2D and 3D model is shown in Figure 4 and Figure 5.

3. Results

This section offers a thorough assessment of the proposed fatigue detection techniques. Firstly, a detailed depiction of the datasets employed in this research is provided. Secondly, the evaluation metrics employed to measure the effectiveness of the proposed methods are presented. Thirdly, the hyperparameters utilized in this study are illustrated. Moreover, the results obtained from the experiments are outlined, accompanied by discussions and comments on these findings. Finally, a comparative analysis of the endeavors is conducted to provide a comprehensive comprehension of the strengths and limitations of the proposed approaches.
The proposed techniques were assessed on a personal computer containing an Intel Core i7 CPU, 8 GB NVIDIA GPU driver, 32 GB of RAM, and running on the Windows 11 operating system. These specifications were enough to handle the processing of the videos with a frame rate of 30 frames per second (time interval of 33.33 ms), as shown in the simulation results. The programming codes for the proposed approaches were developed utilizing Python 3.8 and the Keras and TensorFlow toolkits and the design of the proposed models, including the layers and learning parameters.

3.1. Datasets

The proposed techniques are executed on the “ULg Multimodality Drowsiness Database,” commonly abbreviated as DROZY [46]. This database comprises two segments. The first segment entails collecting data from 14 young, healthy individuals, comprising three males and eleven females, utilizing video streaming monitoring. The data in this segment was gathered utilizing Kinect technology and video sensors that are equipped with Near-Infrared (NIR) sensitivity, resulting in a resolution of 512 × 424 pixels in MP4 format. Illustrations of NIR intensity scenes generated from video frames are displayed in Figure 6. This dataset is collected at the rate of frames of 30 frames per second (time interval of 33.33 ms) with a number of frames of 17,000 frames per person. Table 1 illustrates the number of images for each person involved in this dataset (publicly provided).
The second dataset is the drowsiness dataset [24]. This dataset comprises images of the drivers with different eye and face symptoms, including eyes closed or open and yawning or not. The objective is to distinguish among these states using the proposed deep learning models. In addition, data augmentation is employed to increase the number of images fed into the deep-learning models. Figure 7 shows samples of this dataset.
The datasets are shuffled and split into training and testing subsets with an 80/20 ratio. In addition, the training process is performed using k-fold cross-validation with a k value of 10.

3.2. Evaluation Metrics

To evaluate proposed approaches, various evaluation metrics are used, such as accuracy, recall, precision, F1 score, and Matthews Correlation Coefficient (MCC). These metrics (MCC) are defined by Equations (1)–(5) [47]. The term False Negative (FN) refers to the number of instances in which drowsy states are mistakenly identified as normal. True Positive (TP) denotes the number of drowsy states correctly identified as such. True Negative (TN) pertains to the number of normal states accurately identified as normal. False Positive (FP) refers to the number of normal states inaccurately identified as drowsy.
A c c u r a c y = N o .   o f   c o r r e c t l y   d e t e c t e d   i m a g e s T o t a l   N o .   o f   i m a g e s × 100 = ( T N + T P ) ( T P + F P + T N + F N ) × 100
R e c a l l = T P R = T P T P + F N = 1 F N R
p r e c i s i o n = T P T P + F P
F 1 = 2 × p r e c i s i o n × r e c a l l p r e c i s i o n + r e c a l l
M C C = T P × T N F P × F N T P + F P × T P + F N × T N + F P × T N + F N × 100

3.3. Hyperparameter Setting

This study conducts a grid search algorithm to perform hyperparameter selection for both machine learning and deep learning approaches. The objective of this process is to identify the optimal values of hyperparameters that result in maximum accuracy. Table 2 lists the hyperparameters utilized in the proposed methods, which are obtained through 100 iterations for each model. The model training process is carried out iteratively with various hyperparameter values for the optimizer, learning rate, and activation function of the deep learning layers to select the optimal hyperparameters for the deep learning approach. Figure 8 presents the learning curve for accuracy during the hyperparameter optimization, demonstrating that the model performance improves with each run due to the variations in the hyperparameter values. Moreover, Table 3 displays some of the iterations conducted for hyperparameter optimization for the deep learning model, while Table 2 illustrates the selected hyperparameters for the proposed methods.

3.4. Simulation Results

This section comprises the simulation results of the proposed models for both images and video datasets discussed previously. In addition, the proposed models have been compared to accomplish the optimum method. The proposed methods are carried out in three main scenarios. The first scenario includes three states, alert, tired, and non-vigilant. The second one comprises four categories: eye open, eye closed, yawn, and no yawn. The last scenario is a combination of the two scenarios, which comprises seven categories, including those in the first and second scenarios. The following subsections discuss the simulation results of each proposed scenario.

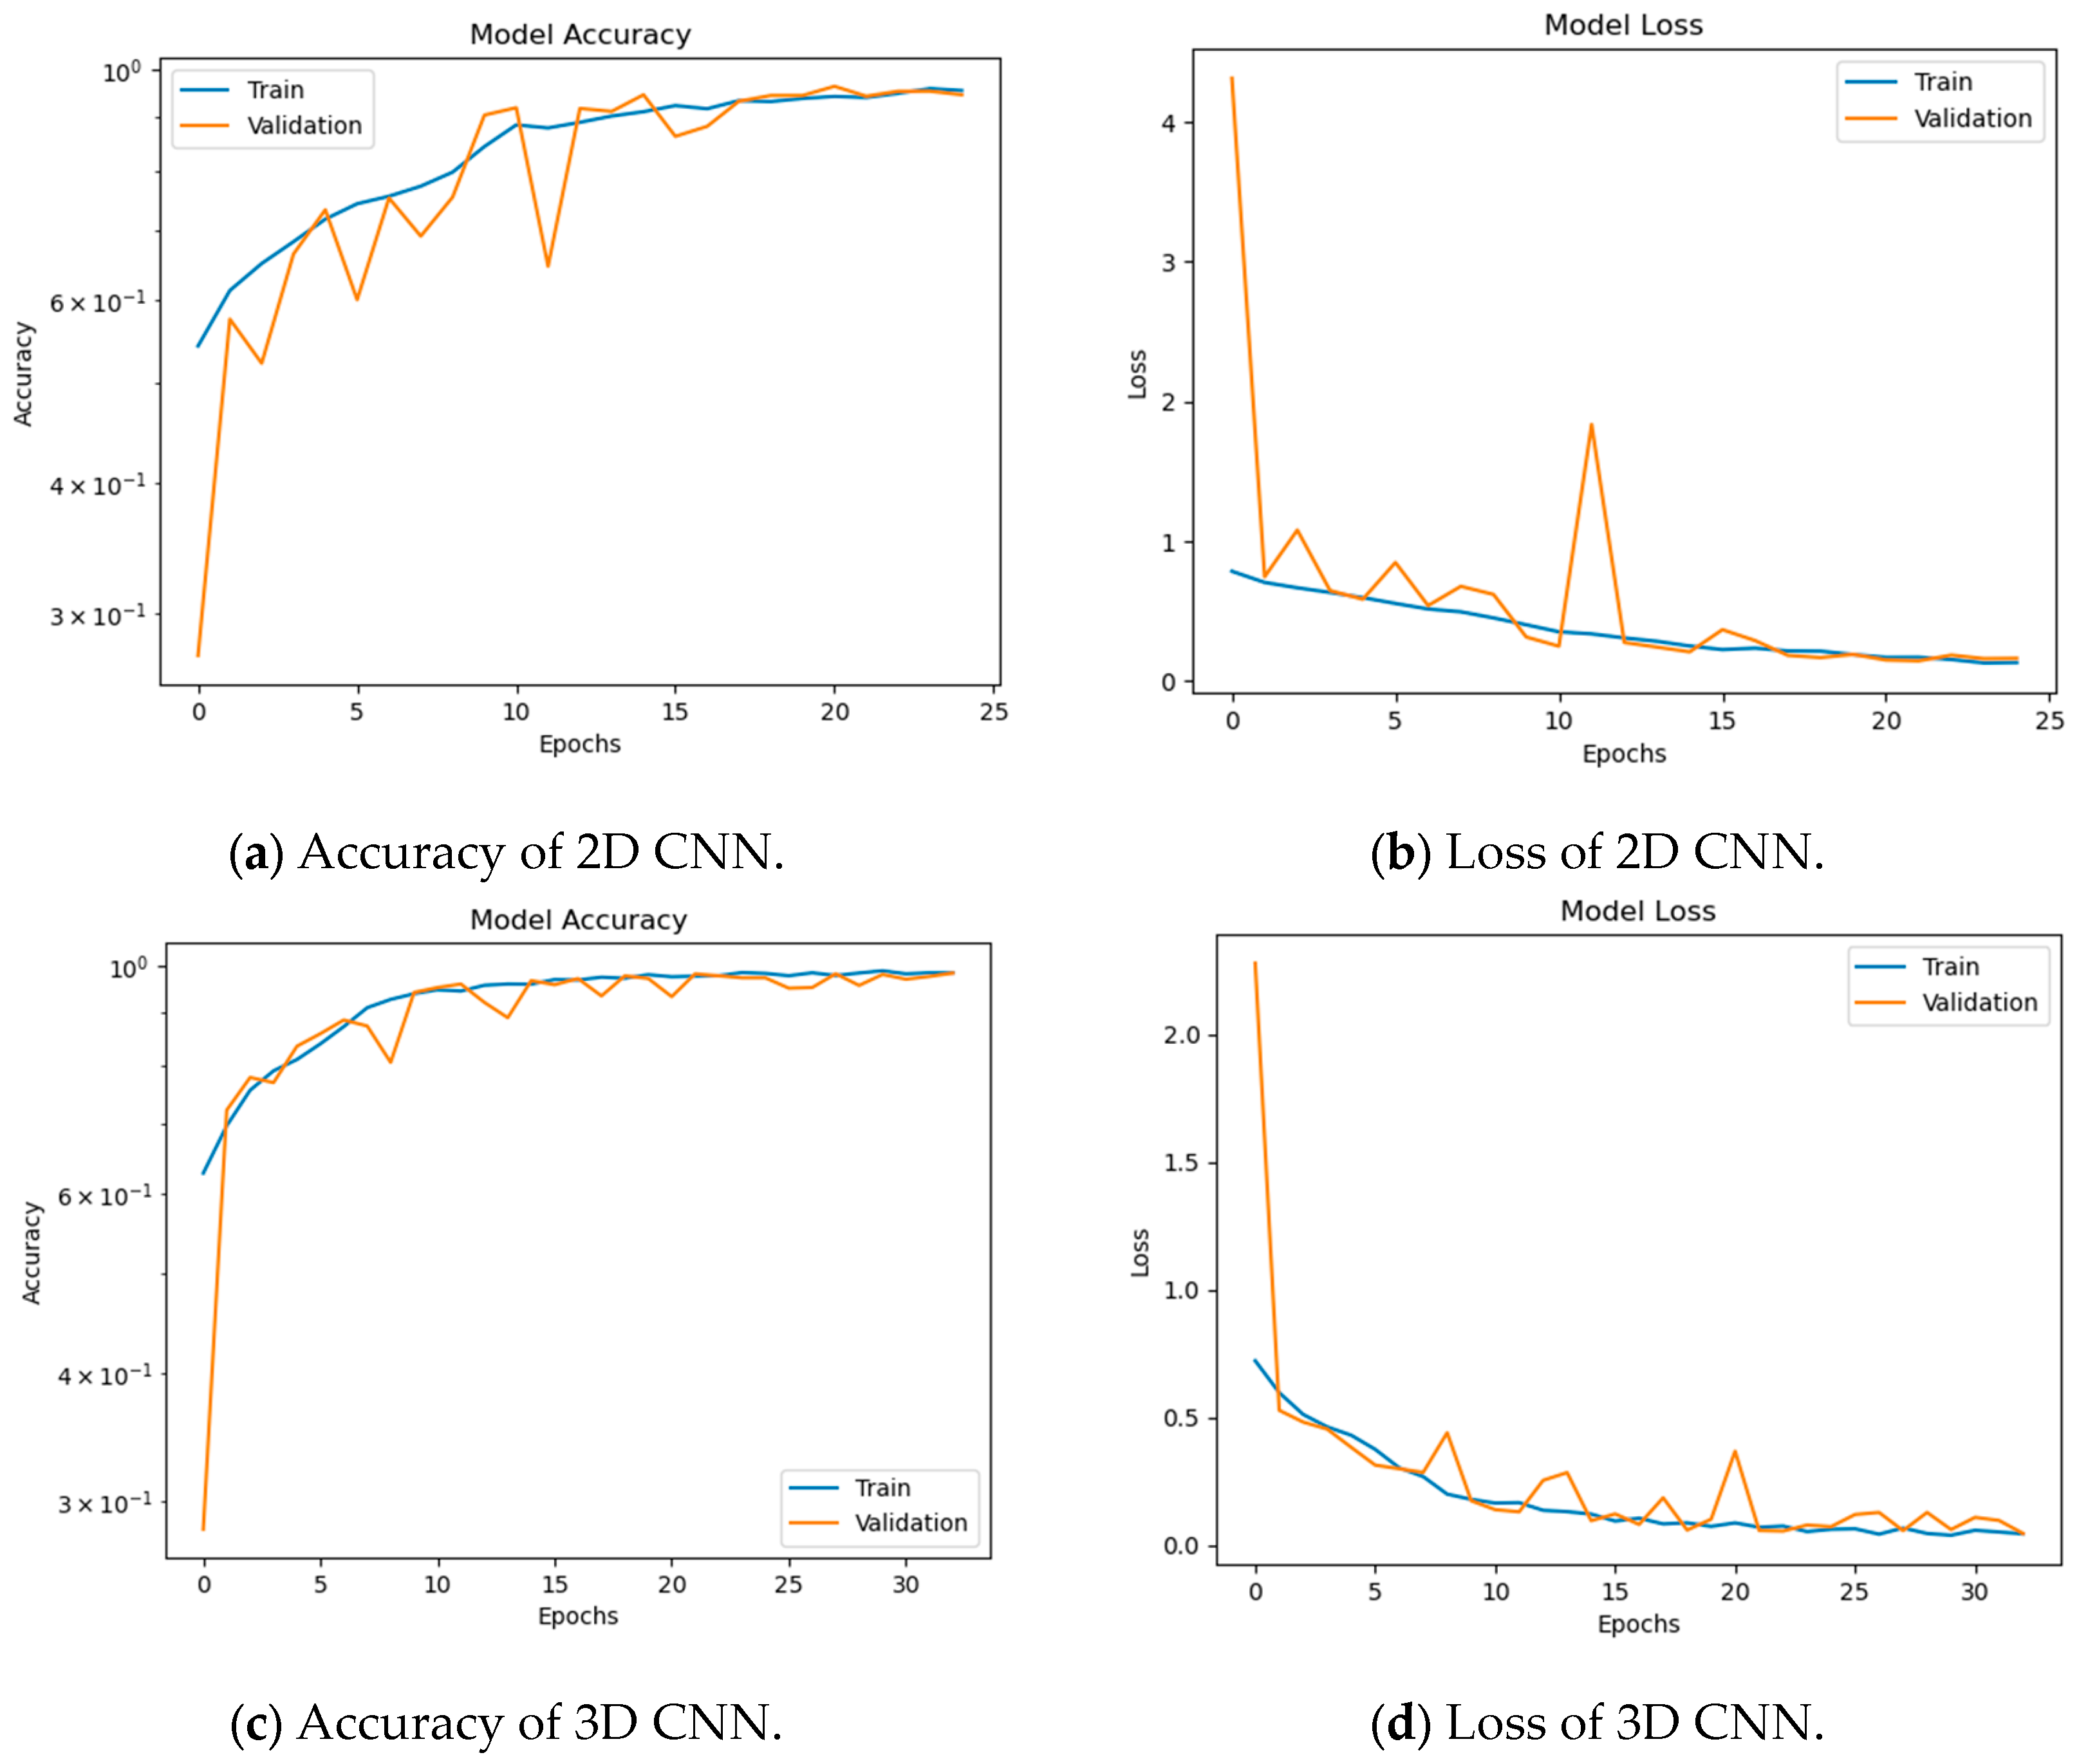
3.4.1. Simulation Results of DROZY Video Dataset

This research paper employs a fatigue detection technique that analyzes video frames to determine the driver’s level of awareness, specifically identifying whether the driver is alert, tired, or non-vigilant. The objective of this study is to develop an accurate model with low testing time, utilizing both machine and deep learning models. The machine learning approach implemented in this study includes SVM, RF, DT, KNN, QDA, MLP, and LR, while the proposed deep learning approach involves 2D and 3D CNNs. Figure 9 and Figure 10 present the learning curves of the proposed models, demonstrating that the model performance improves during the training process. Table 4 lists the evaluation metrics of the proposed models, including precision, recall, accuracy, and F1-score. The simulation results indicate that the SVM, RF, and KNN machine learning models have superior performance for fatigue detection from videos, achieving an accuracy of 99%. Furthermore, the proposed 3D CNN deep learning model achieves an accuracy of 99%. Thus, the proposed models offer effective solutions for video fatigue detection.

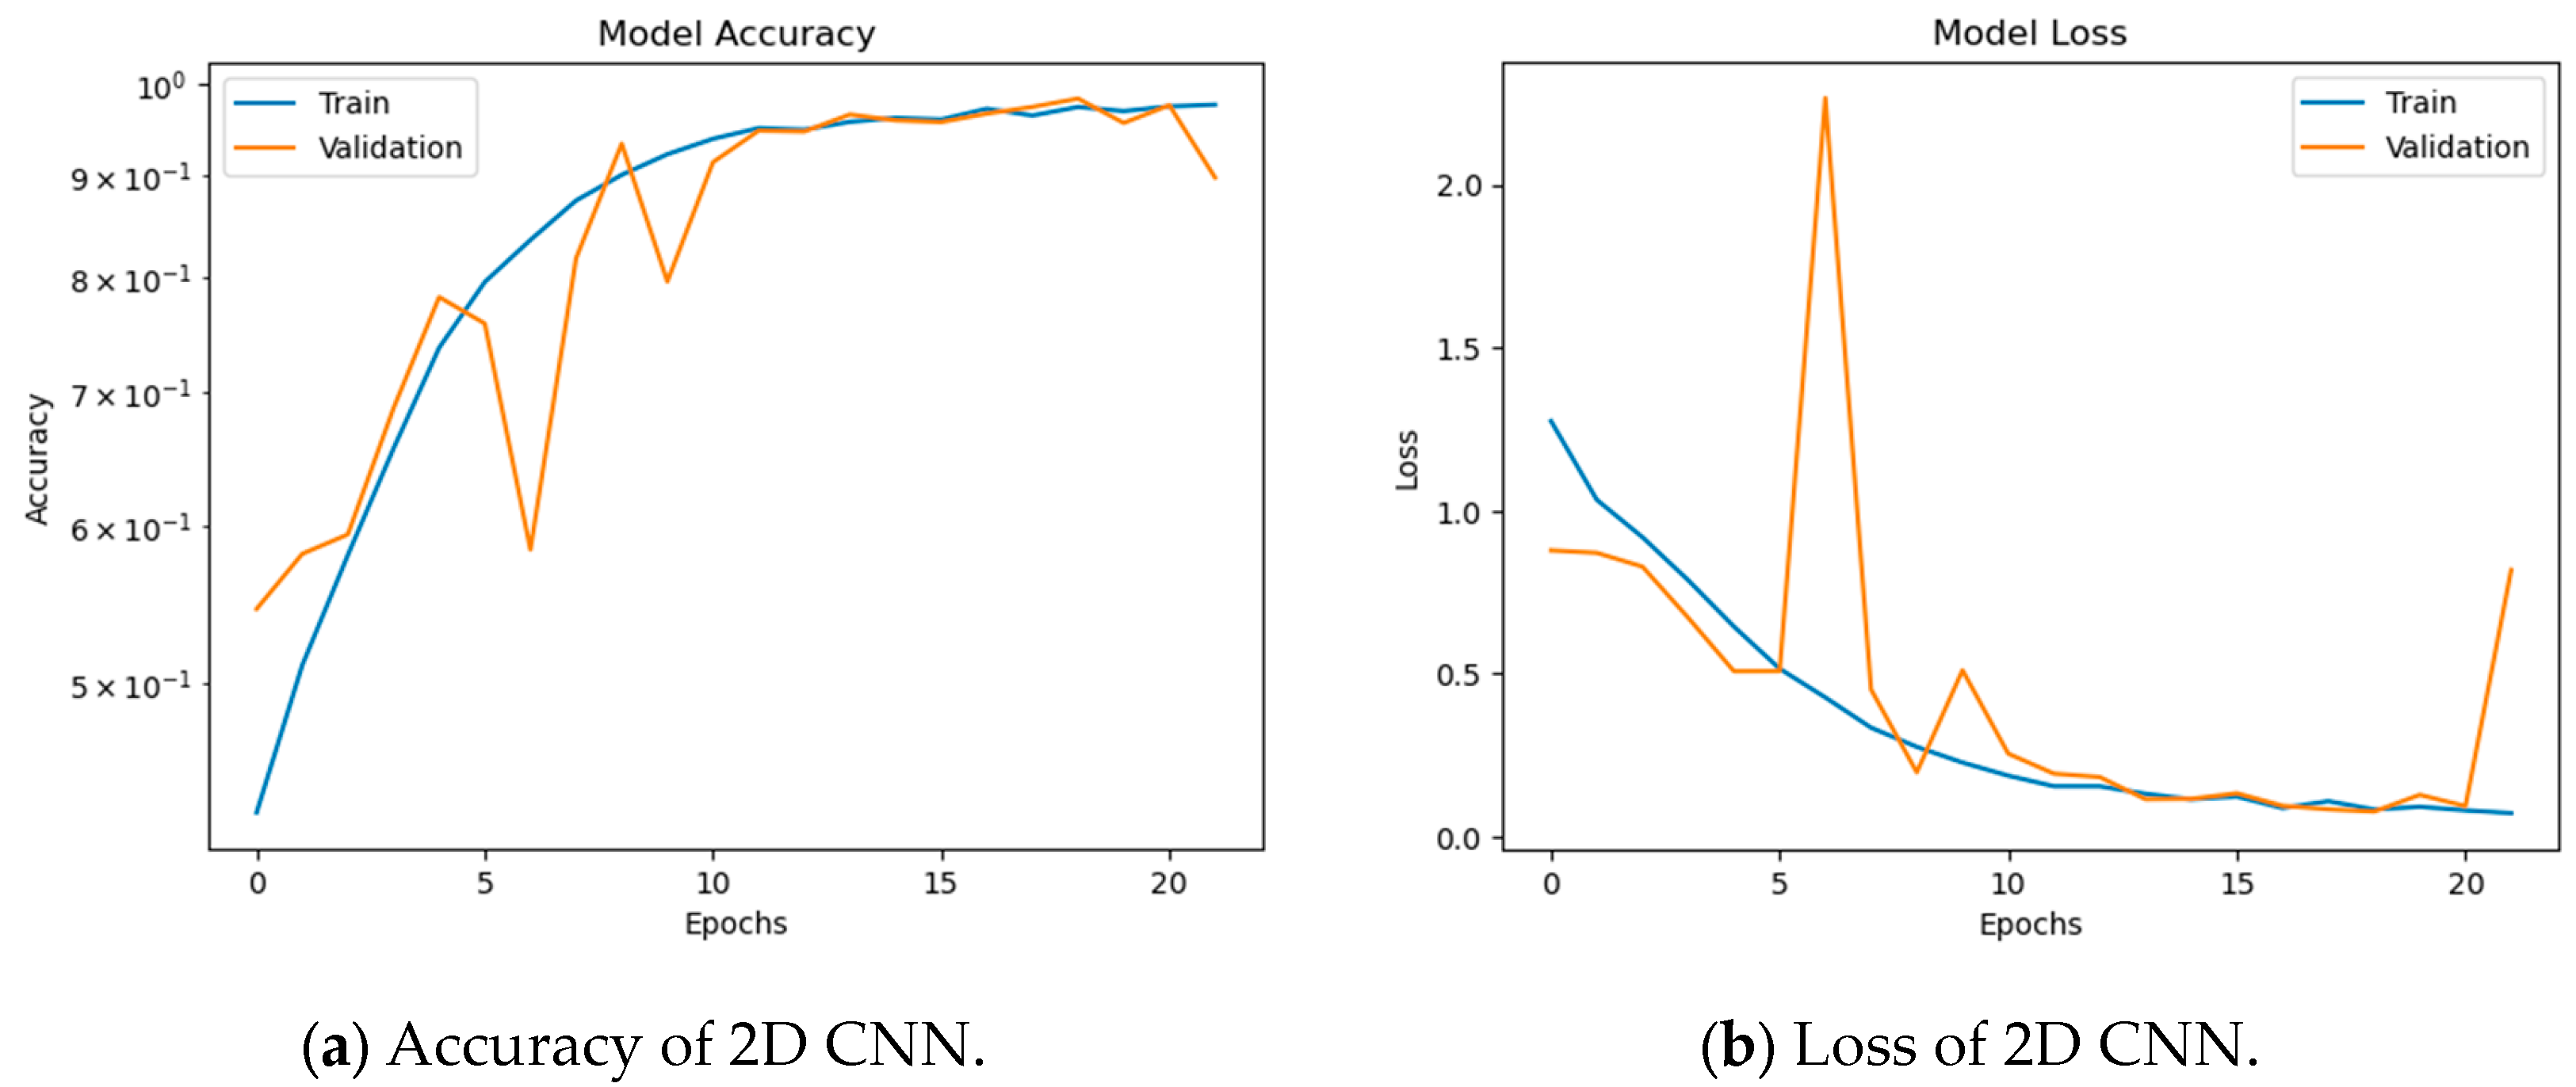
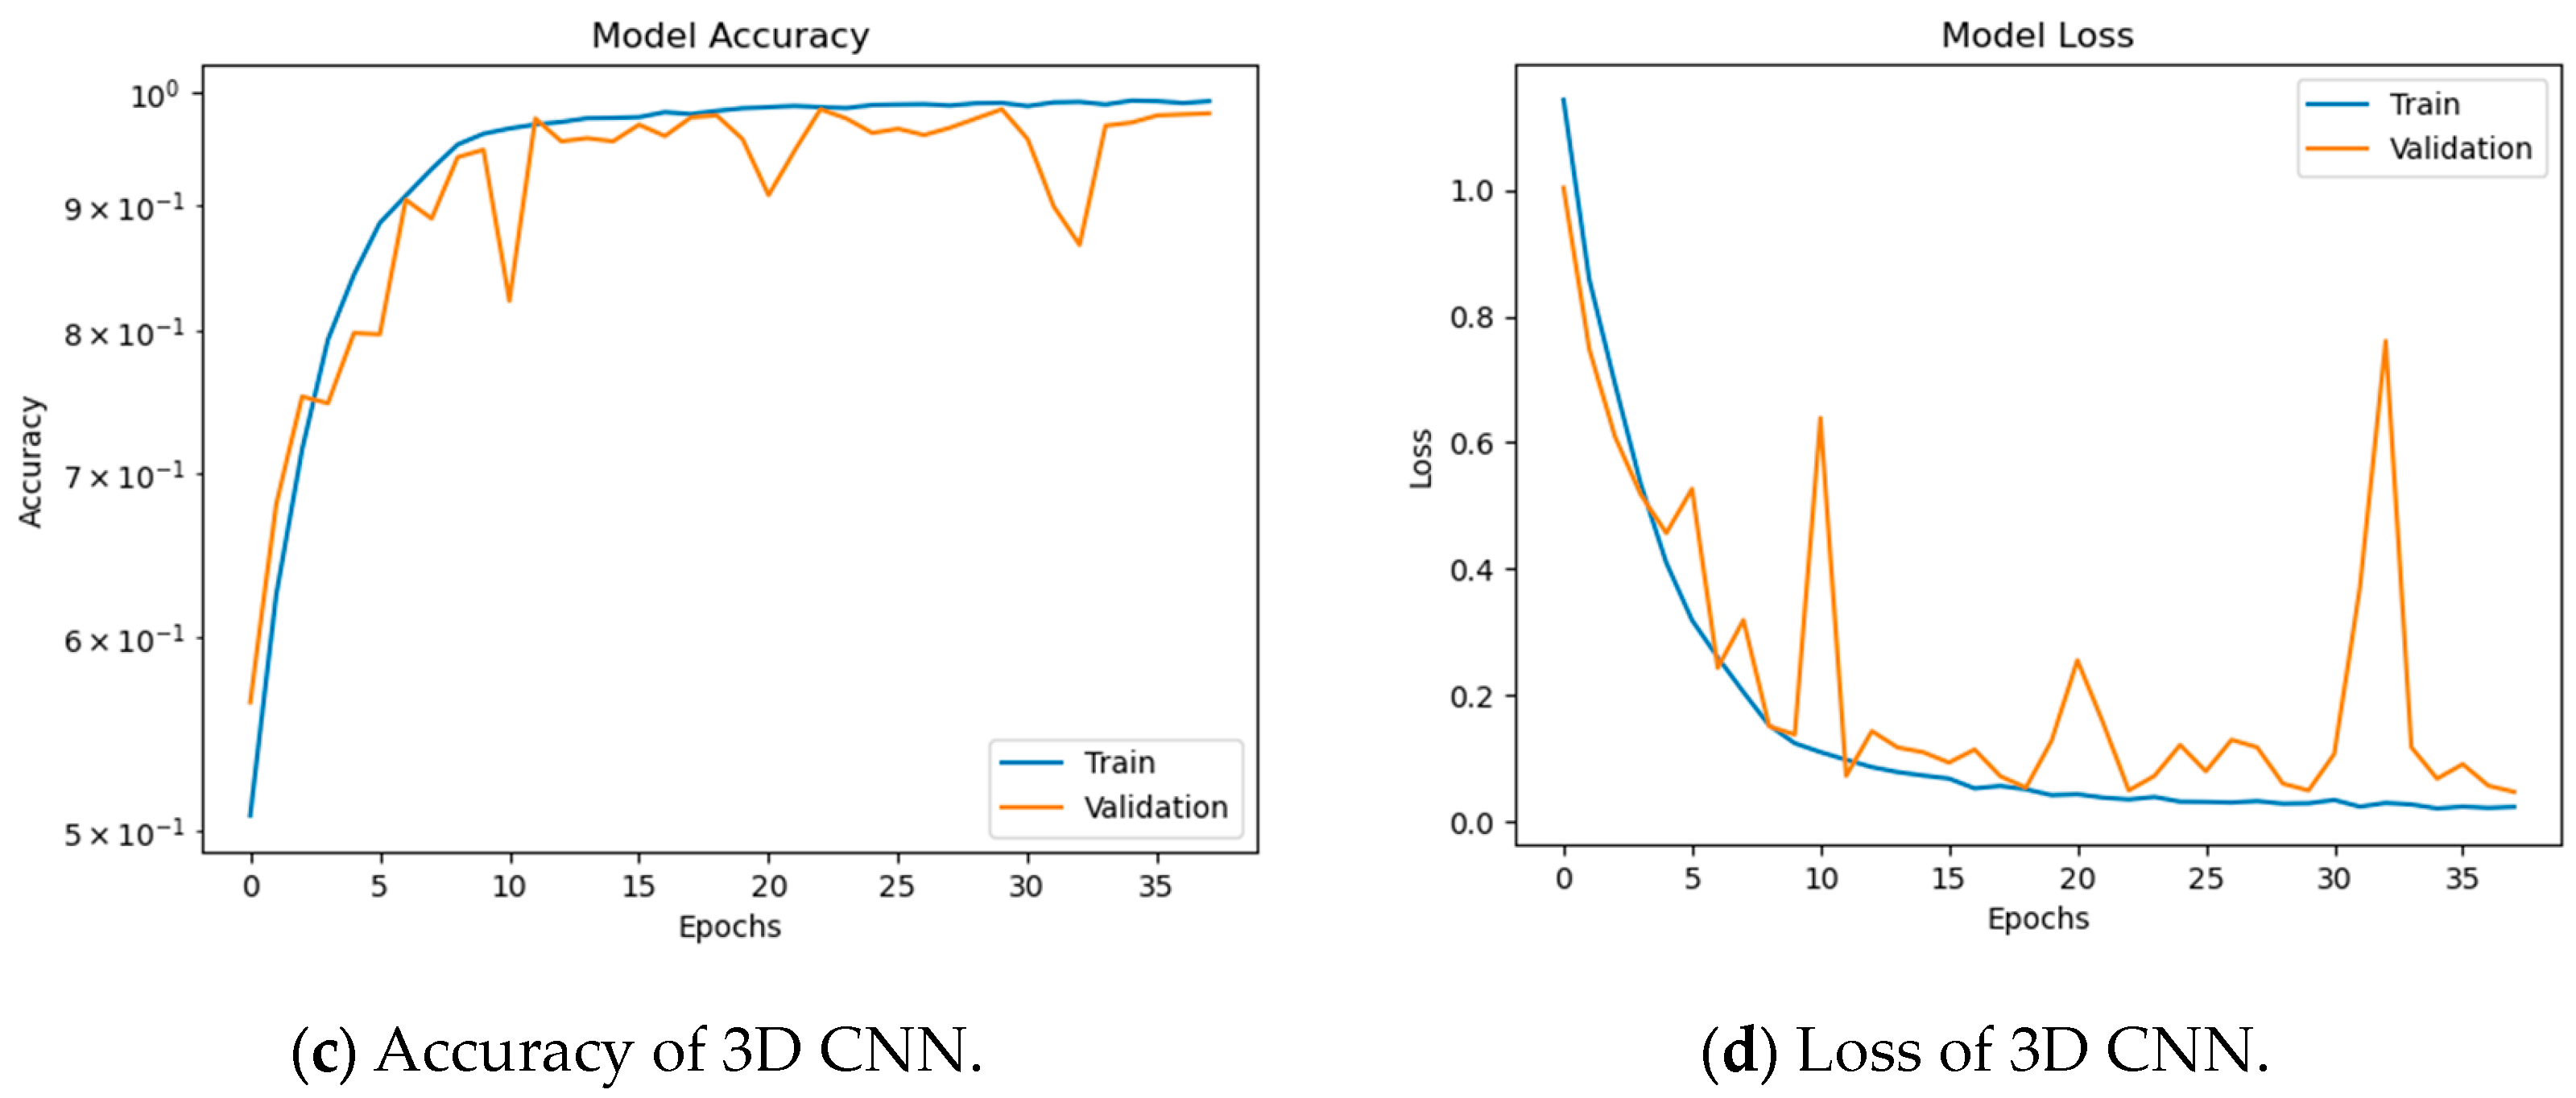
3.4.2. Simulation Results of Drowsiness Image Dataset

Another scenario is proposed in this paper, based on image capturing of the driver. The proposed models are carried out on an image dataset comprising the symptoms of the face. This scenario includes eye closure, opening categories, and whether or not to yawn. Such as in the previous scenario, the proposed machine learning and deep learning models are carried out. The learning curves of the proposed models are shown in Figure 11 and Figure 12 for machine learning and deep learning, respectively. Table 5 illustrates the evaluation metrics of the proposed models. This scenario is more robust rather than the previous one. It can be noticed from the performance of the proposed models. The proposed RF and LR machine learning models achieved an accuracy of 93%. In addition, the proposed 2D and 3D CNNs achieved 95% and 98% accuracy, respectively. Therefore, in this scenario, the proposed 3D CNNs outperform the other proposed models for detecting facial symptoms.

3.4.3. Simulation Results of The Combined Dataset

To provide a general and robust scenario, we combined the image and video datasets and fed them into the proposed models. This scenario provides seven classification categories, including the driver’s status and face symptoms. These categories can be summarized as follows: alert, non-vigilant, tired, eye open, eye closed, yawn, and no yawn. The proposed machine and deep learning models are carried out on the combined dataset to be evaluated. Figure 13 and Figure 14 show the learning curves of the proposed machine learning and deep learning models, respectively. Furthermore, the simulation results of the proposed models are illustrated in Table 6. The simulation results reveal that the proposed RF model outperforms the machine learning models, while 3D CNNs do in the deep learning models. The superior models achieved 90% and 98% accuracy for RF and 3D CNNs, respectively. Therefore. They can be considered efficient solutions for robust conditions.

4. Discussion

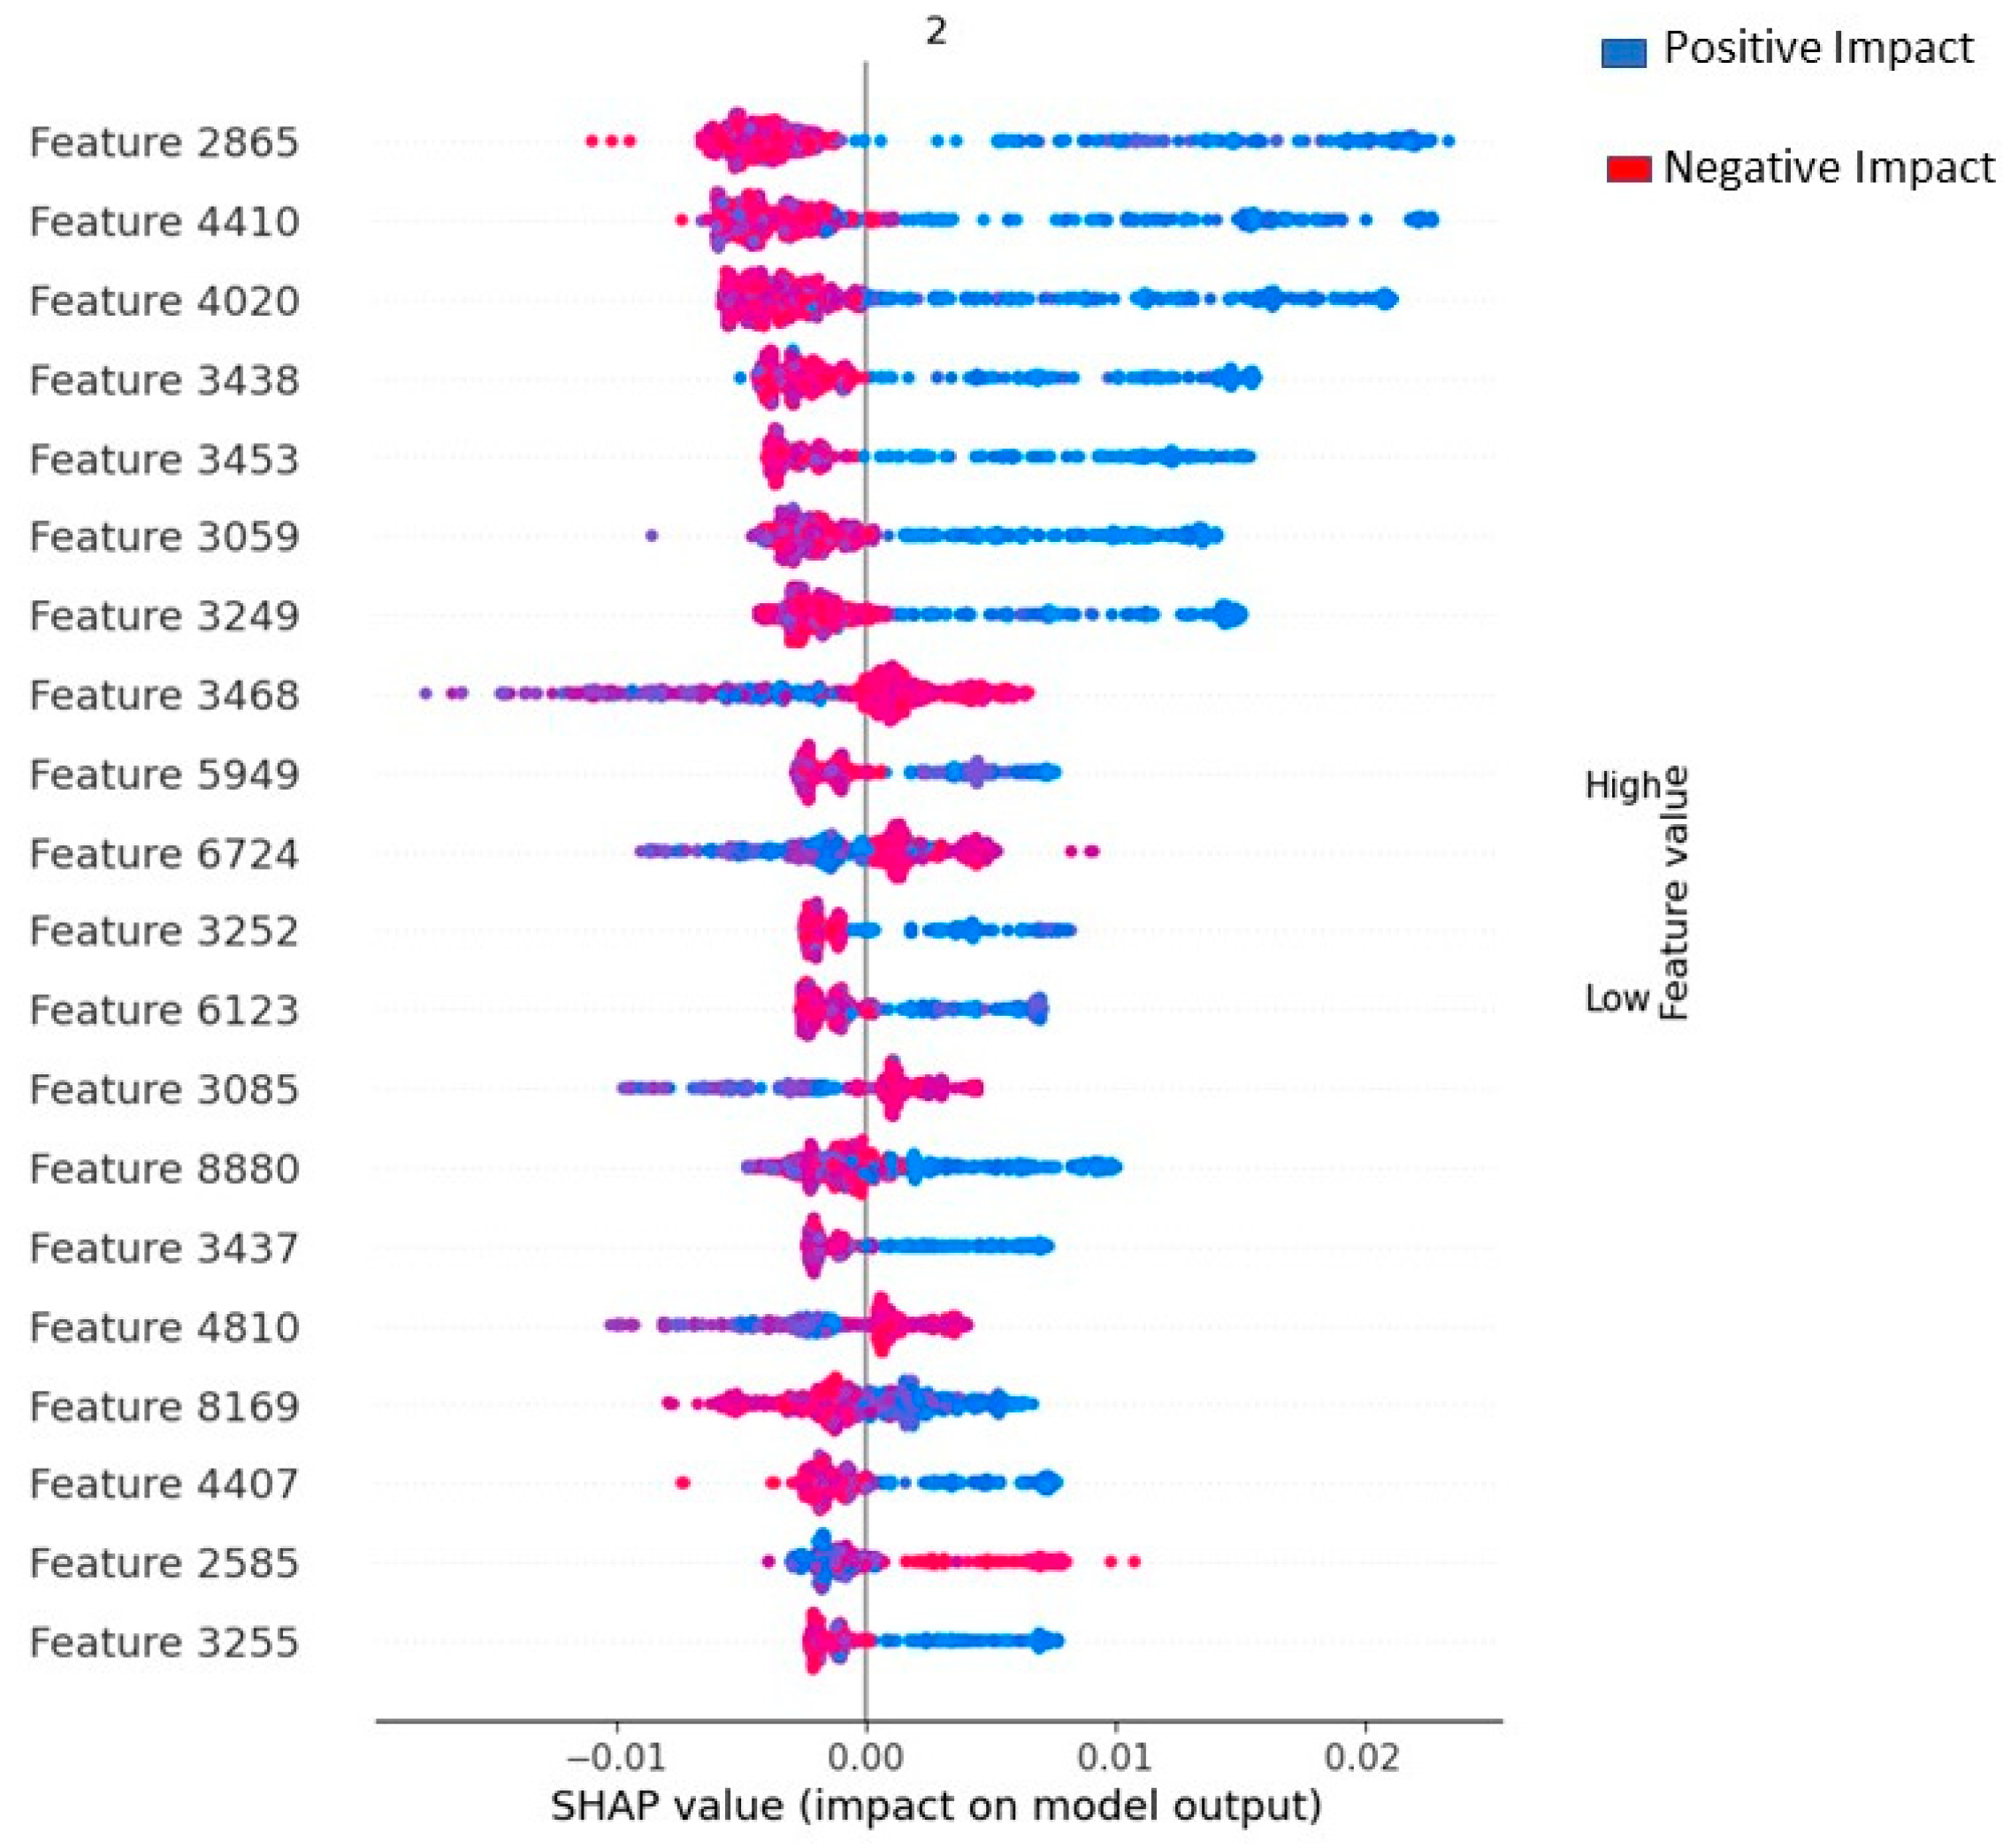
4.1. Explainability and Features Impact

In this section, SHAP summary plots were employed to exhibit the ranking of the features. The SHAP summary plot, as demonstrated in Figure 15, displays the features as lines, with the dot denoting the impact of these features in a specific instance. The colors on the plot denote feature correlation, with blue indicating low correlation and red indicating high correlation. Analysis of the summary plot reveals several key observations: (1) Feature “2865” exerts a significant influence on the overall decision; (2) an increase in this feature has a positive effect on the overall score; (3) conversely, a decrease in the value of features “3255”, “4810”, “6724” has a positive impact on the overall performance of the calculated score. Features with long tails in the right direction are likely to have a positive effect on the total decision.

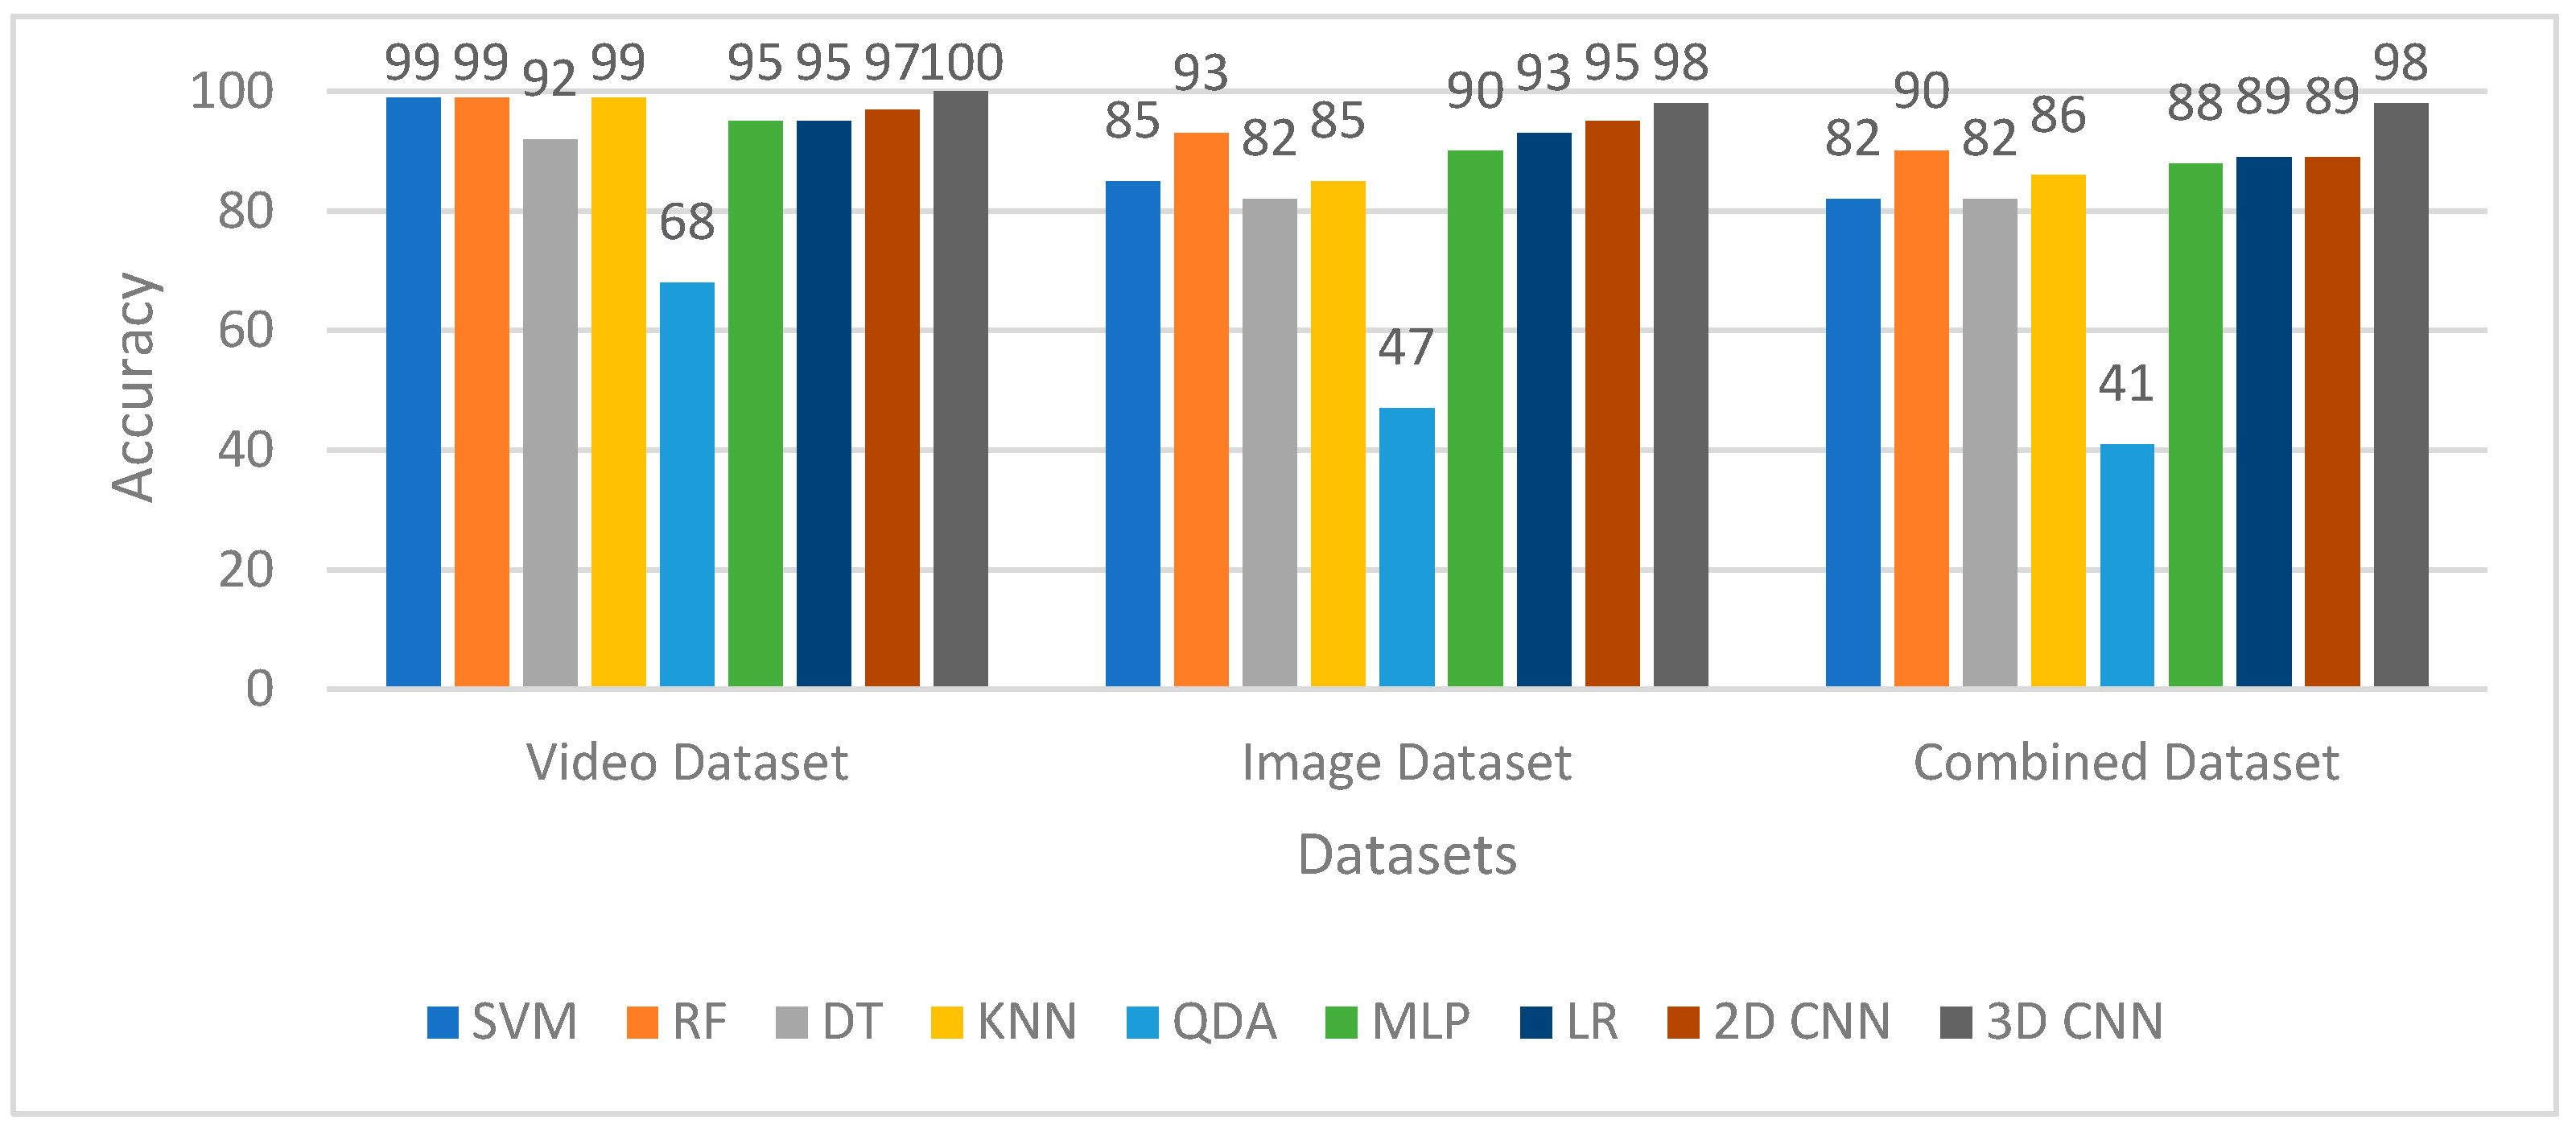
4.2. Results Discussion and Comparison

This research paper presents a system intended for detecting drowsiness based on video and image monitoring. The proposed system encompasses three key tasks: feature extraction, preprocessing, and classification. The Haar Cascaded Classifier (HCC) is utilized to extract the required features, identifying the face and eyes in both images and video frames. Following this, classification is carried out using both machine learning and deep learning algorithms. The effectiveness of the proposed system is evaluated in diverse conditions, including three-class, four-class, and seven-class scenarios. Additionally, the proposed models are compared to identify the optimal method among the proposed alternatives. Figure 16 illustrates a comparative analysis of the proposed models in different scenarios.
Additionally, to demonstrate the effectiveness of the proposed methods, their performance is compared to existing works in the literature. The strategy of this comparison is to include the works which deployed the same methods proposed in this work and those carried out on the same datasets. Specifically, the deep learning approach introduced in this study is compared to similar methods presented by Maior et al. [22], Biswal et al. [26], Jeon et al. [27], Gwak et al. [48], and Bakheet and colleagues [49]. The algorithm proposed by Gwak et al. [49] is included in both comparisons since it involves experiments in both video streaming scenarios. A comparison between the proposed deep learning approach and other video streaming-based algorithms is presented in Table 7. The simulation results indicate that the proposed methods exhibit superior performance and outperform previous efforts in this field.

5. Conclusions

This paper has addressed the issue of fatigue detection and proposed an artificial intelligence-based solution to tackle this problem. The suggested system comprises two main tasks: feature extraction and classification. The HCC algorithm has been employed to extract the relevant features, and several datasets have been used to evaluate the performance of the proposed classifiers, including SVM, RF, DT, KNN, QDA, MLP, RL, 2D CNN, and 3D CNN. The results indicate that the proposed 3D CNN classifier outperforms the other models and achieves superior performance. Additionally, the proposed models exhibit high performance compared with those reported in the literature, making them a promising and effective solution for fatigue detection.
Furthermore, the authors intend to expand the scope of their research in the future by pursuing various ideas. Firstly, the proposed models can be implemented to offer a practical solution to the market. This implementation can be performed using NBIDIA Jetson Nano. Secondly, the proposed models can be subjected to validation using additional datasets that include more categories. Finally, the authors aim to explore the possibility of fatigue detection using fused features obtained from both visual and medical signal modalities.

Author Contributions

Investigation, A.S.; Methodology, A.S.; Resources, H.M.; Validation, M.M. All authors have read and agreed to the published version of the manuscript.

Funding

Princess Nourah bint Abdulrahman University Researchers Supporting Project number (PNURSP2023R137), Princess Nourah bint Abdulrahman University, Riyadh, Saudi Arabia.

Data Availability Statement

Data is available on demand.

Acknowledgments

The authors would like to acknowledge the support of Prince Sultan University for paying the Article Processing Charges (APC) of this publication.

Conflicts of Interest

The authors declare no conflict of interest.

References

  1. Abbas, Q.; Alsheddy, A. Driver Fatigue Detection Systems Using Multi-Sensors, Smartphone, and Cloud-Based Computing Platforms: A Comparative Analysis. Sensors 2020, 21, 56. [Google Scholar] [CrossRef] [PubMed]
  2. Ramzan, M.; Khan, H.U.; Awan, S.M.; Ismail, A.; Ilyas, M.; Mahmood, A. A Survey on State-of-the-Art Drowsiness Detection Techniques. IEEE Access 2019, 7, 61904–61919. [Google Scholar] [CrossRef]
  3. Niloy, A.R.; Chowdhury, A.I.; Sharmin, N. A Brief Review on Different Driver’s Drowsiness Detection Techniques. Int. J. Image Graph. Signal Process. 2020, 10, 41. [Google Scholar]
  4. Choudhary, P.; Sharma, R.; Singh, G.; Das, S. A Survey Paper on Drowsiness Detection & Alarm System for Drivers. Int. Res. J. Eng. Technol. 2016, 3, 1433–1437. [Google Scholar]
  5. Khan, M.Q.; Lee, S. A Comprehensive Survey of Driving Monitoring and Assistance Systems. Sensors 2019, 19, 2574. [Google Scholar] [CrossRef] [PubMed] [Green Version]
  6. Chen, L.; Zhi, X.; Wang, H.; Wang, G.; Zhou, Z.; Yazdani, A.; Zheng, X. Driver Fatigue Detection via Differential Evolution Extreme Learning Machine Technique. Electronics 2020, 9, 1850. [Google Scholar] [CrossRef]
  7. Fuletra, J.D.; Bosamiya, D. A Survey on Drivers Drowsiness Detection Techniques. Int. J. Recent Innov. Trends Comput. Commun. 2013, 1, 816–819. [Google Scholar]
  8. Bergasa, L.M.; Nuevo, J.; Sotelo, M.A.; Barea, R.; Lopez, M.E. Real-Time System for Monitoring Driver Vigilance. IEEE Trans. Intell. Transp. Syst. 2006, 7, 63–77. [Google Scholar] [CrossRef] [Green Version]
  9. Abtahi, S.; Hariri, B.; Shirmohammadi, S. Driver Drowsiness Monitoring Based on Yawning Detection. In Proceedings of the 2011 IEEE International Instrumentation and Measurement Technology Conference, Hangzhou, China, 10–12 May 2011; IEEE: Piscataway, NJ, USA, 2011; pp. 1–4. [Google Scholar]
  10. Flores, M.J.; Armingol, J.M.; de la Escalera, A. Real-Time Warning System for Driver Drowsiness Detection Using Visual Information. J. Intell. Robot. Syst. 2010, 59, 103–125. [Google Scholar] [CrossRef]
  11. Lenskiy, A.A.; Lee, J.-S. Driver’s Eye Blinking Detection Using Novel Color and Texture Segmentation Algorithms. Int. J. Control. Autom. Syst. 2012, 10, 317–327. [Google Scholar] [CrossRef]
  12. Jo, J.; Lee, S.J.; Kim, J.; Jung, H.G.; Park, K.R. Vision-Based Method for Detecting Driver Drowsiness and Distraction in Driver Monitoring System. Opt. Eng. 2011, 50, 127202. [Google Scholar] [CrossRef]
  13. Malla, A.M.; Davidson, P.R.; Bones, P.J.; Green, R.; Jones, R.D. Automated Video-Based Measurement of Eye Closure for Detecting Behavioral Microsleep. In Proceedings of the 2010 Annual International Conference of the IEEE Engineering in Medicine and Biology, Buenos Aires, Argentina, 31 August–4 September 2010; IEEE: Piscataway, NJ, USA, 2010; pp. 6741–6744. [Google Scholar]
  14. Fu, Y.; Fu, H.; Zhang, S. A Novel Safe Life Extension Method for Aircraft Main Landing Gear Based on Statistical Inference of Test Life Data and Outfield Life Data. Symmetry 2023, 15, 880. [Google Scholar] [CrossRef]
  15. Yang, G.; Tang, C.; Liu, X. DualAC2NN: Revisiting and Alleviating Alert Fatigue from the Detection Perspective. Symmetry 2022, 14, 2138. [Google Scholar] [CrossRef]
  16. Xiao, C.; Han, L.; Chen, S. Automobile Driver Fatigue Detection Method Based on Facial Image Recognition under Single Sample Condition. Symmetry 2021, 13, 1195. [Google Scholar] [CrossRef]
  17. Sigari, M.-H.; Fathy, M.; Soryani, M. A Driver Face Monitoring System for Fatigue and Distraction Detection. Int. J. Veh. Technol. 2013, 2013, 263983. [Google Scholar] [CrossRef] [Green Version]
  18. Vijayan, V.; Sherly, E. Real Time Detection System of Driver Drowsiness Based on Representation Learning Using Deep Neural Networks. J. Intell. Fuzzy Syst. 2019, 36, 1977–1985. [Google Scholar] [CrossRef]
  19. Galarza, E.E.; Egas, F.D.; Silva, F.M.; Velasco, P.M.; Galarza, E.D. Real Time Driver Drowsiness Detection Based on Driver’s Face Image Behavior Using a System of Human Computer Interaction Implemented in a Smartphone. In Proceedings of the International Conference on Information Technology & Systems, San Francisco, CA, USA, 13–16 December 2018; Springer: Berlin/Heidelberg, Germany, 2018; pp. 563–572. [Google Scholar]
  20. Arceda, V.E.M.; Nina, J.P.C.; Fabian, K.M.F. A Survey on Drowsiness Detection Techniques. In Proceedings of the Iberoamerican Conference of Computer Human Interaction, Arequipa, Perú, 16–18 September 2020; Volume 15, p. 2021. [Google Scholar]
  21. Ouabida, E.; Essadike, A.; Bouzid, A. Optical Correlator Based Algorithm for Driver Drowsiness Detection. Optik 2020, 204, 164102. [Google Scholar] [CrossRef]
  22. Maior, C.B.S.; das Chagas Moura, M.J.; Santana, J.M.M.; Lins, I.D. Real-Time Classification for Autonomous Drowsiness Detection Using Eye Aspect Ratio. Expert Syst. Appl. 2020, 158, 113505. [Google Scholar] [CrossRef]
  23. Saurav, S.; Mathur, S.; Sang, I.; Prasad, S.S.; Singh, S. Yawn Detection for Driver’s Drowsiness Prediction Using Bi-Directional LSTM with CNN Features. In Proceedings of the International Conference on Intelligent Human Computer Interaction, Copenhagen, Denmark, 19–24 July 2020; Springer: Berlin/Heidelberg, Germany, 2020; pp. 189–200. [Google Scholar]
  24. Abtahi, S.; Omidyeganeh, M.; Shirmohammadi, S.; Hariri, B. YawDD: A Yawning Detection Dataset. In Proceedings of the 5th ACM Multimedia Systems Conference, Singapore, 19–21 March 2014; pp. 24–28. [Google Scholar]
  25. Weng, C.-H.; Lai, Y.-H.; Lai, S.-H. Driver Drowsiness Detection via a Hierarchical Temporal Deep Belief Network. In Proceedings of the Asian Conference on Computer Vision, Taipei, Taiwan, 20–24 November 2016; Springer: Berlin/Heidelberg, Germany, 2017; pp. 117–133. [Google Scholar]
  26. Biswal, A.K.; Singh, D.; Pattanayak, B.K.; Samanta, D.; Yang, M.-H. IoT-Based Smart Alert System for Drowsy Driver Detection. Wirel. Commun. Mob. Comput. 2021, 2021, 6627217. [Google Scholar] [CrossRef]
  27. Jeon, Y.; Kim, B.; Baek, Y. Ensemble CNN to Detect Drowsy Driving with In-Vehicle Sensor Data. Sensors 2021, 21, 2372. [Google Scholar] [CrossRef]
  28. Sedik, A.; Marey, M.; Mostafa, H. WFT-Fati-Dec: Enhanced Fatigue Detection AI System Based on Wavelet Denoising and Fourier Transform. Appl. Sci. 2023, 13, 2785. [Google Scholar] [CrossRef]
  29. Kamaruzzaman, M.A.; Othman, M.; Hassan, R.; Rahman, A.W.A.; Mahri, N. EEG Features for Driver’s Mental Fatigue Detection: A Preliminary Work. Int. J. Perceptive Cogn. Comput. 2023, 9, 88–94. [Google Scholar]
  30. Feng, W.; Zeng, K.; Zeng, X.; Chen, J.; Peng, H.; Hu, B.; Liu, G. Predicting Physical Fatigue in Athletes in Rope Skipping Training Using ECG Signals. Biomed. Signal Process. Control 2023, 83, 104663. [Google Scholar] [CrossRef]
  31. Alharbey, R.; Dessouky, M.M.; Sedik, A.; Siam, A.I.; Elaskily, M.A. Fatigue State Detection for Tired Persons in Presence of Driving Periods. IEEE Access 2022, 10, 79403–79418. [Google Scholar] [CrossRef]
  32. Zhu, M.; Chen, J.; Li, H.; Liang, F.; Han, L.; Zhang, Z. Vehicle Driver Drowsiness Detection Method Using Wearable EEG Based on Convolution Neural Network. Neural Comput. Appl. 2021, 33, 13965–13980. [Google Scholar] [CrossRef]
  33. Hemantkumar, B.; Shashikant, D. Non-Intrusive Detection and Prediction of Driver’s Fatigue Using Optimized Yawning Technique. Mater. Today Proc. 2017, 4, 7859–7866. [Google Scholar] [CrossRef]
  34. Knapik, M.; Cyganek, B. Driver’s Fatigue Recognition Based on Yawn Detection in Thermal Images. Neurocomputing 2019, 338, 274–292. [Google Scholar] [CrossRef]
  35. Liu, Z.; Peng, Y.; Hu, W. Driver Fatigue Detection Based on Deeply-Learned Facial Expression Representation. J. Vis. Commun. Image Represent. 2020, 71, 102723. [Google Scholar] [CrossRef]
  36. Devos, H.; Alissa, N.; Lynch, S.; Sadeghi, M.; Akinwuntan, A.E.; Siengsukon, C. Real-Time Assessment of Daytime Sleepiness in Drivers with Multiple Sclerosis. Mult. Scler. Relat. Disord. 2021, 47, 102607. [Google Scholar] [CrossRef]
  37. Siam, A.I.; Soliman, N.F.; Algarni, A.D.; Abd El-Samie, F.E.; Sedik, A. Deploying Machine Learning Techniques for Human Emotion Detection. Comput. Intell. Neurosci. 2022, 2022, 8032673. [Google Scholar] [CrossRef]
  38. El-Moneim, S.A.; Sedik, A.; Nassar, M.A.; El-Fishawy, A.S.; Sharshar, A.M.; Hassan, S.E.A.; Mahmoud, A.Z.; Dessouky, M.I.; El-Banby, G.M.; El-Samie, F.E.A.; et al. Text-Dependent and Text-Independent Speaker Recognition of Reverberant Speech Based on CNN. Int. J. Speech Technol. 2021, 24, 993–1006. [Google Scholar] [CrossRef]
  39. Ali, A.M.; Benjdira, B.; Koubaa, A.; El-Shafai, W.; Khan, Z.; Boulila, W. Vision Transformers in Image Restoration: A Survey. Sensors 2023, 23, 2385. [Google Scholar] [CrossRef]
  40. Hammad, M.; Abd El-Latif, A.A.; Hussain, A.; Abd El-Samie, F.E.; Gupta, B.B.; Ugail, H.; Sedik, A. Deep Learning Models for Arrhythmia Detection in IoT Healthcare Applications. Comput. Electr. Eng. 2022, 100, 108011. [Google Scholar] [CrossRef]
  41. Ibrahim, F.E.; Emara, H.M.; El-Shafai, W.; Elwekeil, M.; Rihan, M.; Eldokany, I.M.; Taha, T.E.; El-Fishawy, A.S.; El-Rabaie, E.M.; Abdellatef, E. Deep Learning-based Seizure Detection and Prediction from EEG Signals. Int. J. Numer. Method. Biomed. Eng. 2022, 38, e3573. [Google Scholar] [CrossRef]
  42. Shoaib, M.R.; Emara, H.M.; Elwekeil, M.; El-Shafai, W.; Taha, T.E.; El-Fishawy, A.S.; El-Rabaie, E.-S.M.; El-Samie, F.E.A. Hybrid Classification Structures for Automatic COVID-19 Detection. J. Ambient Intell. Humaniz. Comput. 2022, 13, 4477–4492. [Google Scholar] [CrossRef]
  43. Daoui, A.; Yamni, M.; Karmouni, H.; Sayyouri, M.; Qjidaa, H.; Motahhir, S.; Jamil, O.; El-Shafai, W.; Algarni, A.D.; Soliman, N.F. Efficient Biomedical Signal Security Algorithm for Smart Internet of Medical Things (IoMTs) Applications. Electronics 2022, 11, 3867. [Google Scholar] [CrossRef]
  44. Li, L.; Jamieson, K.; DeSalvo, G.; Rostamizadeh, A.; Talwalkar, A. Hyperband: A Novel Bandit-Based Approach to Hyperparameter Optimization. J. Mach. Learn. Res. 2017, 18, 6765–6816. [Google Scholar]
  45. Crammer, K.; Singer, Y. On the Algorithmic Implementation of Multiclass Kernel-Based Vector Machines. J. Mach. Learn. Res. 2001, 2, 265–292. [Google Scholar]
  46. Massoz, Q.; Langohr, T.; François, C.; Verly, J.G. The ULg Multimodality Drowsiness Database (Called DROZY) and Examples of Use. In Proceedings of the 2016 IEEE Winter Conference on Applications of Computer Vision (WACV), Lake Placid, NY, USA, 7–10 March 2016; IEEE: Piscataway, NJ, USA, 2016; pp. 1–7. [Google Scholar]
  47. Bolboacă, S.D.; Jäntschi, L. Sensitivity, Specificity, and Accuracy of Predictive Models on Phenols Toxicity. J. Comput. Sci. 2014, 5, 345–350. [Google Scholar] [CrossRef]
  48. Gwak, J.; Hirao, A.; Shino, M. An Investigation of Early Detection of Driver Drowsiness Using Ensemble Machine Learning Based on Hybrid Sensing. Appl. Sci. 2020, 10, 2890. [Google Scholar] [CrossRef]
  49. Bakheet, S.; Al-Hamadi, A. A Framework for Instantaneous Driver Drowsiness Detection Based on Improved HOG Features and Naïve Bayesian Classification. Brain Sci. 2021, 11, 240. [Google Scholar] [CrossRef] [PubMed]
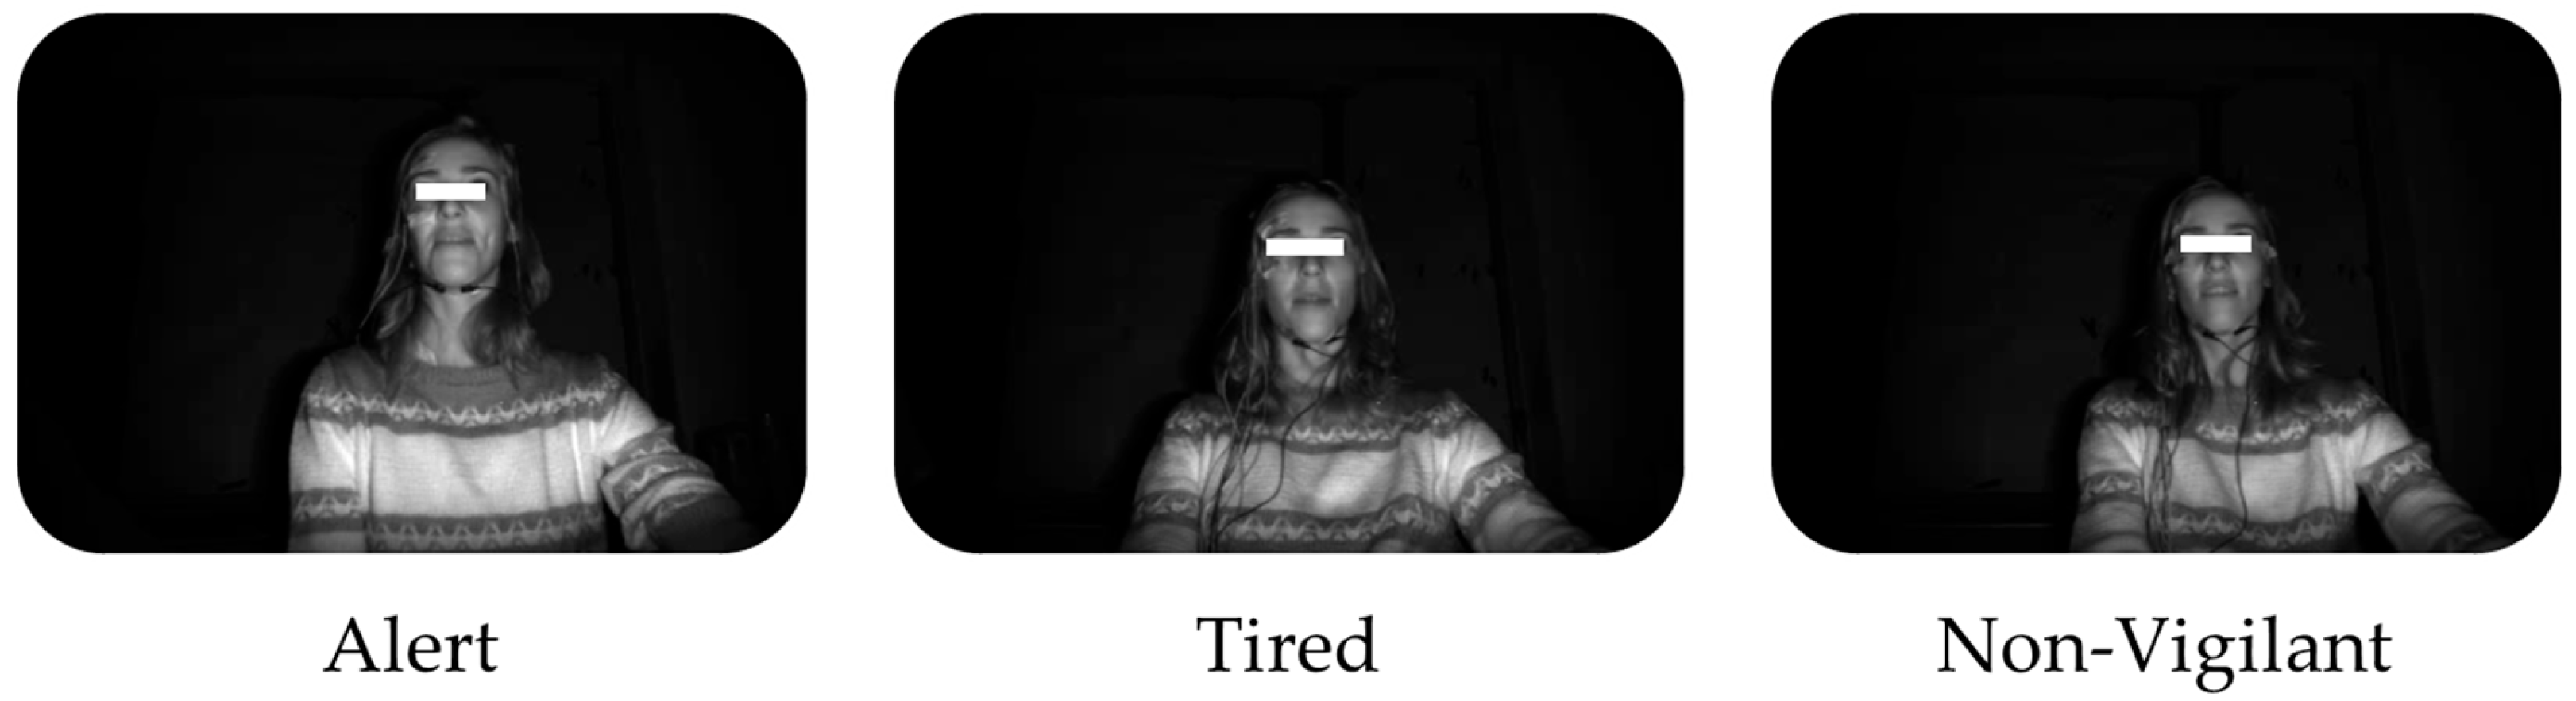
Figure 1. Overview of the principal methodologies employed in fatigue detection systems.
Symmetry 15 01274 g001
Figure 2. Proposed fatigue detection system (with a sample from database in [24]).
Symmetry 15 01274 g002
Figure 3. Proposed data augmentation technique.
Symmetry 15 01274 g003
Figure 4. Architecture of the proposed 3D CNN model.
Symmetry 15 01274 g004
Figure 5. Architecture of the proposed 2D CNN model.
Symmetry 15 01274 g005
Figure 6. Examples of intensity scenes produced from DROZY video frames [46].
Symmetry 15 01274 g006
Figure 7. Sample of Drowsiness Dataset [24].
Symmetry 15 01274 g007
Figure 8. Visualization of The Hyperparameter Optimization Process (Each color represent an itration).
Symmetry 15 01274 g008
Figure 9. Example of machine learning and performance curves (SVM) for DROZY dataset.
Symmetry 15 01274 g009
Figure 10. Proposed Deep Learning Models for Multiclass Scenario Learning and Performance Curves for DROZY Dataset.
Symmetry 15 01274 g010aSymmetry 15 01274 g010b
Figure 11. Example of machine learning and performance curves (SVM) for images dataset.
Symmetry 15 01274 g011
Figure 12. Proposed Deep Learning Models for Multiclass Scenario Learning and Performance Curves for Images Dataset.
Symmetry 15 01274 g012
Figure 13. Example of machine learning and performance curves (SVM) for combined dataset.
Symmetry 15 01274 g013
Figure 14. Proposed Deep Learning Models for Multiclass Scenario Learning and Performance Curves for Combined Dataset.
Symmetry 15 01274 g014aSymmetry 15 01274 g014b
Figure 15. Analysis of The Impact of The Input Features on The Decision.
Symmetry 15 01274 g015
Figure 16. Brief Comparison of The Proposed System in different scenarios.
Symmetry 15 01274 g016
Table 1. Summary of the number of images in the DROZY dataset [46].
PersonNumber of Frames
AlertNon-VigilantTired
117,86515,19514,185
217,89914,15613,033
317,88213,54014,198
617,78913,07914,272
717,89814,16313,167
817,91314,19814,331
1017,86317,88614,204
1117,86617,90014,339
1217,91417,86117,972
1317,88917,90817,889
1417,90217,19817,875
Table 2. Hyperparameters of The Proposed Methods.
ModelHyperparameters
SVMC|275
Gamma|‘scale’
Kernel|‘rbf’
RFNumber of estimators|79
Criterion|‘entropy’
DTCriterion|‘gini’
Minimum samples leaf|1
Minimum samples split|2
CCP Alpha|0
KNNNumber of neighbors|1
Leaf size|30
Metric|‘minkowski’
P|2
Weights Distribution|‘uniform’
QDATol|0.0001
MLPNumber of hidden layers|2
Hidden layer_sizes|[44,45]
Activation|‘relu’
Maximum number of iterations|200
Optimizer|‘adam’
LROptimizer|‘lbfgs’
C|1.0
Fit intercept|True
2D CNNOptimizer|‘adam’
Epochs|Automatic (using Early_Stopping technique)
Batch size|20
Activation function|‘relu’
Learning rate|0.01
3D CNNOptimizer|‘adam’
Epochs: Automatic (using Early_Stopping technique)
Batch size|20
Activation function|‘relu’
Learning rate: 0.01
Table 3. Sample of iterations for Hyperparameter Optimization.
Hyper ParameterAccuracy
Learning RateOptimizer
0.01adam1
0.001rmsprop1
0.01adam1
0.001rmsprop0.9990
0.01rmsprop0.9990
0.01rmsprop0.9990
0.01adam0.9990
0.001adam0.99904
0.001rmsprop0.9910
0.001adam0.9900
0.01adam0.9900
0.01adam0.9890
0.001adam0.9880
0.001adam0.9871
Table 4. Brief Comparison among The Proposed Machine Learning Models for DROZY Dataset.
ModelPrecisionRecallF1-ScoreAccuracyTesting Time (ms)
SVM100999999187
RF100991009931
DT9292929220
KNN100991009916
QDA6868686840
MLP9595959530
LR9595959510
2D CNN97979797120
3D CNN100100100100124
Table 5. Brief Comparison among The Proposed Machine Learning Models for Images Dataset.
ModelPrecisionRecallF1-ScoreAccuracyTesting Time (ms)
SVM86858585194
RF9393939339
DT8182828225
KNN8685858520
QDA4747474754
MLP9090909032
LR9393939315
2D CNN9594959512.4
3D CNN9898989816.9
Table 6. Brief Comparison among The Proposed Machine Learning Models for Combined Dataset.
ModelPrecisionRecallF1-ScoreAccuracyTesting Time (ms)
SVM83828282214
RF9090909065
DT8282828253
KNN8786868633
QDA4241414127
MLP8988888841
LR8989898920
2D CNN9189908919
3D CNN9898989825
Table 7. Brief Comparison of The Proposed Models and Works in The Literature.
WorkDatasetMethodPrecisionRecallF1-ScoreAccuracy
Maior et al. [22] DROZYSVM---94
Biswal et al. [26]CollectedCNN97.0797.1397.6597.1
Jeon et al. [27]ETS2CNN93.994.7494.1894.2
Gwak et al. [48]CollectedEnsemble ML97.193.594.995.4
Bakheet et al. [49]NTHU-DDDNaïve Bayes--87.8485.62
Knapik et al. [34]Thermal ImagesCNN--87-
Hemantkumar et al. [33]Mouth imagesOptimization---84.66
Liu [35]FDDBCNN---96.7
ProposedDROZYSVM100999999
RF1009910099
KNN1009910099
2D CNN97979797
3D CNN100100100100
Disclaimer/Publisher’s Note: The statements, opinions and data contained in all publications are solely those of the individual author(s) and contributor(s) and not of MDPI and/or the editor(s). MDPI and/or the editor(s) disclaim responsibility for any injury to people or property resulting from any ideas, methods, instructions or products referred to in the content.

