Abstract
Previous studies performed on 2-(azulen-1-yldiazenyl)-5-phenyl-1,3,4-thiadiazole (T) showed that T is a ligand with complexing properties towards heavy metals (HMs) in solution and can be attached to electrode surfaces. Films of T were deposited on glassy carbon to obtain chemically modified electrodes (T-CMEs), either through scanning or using controlled potential electrolysis in tetrabutylammonium perchlorate in acetonitrile. They were investigated using cyclic voltammetry (CV), differential pulse voltammetry (DPV), electrochemical impedance spectroscopy (EIS), and spectroelectrochemistry. All methods provided evidence for showing the formation of insulating films, with properties depending on their electropolymerization potential. CV and EIS studies of T-CMEs in tetrabutylammonium perchlorate in acetonitrile as supporting electrolyte, and in the presence of a ferrocene redox probe resulted in a thickness of ~10 µm, an active surface area about 6 times higher than the geometrical one, and conductivity of about 10−6 S/cm. This characterization performed using voltammetric techniques reveals the symmetry of the reversible anodic and cathodic redox CV peaks for the polymer, while spectroelectrochemistry shows the intensification of the charge transport process through polarons, due to the anodic polarization of the film.
1. Introduction
Azulenes are interesting building blocks for the synthesis of new advanced materials, due to the low ionization energy and high electron mobility of azulene moiety among the classical electropolymerizable monomers, such as pyrrole and thiophene [1]. Our research is concerned with the characterization of azulene ligands, and the building of complexing modified electrodes based on azulenes. During anodic oxidation, azulene undergoes electrochemical polymerization, leading to the formation of polymer films at the electrode surface. These revealed interesting properties due to the presence of specific complexing groups that can be attached to the initial ligand structure. Modified electrodes based on azulene are of great interest due to their application in the detection of different targets. Even if polyazulenes prepared with electropolymerization have been reported, their low solubility has made their characterization difficult [1]. There are, however, a few reports to date on azulene-containing conjugated polymers [2,3,4,5,6].
2-(azulen-1-yldiazenyl)-5-phenyl-1,3,4-thiadiazole (T) was considered for synthesis and development of new antimicrobial agent structures [7]. Previous studies carried out on T showed also that it is a ligand with complexing properties against heavy metals [4]. Its complexing capacity was also tested for the heterogeneous recognition of heavy metals (HMs) using electrodes modified with T. Films of T were deposited through direct electropolymerization on glassy carbon surfaces to obtain chemically modified electrodes based on T (T-CMEs). These were characterized using electrochemistry in acetonitrile solutions in the presence of tetrabutylammonium perchlorate as the supporting electrolyte, and using AFM, SEM, in view of HMs sensing [8]. The study of the CMEs’ surface properties revealed features of the film morphology obtained in different conditions, and the main role of electrosynthesis potential in electrode nanostructure. A previous study indicated the best conditions to obtain CMEs with good results for HM ion recognition (selective detection of Pb(II) among Cd(II), Cu(II), and Hg(II)).
The present study reveals the main characteristics of the T-CMEs deposited on glassy carbon surfaces in conditions that ensure the best analytical response in HMs analysis. They were investigated using electrochemical impedance spectroscopy (EIS), cyclic voltammetry (CV), differential pulse voltammetry (DPV), and spectroelectrochemistry. EIS measurement may be used as an effective characterization method by evaluating the charge transfer of the electrochemical system [9,10,11,12]. The studies of the films were performed in an acetonitrile-based supporting electrolyte, and in the presence of redox assay probe (ferrocene). The main parameters, obtained by fitting EIS curves, correlated with CV and DPV results, and resulted in finding their thickness and conductivity. Films properties were also investigated using spectroelectrochemistry in acetonitrile solutions.
2. Materials and Methods
The T monomer was obtained following the previously described method [13]. CMEs based on T were synthesized according to the recently published procedure [8]. The experiments concerning their electrochemical behaviour were performed in acetonitrile (CH3CN), containing 0.1 M tetrabutylammonium perchlorate (TBAP), used as solvent and supporting electrolyte, both from Fluka (Munich, Germany).
Autolab potentiotstat/galvanostat 302 N (Ecochemie, The Netherlands) was connected to a three-electrode cell. The working electrode (WE) was a glassy carbon disk (with 3 mm diameter) (Metrohm, Herisau, Switzerland), used bare or modified with T. As an auxiliary electrode (AE), a glassy carbon rod (Metrohm) was used, and Ag/10 mM AgNO3, 0.1 M TBAP, CH3CN or Ag/AgCl/KCl (3 M) served as a reference electrode (RE), in electrochemical experiments performed in acetonitrile or water solutions, respectively. The potentials were finally calibrated to the potential of the ferrocene/ferrocenium redox couple (Fc/Fc+) in experiments performed in acetonitrile solutions.
Cyclic voltammetry (CV) curves were recorded at a scan rate of 0.1 V/s, and differential pulse voltammetry (DPV) curves at 0.01 V/s, with a pulse height of 0.025 V and a step time of 0.2 s. The glassy carbon working electrode was polished with diamond paste (2 µm) on felt prior to each determination, rinsed with solvent afterwards, and dried with fine paper.
EIS studies were performed on Autolab potentiotstat/galvanostat 302 N within 100 kHz–100 mHz. All experiments were performed in an in-line arrangement for RE, WE, CE. The curves were recorded with a 10 mV AC voltage and the spectra were processed using Z View 2.4 software from Scribner Association Inc. Derek Johnson.
All experiments were performed at room temperature (25 °C). Modified electrodes have been obtained either through scanning or using controlled potential electrolysis (CPE) at 1.5 V vs. RE using an electrical charge of 1.5 mC in solutions of the ligand T (1 mM) in 0.1 M TBAP, CH3CN.
The optical studies were performed in a spectroelectrochemistry cell on indium tin oxide (ITO) as the WE, a glassy carbon bar (10 cm) as the AE, and Ag/AgCl/KCl as the RE. The spectra acquisition was carried out at 400 nm/min.
The repeatability evaluated from 3 experiments performed in the same conditions was of about 95% for CPE (using the ferrocene redox probe), 80% for EIS studies, and 90% for the CV and DPV curves.
3. Results
3.1. Obtaining Chemically Modified Electrodes Based on T (T-CMEs)
The main processes evidenced during the oxidation of T on glassy carbon electrode [1] are situated at positive potentials in the range 0.70–1.50 V. Accordingly, polymeric films based on T were prepared on glassy carbon using electropolymerization at these potentials, resulting in chemically modified electrodes (T-CMEs). Their formation was achieved in the current experiments through potential scanning at different anodic limits (Figure 1 and Figure 2) or using CPE in 1 mM T solutions in 0.1 M TBAP, CH3CN. In Figure 1a, the first four CV cycles in the range of the a1 process were compared. The arrows indicate the evolution of the currents at different potentials. A slight increase of the current in the reverse scan at −0.15 V was observed and this was named process b. If the anodic limit of potential scans is shifted from 1.1 to 1.25 V (vs. RE) in the domain of the a2 process (Figure 1b), the process b was put in evidence more clearly, with two cathodic peaks b1 and b2, and an anodic peak b’. The potential of the b1 peak shifts progressively to more negative values with the increase of the number of scans. All these processes were not observed in the absence of the T ligand in the supporting electrolyte (Figure 2).
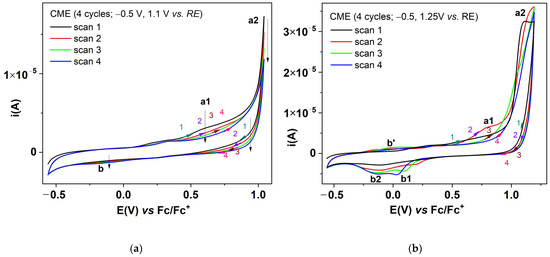
Figure 1.
Successive CV (50 mV/s) curves during the CMEs’ preparation using potential scanning in the potential range (vs. RE): (a) −0.6 and 1.1 V; (b) −0.6 and 1.25 V.
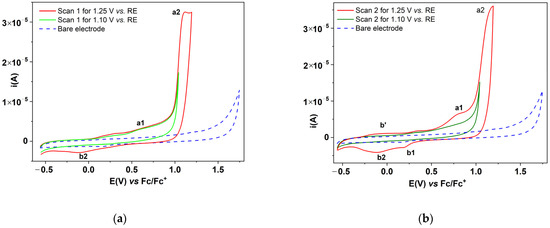
Figure 2.
CV curves (50 mV/s) in solutions of T (1 mM) in 0.1 M TBAP, CH3CN for different anodic potential limits (continuous lines) and CV curve on the unmodified electrode (dashed line) in 0.1 M TBAP, CH3CN in (a) the first and (b) second cycles.
The chronoamperograms recorded for different applied potentials during the preparation of T-CMEs using CPE show a large discrepancy between the durations of the process of polymerization at different potentials (Figure S1). The formation of the film at 0.9 V occurs in about 1000 s, while, at over 1 V, it takes place in about 100 s (for the preparation of CMEs using CPE for a constant charge of 1.5 mC).
3.2. Characterization of T-CMEs
The prepared modified electrodes were transferred in the supporting electrolyte 0.1 M TBAP, CH3CN and were characterized using CV and EIS.
3.2.1. Characterization of T-CMEs by CV and DPV
Successive cyclic voltammograms (with a scan rate of 50 mV/s) were recorded. The 2nd and 3rd cycle are overlapped, proving the stability of films formed from scanning (Figure 3a,b) or using CPE at different potentials (Figure 4a,b).
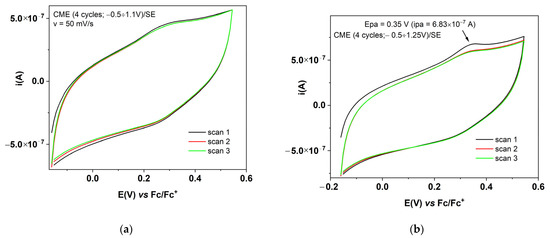
Figure 3.
CV curves (3 successive cycles) for CMEs obtained through 4 CV cycles between: (a) −0.6 V and +1.1 V; (b) −0.6 V and +1.25 V.
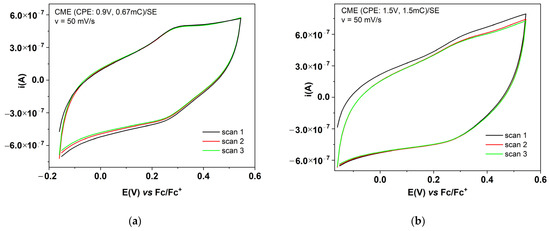
Figure 4.
CV curves (3 successive cycles) for CMEs obtained using CPE at: (a) 0.9 V and 0.67 mC; (b) 1.5 V and +1.5 mC.
DPV curves were recorded for the CME obtained with CPE at 1.5 V and +1.5 mC in Fc/SE (Figure S2). For SE, the DPV curves were not evident for the formation of films. The DPV peaks corresponding to the peaks found in CVs were not exhibited in these experiments, likely because the films are very thin, and too small to be seen in an ordinary scan. However, these peaks were found in the CV obtained at different scan rates (Figure 5), either using CMEs obtained from scanning or from CPE.
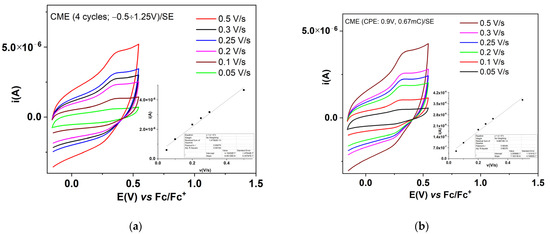
Figure 5.
CV curves at different scan rates for CMEs obtained using scanning (a) and CPE (b) recorded in SE; T-CMEs were obtained in solutions of T (1 mM) in 0.1 M TBAP, CH3CN, through 4 CV cycles between −0.6 V, +1.25 V (a) and through CPE at 0.9 V, 0.67 mC.
3.2.2. Characterization of T-CMEs by EIS
Impedance studies were carried out on various films prepared using either scanning or CPE. EIS measurement may be used as an effective characterization method, by evaluating the charge transfer of the electrochemical system [9,10,11,12]. This study brings valuable information on T-CMEs related to their films formation properties. The impedance study results were fitted using the equivalent circuits (C1 and C2) as shown in Figure 6, in which: Rsol = ohmic resistance of the electrolyte; CPEdl = double layer capacitance (consisting of CPEdl-T—capacitive part; CPEdl-P—its exponent); Rct = charge transfer resistance; and W = Warburg impedance. W was included to represent the process of diffusion of electrolyte ions at the interface, and has three parts: an ohmic resistance (WR), a capacitive part (WT), and its exponent (WP). Two types of Warburg impedance were considered, W0 (Warburg open) and Ws (Warburg short), corresponding to impedance of finite-length diffusion with a reflective/transmissive boundary, respectively.
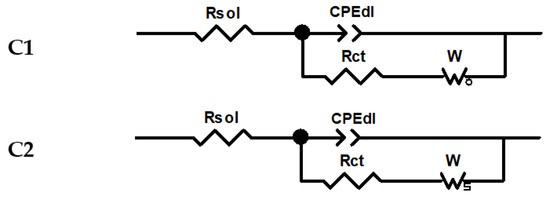
Figure 6.
Randles equivalent circuits for modelling.
Impedance studies for polyT films (T-CMEs) were performed in Fc solution (5 mM) in 0.1 M TBAP/CH3CN (Fc/SE) in type A experiments, and in the supporting electrolyte (SE),0.1 M TBAP/CH3CN (type B experiments) at the equilibrium potential (Eeq) and at imposed potentials (Ei1, Ei2), to observe what happens when higher oxidation potentials (Ei1 = 1 V and Ei2 = 1.8 V) are applied. The potentials at which the impedance study was carried out are given in Table 1.

Table 1.
Conditions of EIS for the films on T-CMEs.
The characteristics for the assumed circuits were estimated using the fitting software and are summarized in Table 2 and Table 3.
Table 2.
Parameters for EIS curves in type A experiments recorded in Fc/SE at different potentials for CME and GC, according to the models in Figure 6.
Table 3.
Parameters for EIS curves recorded in type B experiments in SE at different potentials for CME and GC, according to models in Figure 6.
The comparative EIS curves in the two electrolytes for different manners of preparation are presented in Figure 7. The comparison between the EIS curves in the presence and absence of ferrocene for different EIS potentials is shown in Figure 8. The curves with solid lines were obtained by fitting the impedance data with ZView software, and the corresponding chi-squared (χ2) values used to evaluate the fitting quality are given in Table 2, Table 3 and Table S1, for the CMEs prepared using scanning, respectively.
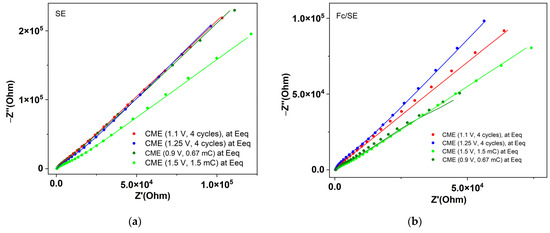
Figure 7.
EIS for different CMEs at the equilibrium potentials in: (a) SE; (b) Fc/SE. The solid lines are the fittings of the measured points using the equivalent circuit shown in Figure 6.
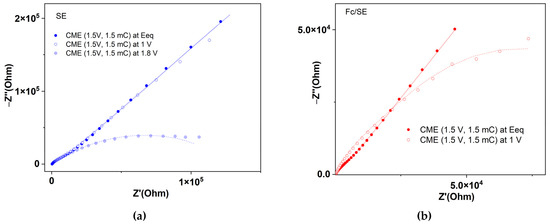
Figure 8.
EIS curves for CME obtained using CPE at 1.5 V in: (a) SE; (b) Fc/SE. The solid lines are the fittings of the measured points using the equivalent circuit shown in Figure 6.
At the equilibrium potential, the impedance curves are different in the presence of ferrocene from those recorded in the absence of ferrocene.
3.3. Calculation of the Electrochemically Active Surface
Figure 8 shows the CV curves at different potential scan rates obtained for the characterization in Fc/SE of CME, obtained using CPE at 1.5 V and 1.5 mC. From the dependence of the anodic peak currents vs. square root of the scan rate (inset on Figure 9) the electrochemically active surface area (A) was calculated using the Randles−Ševčík equation,
where ip is the peak current (A), n is the number of transferred electrons (n = 1), A is the geometric surface area (cm2), D is the diffusion coefficient of the redox probe (2.62 × 10⁻⁹ cm2/s [14,15,16]), C is the concentration of the redox probe (mol/cm3), and v is the potential scan rate (V/s). The obtained value for A is 0.42 cm2, being 6 times larger than the geometrical electrode area S = 0.071 cm2. In reality, the diffusion coefficient of ferrocene in the film is smaller and the effective area is even larger.
ip = 2.69 × 10⁵ × n3/2 × A·D1/2 × C × v1/2
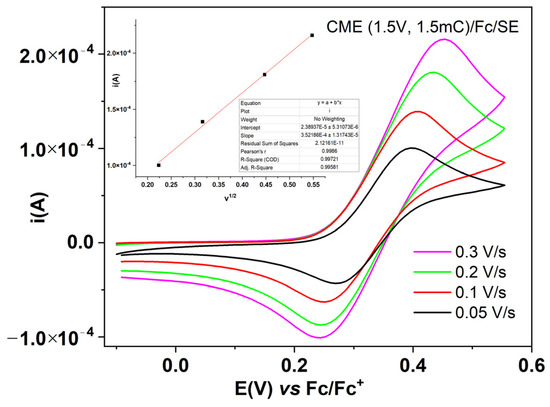
Figure 9.
CV curves in Fc/SE at different scan rates for CME, prepared using CPE at 1.5 V, 1.5 mC. Inset: linear dependencies of the anodic peak currents on the radical of the scan rate, with the slope of 3.521 × 10⁻⁴ A∙(V/s)−1/2.
For the film prepared using CPE at +1.5 V 1.5 mC, the following parameters were calculated, considering n = 1 for the Fc/Fc+ couple: thickness of the polymeric film, denoted by g (Equation (2) [17]), and charge transfer conductivity, denoted by σ (Equation (3) [17,18]). In Equation (2), F = 96.500 C/mol, qpol is the charge used in CPE, Mmonomer is the monomer molar mass, ρ is the density of the polymer film (which has been approximated to 1 g/cm3), and S is the geometrical area of the electrode (cm2). In Equation (3) Rct is the charge transfer resistance through the film, as calculated from the impedance measurements of the film in the supporting electrolyte at the equilibrium potential (5.699 Ω, in Fc/SE, and 22.152 Ω in SE, according to Table 2 and Table 3, respectively). The calculated thickness of the film formed is g = 10.5 µm, and the charge transfer conductivity σ = 2.64 × 10⁻⁶ S/cm in Fc/SE and 0.68 × 10⁻⁶ S/cm in SE.
3.4. Spectroelectrochemistry Study
Figure 10a shows the curves obtained with spectroelectrochemistry on the film prepared on ITO at 1.5 V, 1.23 mC. A continuous evolution is observed for wavelengths below 500 nm and above 650 nm, which depends on the applied potential. For the 550 nm–650 nm range, the curves show an increase in absorbance at anodic polarizations. Figure 10b shows the increase of the polaron peak absorbers’ areas, calculated using integration over the range 550 nm–650 nm for different applied potentials.
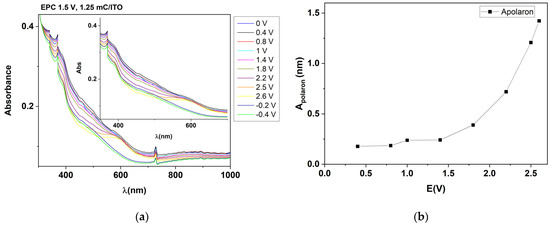
Figure 10.
(a) UV-Vis absorption spectra of T-CME in 0.1 M TBAP/CH3CN (deposited by CPE (1.5 V, 1.25 mC) on ITO electrode). Inset: spectrum detail on 550–650 nm; (b) representation of the polaron area as a function of the potential.
4. Discussion
The study of CV curves when obtaining polymer films based on T in SE using potential scanning with different anodic limits (Figure 1 and Figure 2) stands for the formation of films with different properties for anodic limits scans of +1.1 V and +1.25 V.
At scans with the limit of +1.1 V vs. RE (Figure 1a), there is a decrease in the oxidation currents in the range of the a1 peak (from the potential of about +0.6 V). The arrows placed on the direct scan curve at +0.6 V, +0.9 V and at −0.15 V on the return curve show how the current decreases during the cycles.
In the scans with the limit of 1.25 V (Figure 1b), it is evident that a film covers the electrode during the scans. In Figure 2, the highlighted processes are marked with a1, a2, b1, b2, and b’, in the order in which they appear during the scan. Their evolution is observed during the cycles. The film formed in the 1st scan at potentials more positive than +0.9 V appears to be conductive. Its reduction can be seen by the pair of peaks in the return scan at around +0.15 V (marked b1) and −0.15 V (marked b2), which have, as an anodic correspondent, the peak marked b’ (from cycle 2), which corresponds to the reoxidation of the film formed in the first scan. In the second cycle, a slight oxidation occurs at about +0.75 V (a1), and the current recorded at +1.25 V (vs. RE) exceeds the current in cycle 1 at the same potential. During the return scan, the two reduction peaks intensify, as do their anodic counterparts (b’). In the third cycle (see Figure 1) the process highlighted at +0.75 V (a1) is no longer present, and the corresponding current at the end of the scanning domain is lower than in the second cycle. This shows an evolution of the coating of the electrode with an insulating film. The anodic currents for process b1 from about 0.15 V increase, as compared with cycles 1 and 2 (Figure 1b), as does the current for peak b’. The current for peak b1 moves towards more negative potentials with cycling. Comparing the curves from Figure 1 and Figure 2, it is obvious that the formation of the film takes place at a potential higher than +1.1 V vs. RE, but if the anodic potential limit scan exceeds 1.2 V, the oxidation of the monomer also takes place. This is revealed by the slower decrease of the current on the forward scan CV curve at the potential of 0.75 V in Figure 1a, versus Figure 1b.
In Figure 2a, the curves from the first CV cycles presented in Figure 1a,b are compared with the one obtained in the solution without the ligand (denoted with broken line). It is observed that the irreversible oxidation process of the ligand (a2) begins at potentials higher than +1.1 V vs. RE, and has much higher currents than those obtained for the supporting electrolyte in the solution without the ligand. Oxidation processes and comparisons are more clearly highlighted when comparing the 2nd scanning cycle (Figure 2b). These statements are supported by the chronoamperograms presented in Figure S1, recorded during the preparation of CMEs using CPE at different potentials. The chronoamperograms recorded at the same charge of 1.5 mC show that, at the potential of +1.5 V, the current drops to a level current much lower than at the potential of +1 V, which agrees with the cyclic voltammograms. The 1.5 mC charge requires a time of electrolysis of about 180 s at an applied potential of +1.5 V, while for a potential of +1 V the time is about 25 s. At less positive potentials (0.9 V vs. RE) the electrolysis time is over 1000 s! Consequently, the film obtained at potentials higher than 1 V is non-conductive.
The prepared modified electrodes were transferred into the supporting electrolyte 0.1 M TPAP, CH3CN (SE) or in ferrocene solution in SE, and were characterized by CV and EIS.
The characterization by CV of the films was performed by recording successive cyclic voltammograms in the supporting electrolyte solution for the films formed with scanning (Figure 3) or using CPE (Figure 4). The CV curves show a pronounced hysteresis, and these confirm the stability of the formed films during successive cycles. For Figure 3b, an oxidation potential of the polymer obtained using scanning (with an anodic limit of 1.25 V vs. RE) of Epa = 0.35 V can be estimated. From the comparison of the CVs in Figure 3a,b, it can be seen that the film formed from scanning at 1.25 V is less stable when compared with the one formed at 1.1 V, because the CV curve for the 2nd cycle has lower currents than those in the 1st cycle. The reduction potential is difficult to be estimated in the case of this film. From the comparison of the CVs in Figure 4a,b it can be seen that the film formed from CPE at the potential of 1.5 V is less stable, as compared with the one formed at 0.9 V (the CV curve for the 2nd cycle has lower currents than those of the 1st cycle). The CV curves for the film formed at 0.9 V show a remarkable symmetry of the reversible anodic and cathodic redox peaks. It can be estimated that the oxidation and reduction potentials for the polymer obtained from CPE at 0.9 V prove the higher conductivity of this film. The DPV curves recorded for the CME obtained using CPE at 1.5 V and +1.5 mC in Fc/SE (Figure S2) mainly show the symmetrical peak of the ferrocene, but very few of the expected DPV signals corresponding to the film oxidation/reduction. In SE, DPV currents are very small and not evident for film formation, likely because the films are very thin. However, the peaks for film oxidation/ reduction are evident in the CV obtained at different scan rates (Figure 5), for either the CMEs obtained from scanning or using CPE.
The characterization of films through EIS at the equilibrium potentials shows that EIS recorded in SE have the same evolution (Figure 7a), no matter how the electrodes are prepared, while those in Fc/SE are spread (Figure 7b). Therefore, in SE, they cannot be differentiated using impedance measurements. Figure 6b shows that higher impedances (Z′ and Z″;) are obtained for the electrodes prepared with CPE than for those from scanning. The slope for the curve of the electrode obtained from scanning at 1.25 V is higher than that for the electrode obtained at 1.1 V. Figure S3 shows that the electrodes prepared from CPE have higher slopes in Fc/SE than in SE, both for those prepared at 1.5 V (Figure S3a) and for those at 0.9 V (Figure S3b). Figure S3a shows that, for the electrodes prepared using scanning, the slope of the curve is higher in Fc/SE than in SE. The characterization of the films using EIS in the supporting electrolyte shows that at the equilibrium potential the impedance curves are different in the presence of ferrocene (curves with red stars) than those recorded in the absence of ferrocene (these last ones are located above for Z′ > 5 × 10⁴) (curves with blue squares in Figure S3b).
From the values in Table 2 for the characterization of a film in Fc/SE, using EIS, some very contradictory values for the Warburg element are obtained in the two fittings, F1 and F2. The values of Rct in the two fittings are close. For the higher applied potential on CME, the Rct increases drastically (about seven times, an effect noticed also for GS bare electrode). From the values in Table 3 for the characterization with EIS of a film in SE, it emerges that, with the increase of the oxidation potential used in EIS from the equilibrium potential to 1 V and then to 1.8 V, a doping of the film occurs. It becomes more conductive (i.e., it has a smaller resistance). Rct varies as follows: 22,152 Ω at the equilibrium potential of 0.58 V, 19,043 Ω at the potential of 1 V, and 11,454 Ω at the potential of 1.8 V. This shows that, at more positive applied potentials, the transfer of electrons occurs more easily, a phenomenon explained by the formation of a larger amount of polarons. The proof of polaron formation was given by the spectroelectrochemistry study, which highlights the dependence on the potential of the absorbance in the range 550 nm–650 nm (Figure 10a). The increase in absorbance at anodic polarizations indicates the increase of the polaron peak absorbers’ areas, as calculated using integration (Figure 10b).
Charge transfer conductivity of about 10−6 (S/cm) indicates the formation of low-conductivity films, compared with the σ values obtained for different azulene monomers (Table 4). This feature can affect the LOD values for the heavy metal sensing on chemically modified electrodes based on this monomer.
Table 4.
Comparison between different azulene monomers regarding σ values obtained.
The spectroelectrochemical study showed that the polarization of the film in the domain of the anodic potentials leads to the increase of the polarons’ area, and therefore to the intensification of the charge transport process through polarons.
5. Conclusions
Stable azulene-modified electrodes were obtained using scanning or controlled potential electrolysis in the domain of anodic peak potentials, as evidenced by CV, DPV and RDE methods. CV and DPV methods put in evidence film formation using electrochemistry. CV studies on 2-(azulen-1-yldiazenyl)-5-phenyl-1,3,4-thiadiazole confirmed the main role of electrosynthesis potential on film formation and its properties. All methods put in evidence the formation of films with insulating properties, depending on the electropolymerization potential. A remarkable symmetry of the reversible anodic and cathodic redox CV peaks for the polymer was noticed for films formed using CPE. EIS added new possibilities for the evaluation of the film conductivity and to enable future correlation with the analytical response in HMs analysis. EIS proved to be a complementary technique to evaluate the properties of modified electrodes based on azulene films, such as their electrical conductivity. The spectroelectrochemical study showed that the anodic polarization of the film leads to an increase of the polarons’ area, and therefore to the intensification of the transport process through polarons.
Supplementary Materials
The following are available online at https://www.mdpi.com/article/10.3390/sym15020514/s1. Basic properties for T and characterization through elemental analysis, UV-Vis, IR, 1H NMR, 13C-NMR, MS. Figure S1. Chronoamperograms during the preparation of CMEs using CPE for a constant charge of 1.5 mC at different applied potentials: +1 V (black line), +1.5 V (blue line) and +0.9 V (green line) in real coordinates (a) and logarithmic scale (b). Figure S2. DPV curve for T-CME, prepared using CPE at 1.5 V and 1.5 mC recorded in Fc/SE. Figure S3. EIS curves for CMEs obtained using CPE at equilibrium potentials in SE (blue squares) and in Fc/SE (red stars) for CMEs obtained at: (a) 1.5 V, 1.5 mC; (b) 0.9 V, 0.67 mC. Figure S4. EIS curves for CME obtained from scanning (4 scans) in the ranges: (a) −0.6, 1.1 V; (b) −0.6, 1.25 V at the equilibrium potentials in SE (blue squares) and in Fc/SE (red stars). Table S1. Parameters for EIS curves for CMEs prepared from scanning recorded in type B experiments in SE at different potentials, according to models in Figure 6.
Author Contributions
Conceptualization, E.-M.U., C.L.; validation, E.-M.U., C.L. and V.M.-S.; formal analysis, V.A., C.L. and R.I.; investigation, V.A., C.L., O.T.M. and E.-M.U.; data curation, E.-M.U., C.L. and V.M.-S.; writing—original draft preparation, V.A., O.T.M., R.I. and E.-M.U.; writing—review and editing, C.L., R.I., V.M.-S. and E.-M.U.; supervision, E.-M.U. and C.L.; resources, E.-M.U.; and project administration, E.-M.U. All authors have read and agreed to the published version of the manuscript.
Funding
A part of this research was funded by Romanian National Authority for Scientific Research, UEFISCDI MySMIS 124705.
Institutional Review Board Statement
Not applicable.
Informed Consent Statement
Not applicable.
Data Availability Statement
Available data are presented in the Supplementary Materials.
Acknowledgments
This research was supported by University “Politehnica” of Bucharest, Romania, and University Union—Nikola Tesla, Belgrade, Serbia.
Conflicts of Interest
The authors declare no conflict of interest.
References
- Wang, F.; Lai, Y.H.; Han, M.Y. Stimuli-Responsive Conjugated Copolymers Having Electro-Active Azulene and Bithiophene Units in the Polymer Skeleton: Effect of Protonation and p-Doping on Conducting Properties. Macromolecules 2004, 37, 3222–3230. [Google Scholar] [CrossRef]
- Redl, F.X.; Köthe, O.; Röckl, K.; Bauer, W.; Daub, J. Azulene appended cellulose: Synthesis, optical and chiroptical properties, film formation by electrochemical oxidation. J. Macromol. Chem. Phys. 2000, 210, 2091. [Google Scholar] [CrossRef]
- Dalkiran, B.; Bratt, C.M.A. Poly(safranine T)-deep eutectic solvent/copper oxide nanoparticle-carbon nanotube nanocomposite modified electrode and its application to the simultaneous determination of hydroquinone and catechol. Microchem. J. 2022, 179, 107531. [Google Scholar] [CrossRef]
- Chang, P.M.; Woi, Y.H.; Yatimah, A. The selective electrochemical detection of dopamine in the presence of ascorbic acid and uric acid using electro-polymerised-β-cyclodextrin incorporated f-MWCNTs/polyaniline modified glassy carbon electrode. Microchem. J. 2019, 148, 322–330. [Google Scholar] [CrossRef]
- Sannicolò, F.; Rizzo, S.; Benincori, T.; Kutner, W.; Noworyta, K.; Sobczak, J.W.; Bonometti, V.; Falciola, L.; Mussini, P.R.; Pierin, M. An effective multipurpose building block for 3D electropolymerisation: 2,2′-Bis(2,2′-bithiophene-5-yl)-3,3′-bithianaphthene. Electrochim. Acta 2010, 55, 8352–8364. [Google Scholar] [CrossRef]
- Higginbotham, H.F.; Czichy, M.; Sharma, B.K.; Shaikh, A.M.; Kamble, R.M.; Data, P. Electrochemically synthesised xanthone-cored conjugated polymers as materials for electrochromic windows. Electrochim. Acta 2015, 273, 264–272. [Google Scholar] [CrossRef]
- Vasile (Corbei), A.-A.; Stefaniu, A.; Pintilie, L.; Stanciu, G.; Ungureanu, E.-M. In Silico Characterization and Preliminary Anticancer Assessment of Some 1,3,4- Thiadiazoles. UPB Sci. Bull. 2021, 83, 3–12. [Google Scholar]
- Anăstăsoaie, V.; Omocea, C.; Enache, L.-B.; Anicăi, L.; Ungureanu, E.-M.; van Staden, J.F.; Enăchescu, M. Surface Characterization of New Azulene-Based CMEs for Sensing. Symmetry 2021, 13, 2292. [Google Scholar] [CrossRef]
- Bu, L.; Chen, X.; Song, Q.; Jiang, D.; Shan, X.; Wang, W. Supersensitive detection of chloramphenicol with an EIS method based on molecularly imprinted polypyrrole at UiO-66 and CDs modified electrod. Microchem. J. 2022, 179, 107459. [Google Scholar] [CrossRef]
- Velásquez, P.; Leinen, D.; Pascual, J.; Ramos-Barrado, J.R.; Cordova, R.; Gómez, H.; Schreblerb, R. SEM, EDX and EIS study of an electrochemically modified electrode surface of natural enargite (Cu3AsS4). J. Electroanal. Chem. 2020, 149, 87–95. [Google Scholar] [CrossRef]
- Stoian, I.-A.; Iacob, B.-C.; Dudaș, C.-L.; Barbu-Tudoran, L.; Bogdan, D.; Marian, I.O.; Bodoki, E.; Oprean, R. Biomimetic electrochemical sensor for the highly selective detection of azithromycin in biological sample. Biosens. Bioelectron. 2020, 155, 11209. [Google Scholar] [CrossRef] [PubMed]
- Choi, W.; Shin, H.-C.; Kim, J.M.; Choi, J.-Y.; Yoon, W.-S. Modeling and Application of Electrochemical Impedance Spectroscopy (EIS) for Lithium-ion Batteries. J. Electrochem. Sci. Technol. 2020, 11, 1–13. [Google Scholar] [CrossRef]
- Razus, A.C.; Birzan, L.; Cristea, M.; Tecuceanu, V.; Draghici, C.; Hanganu, A.; Maganu, M.; Pintilie, L.; Ungureanu, E.M. New (Azulen-1-Yldiazenyl)-Heteroaromatic Compounds Containing 1,2,5-Thiadiazol-3-Yl Moieties. Rev. Chim. 2019, 70, 1518–1529. [Google Scholar] [CrossRef]
- Wang, Y.; Rogers, E.I.; Compton, R.G. The measurement of the diffusion coefficients of ferrocene and ferrocenium and their temperature dependence in acetonitrile using double potential step microdisk electrode chronoamperometry. J. Electroanal. Chem. 2010, 648, 15–19. [Google Scholar] [CrossRef]
- Morikita, T.; Yamamoto, T. Electrochemical determination of diffusion coefficient of π-conjugated polymers containing ferrocene unit. J. Organomet. Chem. 2001, 637–639, 809–812. [Google Scholar] [CrossRef]
- Ikeuchi, H.; Kanakubo, M. Diffusion Coefficients of Ferrocene and Ferricinium Ion in Tetraethylammonium Perchlorate Acetonitrile Solutions, as Determined by Chronoamperometry. Electrochemistry 2001, 69, 34–36. [Google Scholar] [CrossRef]
- Teodorescu, F.; Lete, C.; Marin, M.; Munteanu, C.; Totir, N. A Novel Glucose Biosensor based on Poly(azulene-co-3-thiophene acetic acid) Conducting Films. Rev. Chim. 2013, 64, 15–21. [Google Scholar]
- Enache, L.-B.; Anăstăsoaie, V.; Lete, C.; Brotea, A.G.; Matica, O.-T.; Amarandei, C.-A.; Brandel, J.; Ungureanu, E.-M.; Enăchescu, M. Polyazulene-Based Materials for Heavy Metal Ion Detection. 3. (E)-5-((6-t-Butyl-4,8-dimethylazulen-1-yl) diazenyl)-1H-tetrazole-Based Modified Electrodes. Symmetry 2021, 13, 1642. [Google Scholar] [CrossRef]


Disclaimer/Publisher’s Note: The statements, opinions and data contained in all publications are solely those of the individual author(s) and contributor(s) and not of MDPI and/or the editor(s). MDPI and/or the editor(s) disclaim responsibility for any injury to people or property resulting from any ideas, methods, instructions or products referred to in the content. |
© 2023 by the authors. Licensee MDPI, Basel, Switzerland. This article is an open access article distributed under the terms and conditions of the Creative Commons Attribution (CC BY) license (https://creativecommons.org/licenses/by/4.0/).