Abstract
In chemical production processes, the most suitable operation regime for A-Type powders such as typical FCC particles is high-speed fast fluidization owing to their uniquely advantageous properties. Discrete element method (DEM) for modelling fast fluidization with A-Type powders has rarely been reported. How to appropriately select the DEM time step and the stiffness coefficient is one of the most critical problems for stable and accurate calculation. This article mainly discusses the effect of the stiffness coefficient and DEM time step on simulations of A-type FCC particles. In order to describe the effect of both parameters and their complex interaction, a dimensionless relative DEM time step is introduced. In total, nine cases with different numbers of relative time steps are adopted for modelling a microfluidized bed of A-Type FCC particles, the regime of which is proved to be fast fluidization. Results show that three bifurcations occur in all the simulations. Only the moderate relative time step possesses the capability of modelling the process of particle collision and thus predicts the right flow regime with asymmetric and heterogeneous typical fast fluidized structures. When the relative time step increases to large rank, simulations predict untrue fluidization regimes with symmetric and homogeneous structures. Moreover, both over-large and over-low relative time steps cause excessive particle overlap and thus a divergence of simulation. The further optimization of moderate relative DEM time step in relation to real particle property is unidentifiable and is thus an outstanding issue. That the range of the moderate relative time step is limited indicates that the common soft-sphere model is poor at modelling fast fluidization of A-Type particles. It is suggested that possible future work should be focused on improving the simulation frame and employing the molecular dynamics model to more appropriately deal with particle contact.
1. Introduction
Gas–solid fluidized beds are widely applied in many industrial fields such as environment, energy, chemical engineering, etc. [1]. The non-intrusive accessibility of real facilities causes it to be difficult to obtain the detailed measurement data in the experimental study of fluidized beds. Therefore, numerical simulations have become complementary research means in cognition of the fluidization dynamics. Because the discrete element method (DEM) [2,3,4,5] deals with the solid phase as discrete elements, it is advantageous in providing the particle level information. Therefore, DEM is a desired tool in fluidized bed studies for design and operation purposes. Nowadays, more and more DEM simulation studies have been carried out on different regimes of fluidization of different particle types.
The behavior of different particle groups fluidized by gases falls into four clearly recognizable types characterized by density difference and mean particle size [6]. C-Type particles are usually considered difficult to be fluidized, and D-Type particles are just fluidizable. Compared with C-Type (or ultra-fine) and D-Type (or coarse) particles, A-Type and B-Type particles are more suitable for fluidization. A-Type particles (or fine particles) generally have a mean size smaller than 100 μm and/or a low particle density of less than about 1400 kg/m3. They exhibit a unique type of behavior, with fluid catalytic cracking (FCC) particles being typical examples. Compared with B-Type particles, A-Type particles are advantageous in high bed expansion ratio, high gas-solid mass transfer rate, and high heat transfer rate. Generally, A-Type particles are thought to be the most fluidizable materials. Furthermore, beds of powders in this group expand considerably before bubbling commences. Moreover, to model the fluidized A-Type particles, the cohesion of which is stronger and non-negligible needs to account for van der Waals forces.
The reliable applications of DEM simulations for various fluidized operations and particle types need to be further validated in the problem of selecting collision parameters such as time step, stiffness coefficient, and damping coefficient. Selection procedures for the former two parameters may vary from different types of particles and operation conditions. The reasonable selection of both parameters plays an important role in guaranteeing the authenticity of the calculation.
Note that the DEM time step must be smaller than the minimal oscillation period of the spring–mass system that can be determined by the stiffness coefficient. Tsuji et al. [2] found that the maximum permissible DEM time step should be ten percent of the minimal oscillation period according to the convergent dissipation of total kinetic energy during the free settling process. Although this critical time step is widely recognized in the selection of the DEM time step, there is still a wide range of artificial choice. The simulated motion of particles discharging from a rectangular hopper had been compared with the experimental data by Yuu et al. [7]. It was shown that the simulated results could qualitatively describe those in the experiments, although the artificially selected stiffness coefficient of the calculations is greatly different from the reality of the materials. It was also shown that the discrepancy between the simulation results and the real granular flow would not decrease as the DEM time step was decreased.
Moreover, both Tsuji et al. and Yuu et al. used coarse D-Type particles in the above-mentioned studies. The simulation of A-Type particles needs much more calculation loads and much more elaborate mathematical and numerical models. Tracking a large number of particles usually requires prohibited computational costs, even in a small laboratory facility. In addition, the major difference of A-Type particles to B- and D-Type particles is the strong interparticle cohesive force which becomes significant when the particle size turns small. Therefore, the cohesive force, i.e., van der Waals force, should be accounted for in DEM simulations of A-Type particles. Unfortunately, early studies of DEM simulations mainly chose D-Type particles. Up until now, there have been relatively few studies using real A-Type particles among those thousands of DEM simulation studies. Some indirect validation studies can be available, including the critical fluidization and bubbling conditions [8,9,10,11,12,13,14], the pressure drop hysteresis [10,15,16,17,18], and the bed expansion [19,20,21,22]. In addition, direct validation studies have been performed by the use of A-Type FCC particles [23,24]. These were all devoted to studies on low-speed classical fluidization. As is known, for A-Type powders such as typical FCC particles, the most suitable operation regime is high-speed fast fluidization owing to their uniquely advantageous properties.
As for high-speed non-classical fluidization, a micro fast-fluidized bed of A-Type FCC particles has been modeled in our previous study [25] by using an EMMS-based structure-dependent drag model. Large clusters, gas–solid back-mixing, and a little lower but much more violently fluctuating solid outlet flux were captured in the simulations. Beyond that, DEM simulations of the fast fluidization of A-Type powders have hardly been reported. How to appropriately select the DEM time step and the stiffness coefficient is one of the most critical problems for the stable and accurate calculation in the DEM simulation of fine particles’ high-speed fluidization. This article mainly discusses the effect of stiffness coefficient and DEM time step on simulations of A-Type FCC particles. In order to describe the effect of both parameters, a dimensionless relative DEM time step is introduced. In total, nine cases of relative DEM time step are used in the simulations. Some results and empirical rules are also found to be of actual value for simulation practice.
2. Simulation Methods
Gas motion is controlled by the Navier–Stokes equations as
where is gas pressure, is gas velocity, is viscous stress tensor, and the source term is calculated as
where is the number of particles overlapped with grid , is the drag force on particle , is the area of particle disk, is the promotional disk area of particle overlapped with grid , and is the quasi-three-dimensional volume of the grid with a suppositional thickness of .
The two-dimensional porosity of a grid can be transformed into the three-dimensional porosity according to Hooman et al. [4] as
The finite volume method based on the collocated grid is adopted to discretize the Navier–Stokes equations. The uniform velocity at the bottom layer grid is specified as the inlet boundary conditions. The pressure outlet and impermeable wall are also specified as the boundary conditions. The Simi-Implicit Method for Pressure-Linked Equation Revised (or SIMPLER algorithm [26]) is used as the solver of the discretized equations.
So far as two-dimensional simulation is concerned, particles are just disks. The process of particle contacts or collisions is dealt with according to the well-known soft-sphere model. The wall is considered an infinitely big particle with its mass infinitely large. Then, the transitional motion for each particle is computed according to Newton’s second law of motion as
where is the van der Waals force, is the collision force, is the local gas pressure, and the drag force can be computed by Wen and Yu correlation [27].
The rotational motion of each particle is computed as
where is the inertia movement of the particle, is the particle angular velocity, and is the torque due to collision.
In Equation (5), the van der Waals force on particle due to particle is calculated according to
where is the Hamaker constant, is the distance between particle and particle , and is the unit vector from particle to particle . The van der Waals force on particle due to the wall is calculated according to
where is the distance between particle and the wall and is the unit vector from particle to the wall.
The Hamaker constant is specified as 1 × 10⁻²¹ Nm for the present simulations of Type-A FCC particles. In order to avoid the divergence of the calculation when body surfaces approach infinitely, a so-called cut-off distance H0 is introduced. The cut-off distance H0, i.e., the minimal value of and for the particle–particle and particle–wall surface distances, respectively, is specified as 0.4 nm in the present work. See [25] for more details.
Particles are set as static and randomly homogeneous in a miniature riser, with the geometry of W × H = 2.5 mm × 40 mm at the initial moment for nine cases in total. During the simulations, particles are import-and-export balanced. Table 1 shows the other fixed parameters for particles and gas. The particle property and operation conditions are both similar to those in [25] to guarantee the real fast-fluidized regime. As is shown, the DEM time step is also fixed; however, the stiffness coefficient is variable.
Table 1.
Fixed parameters for particle and gas.
In order to implore the interaction effect of the stiffness coefficient and the DEM time step on simulations, we define a dimensionless parameter called relative DEM time step in the following.
According to the equation of the single-degree elastic system, the minimal system oscillation period can be determined as
where is the stiffness coefficient. Then, the critical DEM time step theorized by Tsuji et al. [2] is ten percent of . That is,
Then, the relative DEM time step is calculated as
Table 2 shows the variable parameters and the ranks of the relative DEM time step.
Table 2.
Variable parameters.
3. Results and Discussion
3.1. Over-Large Relative Time Step
Figure 1 shows the simulated particle distributions in the microfluidized bed at 0.031 s with and N/m. The right snapshot of Figure 1 is the magnification of the marked region in the left snapshot. As is shown in the right snapshot, there are quite a few occasions of particles’ excessive overlap, far beyond the limited overlap of one percent of the particle diameter. These excessive overlap occasions may lead to the divergence of fluid field calculations due to excessively large source terms applied to fluid. Therefore, before 0.032 s, simulations often terminate automatically. Therefore, for the fast fluidization of A-Type particles, an over-large relative DEM time step can lead to excessive overlap and thus the divergence of simulation. As is often encountered, for low-speed bubbling fluidization of coarse particles, the calculation is converged so long as the DEM time step keeps the same magnitude with the critical safe time step. Here, although the DEM time step is two times the critical time step or ten percent of the oscillation time, the calculation is divergent.
Figure 1.
Particle distributions at 0.031 s with over-large .
3.2. Over-Low Relative Time Step
Figure 2 shows the simulated particle distributions at 0.014 s with and N/m. The right snapshot of Figure 2 is the magnification of the marked region in the left snapshot. As is noticed in the right snapshot, there are also quite a few occasions of excessive particle overlap. Before 0.015 s, simulations also terminate automatically. As has been found by Yuu et al. [7], selection of an excessively low DEM time step may not improve the simulation results. Furthermore, here it is proven that the selection of over-low even causes excessive particle overlap and thus divergent calculation.
Figure 2.
Particle distributions at 0.014 s with over-low .
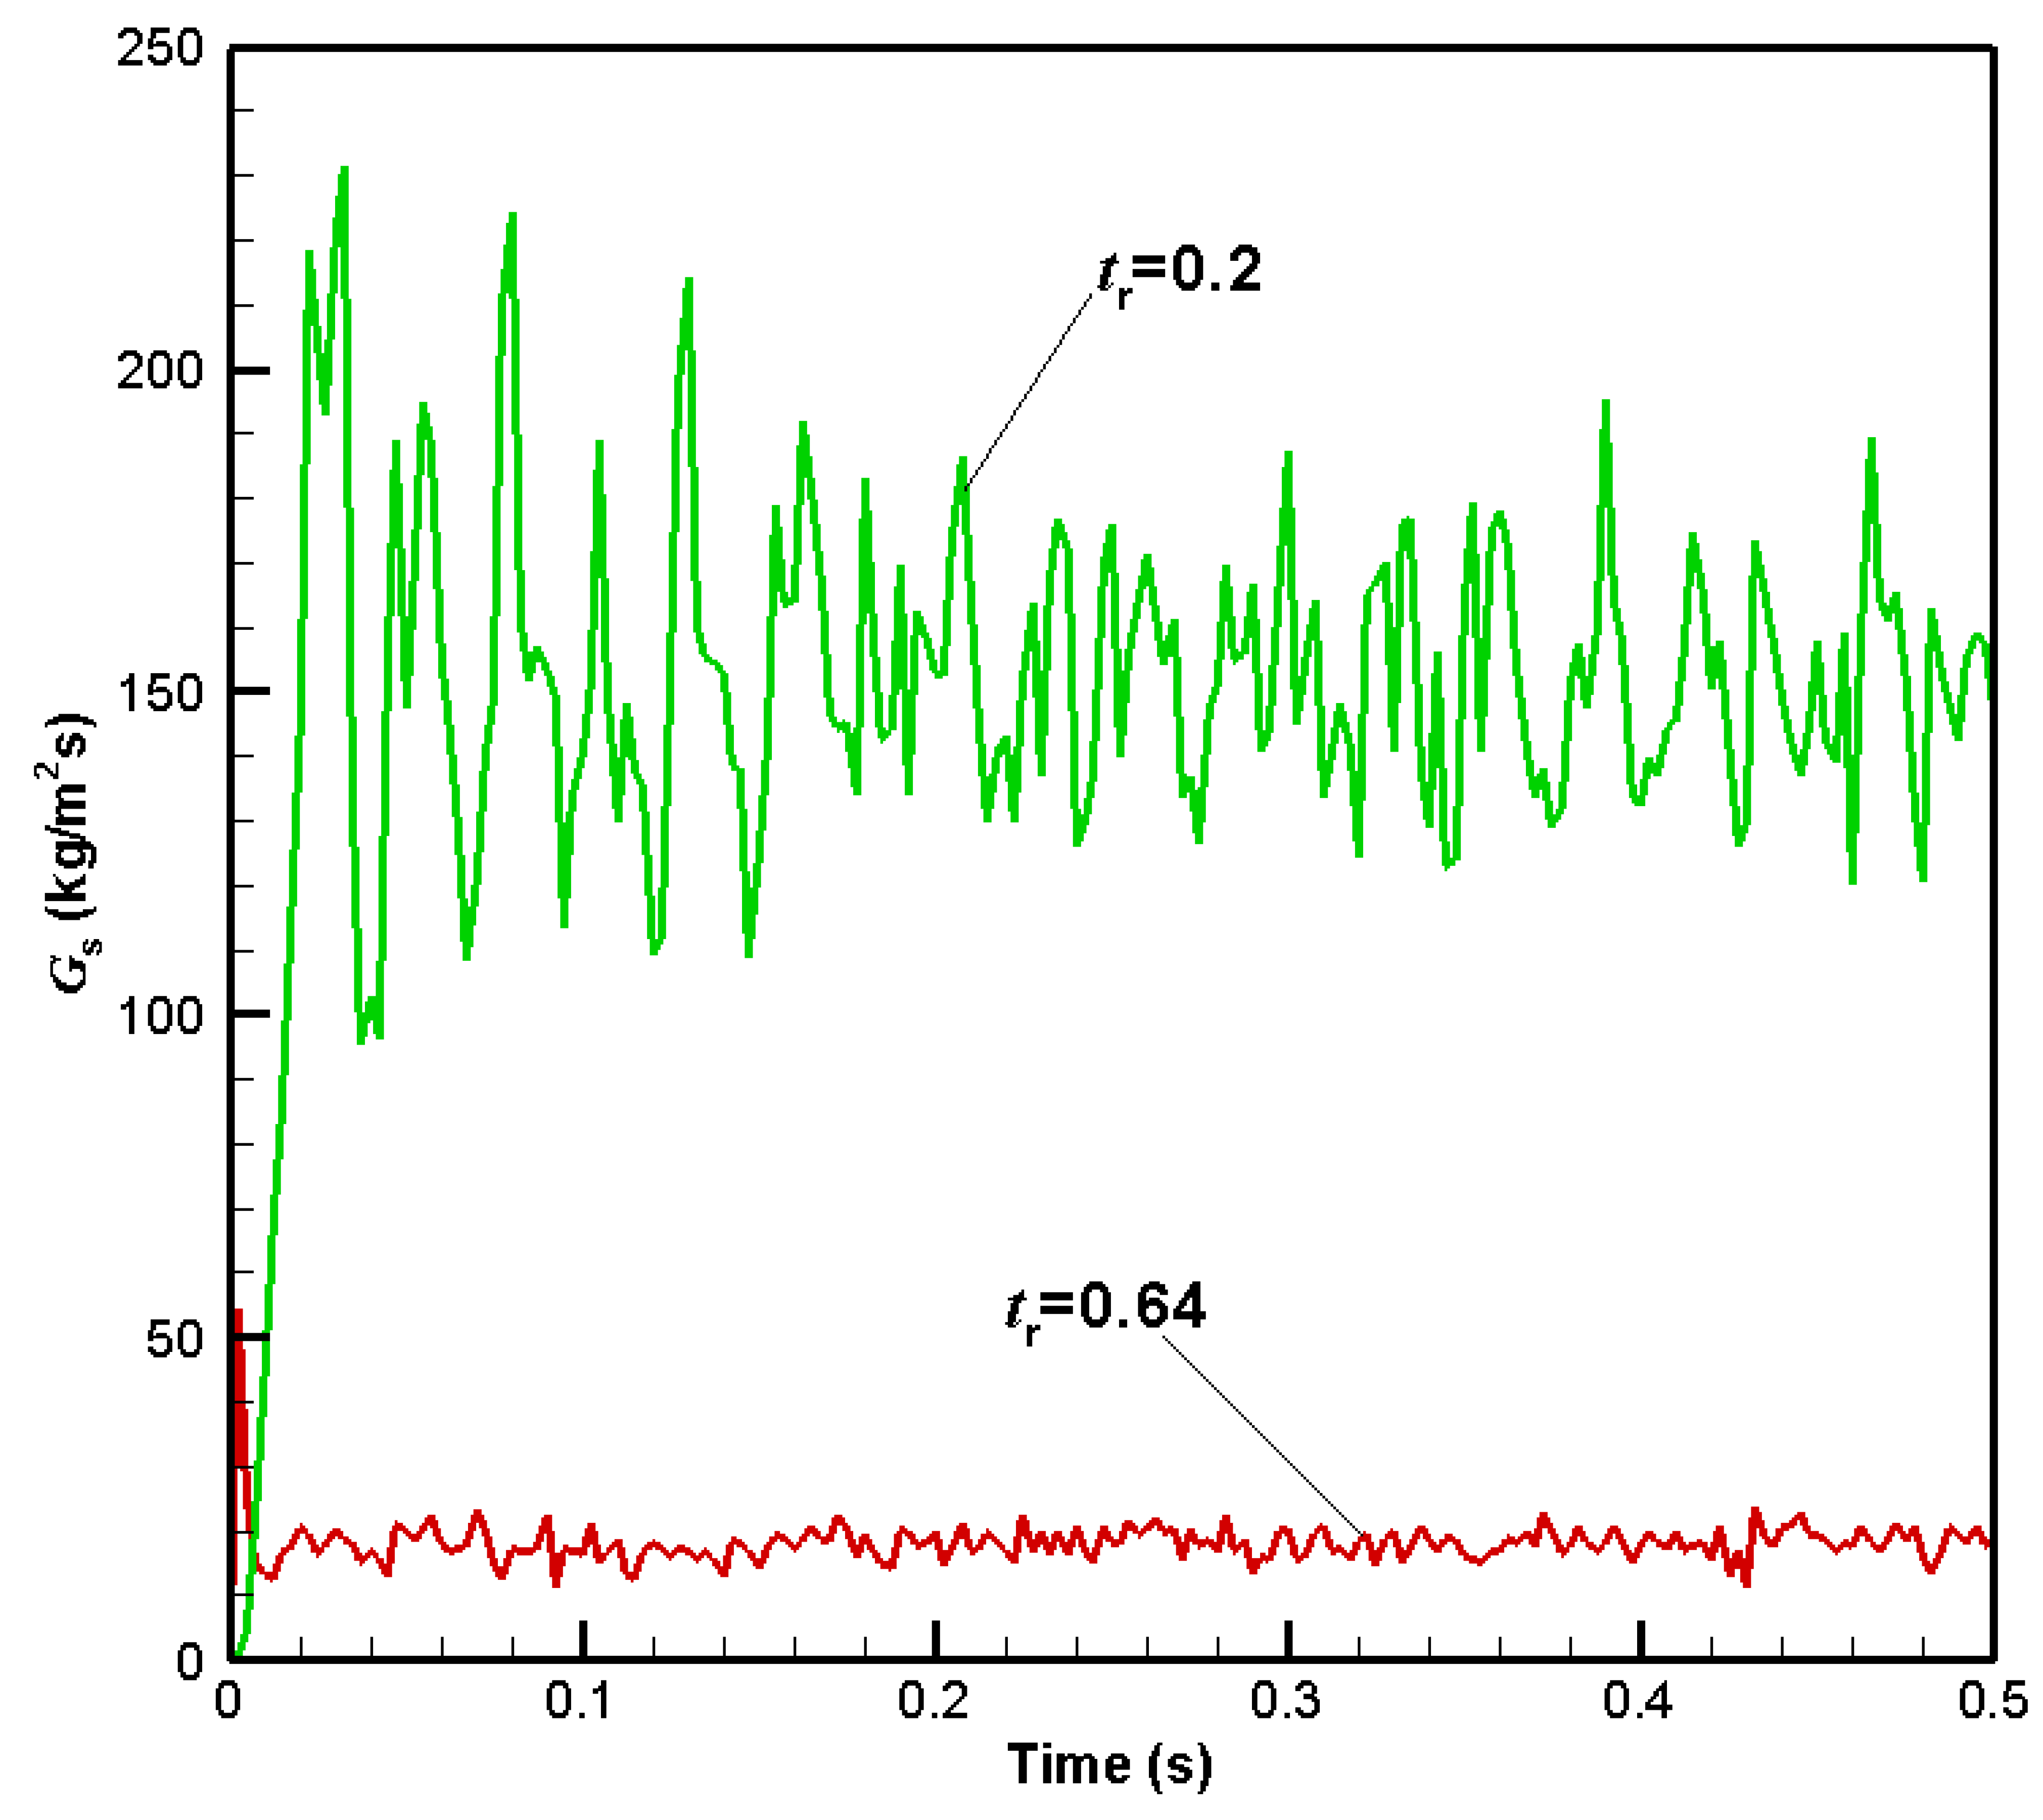
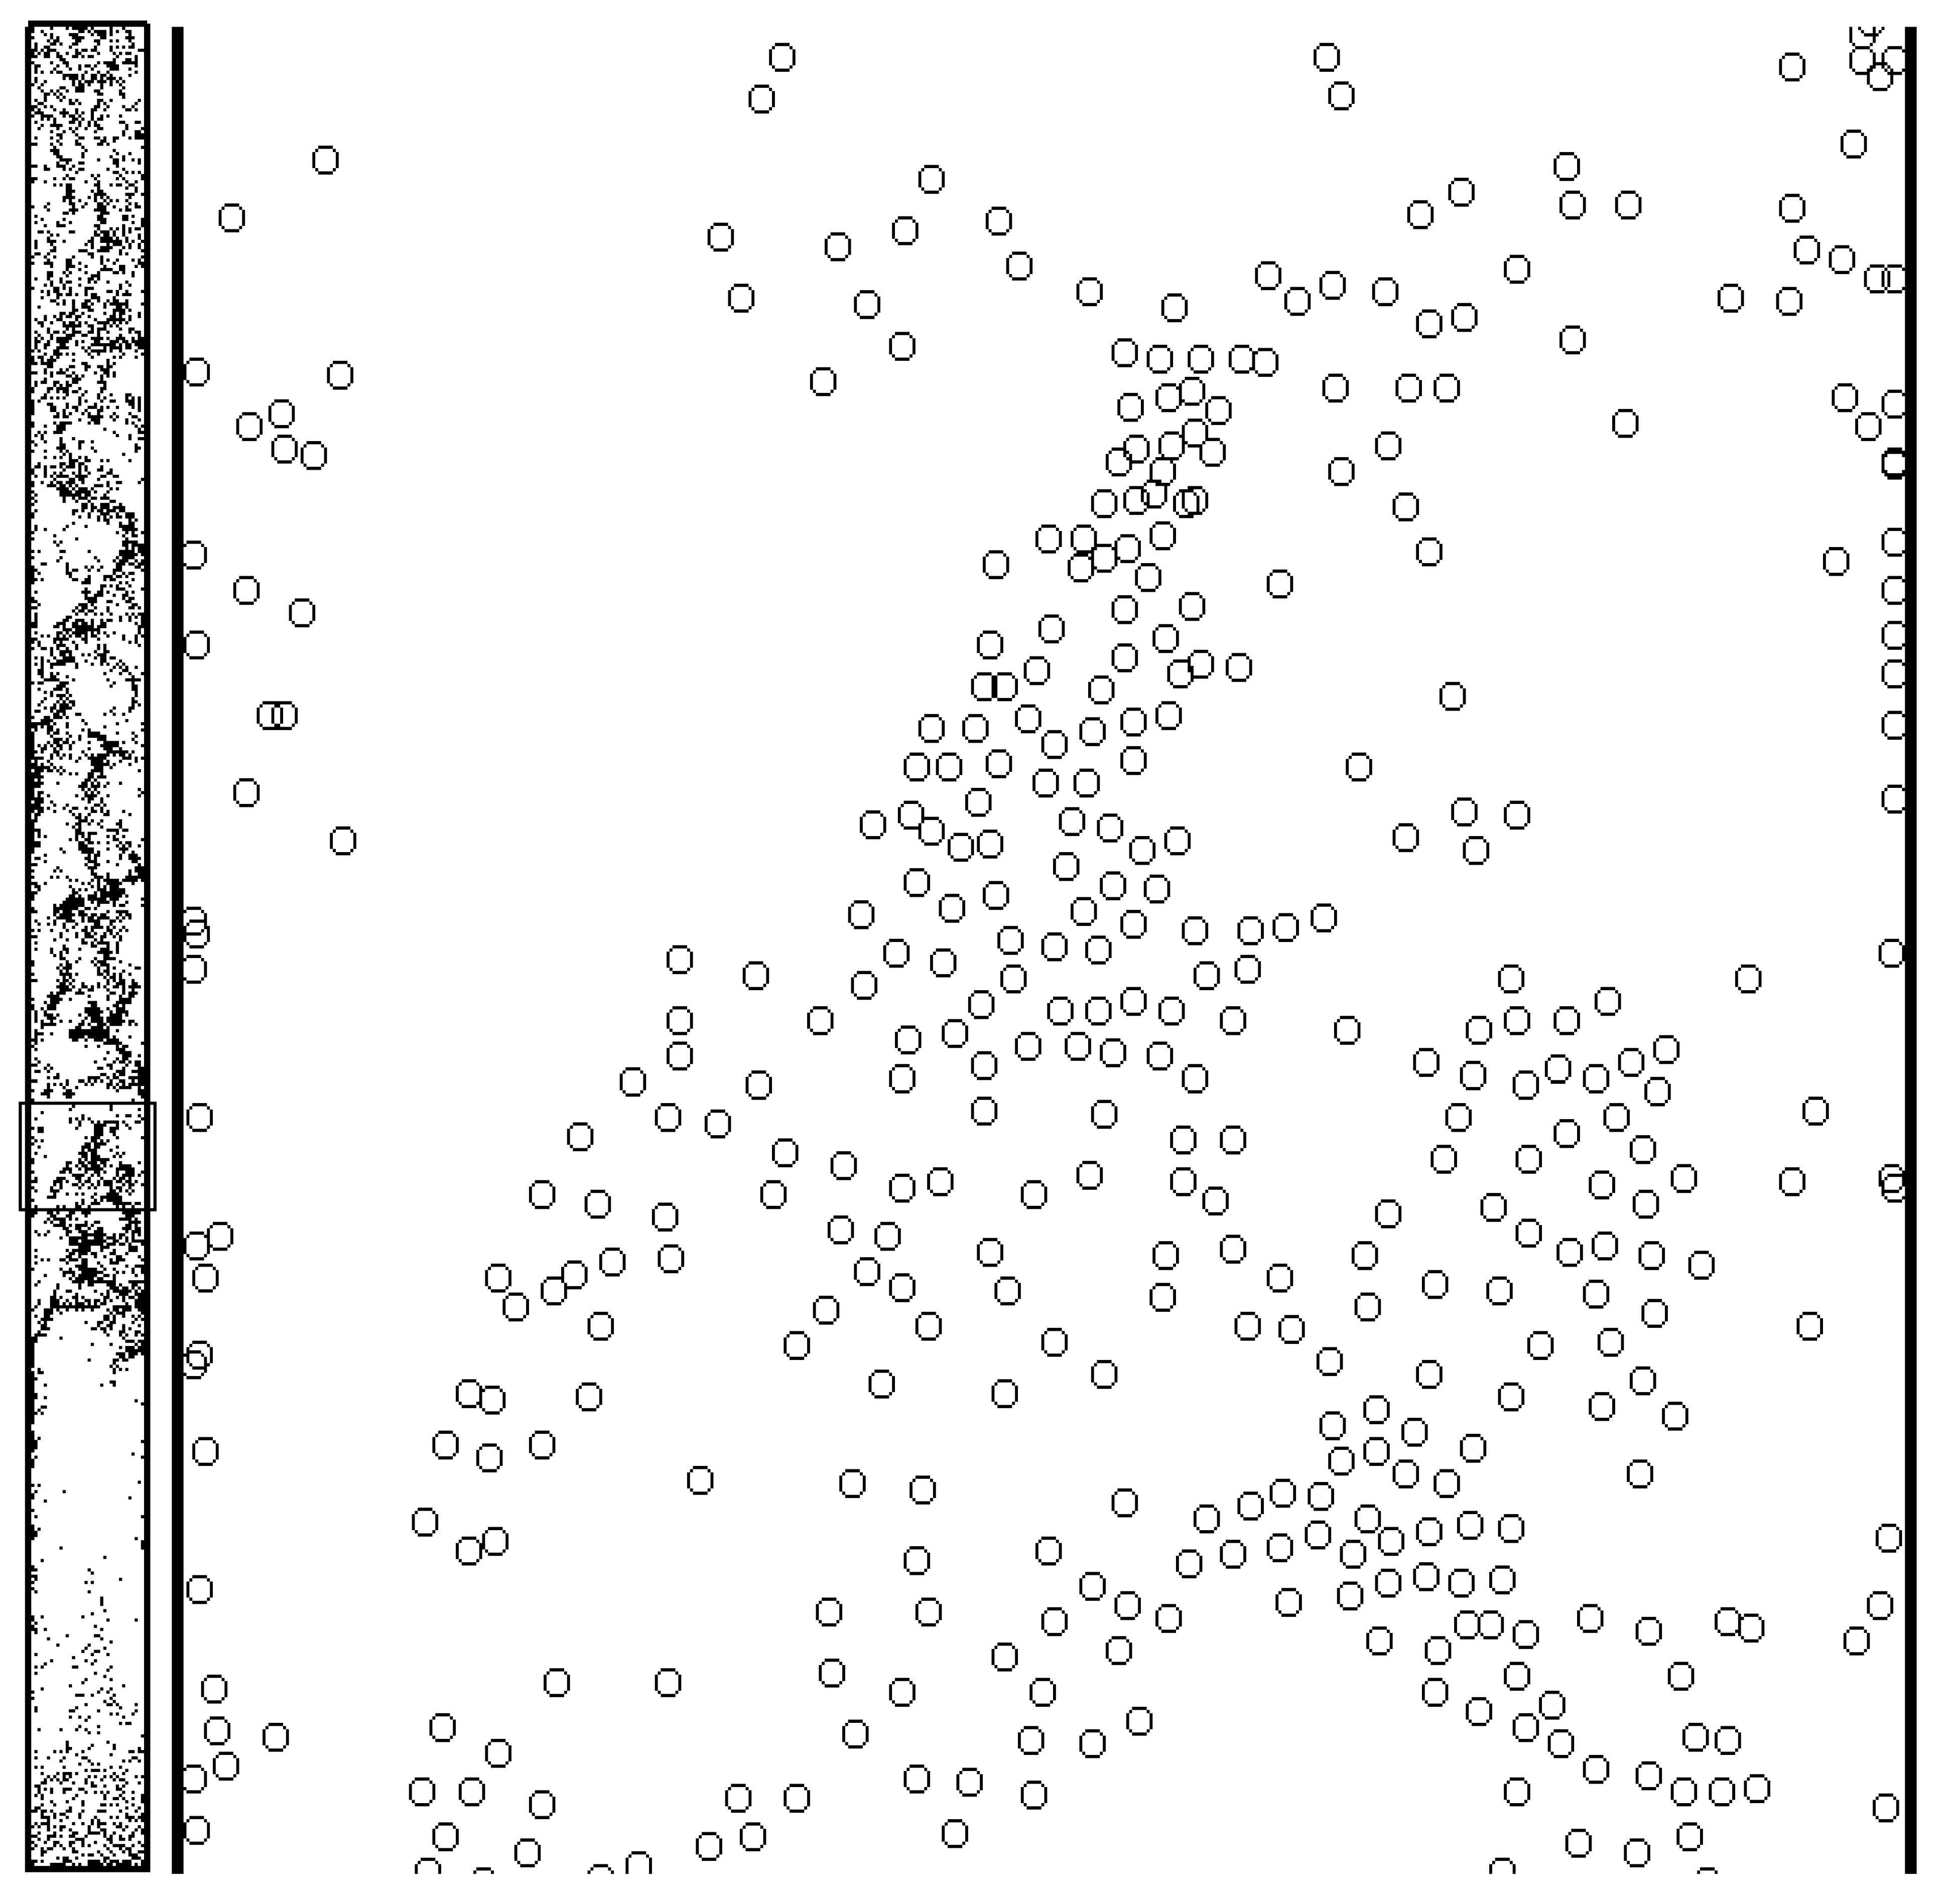
3.3. Large Relative Time Step
Figure 3 shows the simulated particle distributions with large = 0.64 and 0.2. As can be seen from Figure 2a, particles are initially randomly set and are homogeneous. In no more than 0.1 s, the stable flow state is achieved with a dilute-top/dense-bottom axial structure and a homogeneous radial structure. The latter homogeneous structure is untrue and belongs to none of the typical flow types of A-type particles’ fluidization. As can be seen from Figure 2b, in no more than 0.2 s, the stable flow state is also achieved, with an axially homogeneous structure and a radially heterogeneous structure. Both structures are atypical, especially the latter dilute-core/dense-wall structure, which has been reported to be encountered only in the fluidization of special light cork particles [28].
Figure 3.
Particle distributions with large . (a) = 0.64. (b) = 0.2.
Figure 4 shows the variations of outlet solid flux with time through the use of large = 0.2 and 0.64. When = 0.64 corresponding to N/m, there is no evidence of cluster formation because the vibration amplitude of the flux wave is very weak. The dissipated energy is so high, mainly in the form of particle–particle and particle–wall collisions, that the system energy for particle suspension and transportation is very low. Therefore, the mean outlet solid flux is no more than 20 kg/m2s. On the contrary, when = 0.64 corresponding to N/m, there is obvious evidence that particle clusters can form all along the axial direction. Moreover, there is a large part of system energy for particle suspension and transportation. Therefore, the outlet solid flux is far higher at = 0.2 than at = 0.64.
Figure 4.
Outlet solid flux with large .
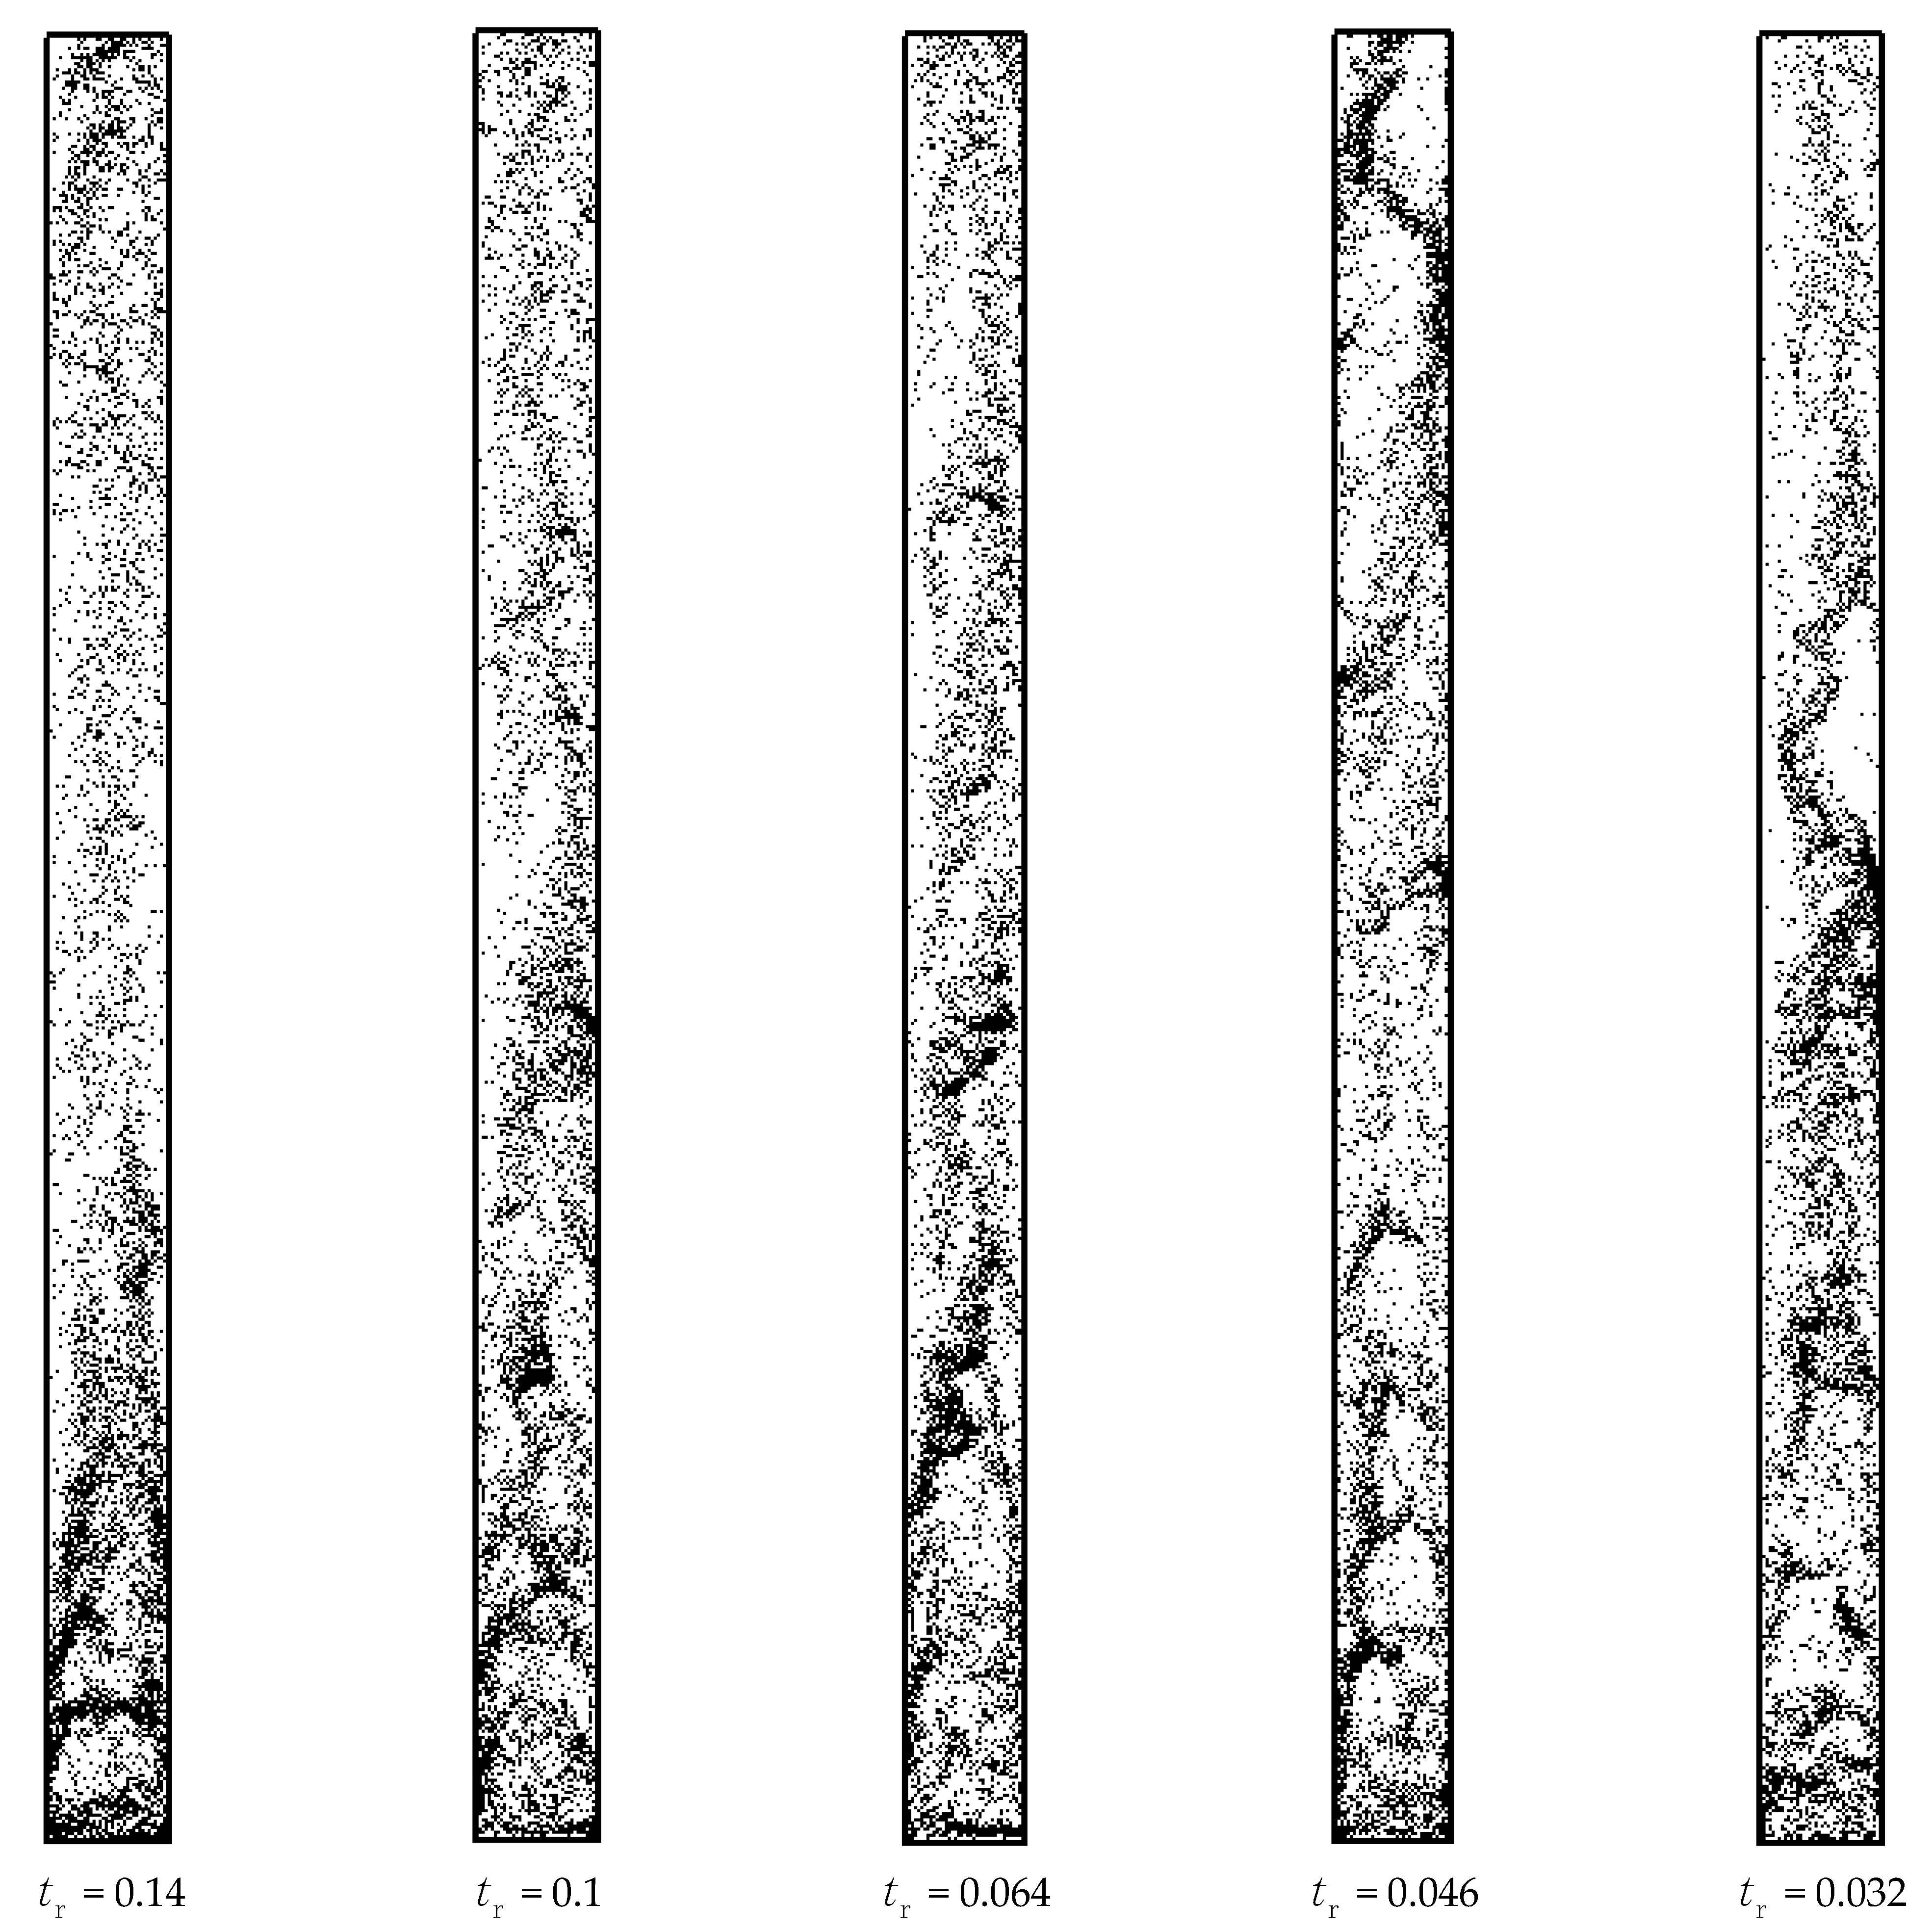
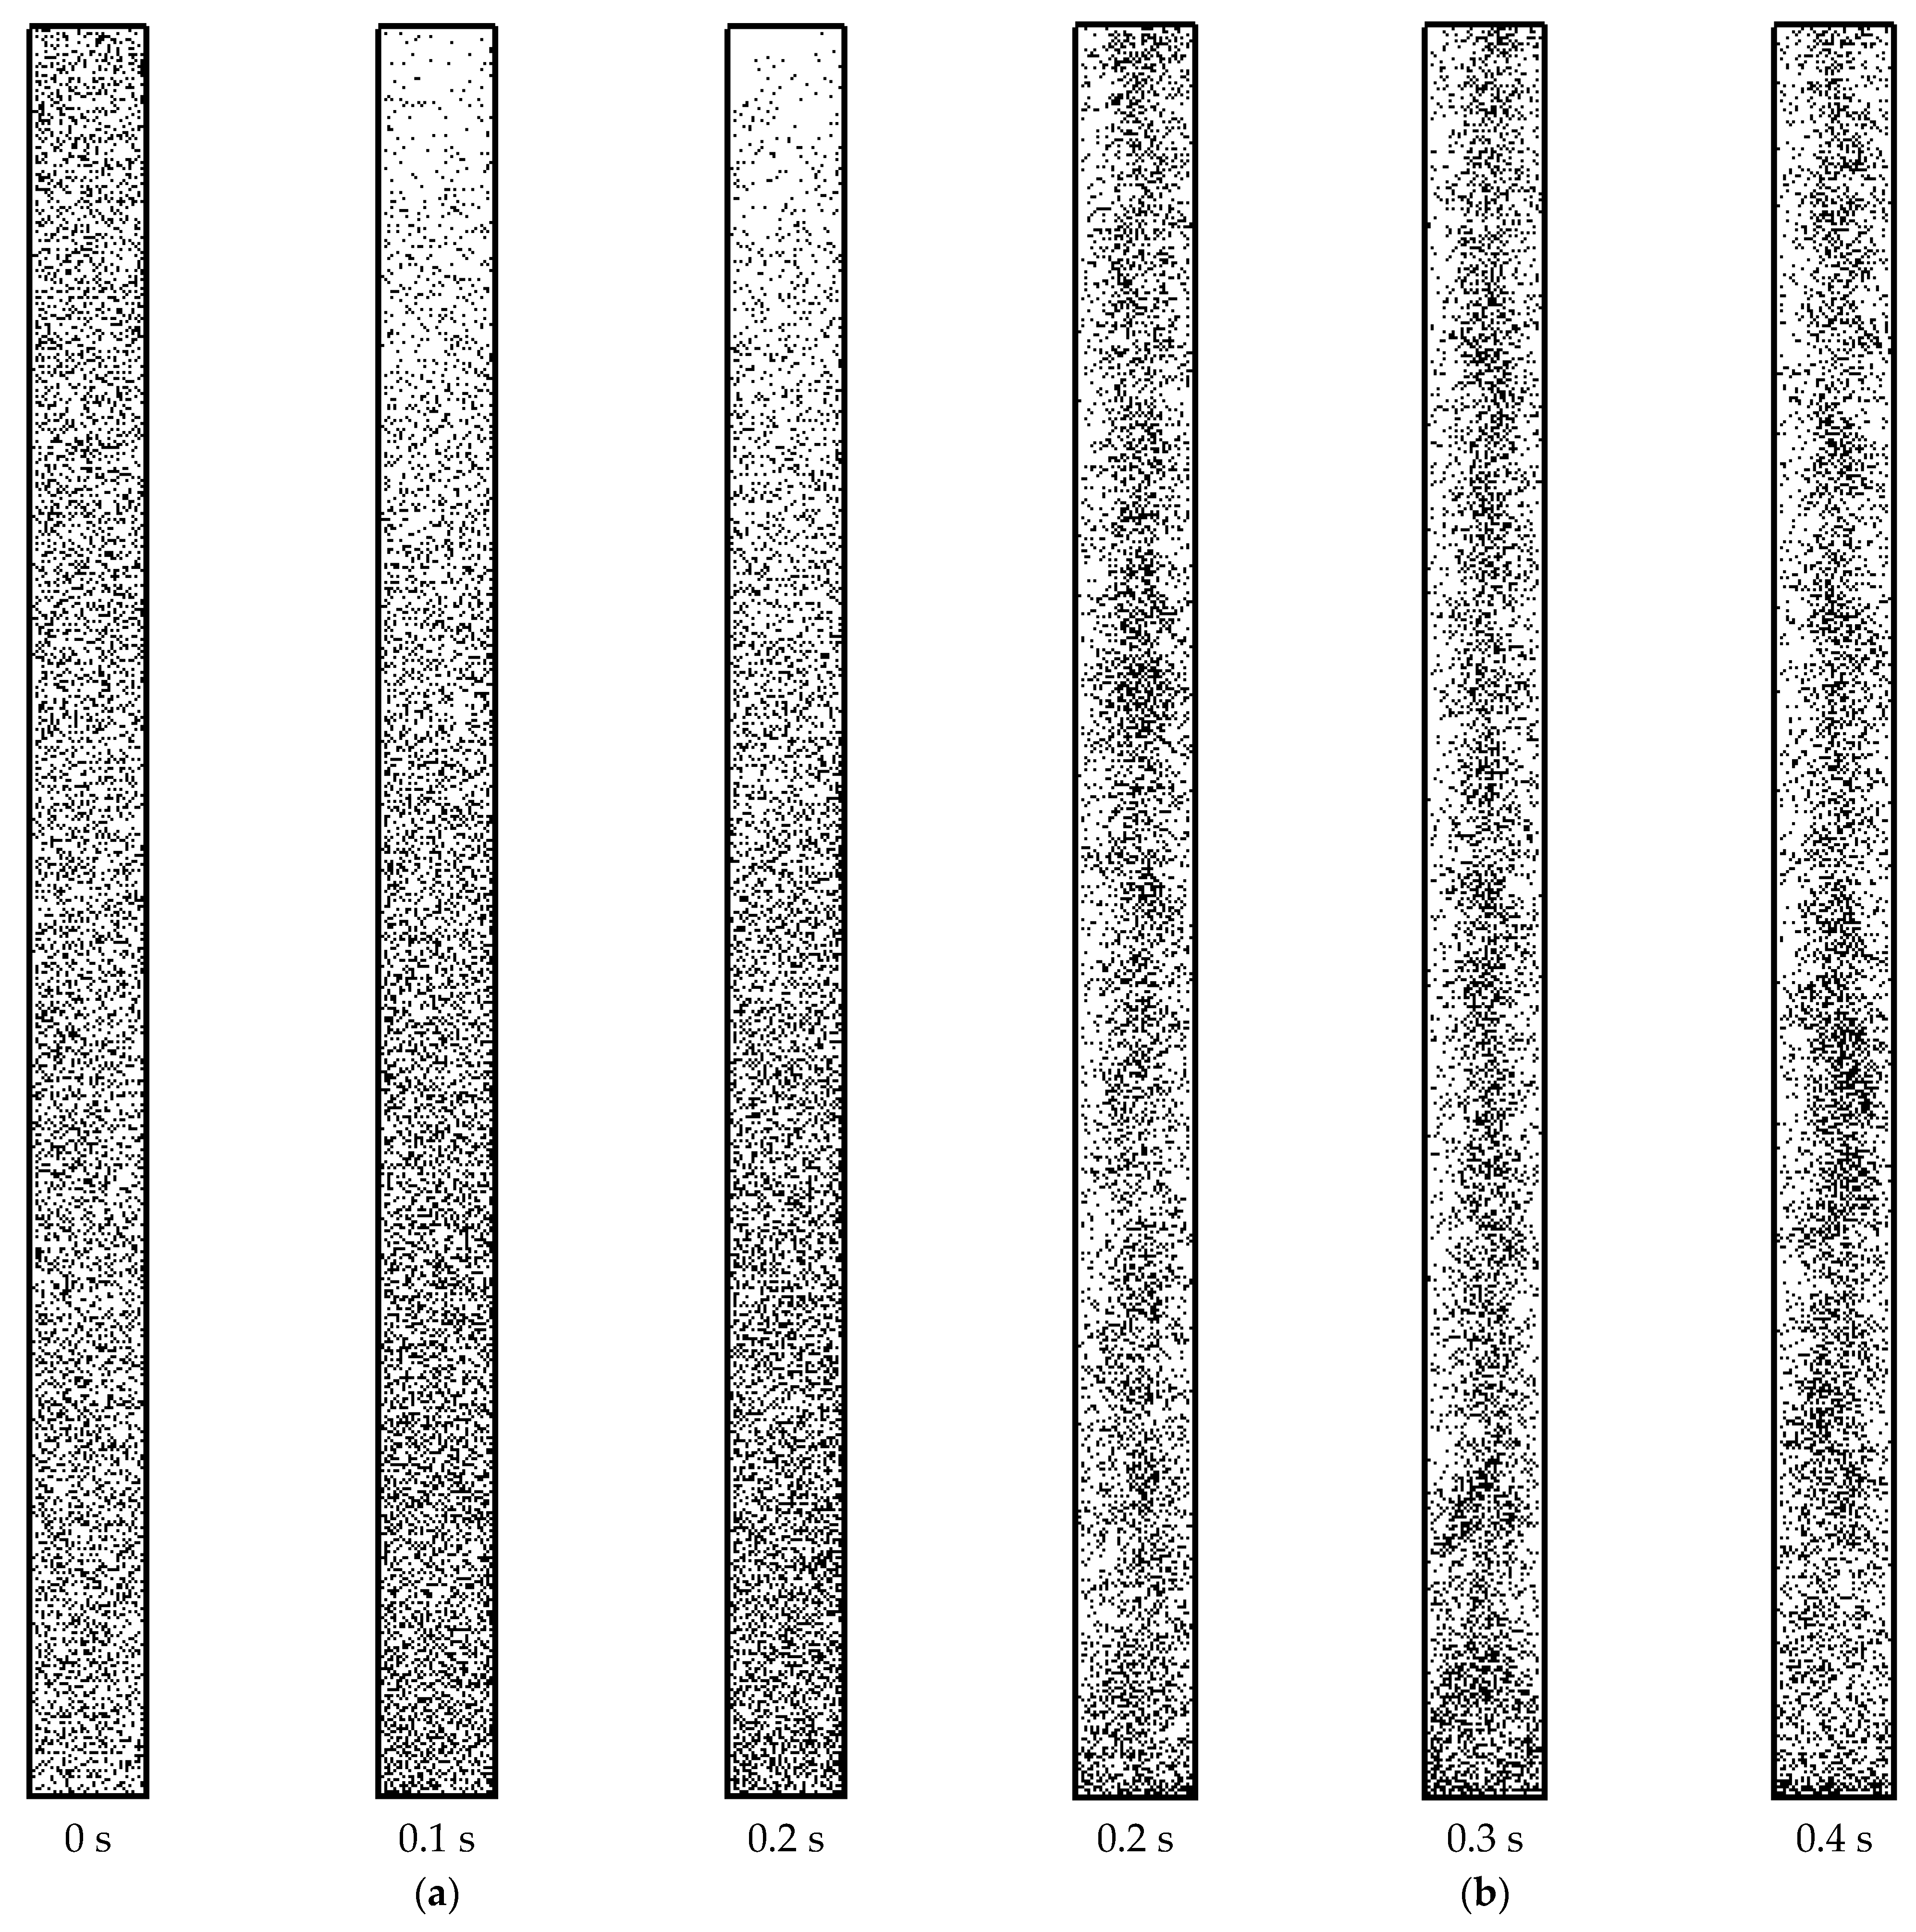
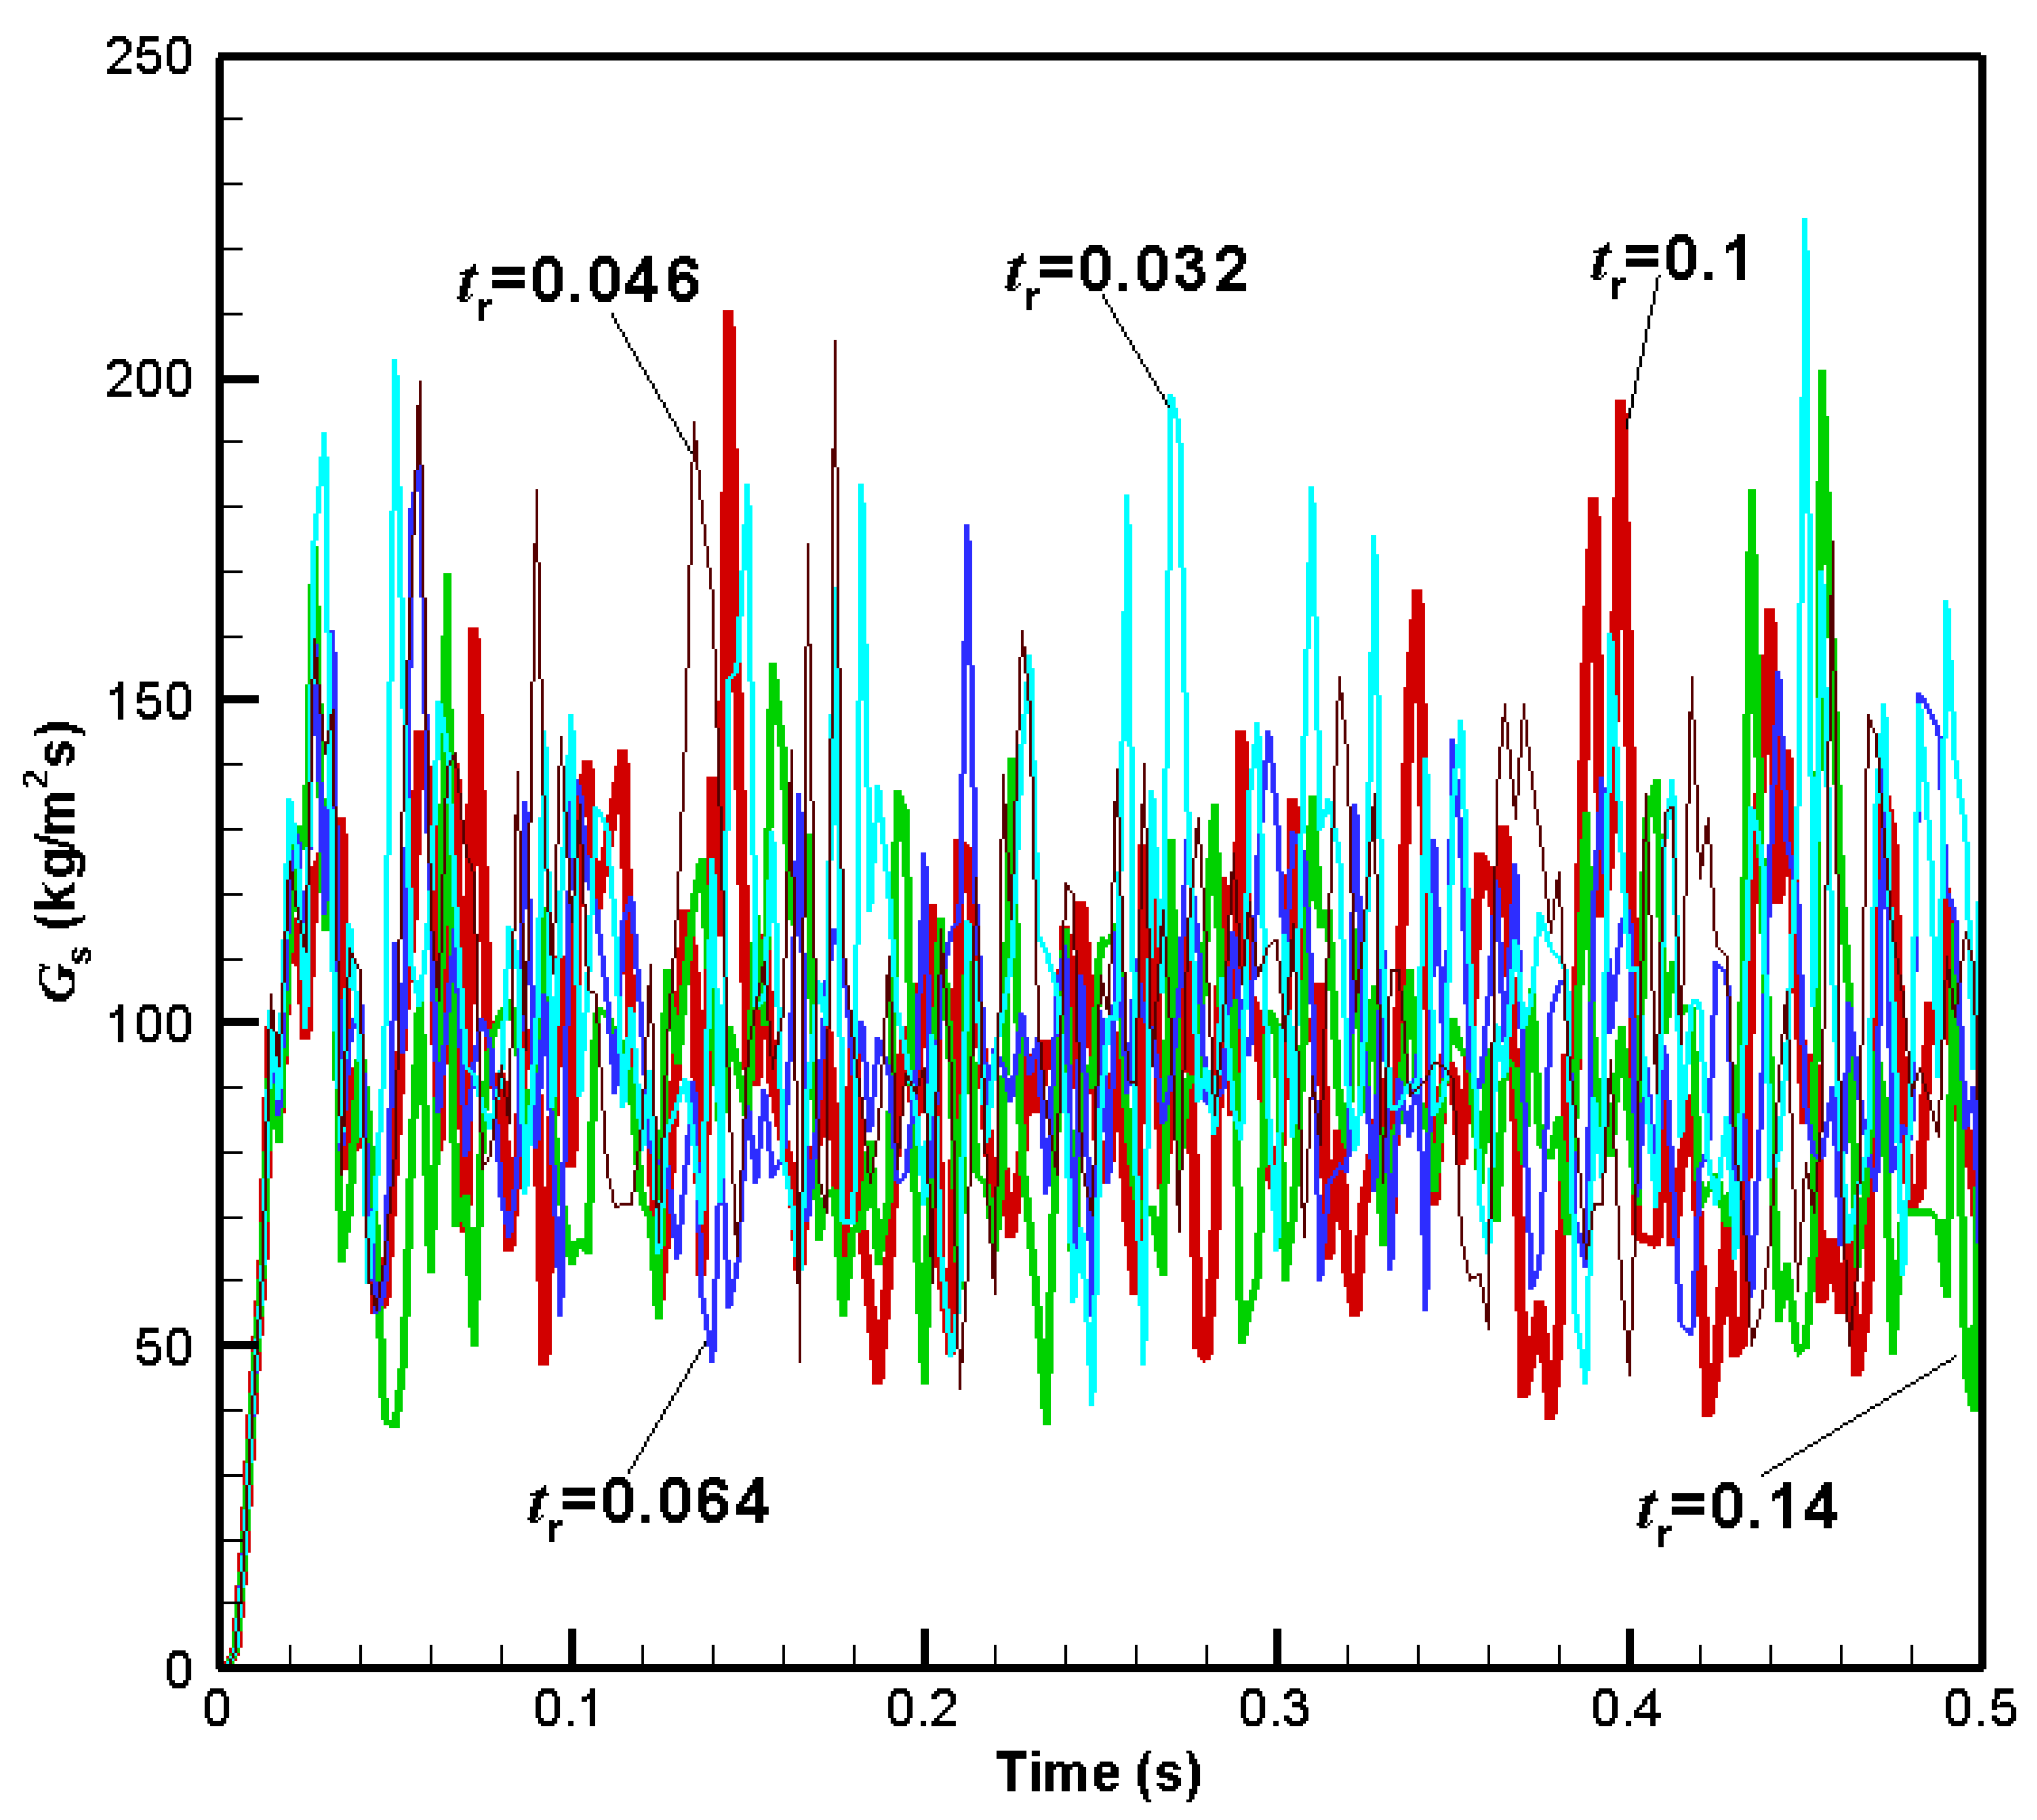
3.4. Moderate Relative Time Step
Figure 5 shows the particle distributions with moderate from 0.032 to 0.14, corresponding to = 0.5 to 10 N/m. It is shown that significantly heterogeneous structures appear with large clusters and frequent formation and breakup. According to frequent existence regions of large clusters, all of the five snapshots possess a whole flow regime of a dilute-top/dense-bottom and dilute-core/dense-wall structure, which is obvious evidence of fast fluidization. Note that the operation condition and particle property in the present simulations are both the same as those in our previous simulations [25]. The present simulated fast fluidization becomes the right flow regime.
Figure 5.
Particle distributions with moderate .
Figure 6 shows the particle distributions with moderate = 0.064. The right snapshot of Figure 7 is the magnification of the marked region in the left snapshot. In the left snapshot, some particles aggregate to form extremely dense clusters along the riser wall of the sectional drawing area. As the sectioned area is near the outlet, clustering particles are also high-speed ones. The sectioned area are the most identifiable trouble spots where particles are easy to excessively overlap. As is noticed in the right snapshot, particles can get fully close to or even in contact with each other, but without excessive overlap. In Figure 7, = 0.064, which is enough to guarantee the good performance in the simulation of particle collision. Here, the stiffness coefficient of particle = 2 N/m, which is artificially brought down for the safe setting of relatively large time steps to reduce the calculation load.
Figure 6.
Particle distributions with moderate = 0.064.
Figure 7.
Outlet solid flux with moderate .
Figure 7 shows the variations of outlet solid flux with time by use of moderate . It is noticed that for all of the five cases, the simulated outlet solid flux reaches a globally steady state after 0.1 s. The average outlet solid flux ranges from approximately 90 to 110 kg/m2s. The instantaneous values predicted by the use of moderate fluctuate much more violently than those predicted by use of large , indicating a more disordered and unstable status in the riser due to its large cluster nature. This indicates the effectiveness of the moderate relative DEM time step in guaranteeing the simulation accuracy. As is also noticed in the figure, the highest average outlet solid flux is achieved at = 0.032, while the lowest is at = 0.14. However, the average outlet solid flux is similar when = 0.046, 0.064, and 0.1. There is no obvious evidence to support the tendency that the higher , the lower the average outlet solid flux.
After repetitive verification of four other cases of moderate relative DEM time steps, it is concluded that moderate is the most preferable for simulation of A-type FCC particles. From Figure 5 and Figure 7, it is hard to quantitatively discern the best value of . The further optimization of the moderate DEM time step is thus unidentifiable. Moreover, note that the range of the moderate time step is too limited, which also indicates a narrow range of both real DEM time steps and stiffness coefficients. It seems that the common linear collision soft-sphere model is poor at modeling fine particles with high velocity. In contrast, many studies have shown that the use of a molecular dynamics model is more appropriate for dealing with fine particles. It is suggested that possible future work should be focused on improving the simulation frame and employing a molecular dynamics model to more appropriately deal with particle contact [29].
4. Conclusions
How to appropriately select the DEM time step and the stiffness coefficient is one of the most critical problems for the stable and accurate calculation in DEM simulation of fine particles’ high-speed fluidization. This article mainly discusses the effect of the stiffness coefficient and DEM time step on simulations of Type-A FCC particles. Some empirical rules found regarding the bifurcation occurrence with respect to relative time steps are the following:
- (1)
- An over-large relative DEM time step leads to divergence of simulation. When the absolute time step is higher but keeps the same order with the critical time step, exception occurs worse than in the simulation of low-speed traditional fluidization of coarse particles.
- (2)
- An over-low relative DEM time step may also lead to divergence of simulation. This is not reported in past simulations.
- (3)
- Although a large relative DEM time step does not lead to the divergence of simulation, it predicts an untrue fluidization regime. This is also worse than in simulations of low-speed traditional fluidization.
- (4)
- A moderate DEM time step possesses the best capability of modelling the process of particle collision and thus predicts the right flow regime. Under the moderate relative time step, the stiffness coefficient can be artificially brought down to far lower than the real value for the safe setting of a relatively large time step to reduce the calculation load.
Although use of a moderate DEM time step can successfully simulate fast fluidization of A-type particles, there is still a range of artificial choice. The optimization of a moderate DEM time step is unidentifiable and thus is an outstanding issue. Moreover, as the range of the moderate DEM time step is too limited, it seems that the common linear collision soft-sphere model is poor at modeling fine particles with high velocities. It is suggested that possible future work should be focused on improving the simulation frame and employing a molecular dynamics model to more appropriately deal with particle contact.
Author Contributions
Conceptualization, G.W.; methodology, G.W.; software, G.W.; validation, G.W. and Z.Z.; formal analysis, G.W.; investigation, G.W.; resources, G.W.; data curation, G.W.; writing—original draft preparation, G.W.; writing—review and editing, G.W.; visualization, G.W.; supervision, Z.Z. and Y.L.; and project administration, Z.Z. and Y.L. All authors have read and agreed to the published version of the manuscript.
Funding
This research received fundings supported by Natural Science Foundation of Chongqing (CSTB2022NSCQ-MSX0290) and National Natural Science Foundation of China (61962051).
Data Availability Statement
The date underlying this article will be shared on reasonable request to the first author.
Conflicts of Interest
The authors declare no conflict of interest. The funders had no role in the design of the study; in the collection, analyses, or interpretation of data; in the writing of the manuscript, or in the decision to publish the results.
Nomenclature
| A | particle disk area, m2 |
| C | drag coefficient |
| d | particle diameter or distance between particle, m |
| F | force on particle, N |
| G | outlet solid flux, kg·m−2·s−1 |
| g | gravity acceleration, m/s2 |
| H | bed height, m |
| Ha | Hamaker constant, N·m |
| H0 | cut-off distance, m |
| I | inertia moment of the particle as spherical, kg·m2 |
| i, j, k | particle or grid indexes |
| N | particle number |
| p | pressure, Pa |
| Re | Reynolds number of particle |
| T | torque, N·m |
| t | time, s |
| u | inlet gas velocity, m·s−1 |
| u | gas velocity, m·s−1 |
| V | particle volume, m3 |
| v | particle velocity, m·s−1 |
| Greek letters | |
| momentum exchange coefficient, kg·m−3·s−1 | |
| porosity | |
| stiffness coefficient, N·m−1 | |
| gas viscosity, N·s·m−2 | |
| ratio of circumference | |
| density, kg·m−3 | |
| viscous stress tensor, Pa | |
| particle angular velocity, s−1 | |
| restitution coefficient | |
| Subscripts | |
| 2D | two-dimensional |
| 3D | three-dimensional |
| C | contact |
| c | critical |
| D | drag |
| g | gas |
| i, j, k | particle or grid indexes |
| m | minimal |
| p | particle |
| r | relative |
| V | van der Waals force type |
| w | wall |
References
- Jin, Y.; Zhu, J.X.; Wang, Z.W.; Yu, Z.Q. Fluidization Engineering Principles; Tsinghua University Press: Beijing, China, 2001. [Google Scholar]
- Tsuji, Y.; Kawaguchi, T.; Tanake, T. Discrete particle simulation of two-dimensional fluidized bed. Powder Technol. 1993, 77, 79–87. [Google Scholar] [CrossRef]
- Hoomans, B.P.B.; Kuipers, J.A.M.; Briels, W.J.; Van Swaaij, W.P.M. Discrete particle simulation of bubble and slug formation in a two-dimensional gas-fluidised bed: A hard-sphere approach. Chem. Eng. Sci. 1996, 51, 99–108. [Google Scholar] [CrossRef]
- Xu, B.H.; Yu, A.B. Numerical simulation of the gas-solid flow in a fluidized bed by combing discrete particle method with computational fluid dynamics. Chem. Eng. Sci. 1997, 52, 2785–2809. [Google Scholar] [CrossRef]
- Ouyang, J.; Li, J.H. Particle-motion-resolved discrete model for simulating gas-solid fluidization. Chem. Eng. Sci. 1999, 54, 2077–2083. [Google Scholar] [CrossRef]
- Geldart, D. Types of Gas Fluidization. Powder Technol. 1973, 7, 285–292. [Google Scholar] [CrossRef]
- Yuu, S.; Abe, T.; Saitoh, T.; Umek, T. Three-dimensional numerical simulation of the motion of particles discharging from a rectangular hopper using distinct element method and comparison with experimental data (effects of time steps and material properties). Adv. Powder Technol. 1995, 6, 259–269. [Google Scholar] [CrossRef]
- Yu, A.B.; Xu, B.H. Particle-scale modelling of gas–solid flow in fluidisation. J. Chem. Technol. Biotechnol. 2003, 78, 111–121. [Google Scholar]
- Ye, M.; van der Hoef, M.; Kuipers, J. 2004. A numerical study of fluidization behavior of Geldart A particles using a discrete particle model. Powder Technol. 2004, 139, 129–139. [Google Scholar]
- Kobayashi, T.; Tanaka, T.; Kawaguchi, T.; Mukai, T.; Tsuji, Y. DEM analysis on flow patterns of Geldart’s group A particles in fluidized bed effect of adhesion and lubrication forces. J. Soc. Powder Technol. Jpn. 2006, 43, 737–745. [Google Scholar] [CrossRef]
- Di Renzo, A.; Di Maio, F.P. Homogeneous and bubbling fluidization regimes in DEM–CFD simulations: Hydrodynamic stability of gas and liquid fluidized beds. Chem. Eng. Sci. 2007, 62, 116–130. [Google Scholar]
- Ye, M.; van der Hoef, M.A.; Kuipers, J. The effects of particle and gas properties on the fluidization of Geldart A particles. Chem. Engi. Sci. 2005, 60, 4567–4580. [Google Scholar] [CrossRef]
- Wang, J.W.; Van der Hoef, M.; Kuipers, J. CFD study of the minimum bubbling velocity of Geldart A particles in gas-fluidized beds. Chem. Eng. Sci. 2010, 65, 3772–3785. [Google Scholar] [CrossRef]
- Hou, Q.; Zhou, Z.; Yu, A. Micromechanical modeling and analysis of different flow regimes in gas fluidization. Chem. Eng. Sci. 2010, 84, 449–468. [Google Scholar] [CrossRef]
- Weber, M.W.; Hrenya, C.M. Square-well model for cohesion in fluidized beds. Chem. Eng. Sci. 2006, 61, 4511–4527. [Google Scholar] [CrossRef]
- Yang, F.; Thornton, C.; Seville, J. Effect of surface energy on the transition from fixed to bubbling gas-fluidised beds. Chem. Eng. Sci. 2013, 90, 119–129. [Google Scholar] [CrossRef]
- Galvin, J.E.; Benyahia, S. The effect of cohesive forces on the fluidization of aeratable powders. AIChE J. 2014, 60, 473–484. [Google Scholar] [CrossRef]
- Liu, P.; LaMarche, C.Q.; Kellogg, K.M.; Hrenya, C.M. Fine-particle defluidization: Interaction between cohesion, Young’s modulus and static bed height. Chem. Eng. Sci. 2016, 145, 266–278. [Google Scholar] [CrossRef]
- Pandit, J.K.; Wang, X.S.; Rhodes, M.J. Study of Geldart’s Group A behaviour using the discrete element method simulation. Powder Technol. 2005, 160, 7–14. [Google Scholar] [CrossRef]
- Pandit, J.K.; Wang, X.S.; Rhodes, M.J. On Geldart Group A behaviour in fluidized beds with and without cohesive interparticle forces: A DEM study. Powder Technol. 2006, 164, 130–138. [Google Scholar] [CrossRef]
- Wang, J.W.; Van der Hoef, M.; Kuipers, J. Why the two-fluid model fails to predict the bed expansion characteristics of Geldart A particles in gas-fluidized beds: A tentative answer. Chem. Eng. Sci. 2009, 64, 622–625. [Google Scholar] [CrossRef]
- Kobayashi, T.; Tanaka, T.; Shimada, N.; Kawaguchi, T. DEM-CFD analysis of fluidization behavior of Geldart Group A particles using a dynamic adhesion force model. Powder Technol. 2013, 248, 143–152. [Google Scholar] [CrossRef]
- Li, T.; Rabha, S.; Verma, V.; Dietiker, J.F.; Xu, Y.; Lu, L.; Rogers, W.; Gopalan, B.; Breault, G.; Tucker, J.; et al. Experimental study and discrete element method simulation of Geldart Group A particles in a small-scale fluidized bed. Adv. Powder Technol. 2017, 28, 2961–2973. [Google Scholar] [CrossRef]
- Li, S.; Zhao, P.; Xu, J.; Zhang, L.; Wang, J. Direct comparison of CFD-DEM simulation and experimental measurement of Geldart A particles in a micro-fluidized bed. Chem. Eng. Sci. 2021, 64, 622–625. [Google Scholar] [CrossRef]
- Wu, G.R.; Li, Y.G. DPM simulations of A-Type FCC particles’ fast fluidization by use of structure-dependent nonlinear drag force. Processes 2021, 9, 1574–1584. [Google Scholar] [CrossRef]
- Patankar, T.V. Numerical Heat Transfer and Fluid Flow; Hemisphere Publishing Corporation: New York, NY, USA, 1980. [Google Scholar]
- Wen, C.Y.; Yu, Y.H. Mechanics of fluidization. Chem. Eng. Progr. Symp. Ser. 1966, 62, 100–111. [Google Scholar]
- Wu, G.R.; Ouyang, J.; Li, Q. Riser simulation and radial porosity distribution characterization for gas-fluidized bed of cork particles. J. Therm. Sci. 2014, 23, 368–374. [Google Scholar] [CrossRef]
- Espinosa-Duran, J.M.; Sereda, Y.V.; Abi-Mansour, A.; Ortoleva, P. A multiscale molecular dynamics approach to energy transfer in nanomaterials. J. Chem. Theory Comput. 2017, 14, 916–928. [Google Scholar] [CrossRef] [PubMed]
Disclaimer/Publisher’s Note: The statements, opinions and data contained in all publications are solely those of the individual author(s) and contributor(s) and not of MDPI and/or the editor(s). MDPI and/or the editor(s) disclaim responsibility for any injury to people or property resulting from any ideas, methods, instructions or products referred to in the content. |
© 2023 by the authors. Licensee MDPI, Basel, Switzerland. This article is an open access article distributed under the terms and conditions of the Creative Commons Attribution (CC BY) license (https://creativecommons.org/licenses/by/4.0/).