
A Hybrid Heuristic Algorithm Using Artificial Agents for Data Replication Problem in Distributed Systems


 ,
,  ,
,  and
and 
Abstract
:1. Introduction
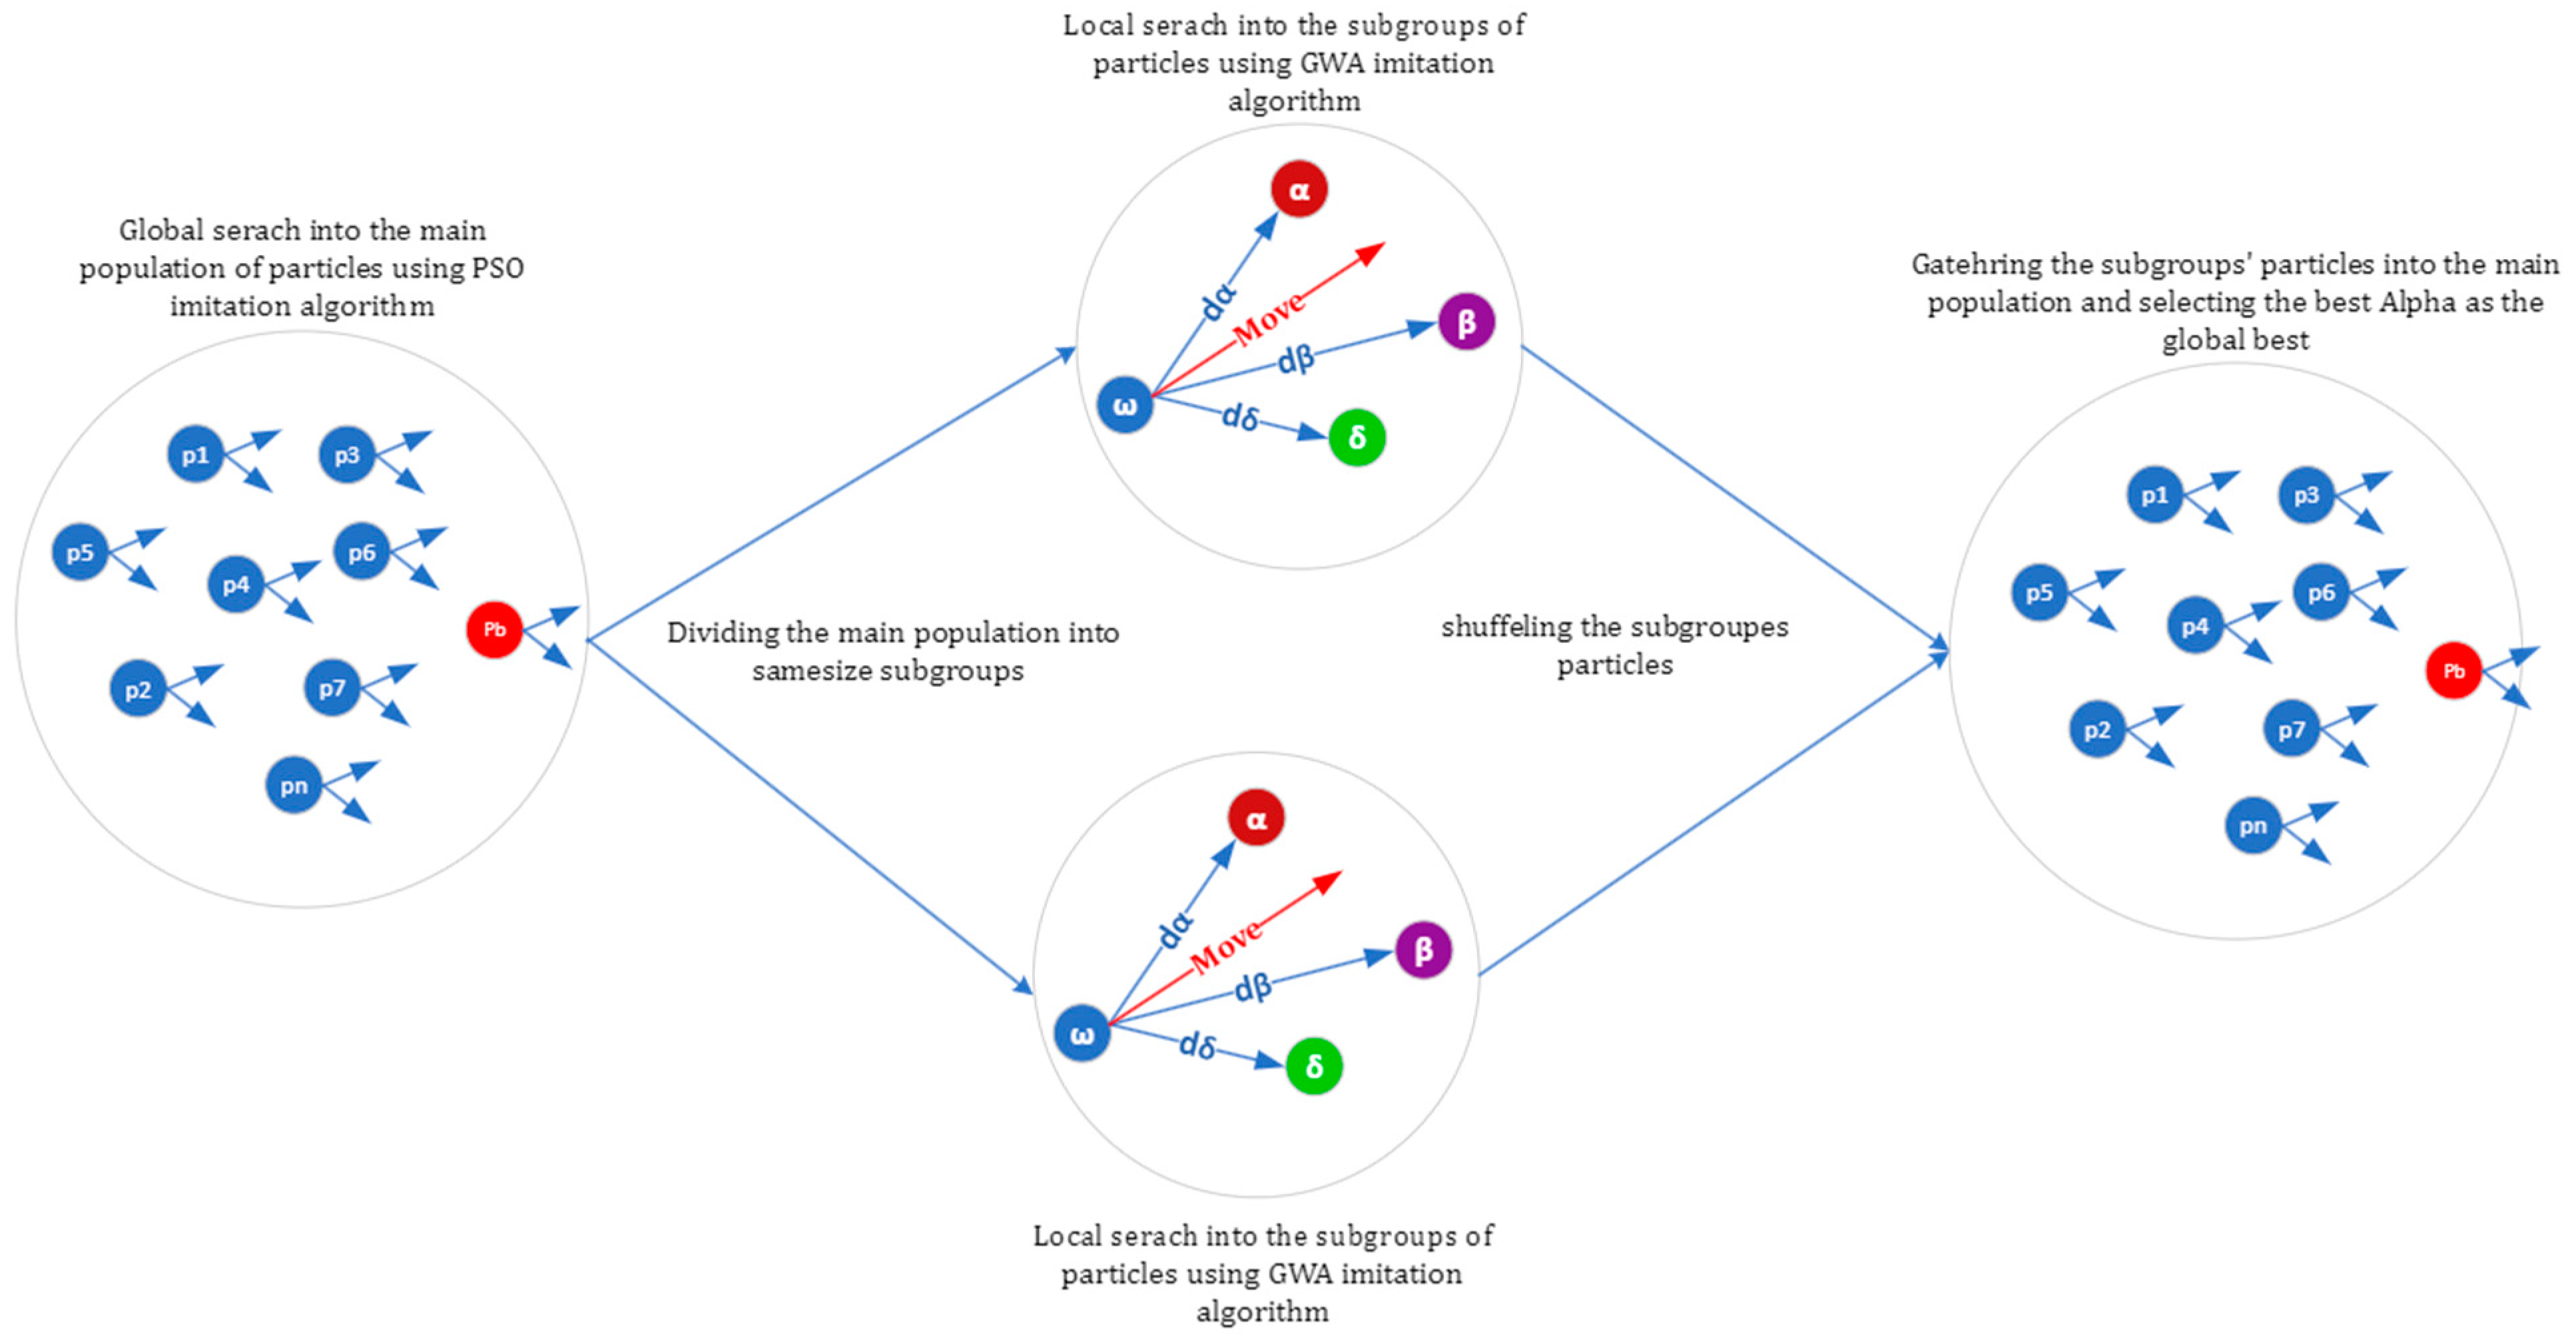
- In the proposed method, artificial individuals (agents) were developed in such a way that each individual includes local memory to save the visited local best location and velocity; it behaves like a particle (in the PSO) and a gray wolf at the same time. The artificial individuals are divided into subgroups, and each subgroup searches in a separate part of the overall solution space using the GWO imitation strategy. After local searches, the subgroups merge into one population. The best Alpha is selected as the global best of the created main population.
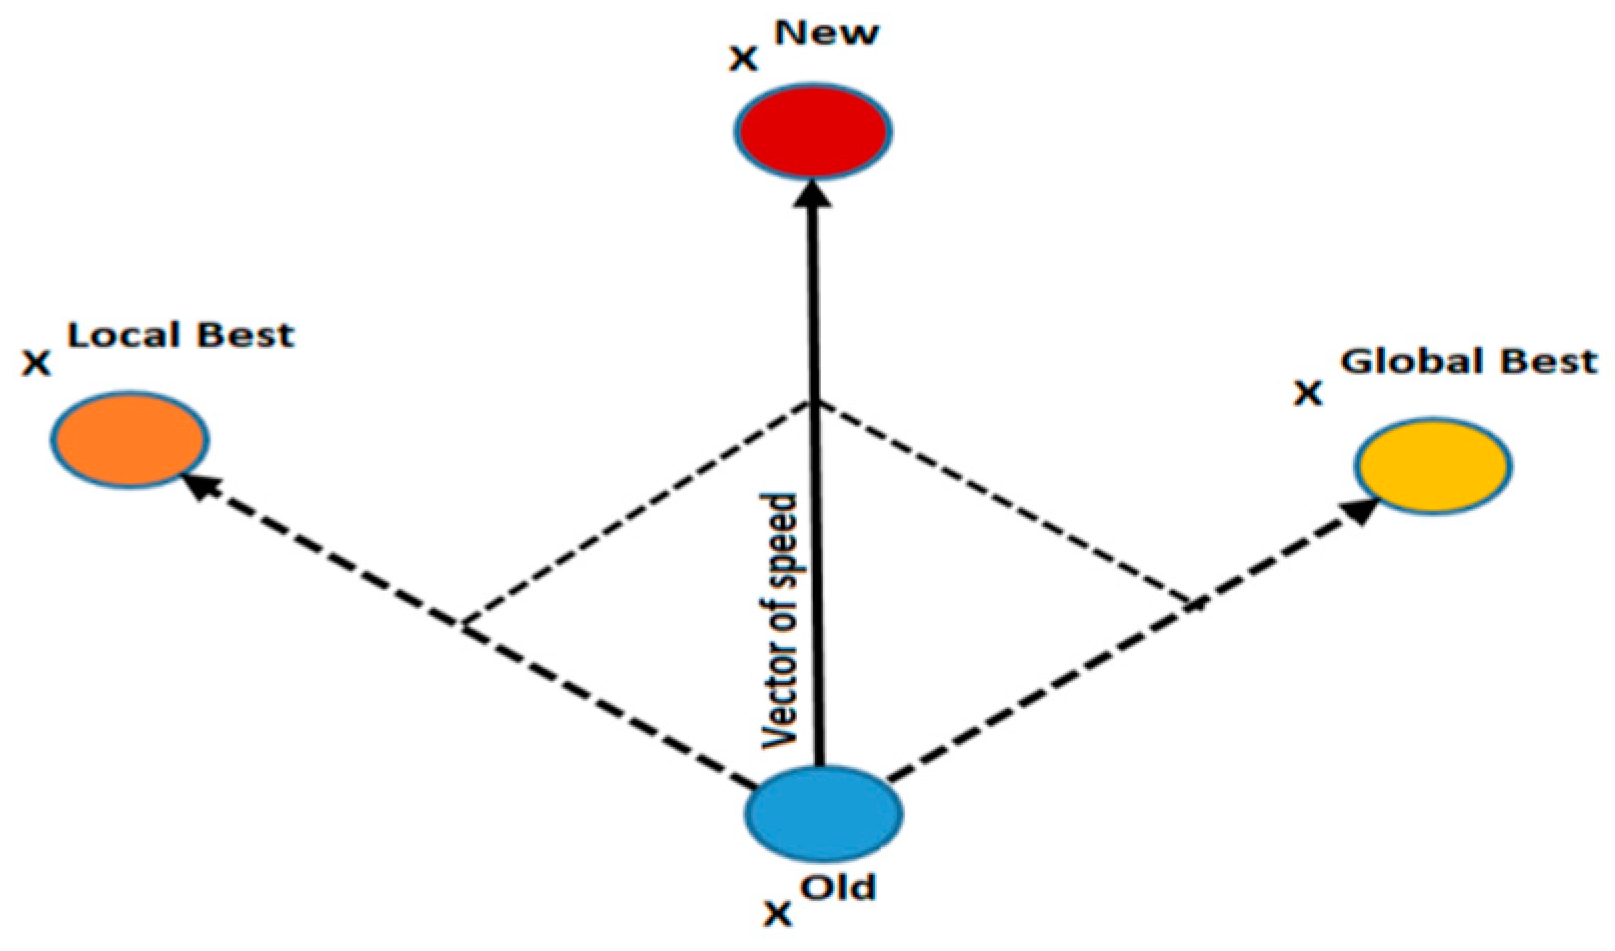
- In the suggested method, the global search is performed using the velocity, local best, and global best of the individuals. The global search was implemented using the PSO imitation strategy. The location and velocity of each individual were imitated using the global best, similar to the particle swarm algorithm. The introduced discrete swarm-based algorithm can be used to solve the discrete optimization problem efficiently.
- Another contribution of this research is the development of the proposed discrete and hybrid algorithm (PSGWA) for solving the data object replication problem in distributed systems. Data replicas should be stored on servers that reduce data access time.
2. Related Work
3. Proposed Method
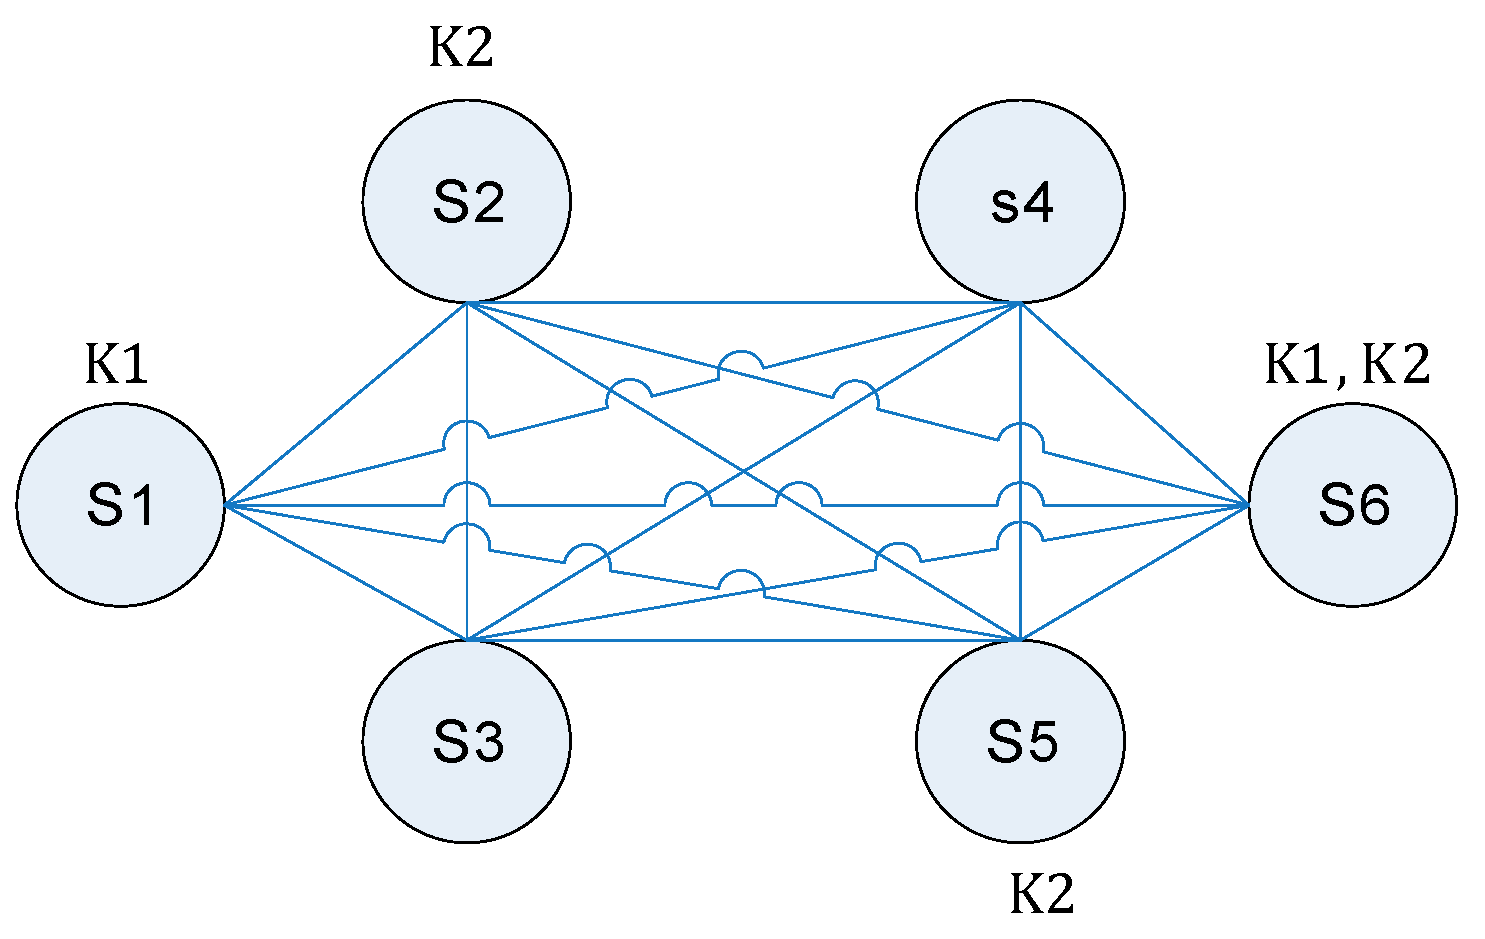
3.1. Problem Specification
3.2. Replica Placement Using PSGWA
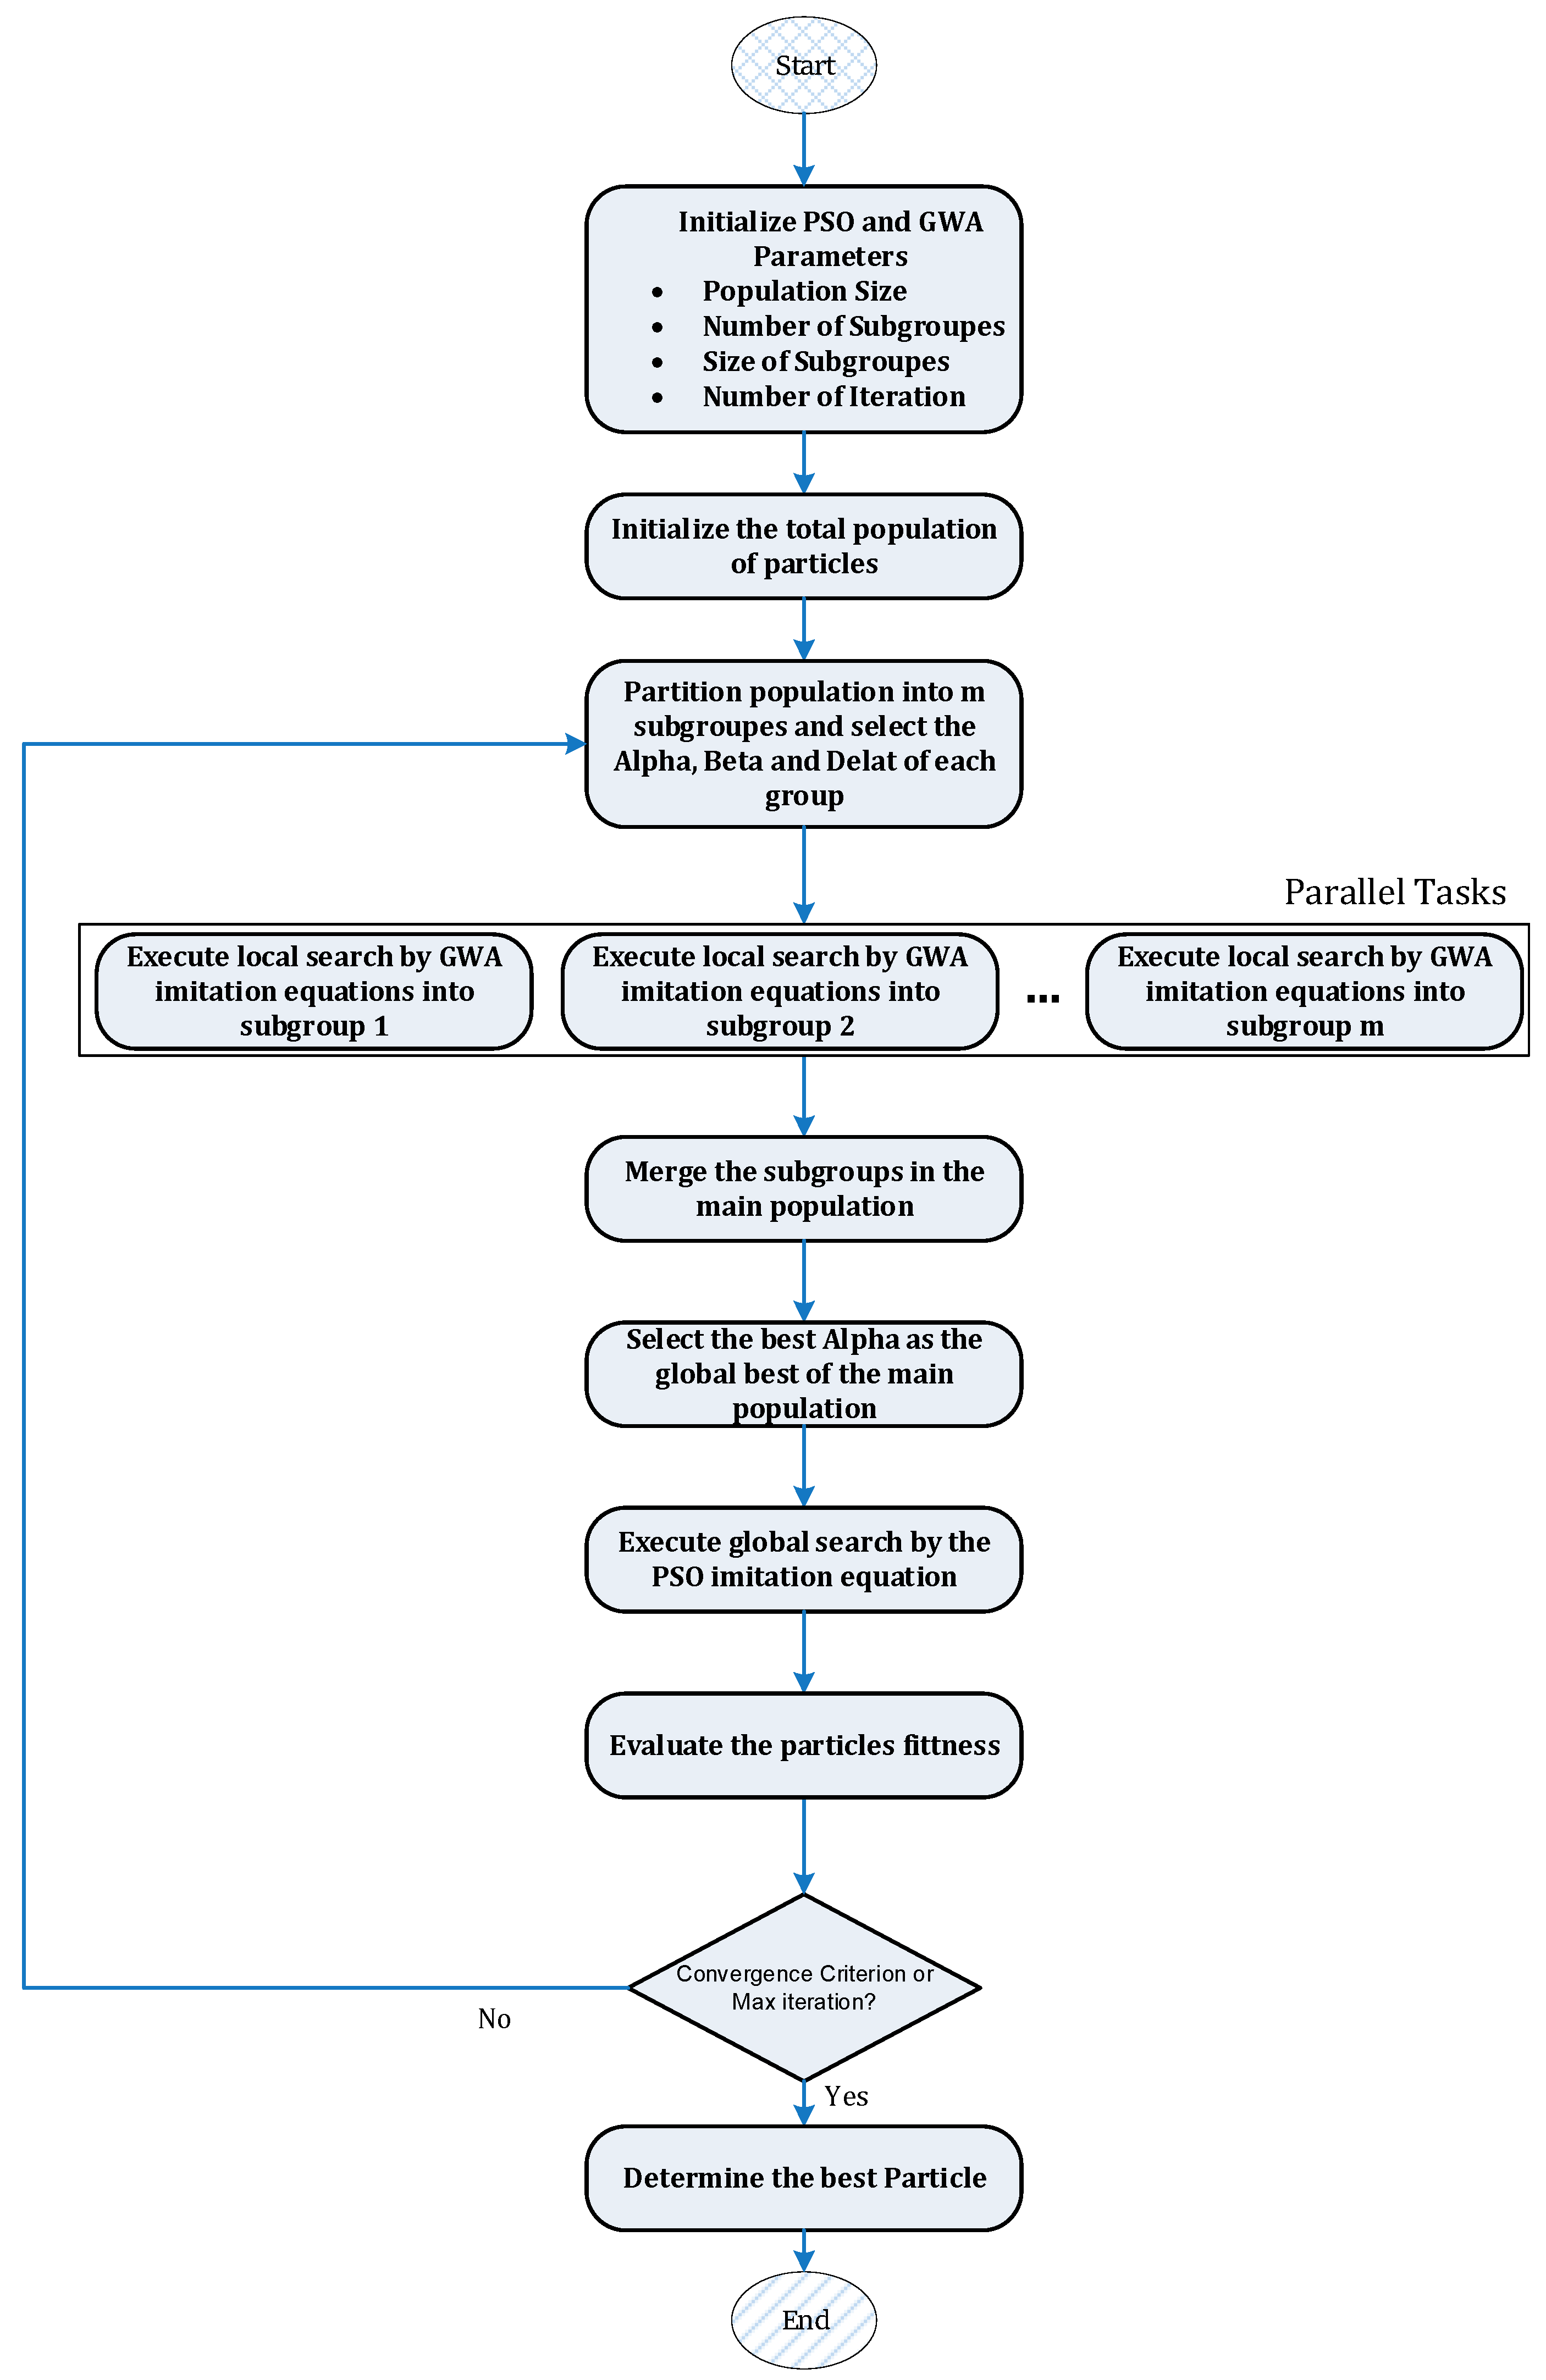
- Initialize population size, iteration, number of subgroups, and size of subgroups;
- Initialize the artificial search-agents with particle and gray wolf features;
- itr = 0;
- While (itr < iteration)
- {
- Partition the particle population into m subgroups;
- Select the Alpha, Beta, and Delta of each subgroup;
- Perform GWO local imitation in each subgroup in parallel using Equations (1)–(10);
- Merge the subgroups in the main population;
- Select the best Alpha of the subgroups as the global best;
- Perform the global search by the PSO algorithm using Equations (11) and (12);
- Evaluate the fitness of the population using Equations (13)–(16);
- itr = itr + 1;
- }
- Return final population.
3.3. Objective Function
4. Simulation Platform and Input Data
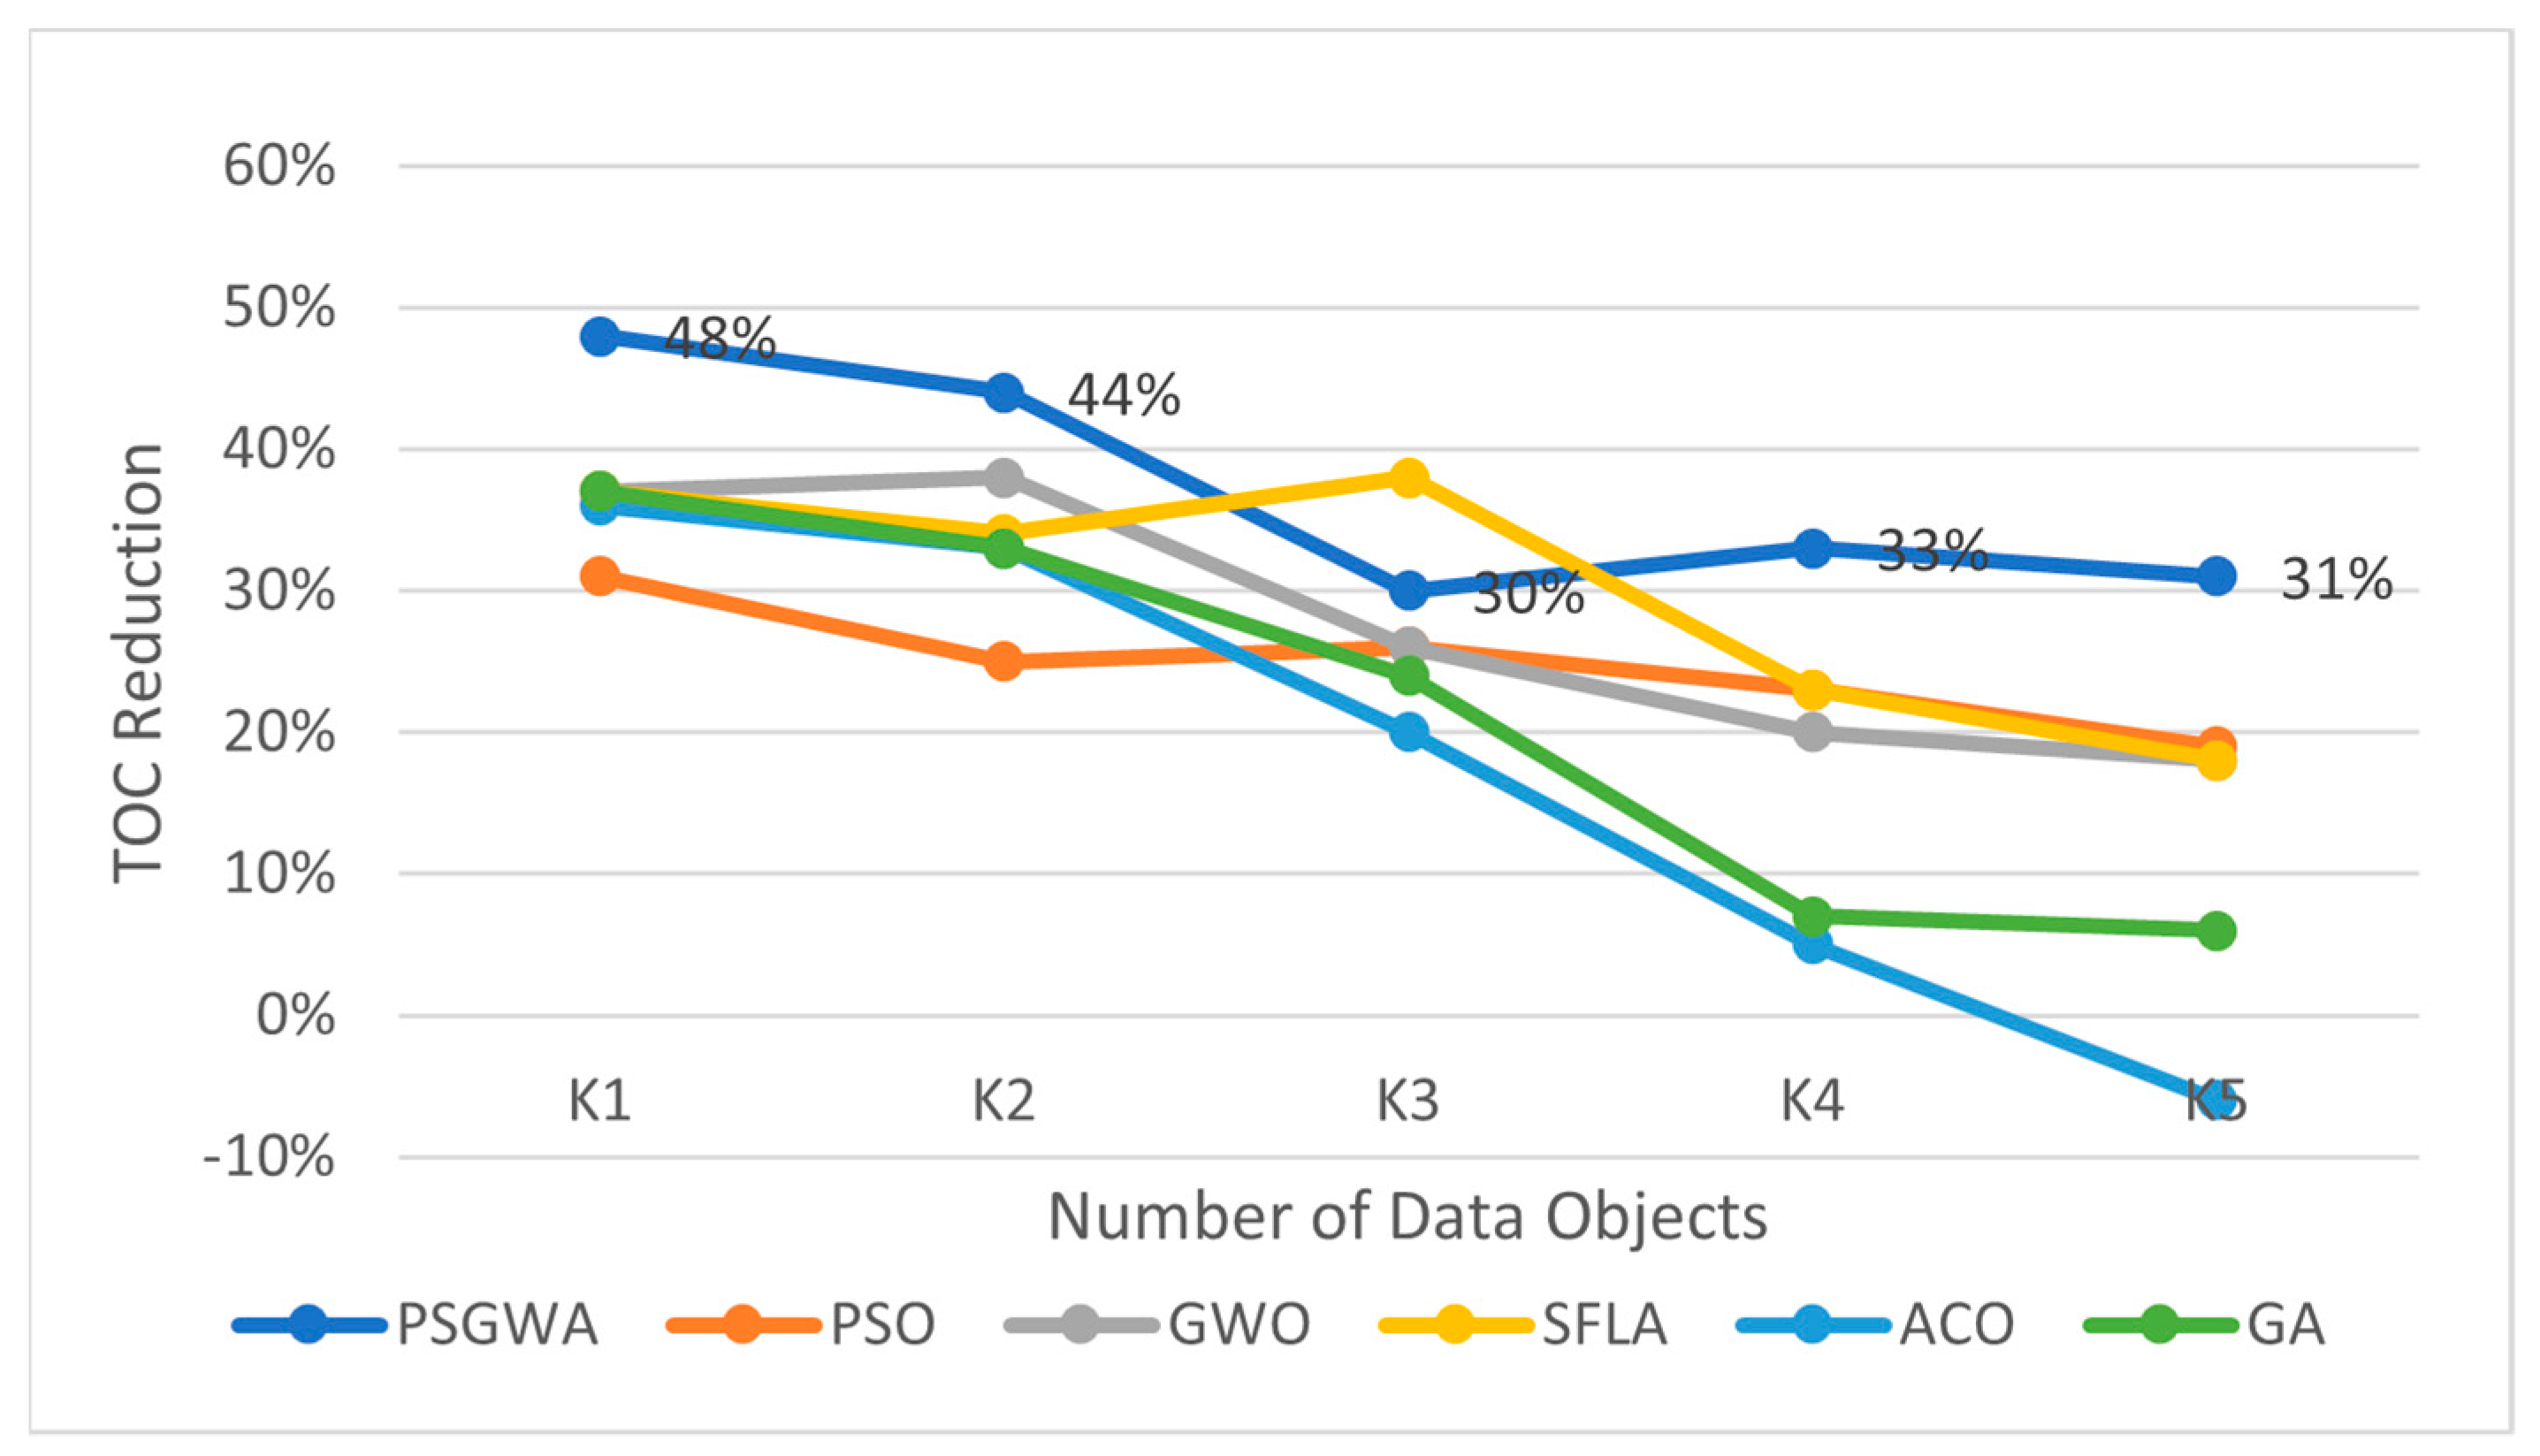
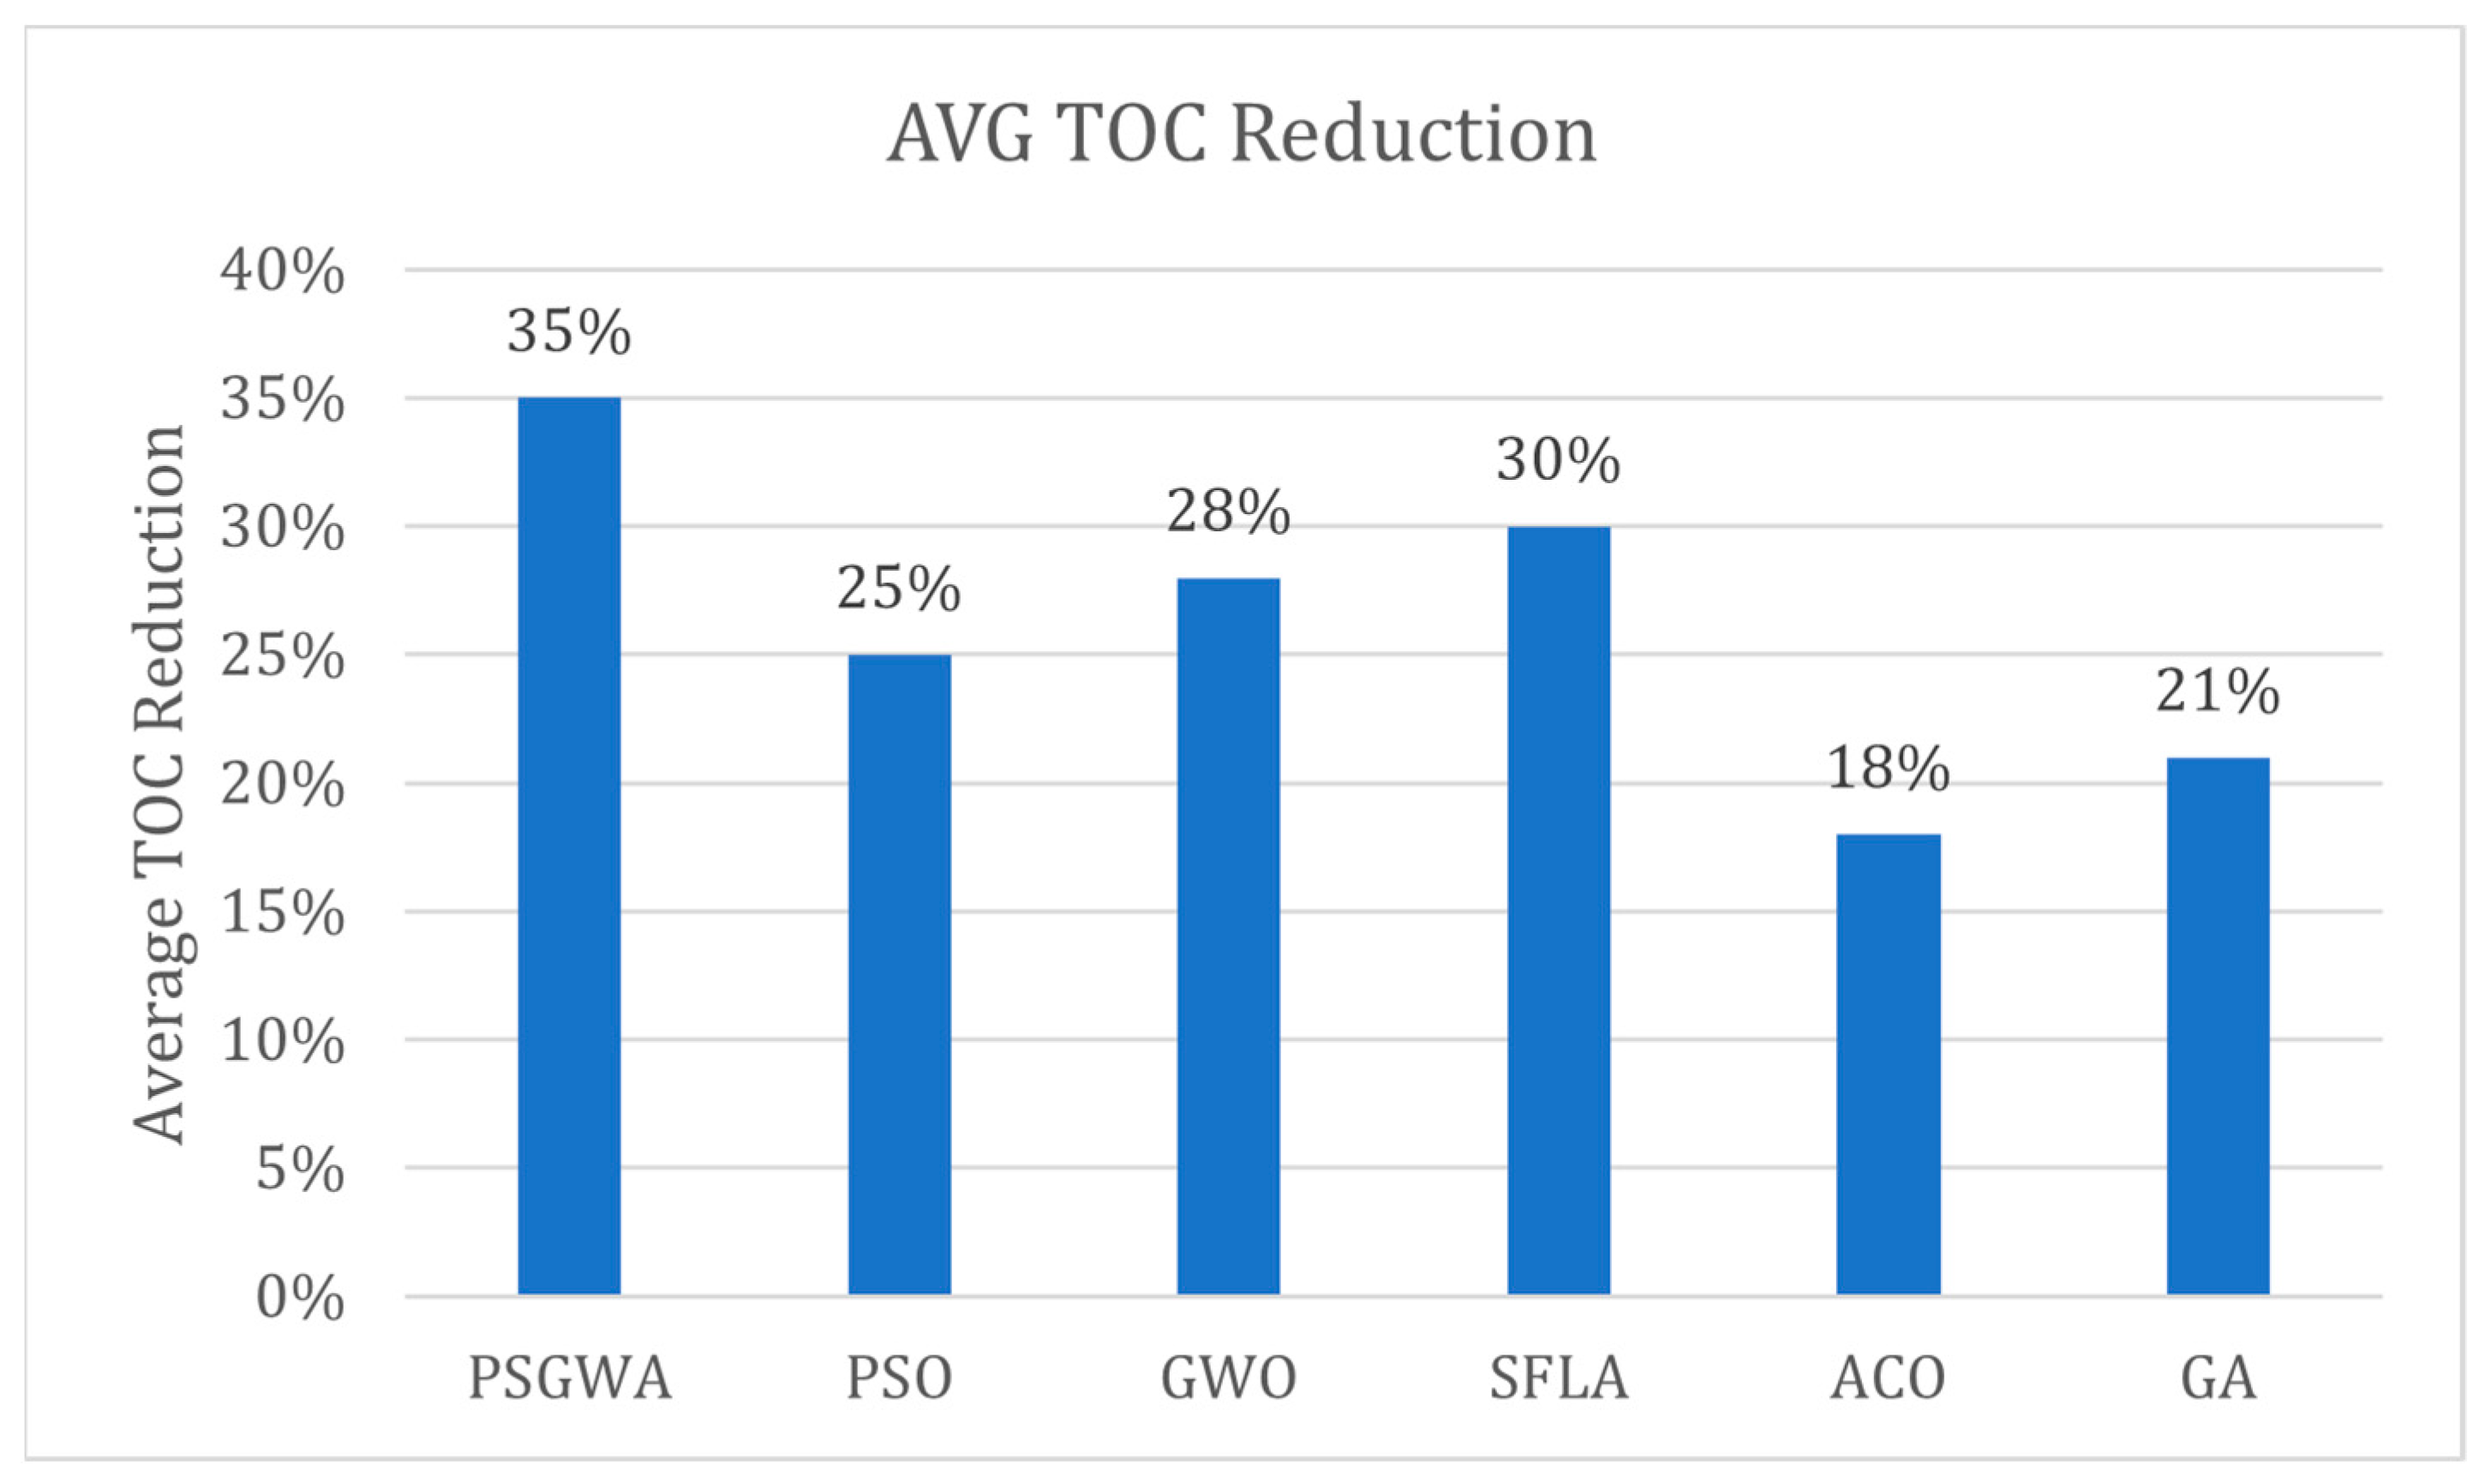
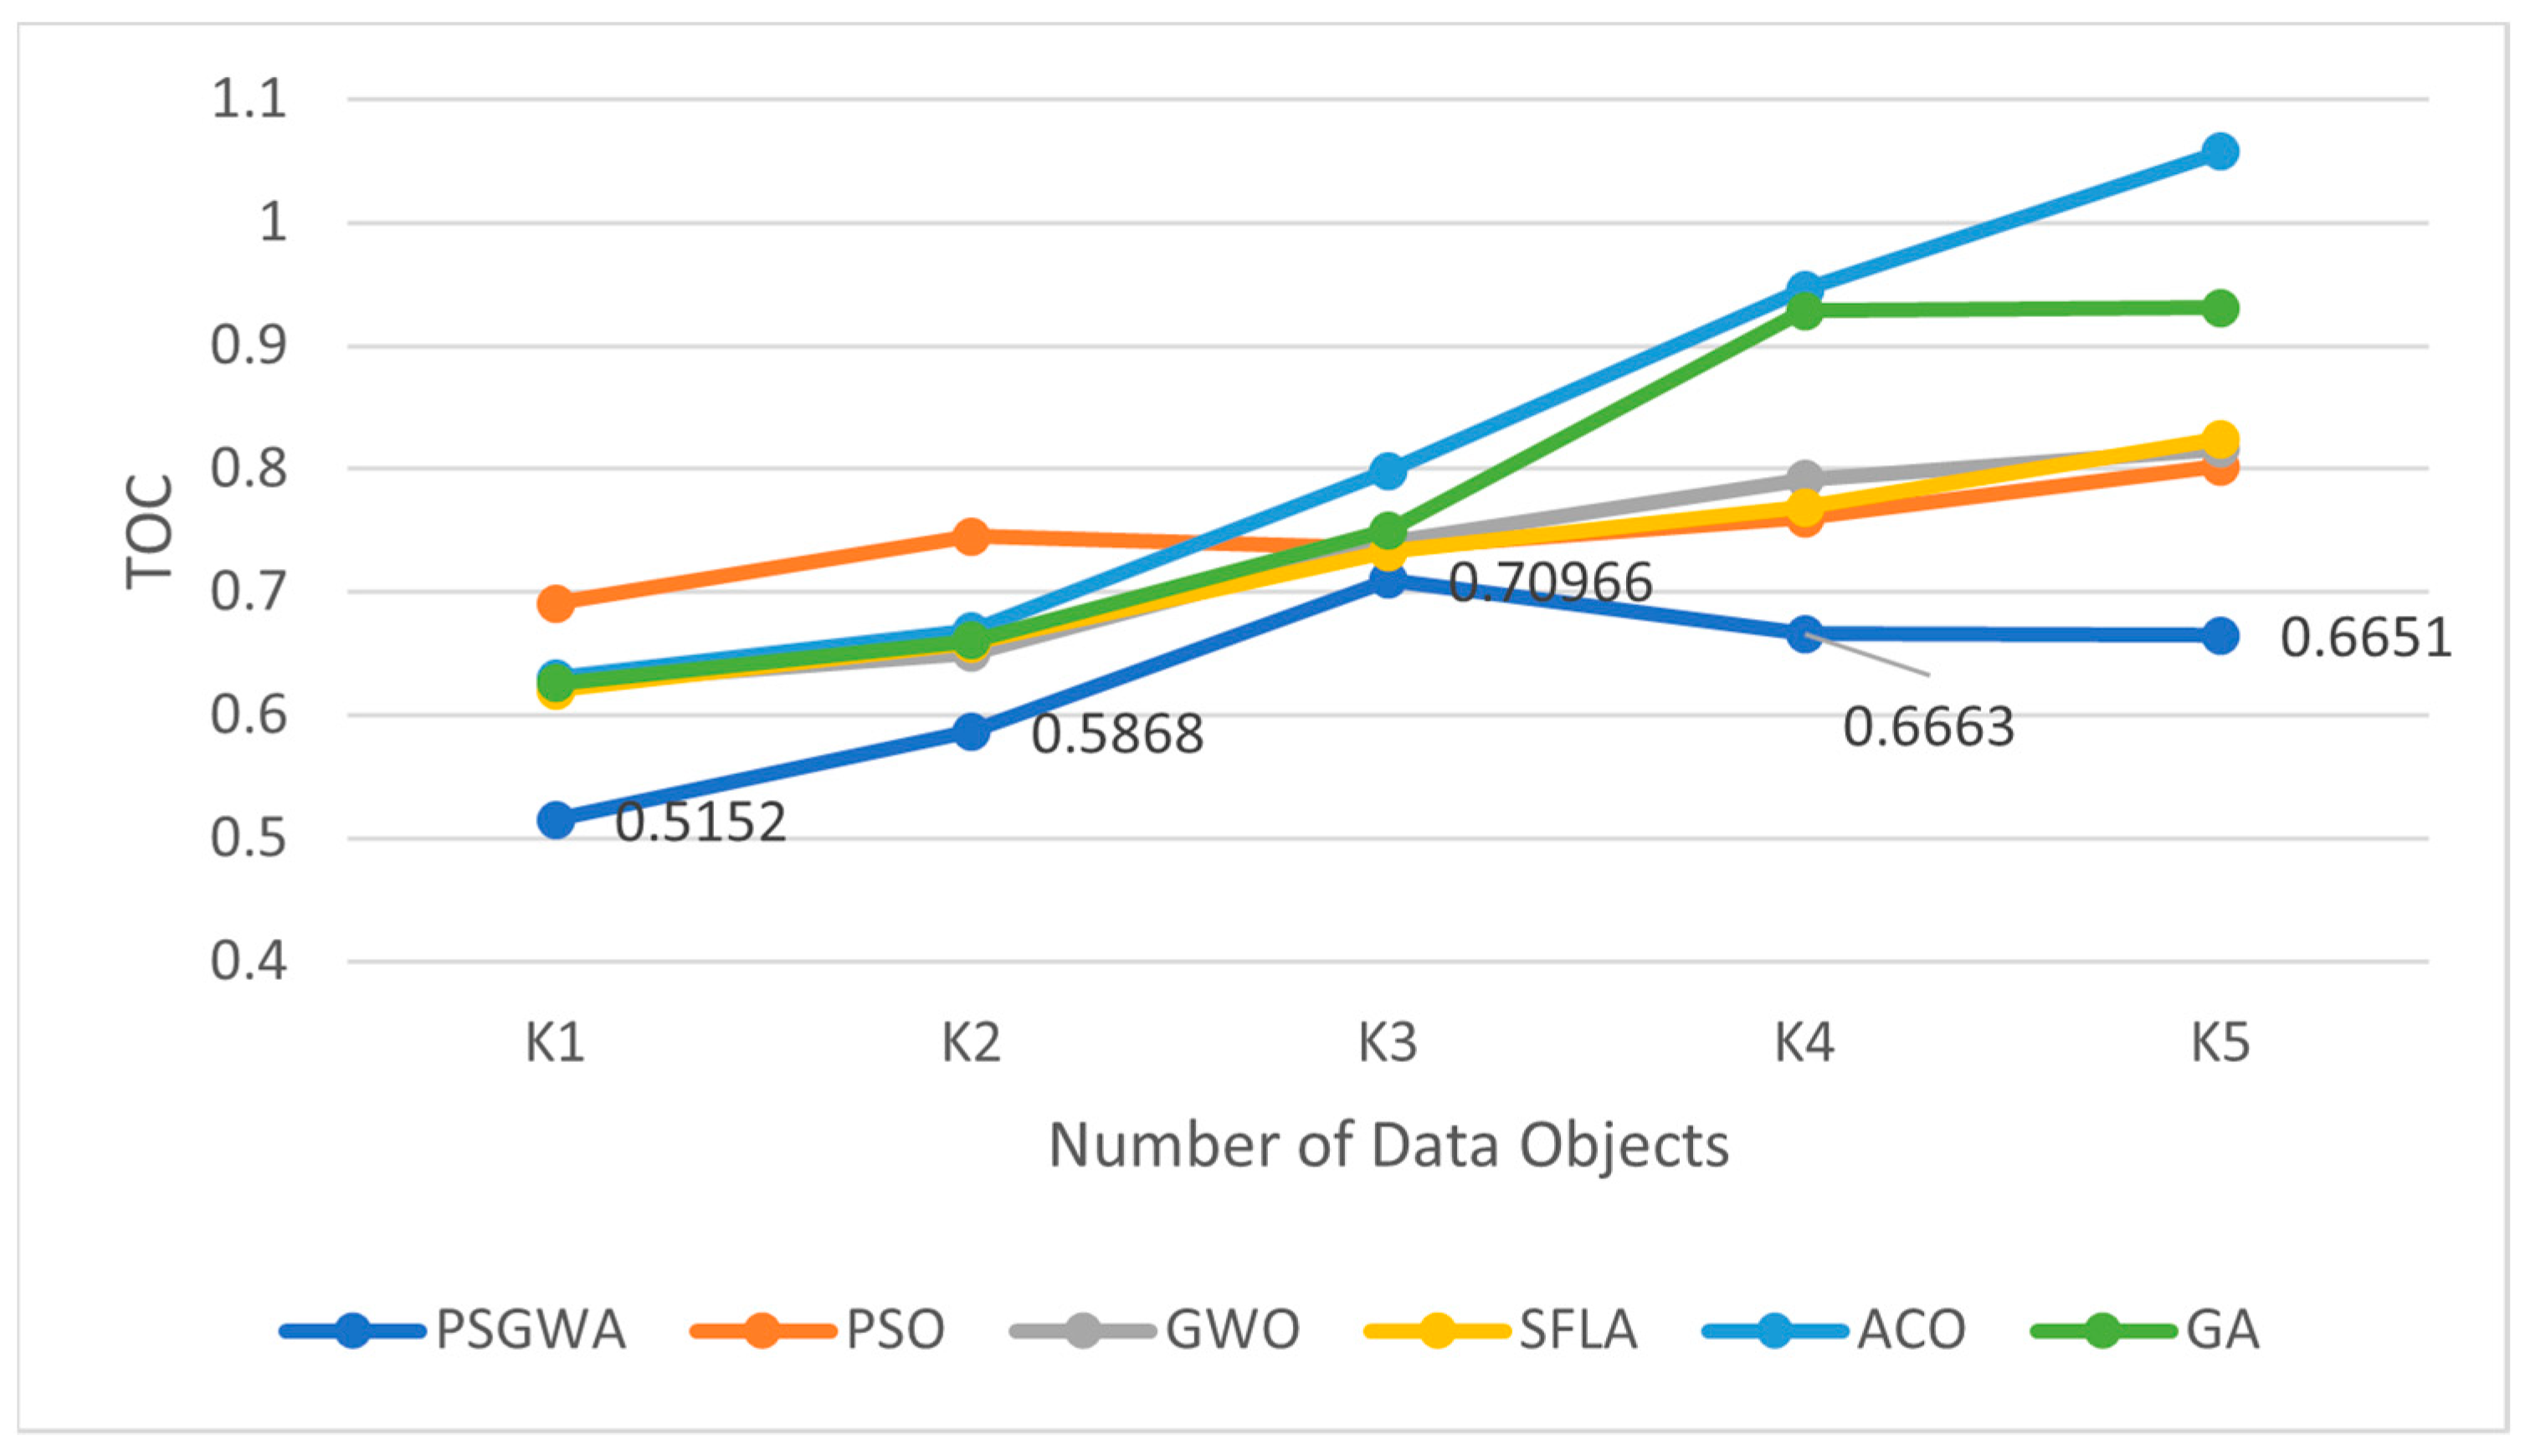
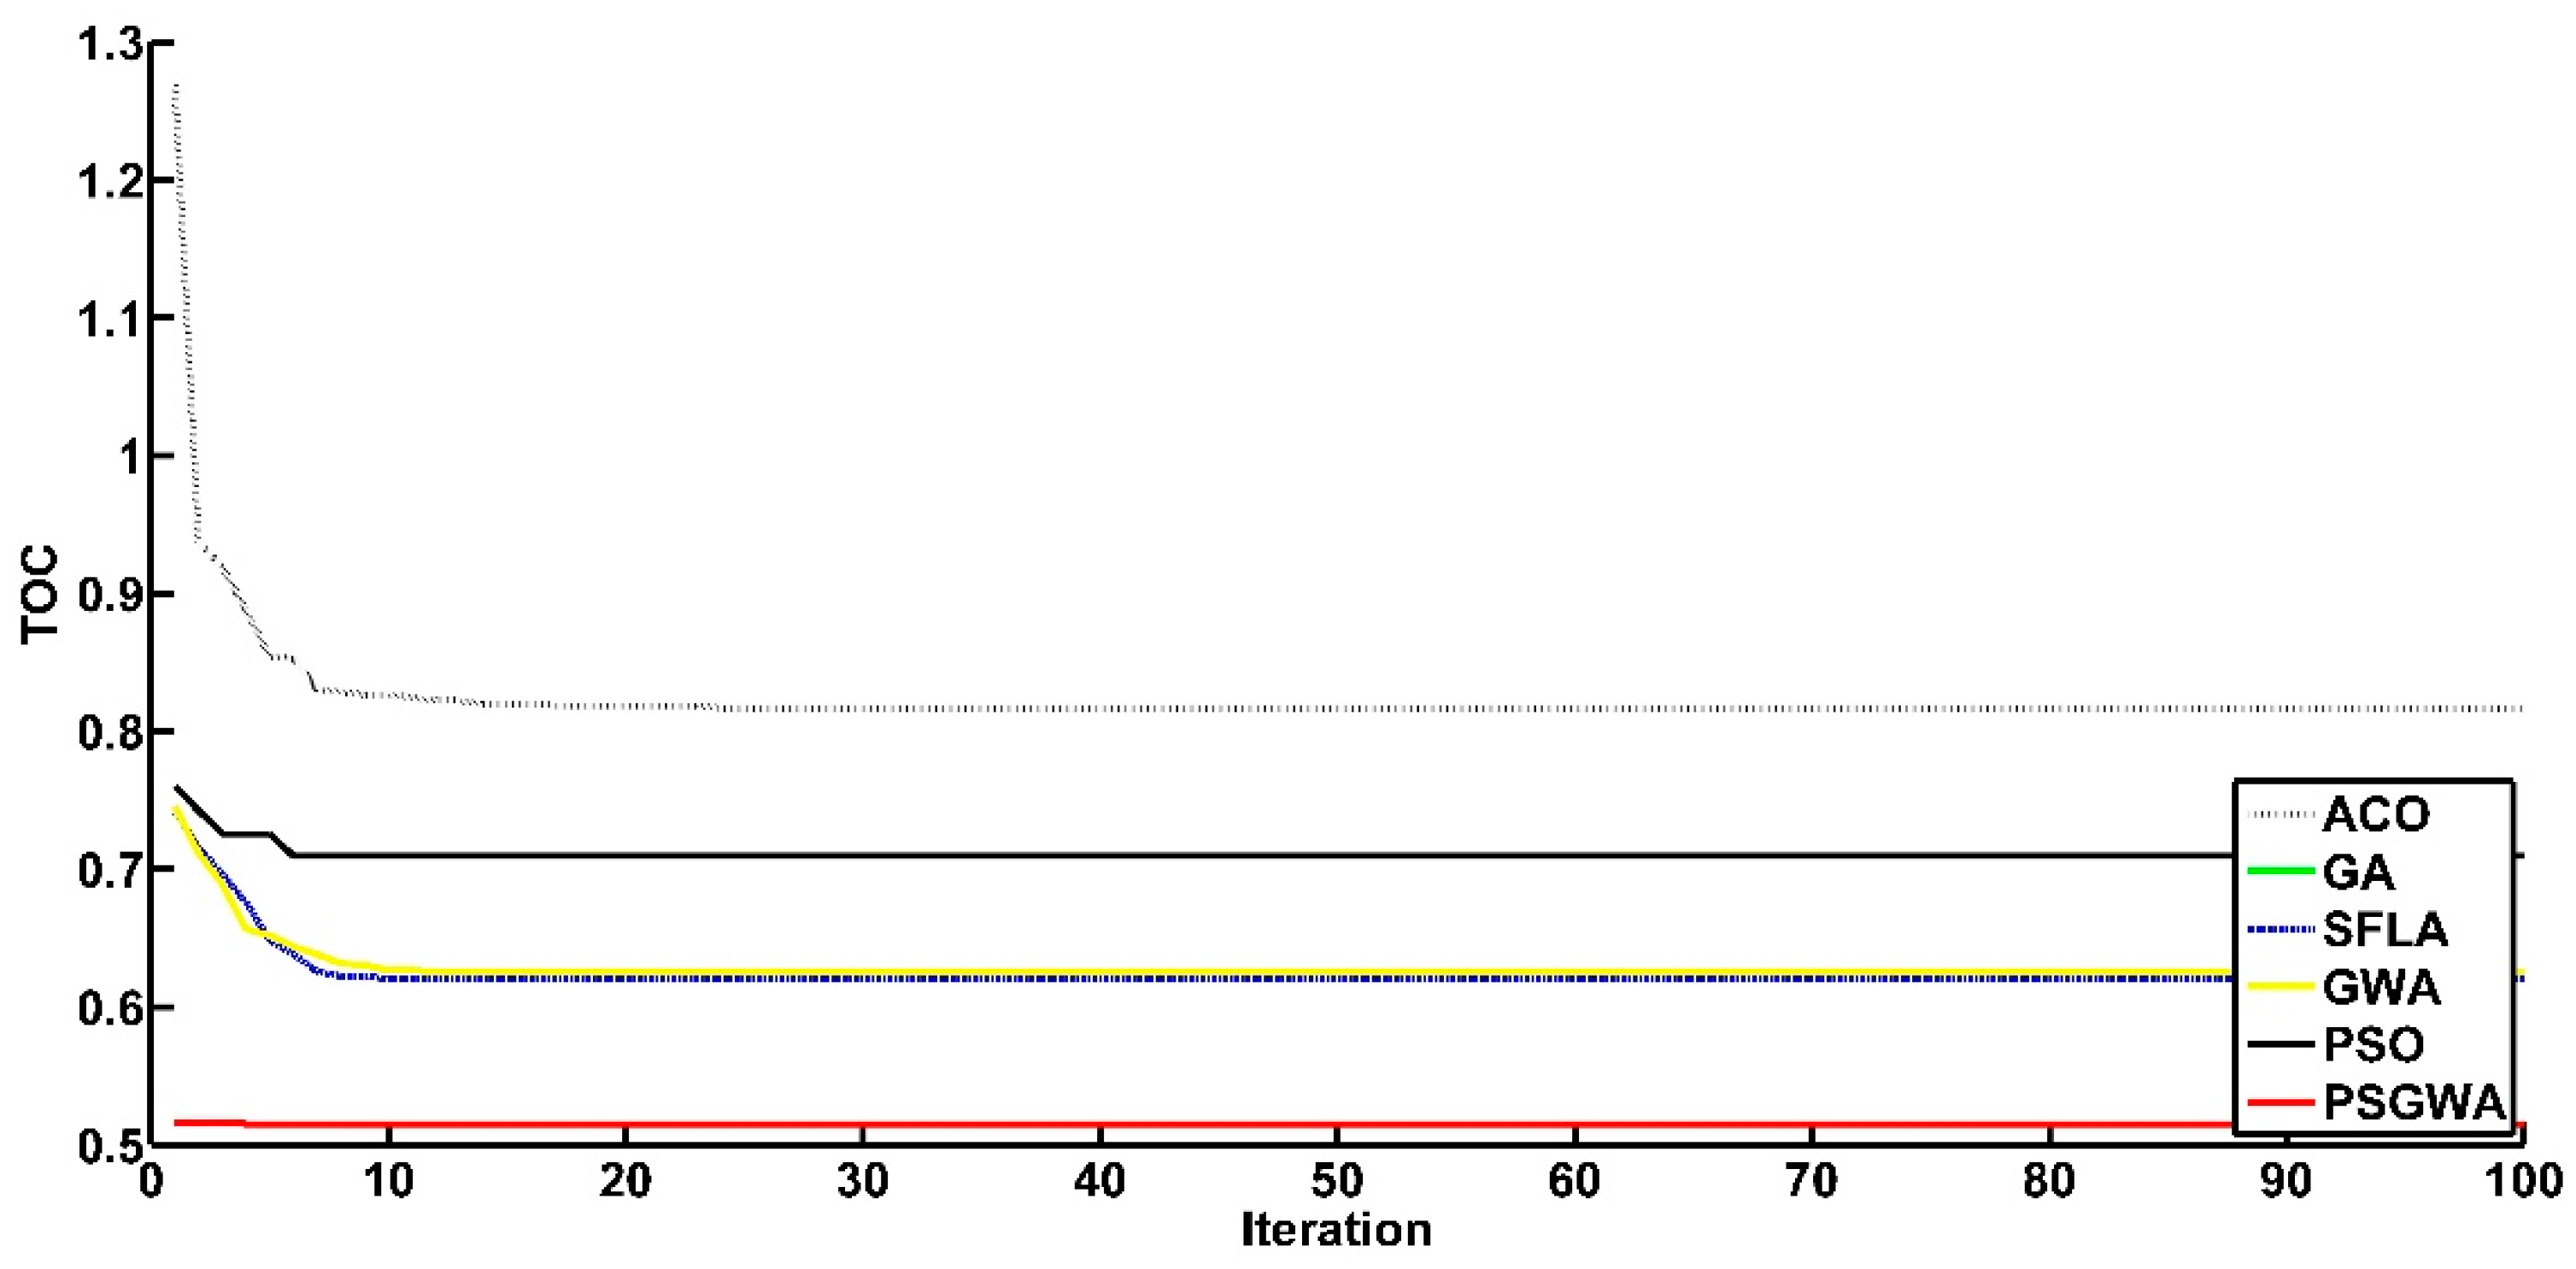
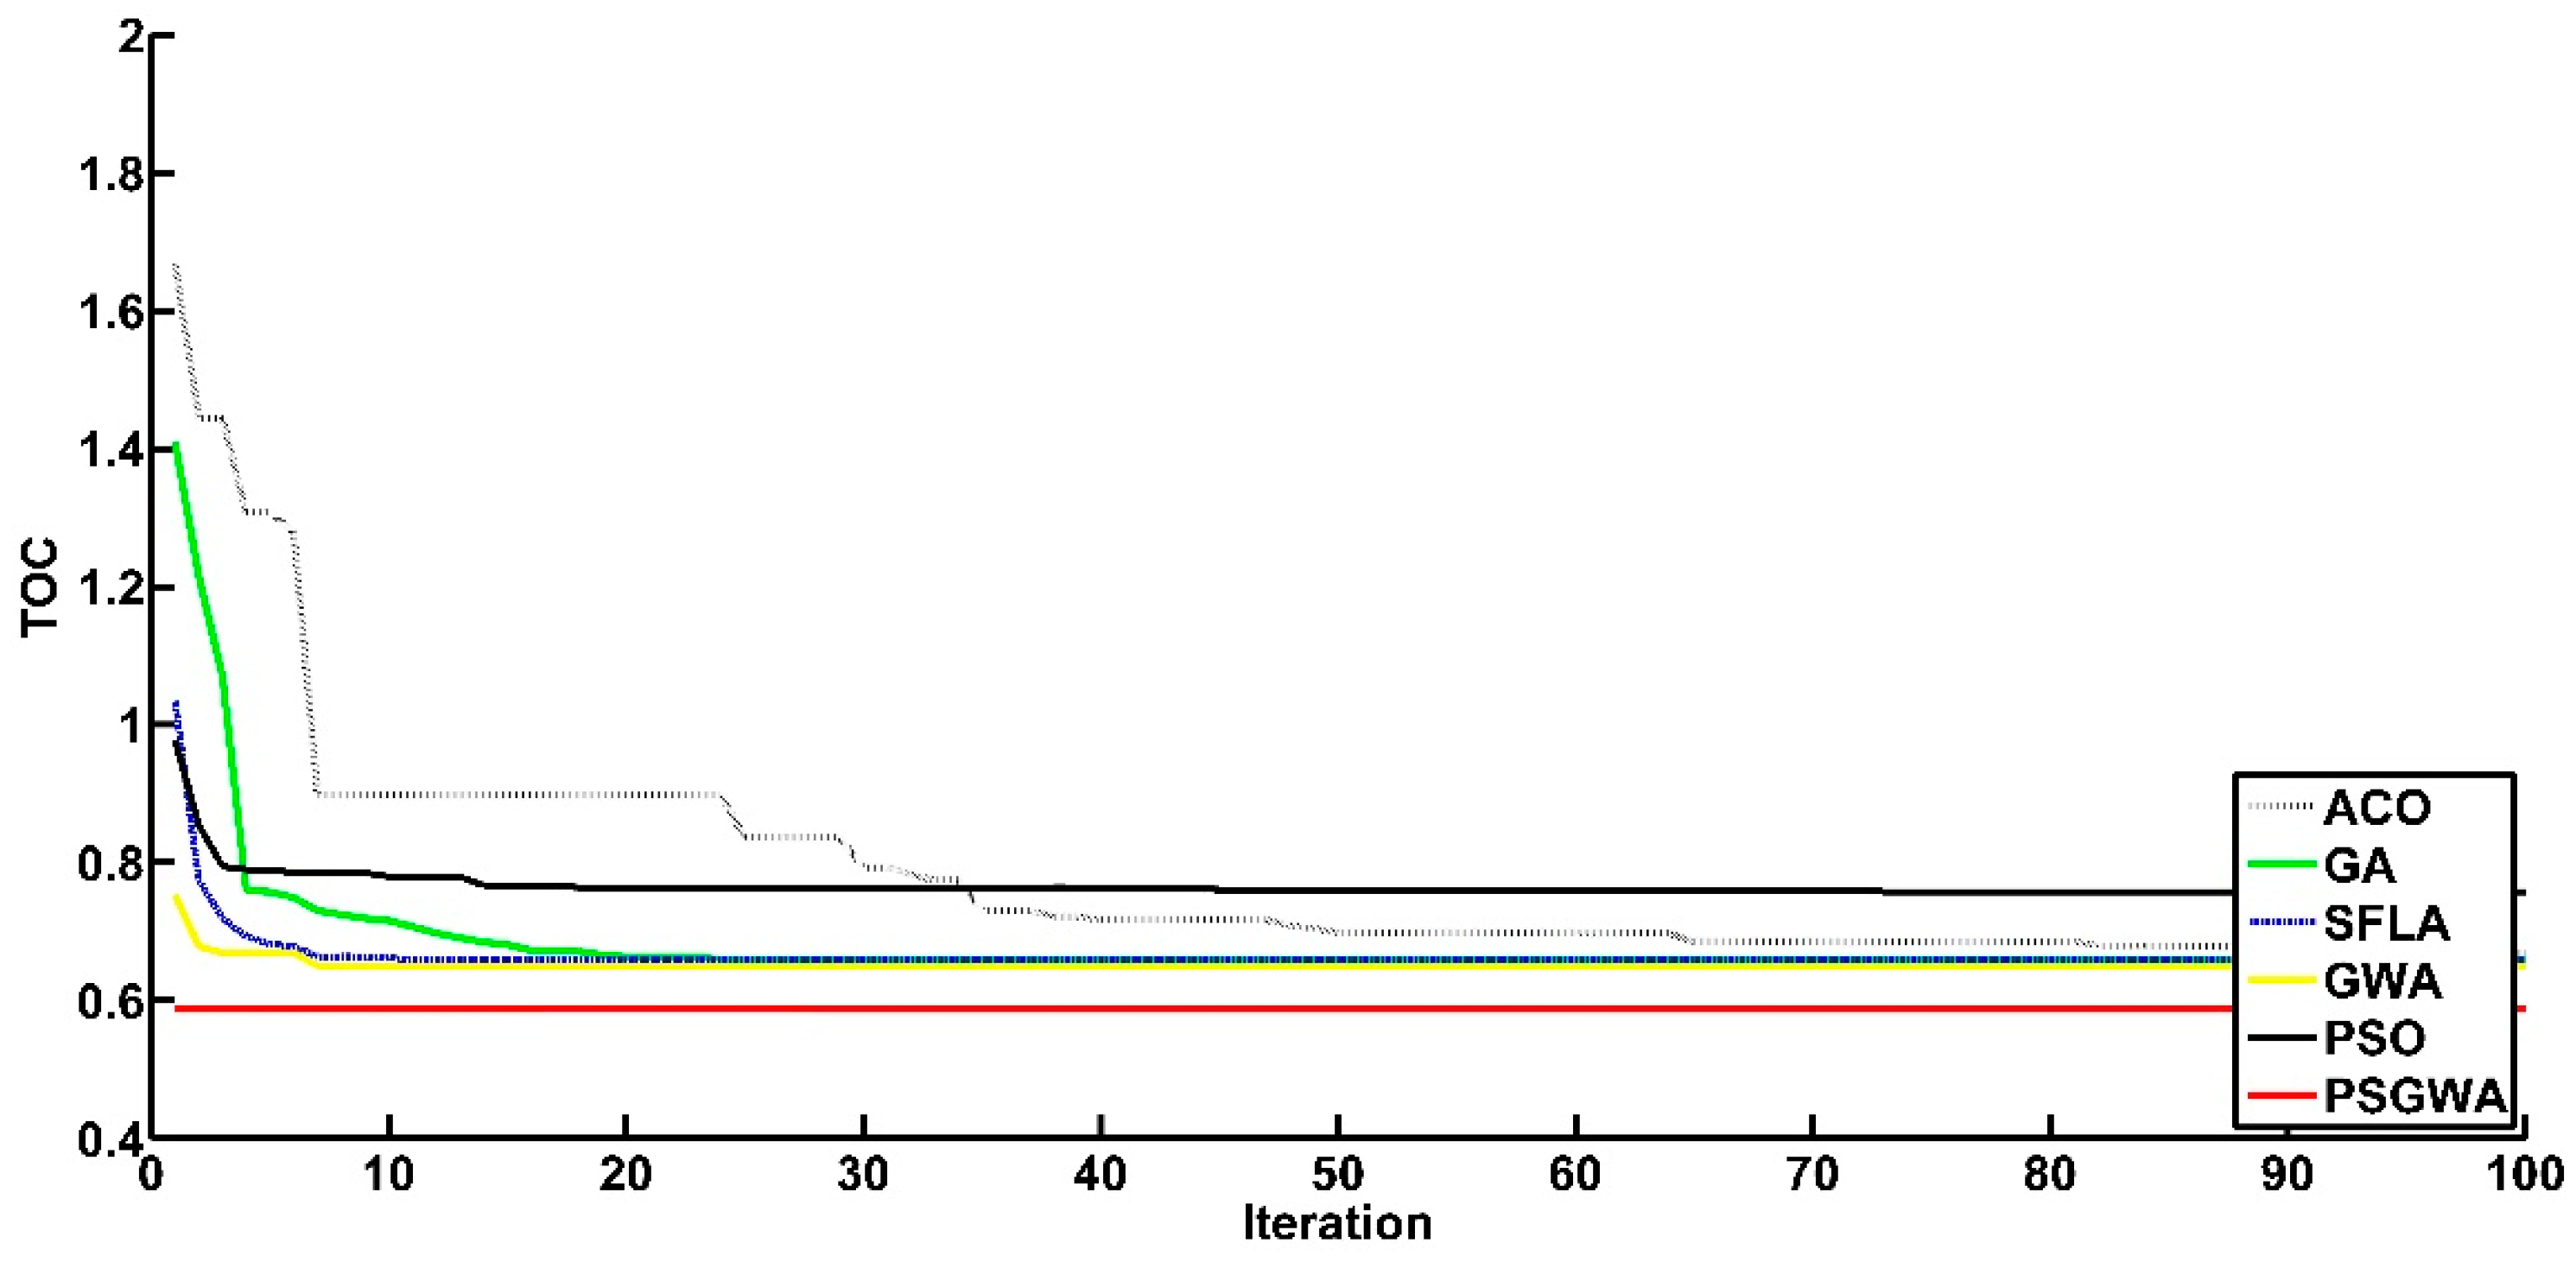
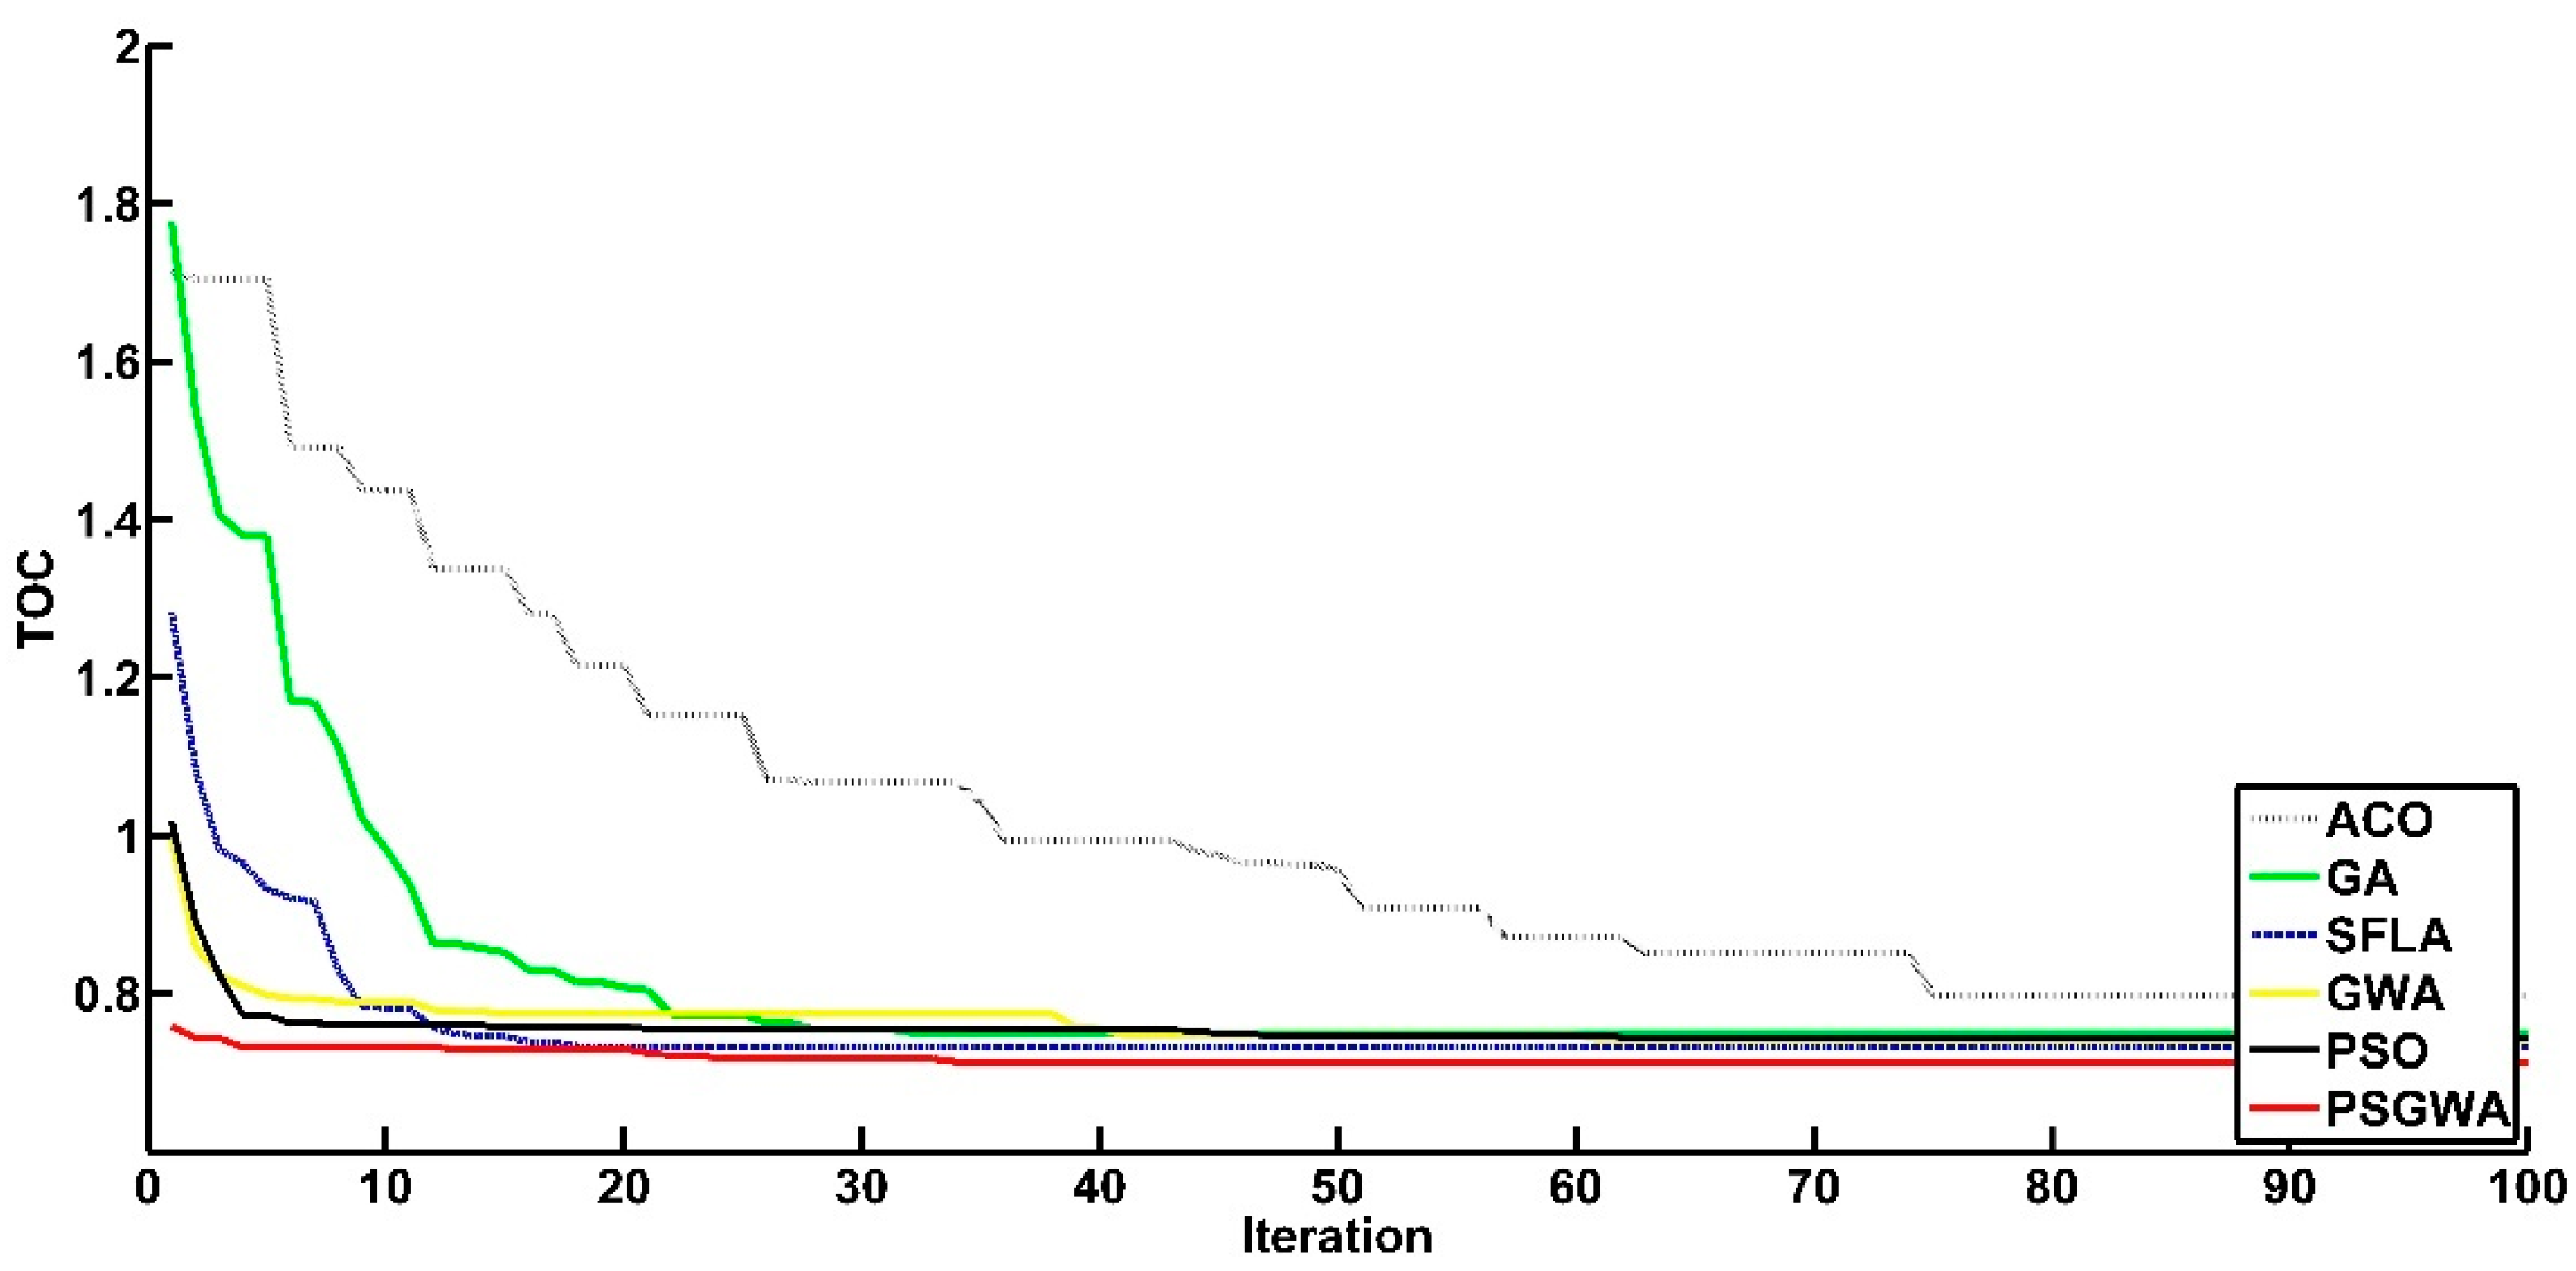
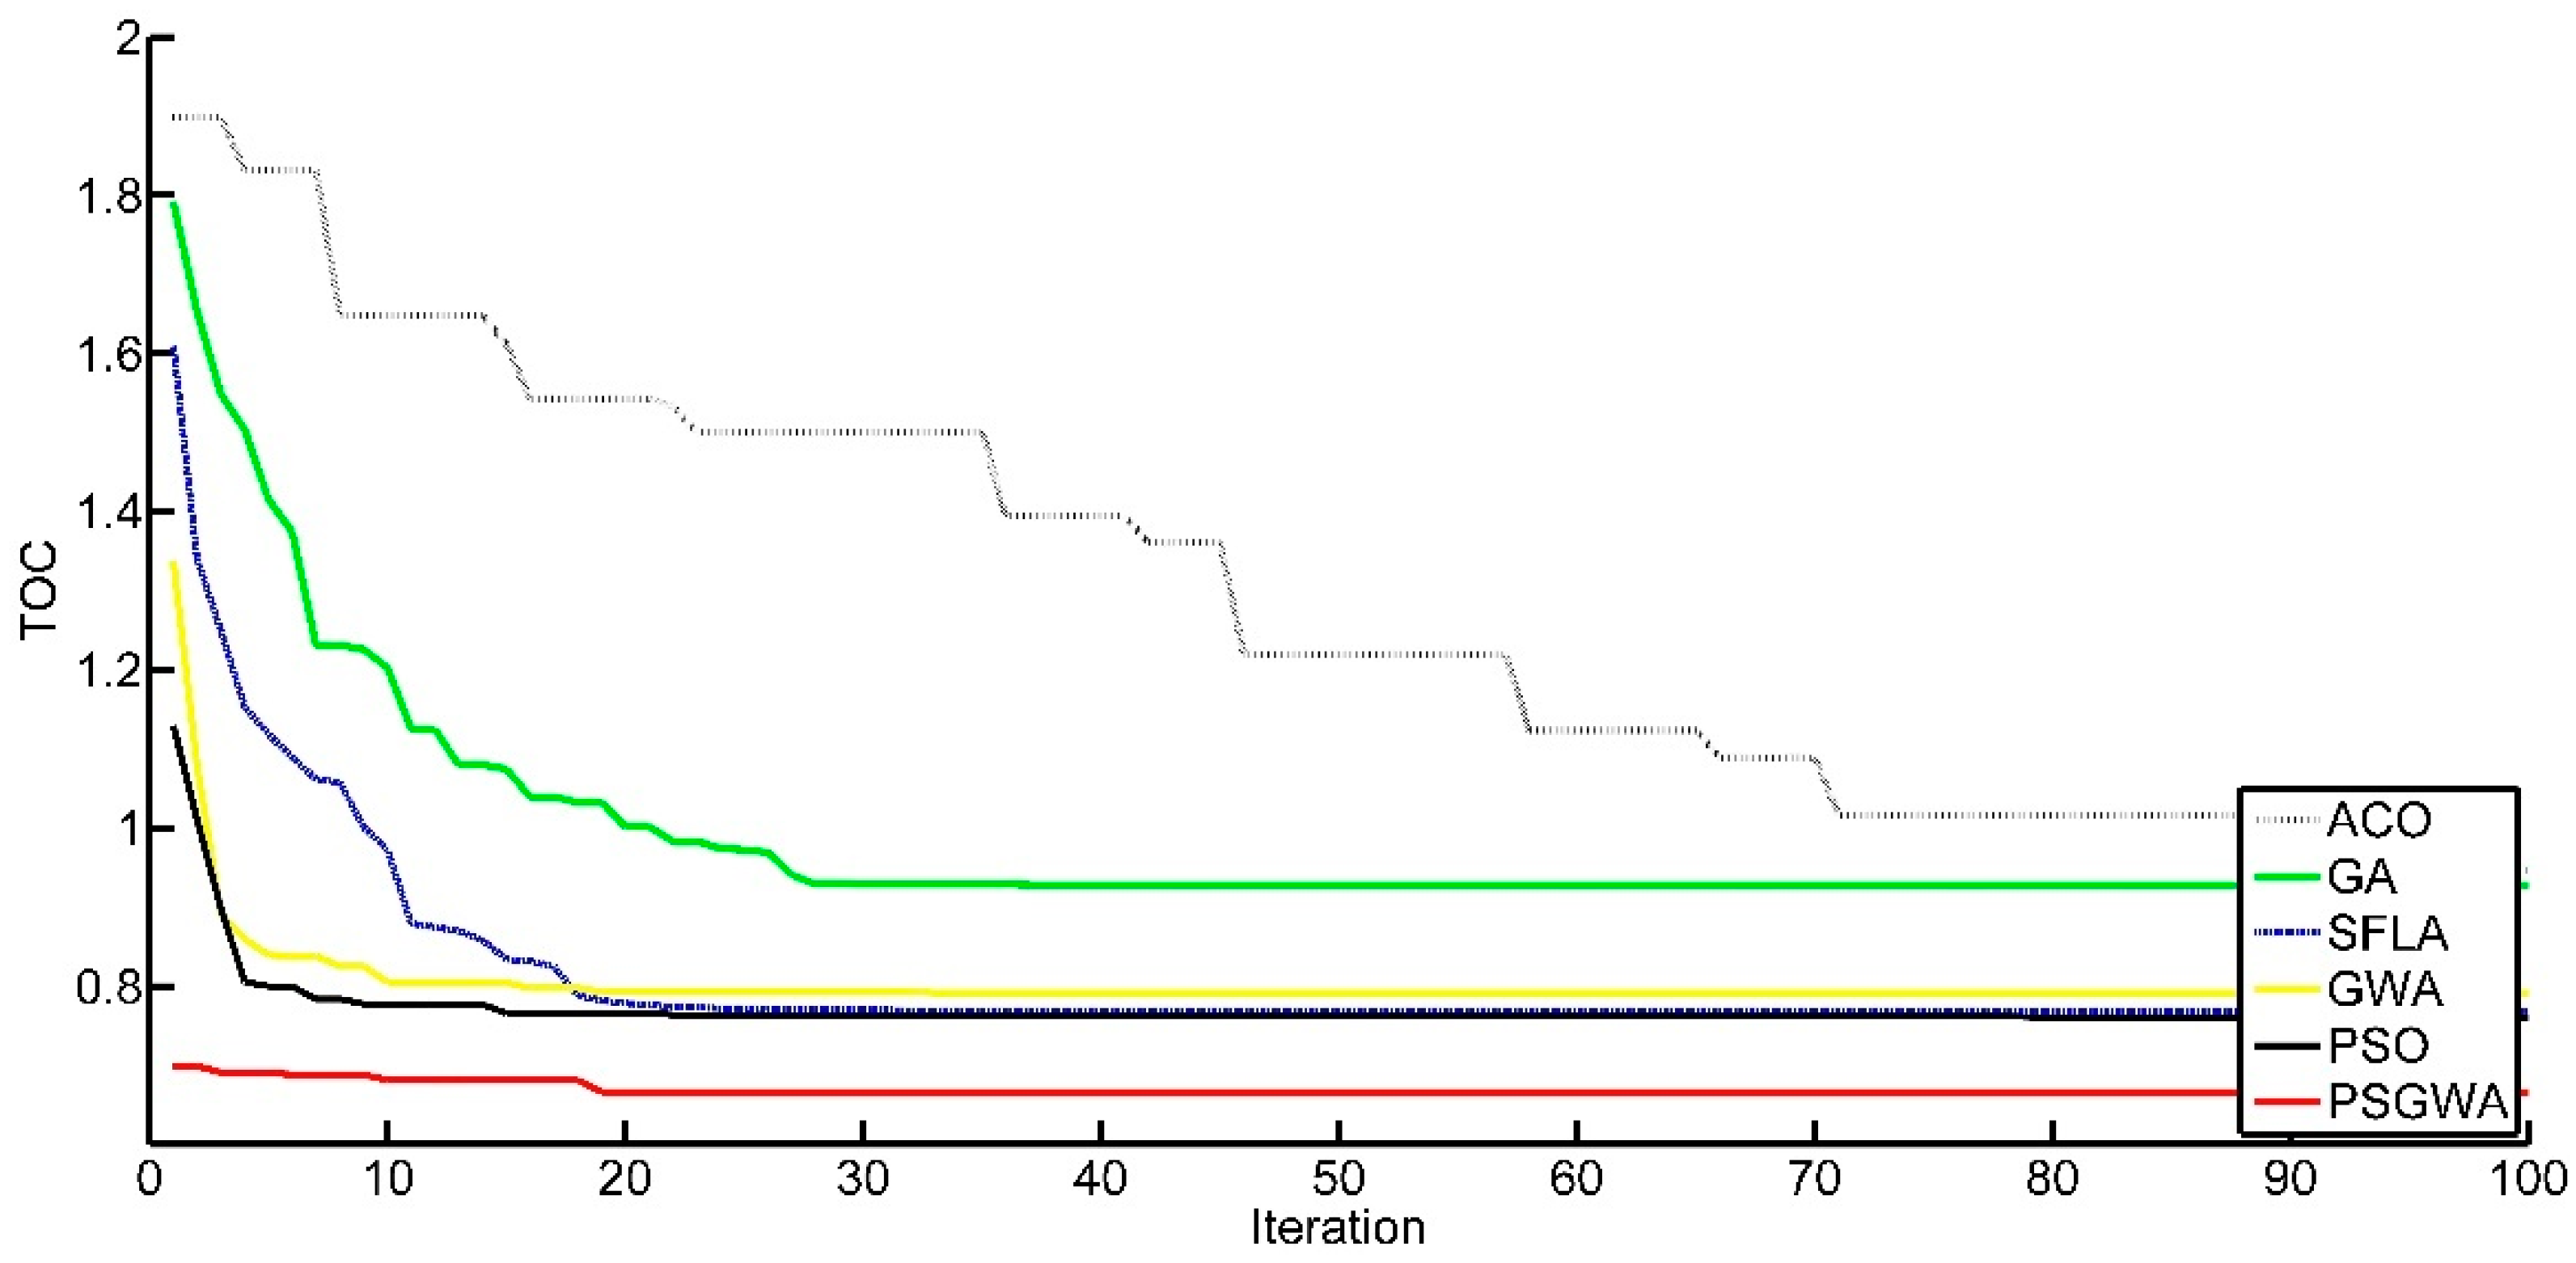
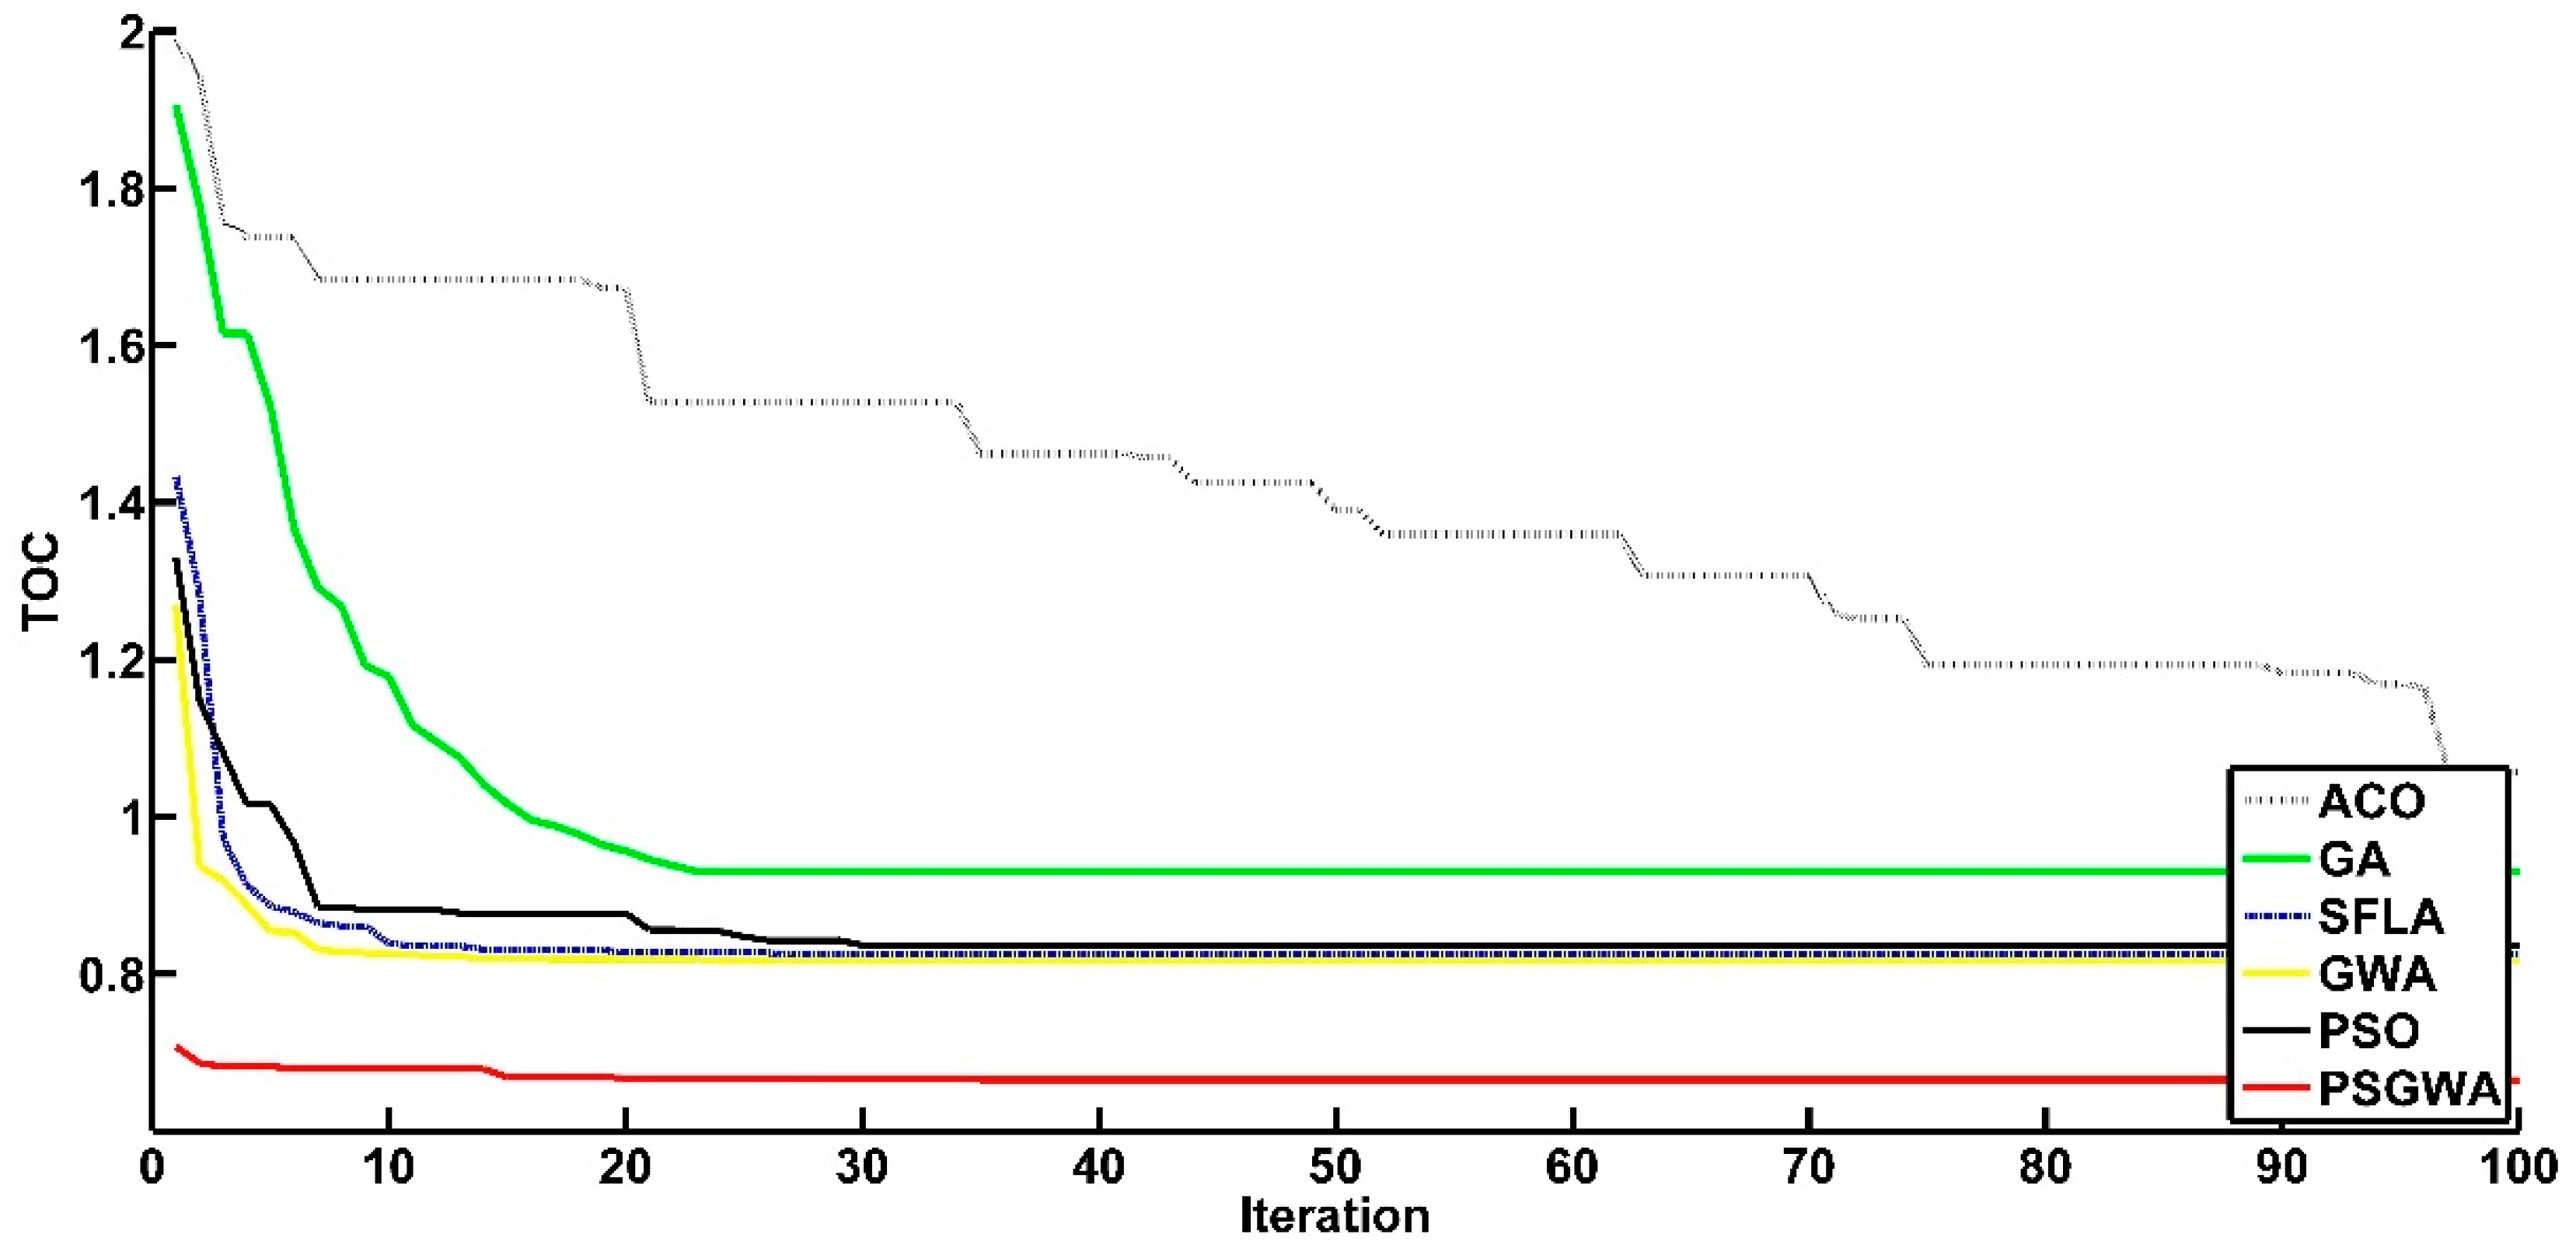
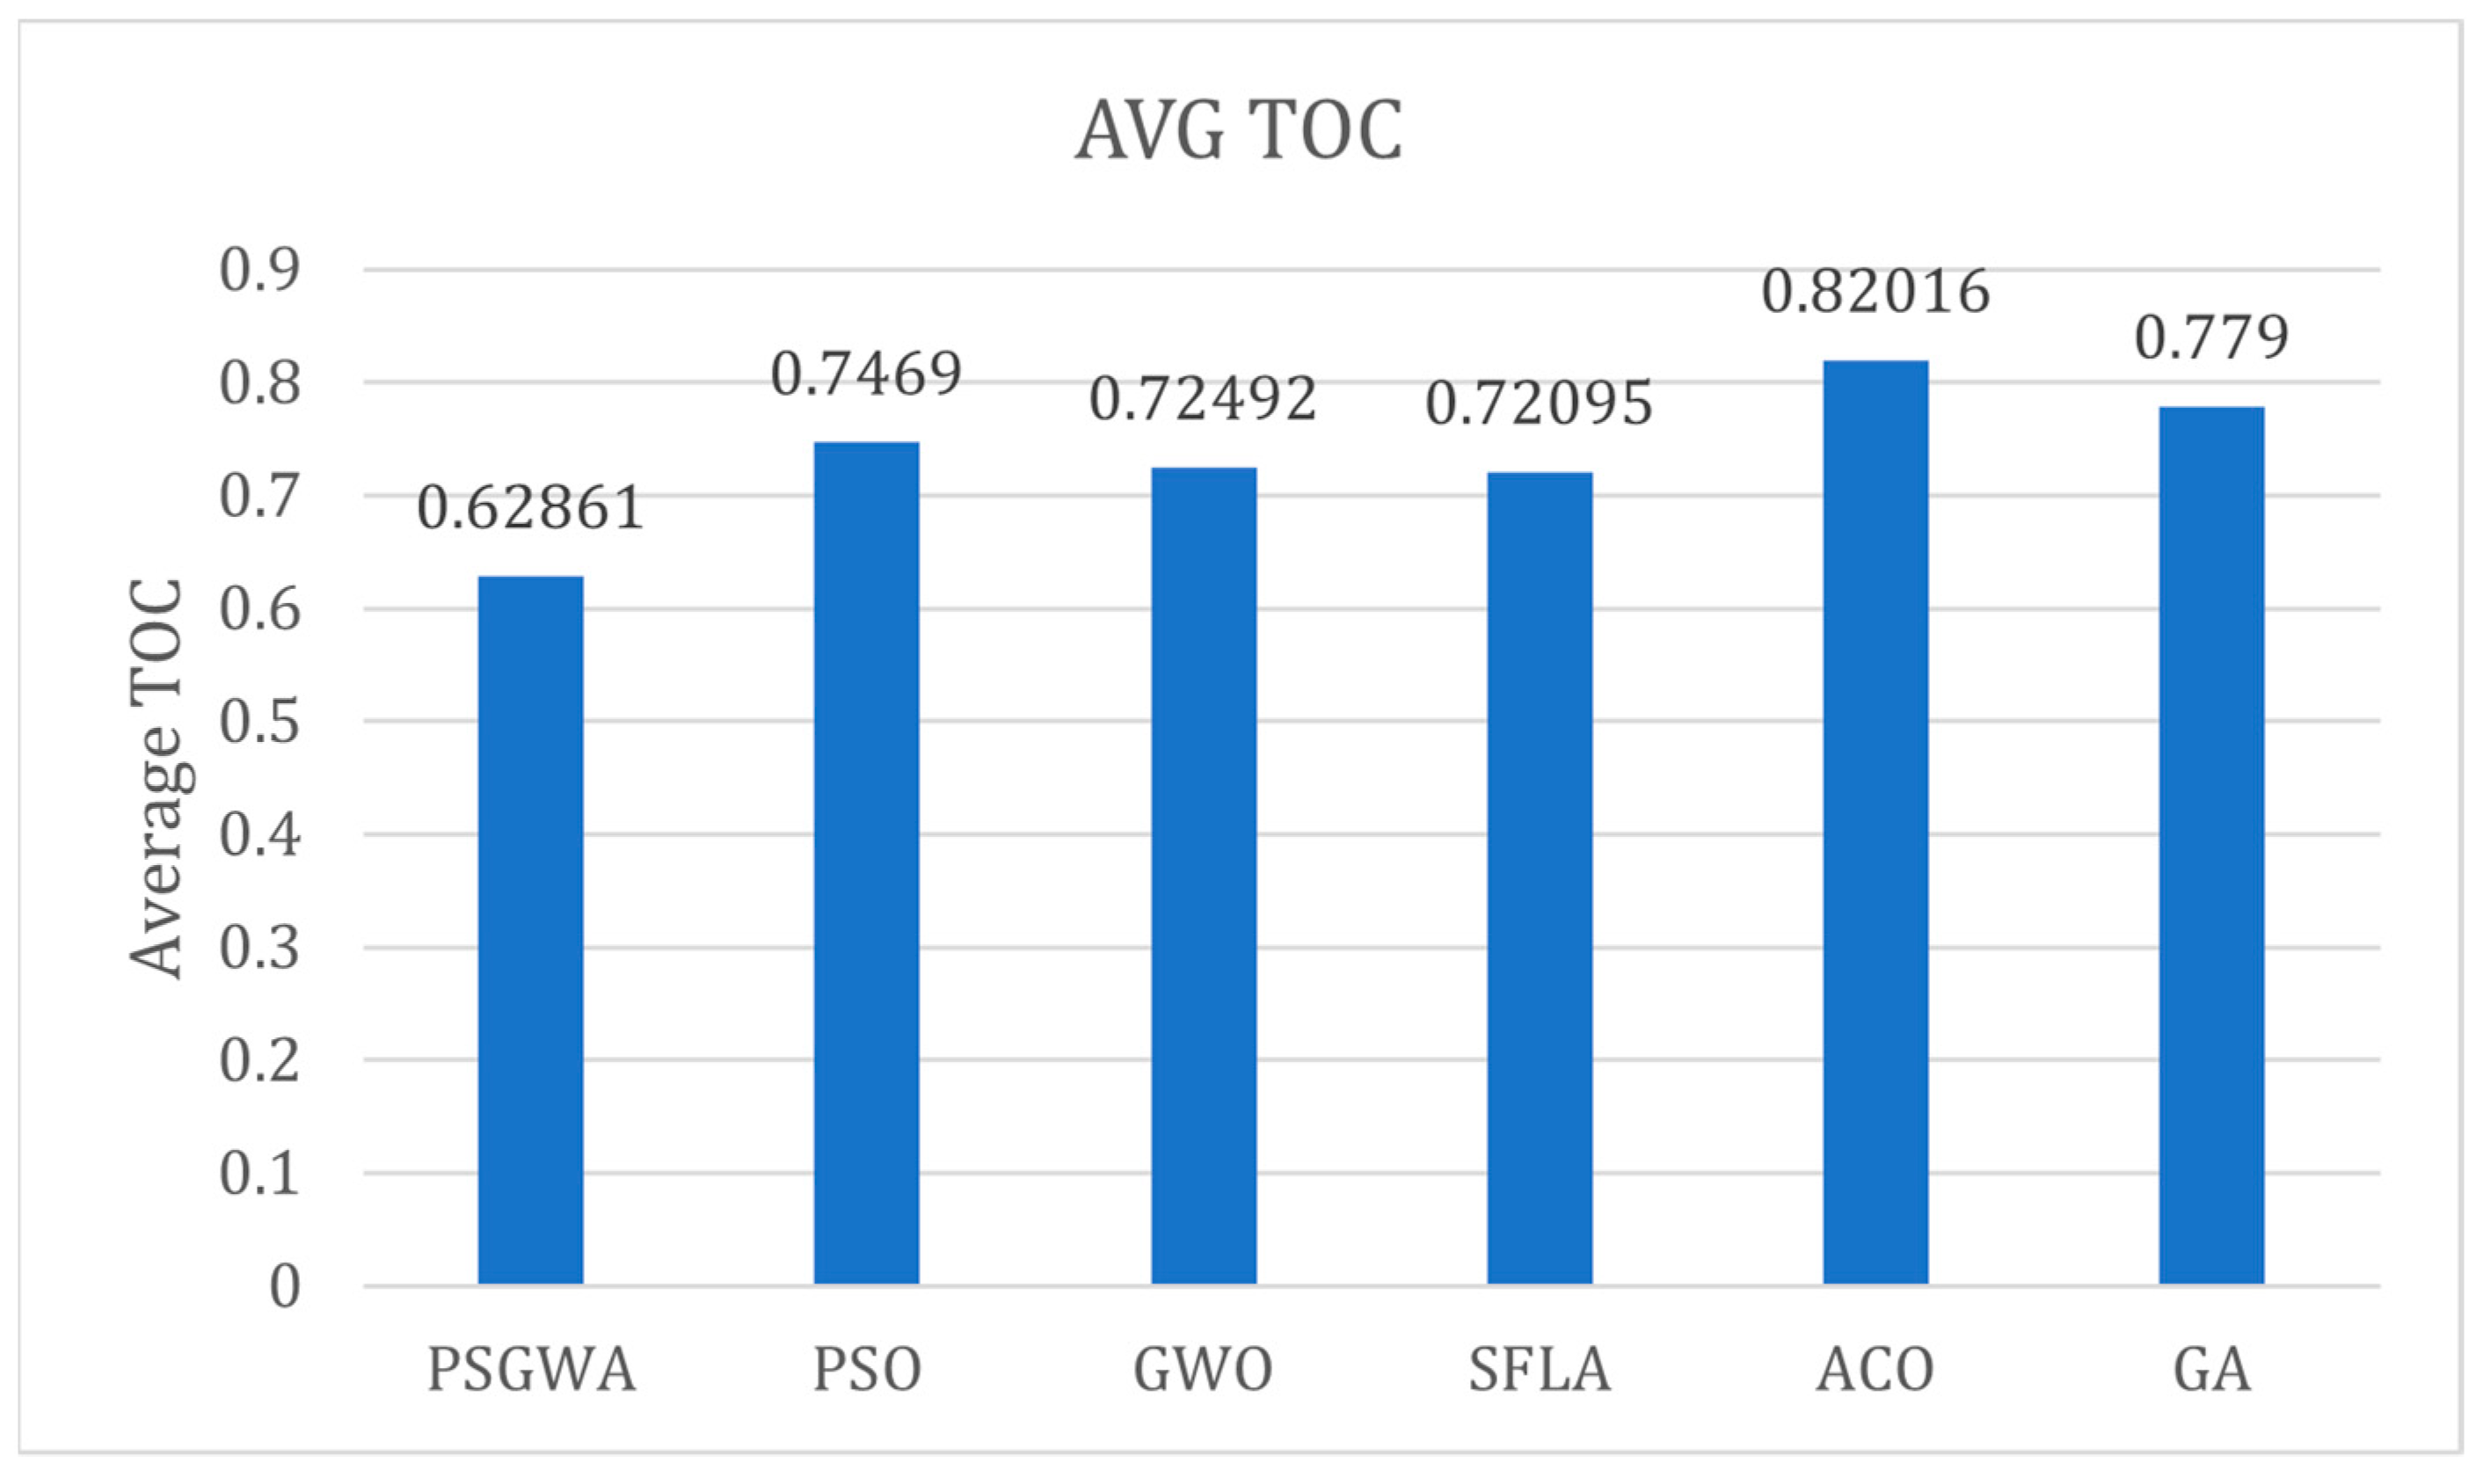
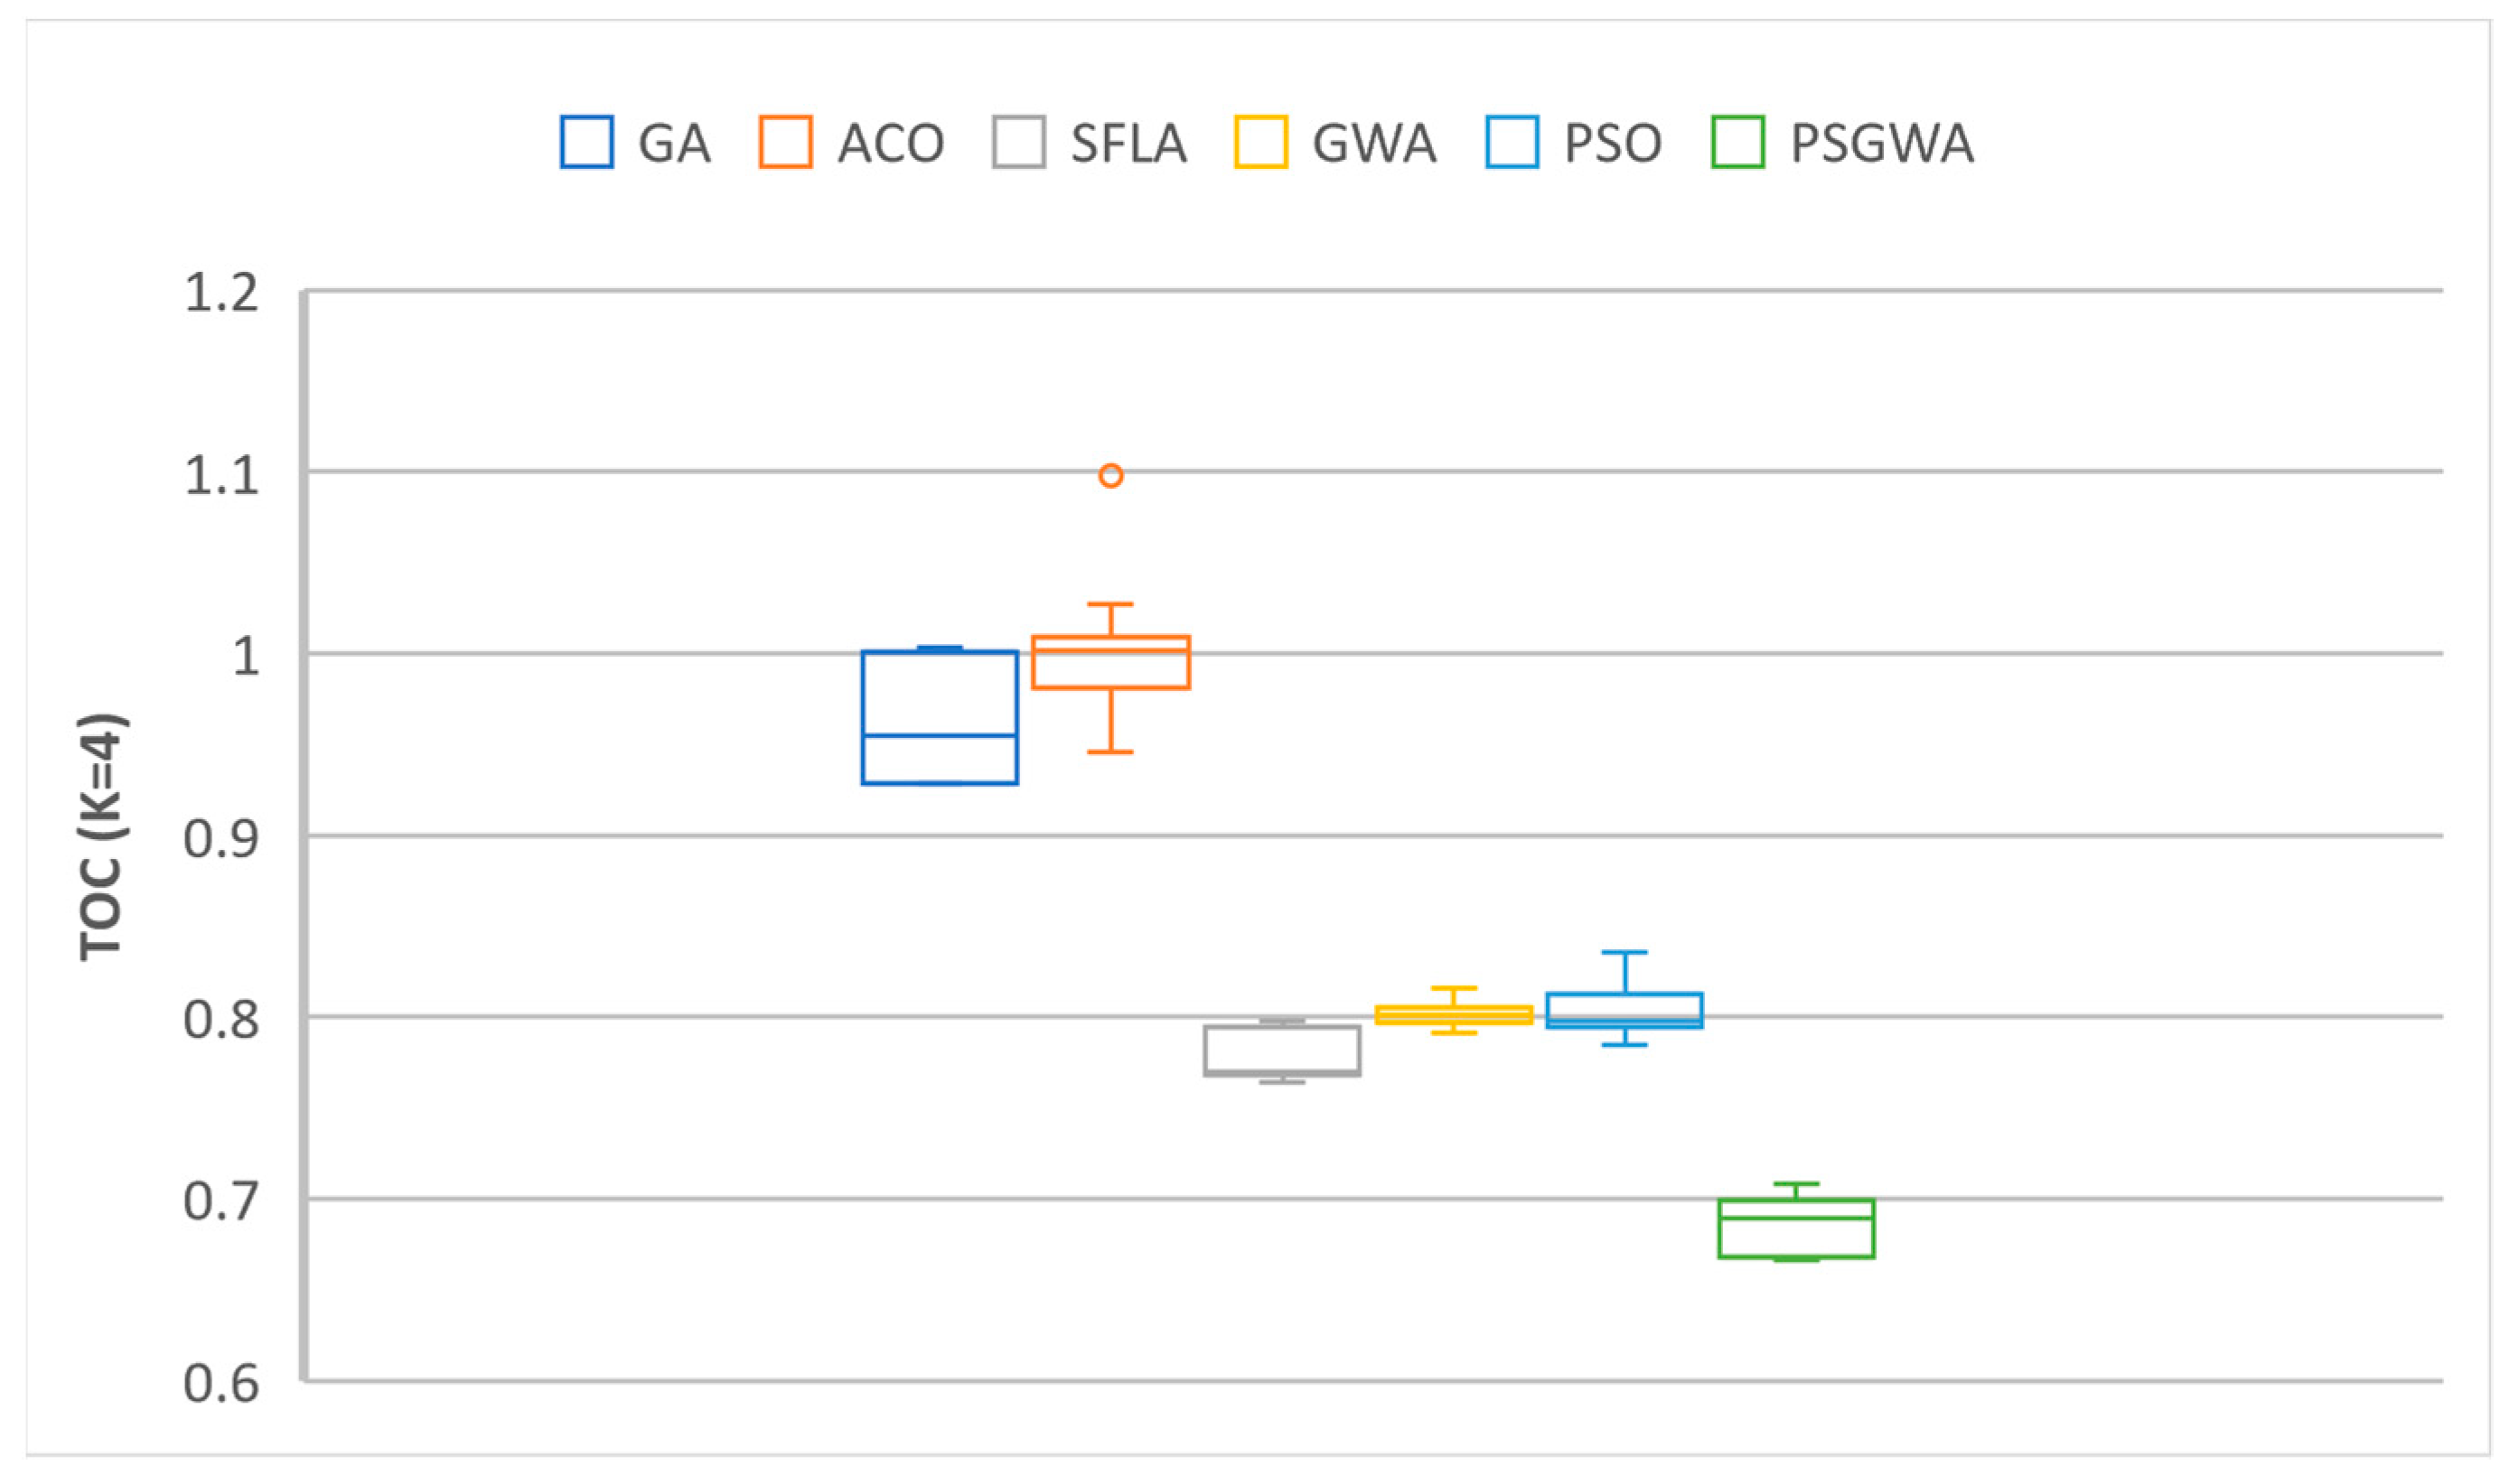
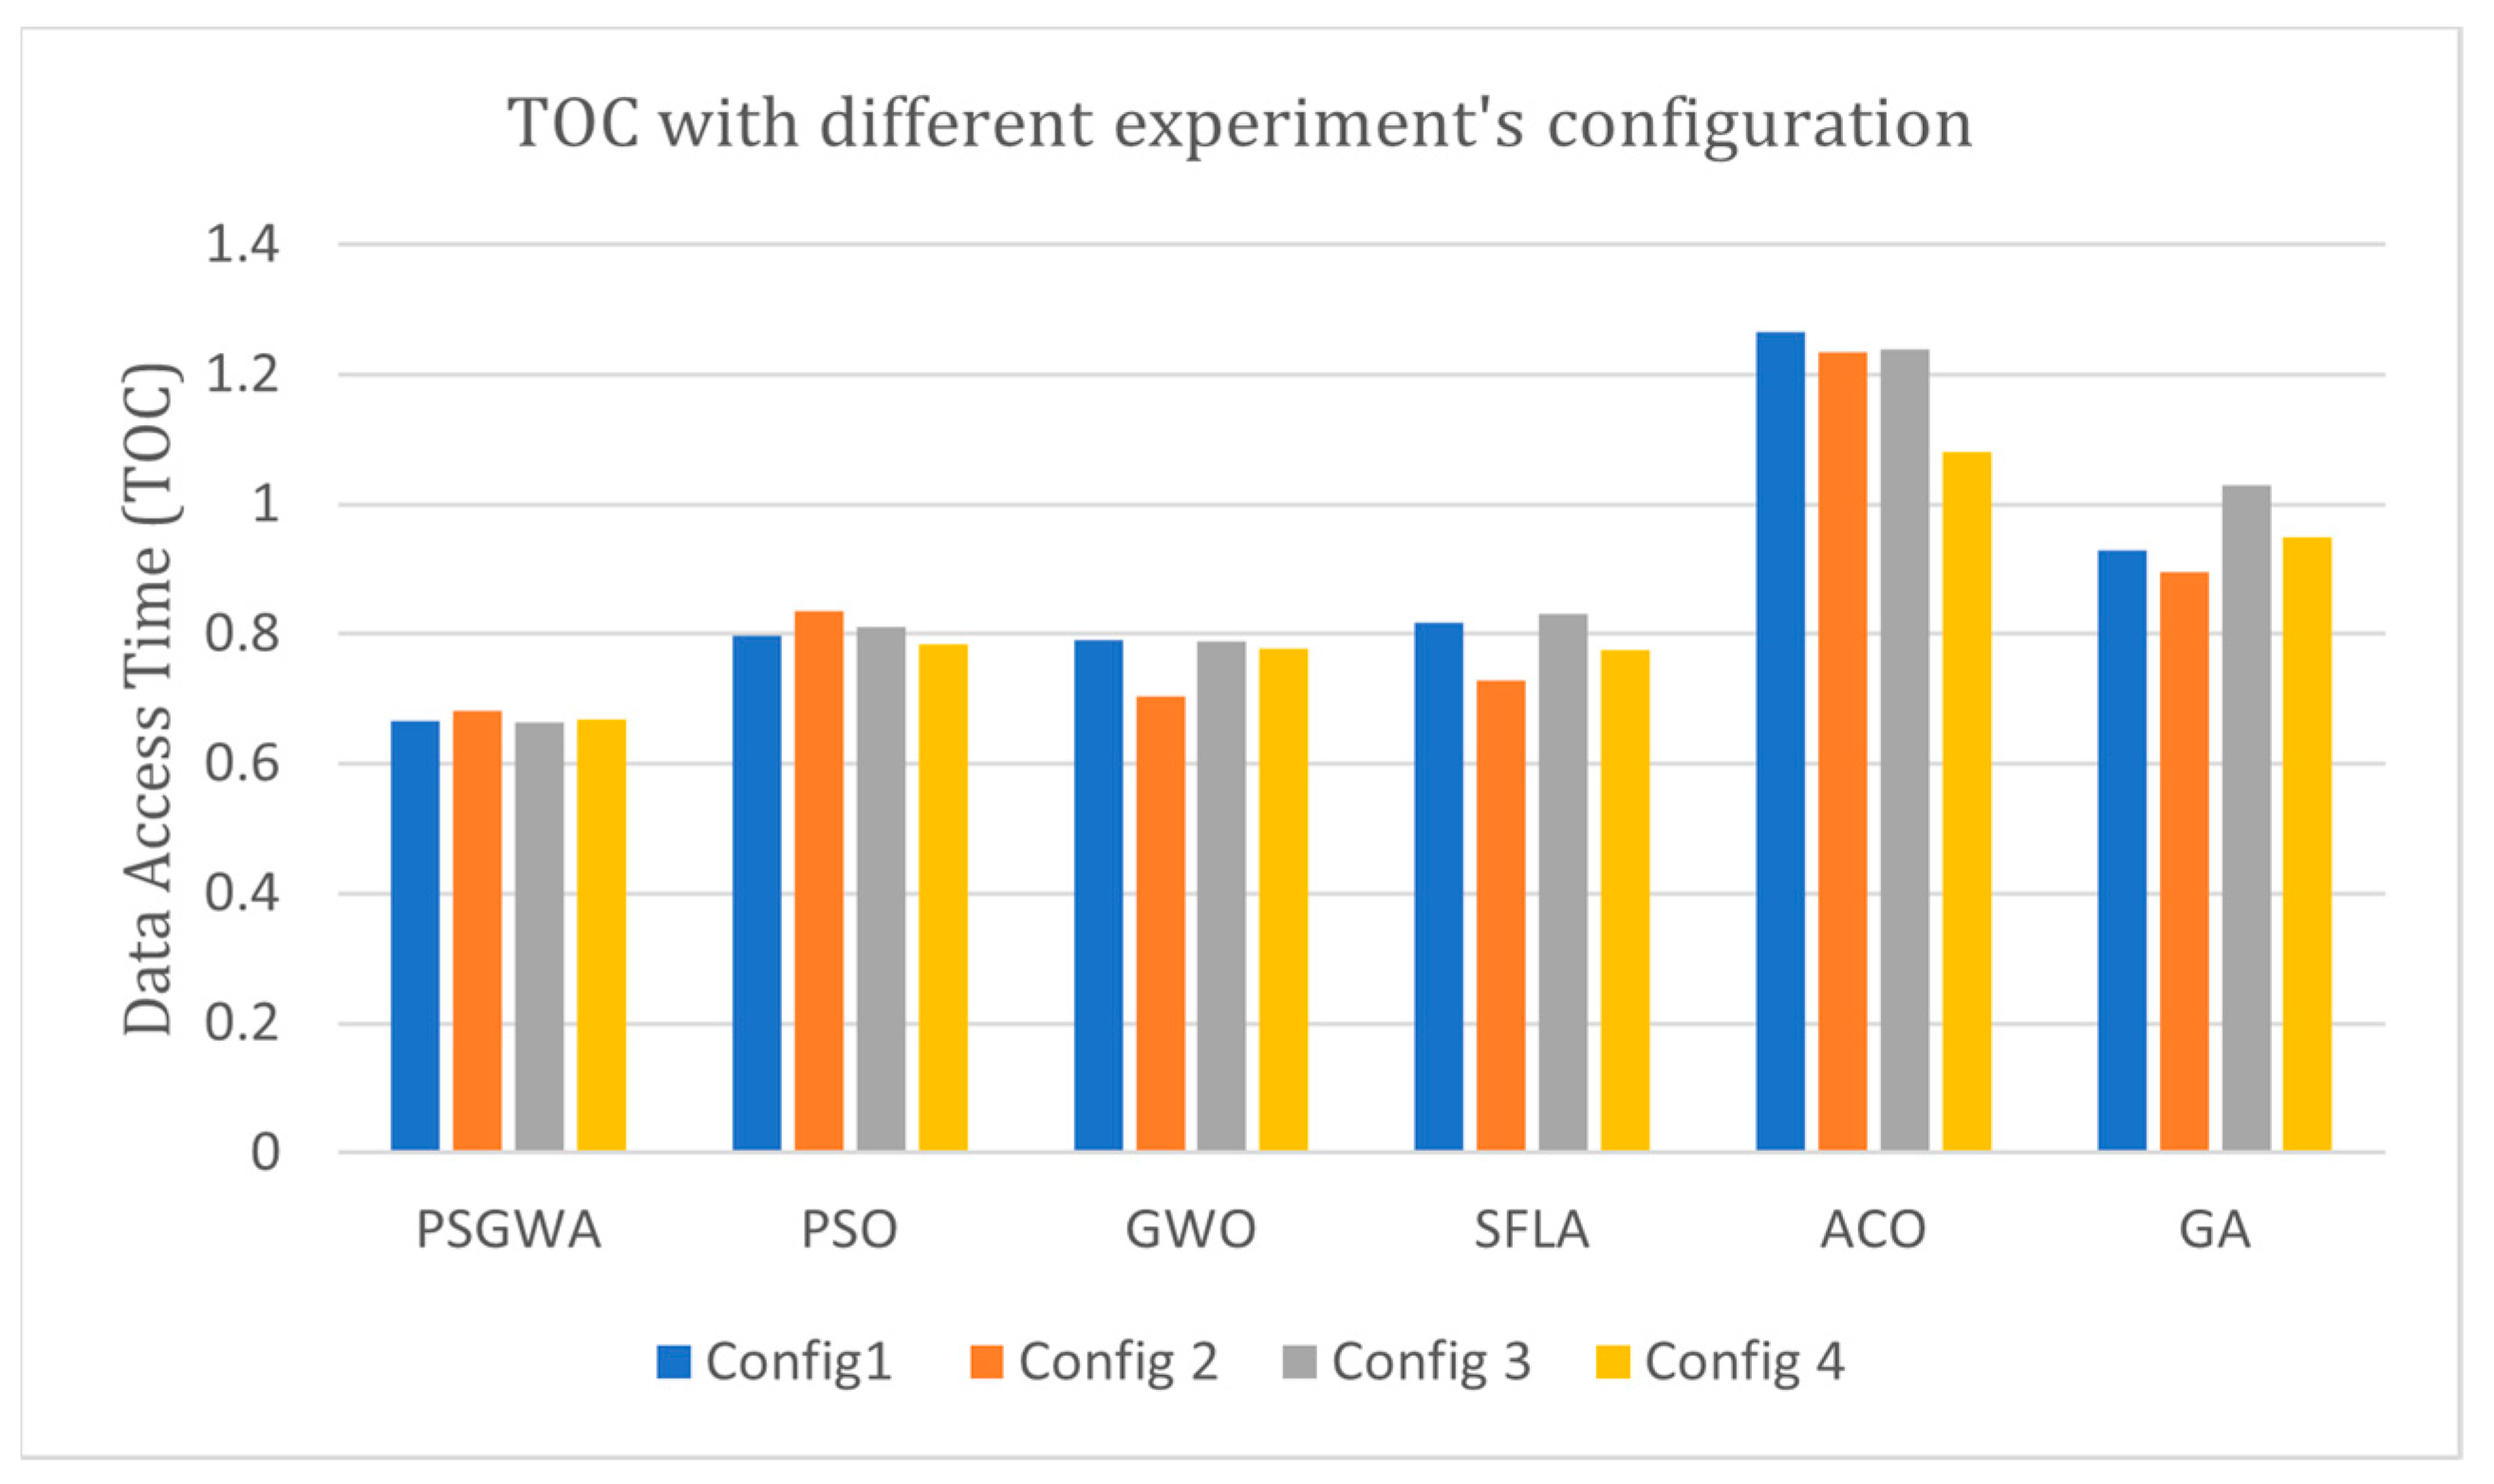
- Total data access operations (read and write) cost (TOC).
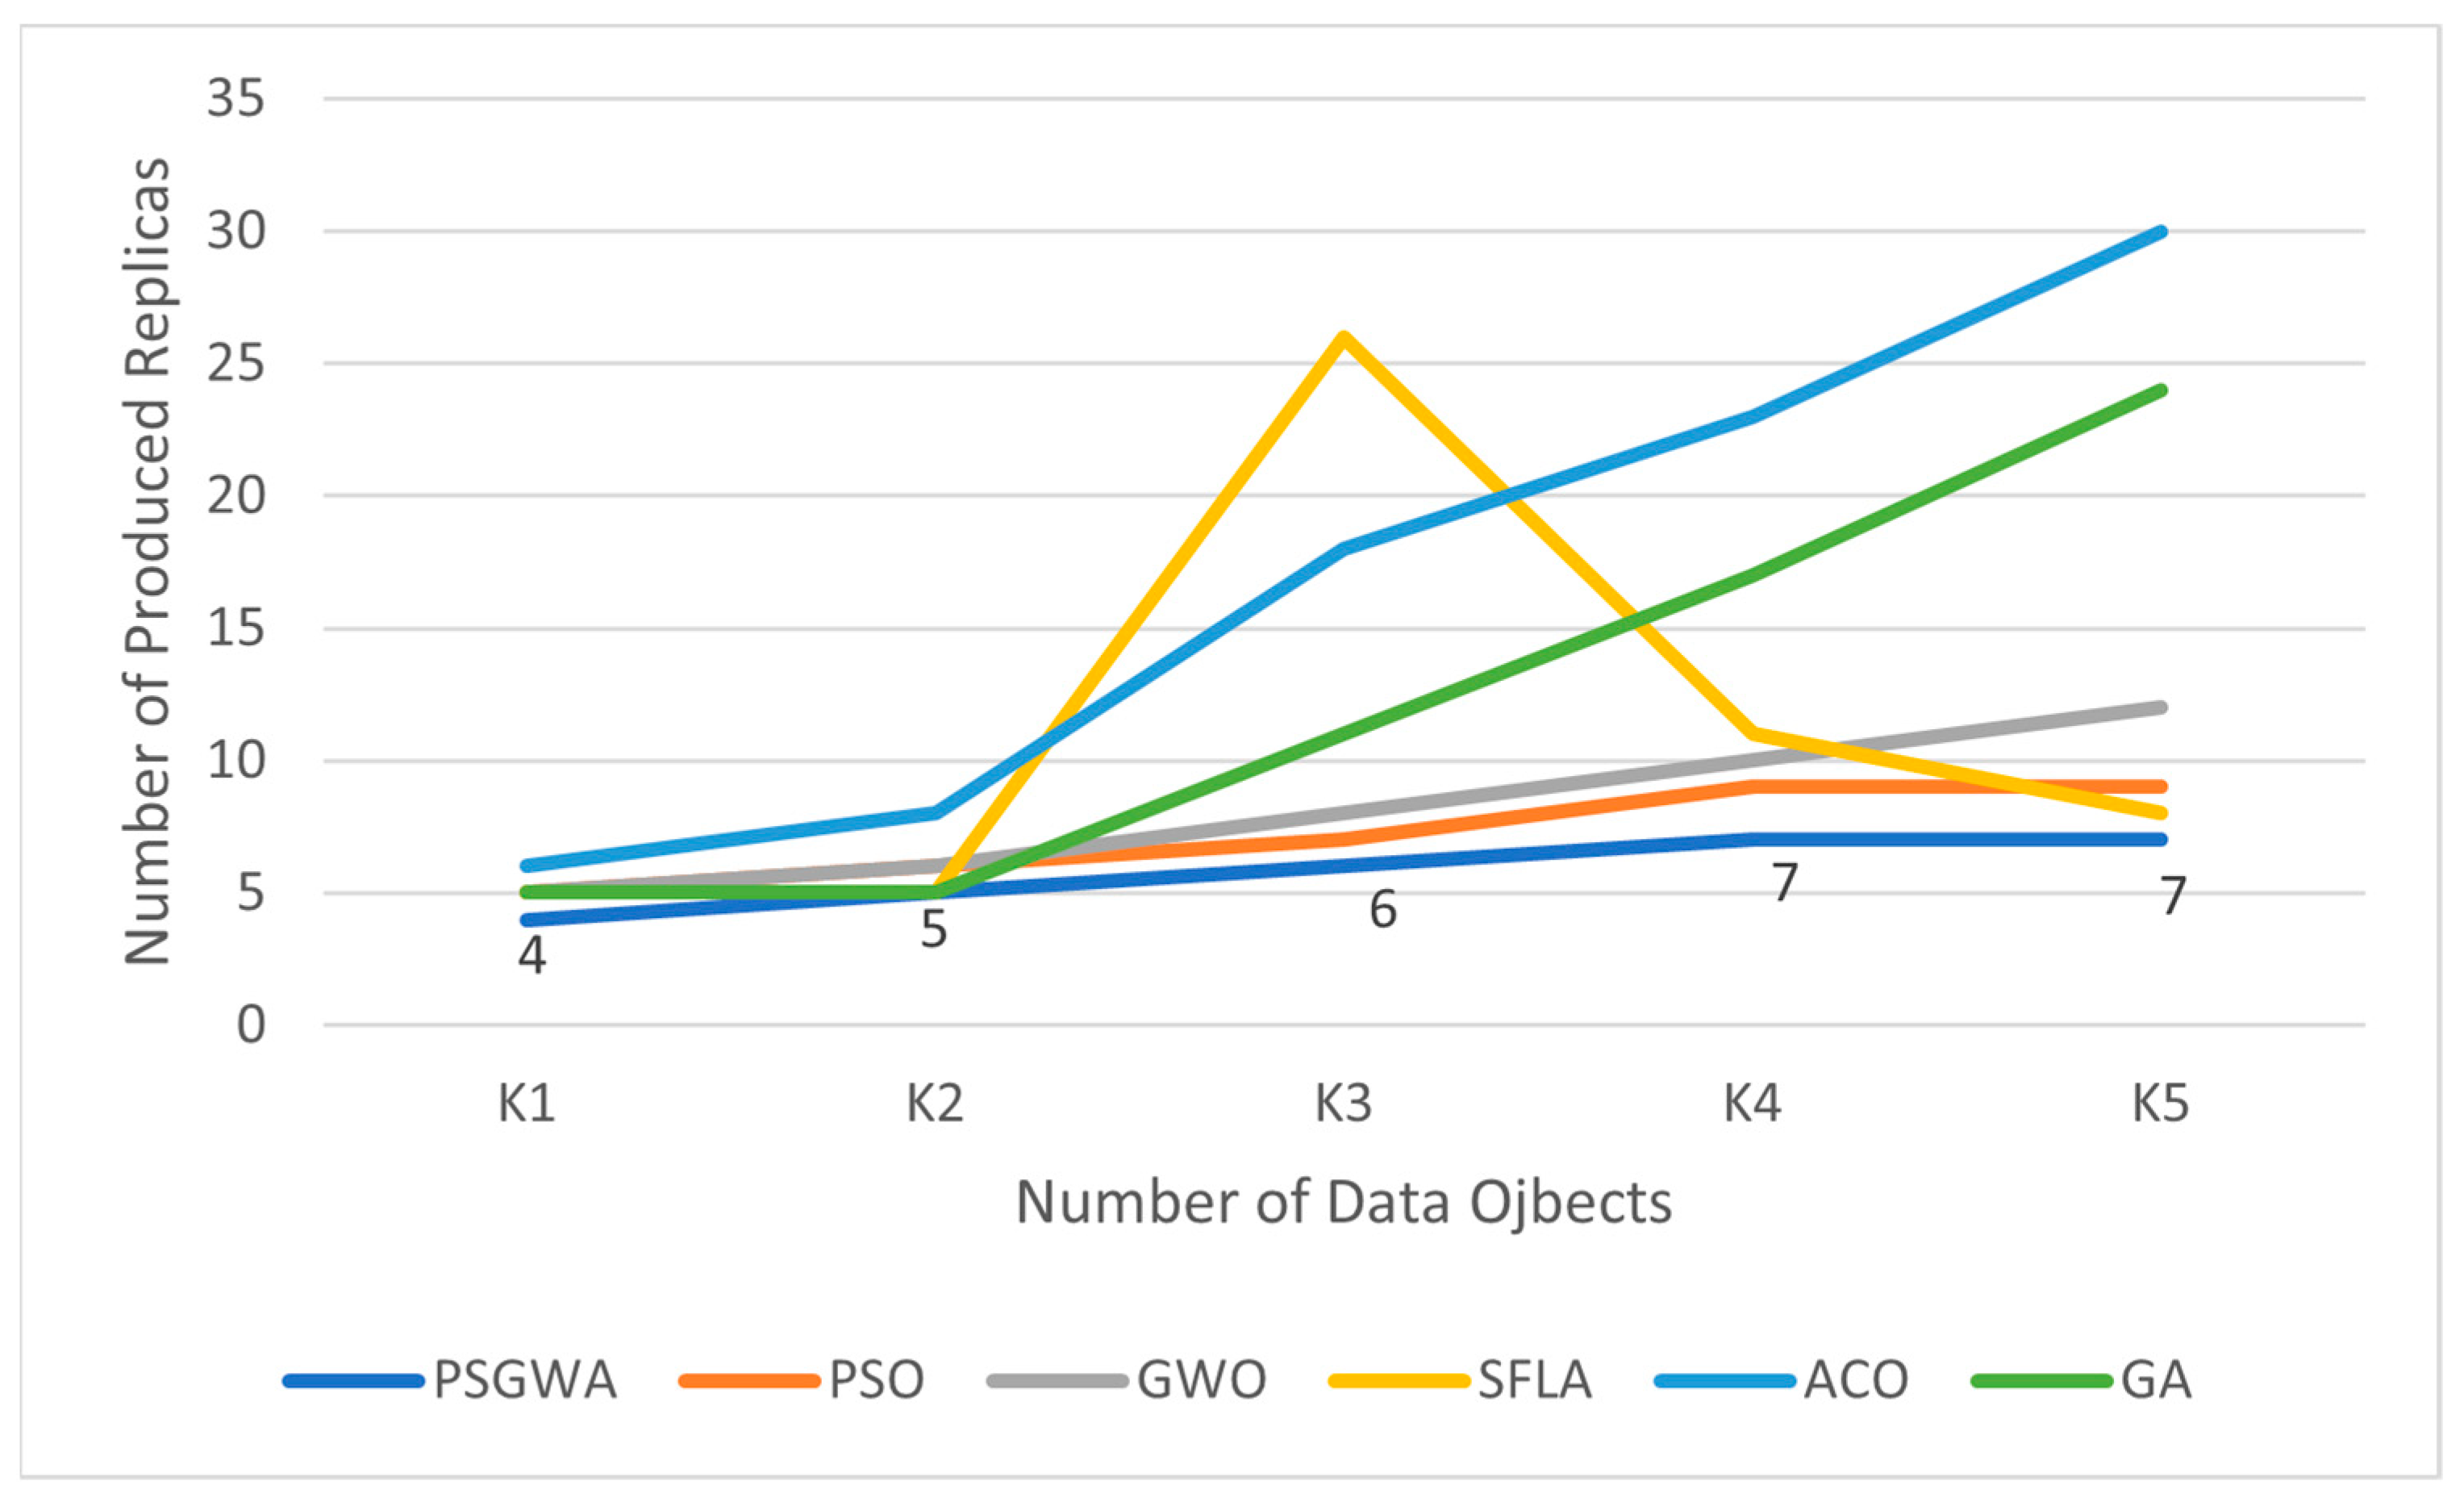
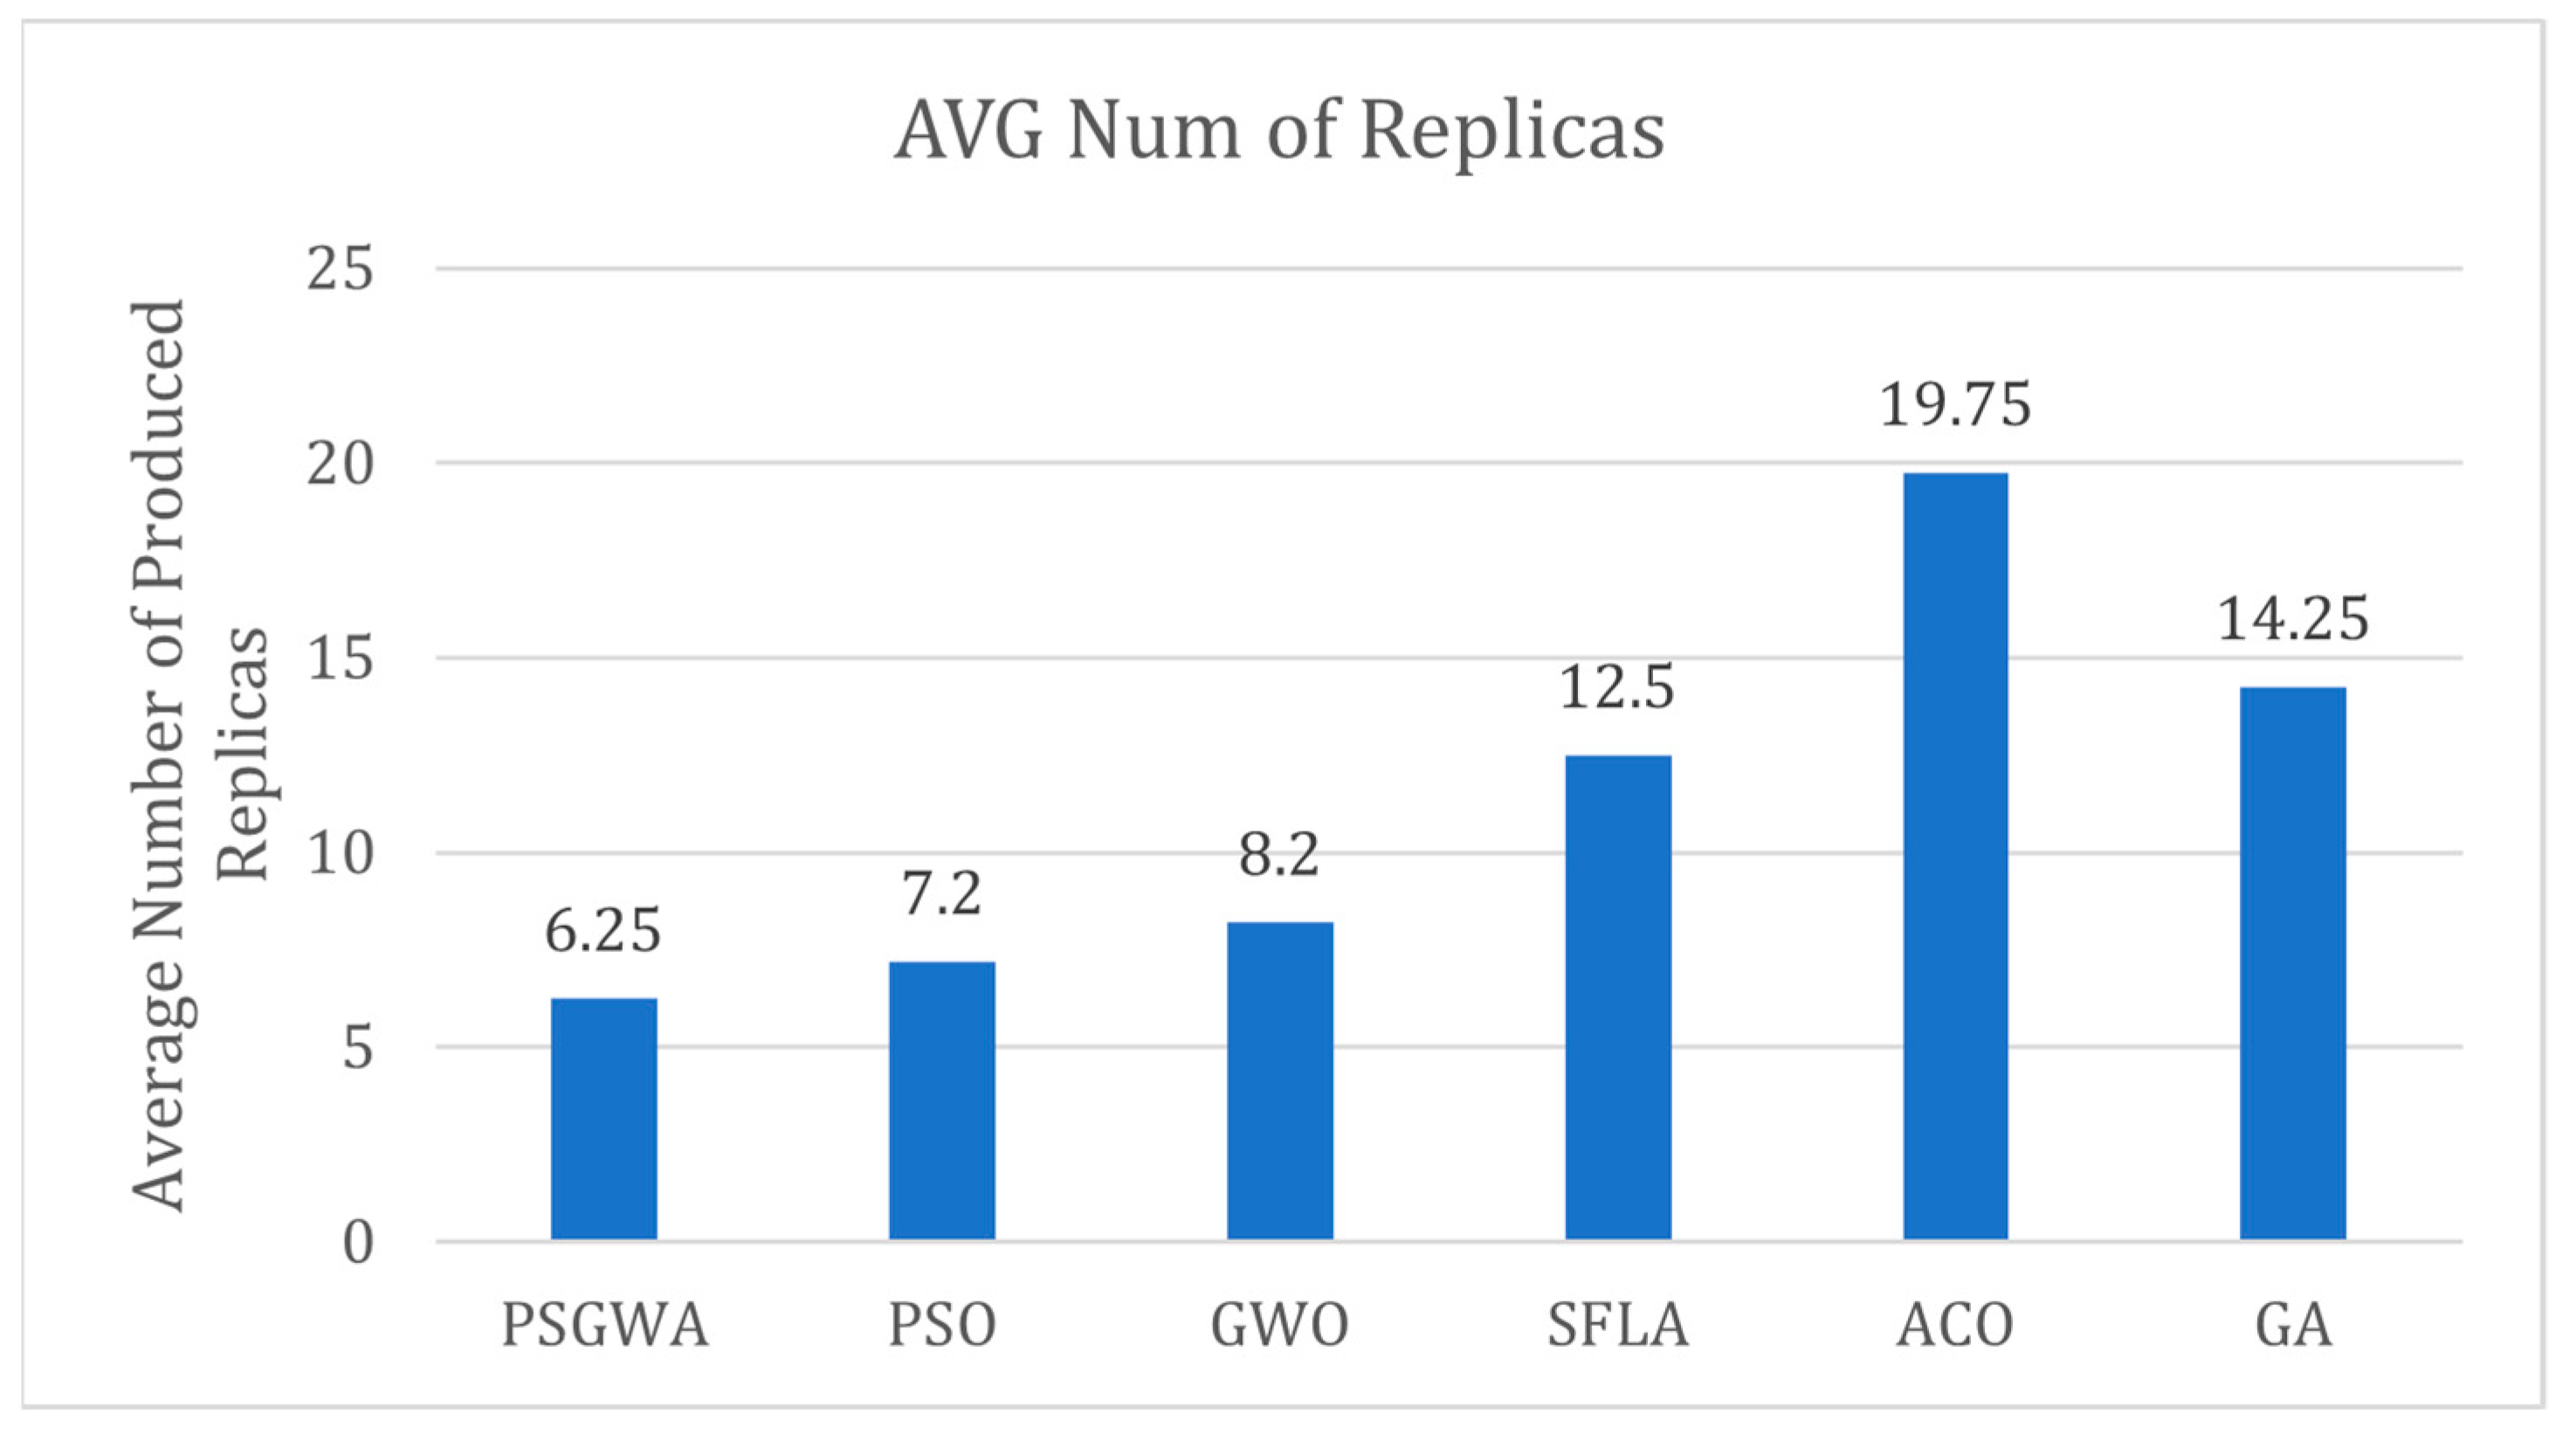
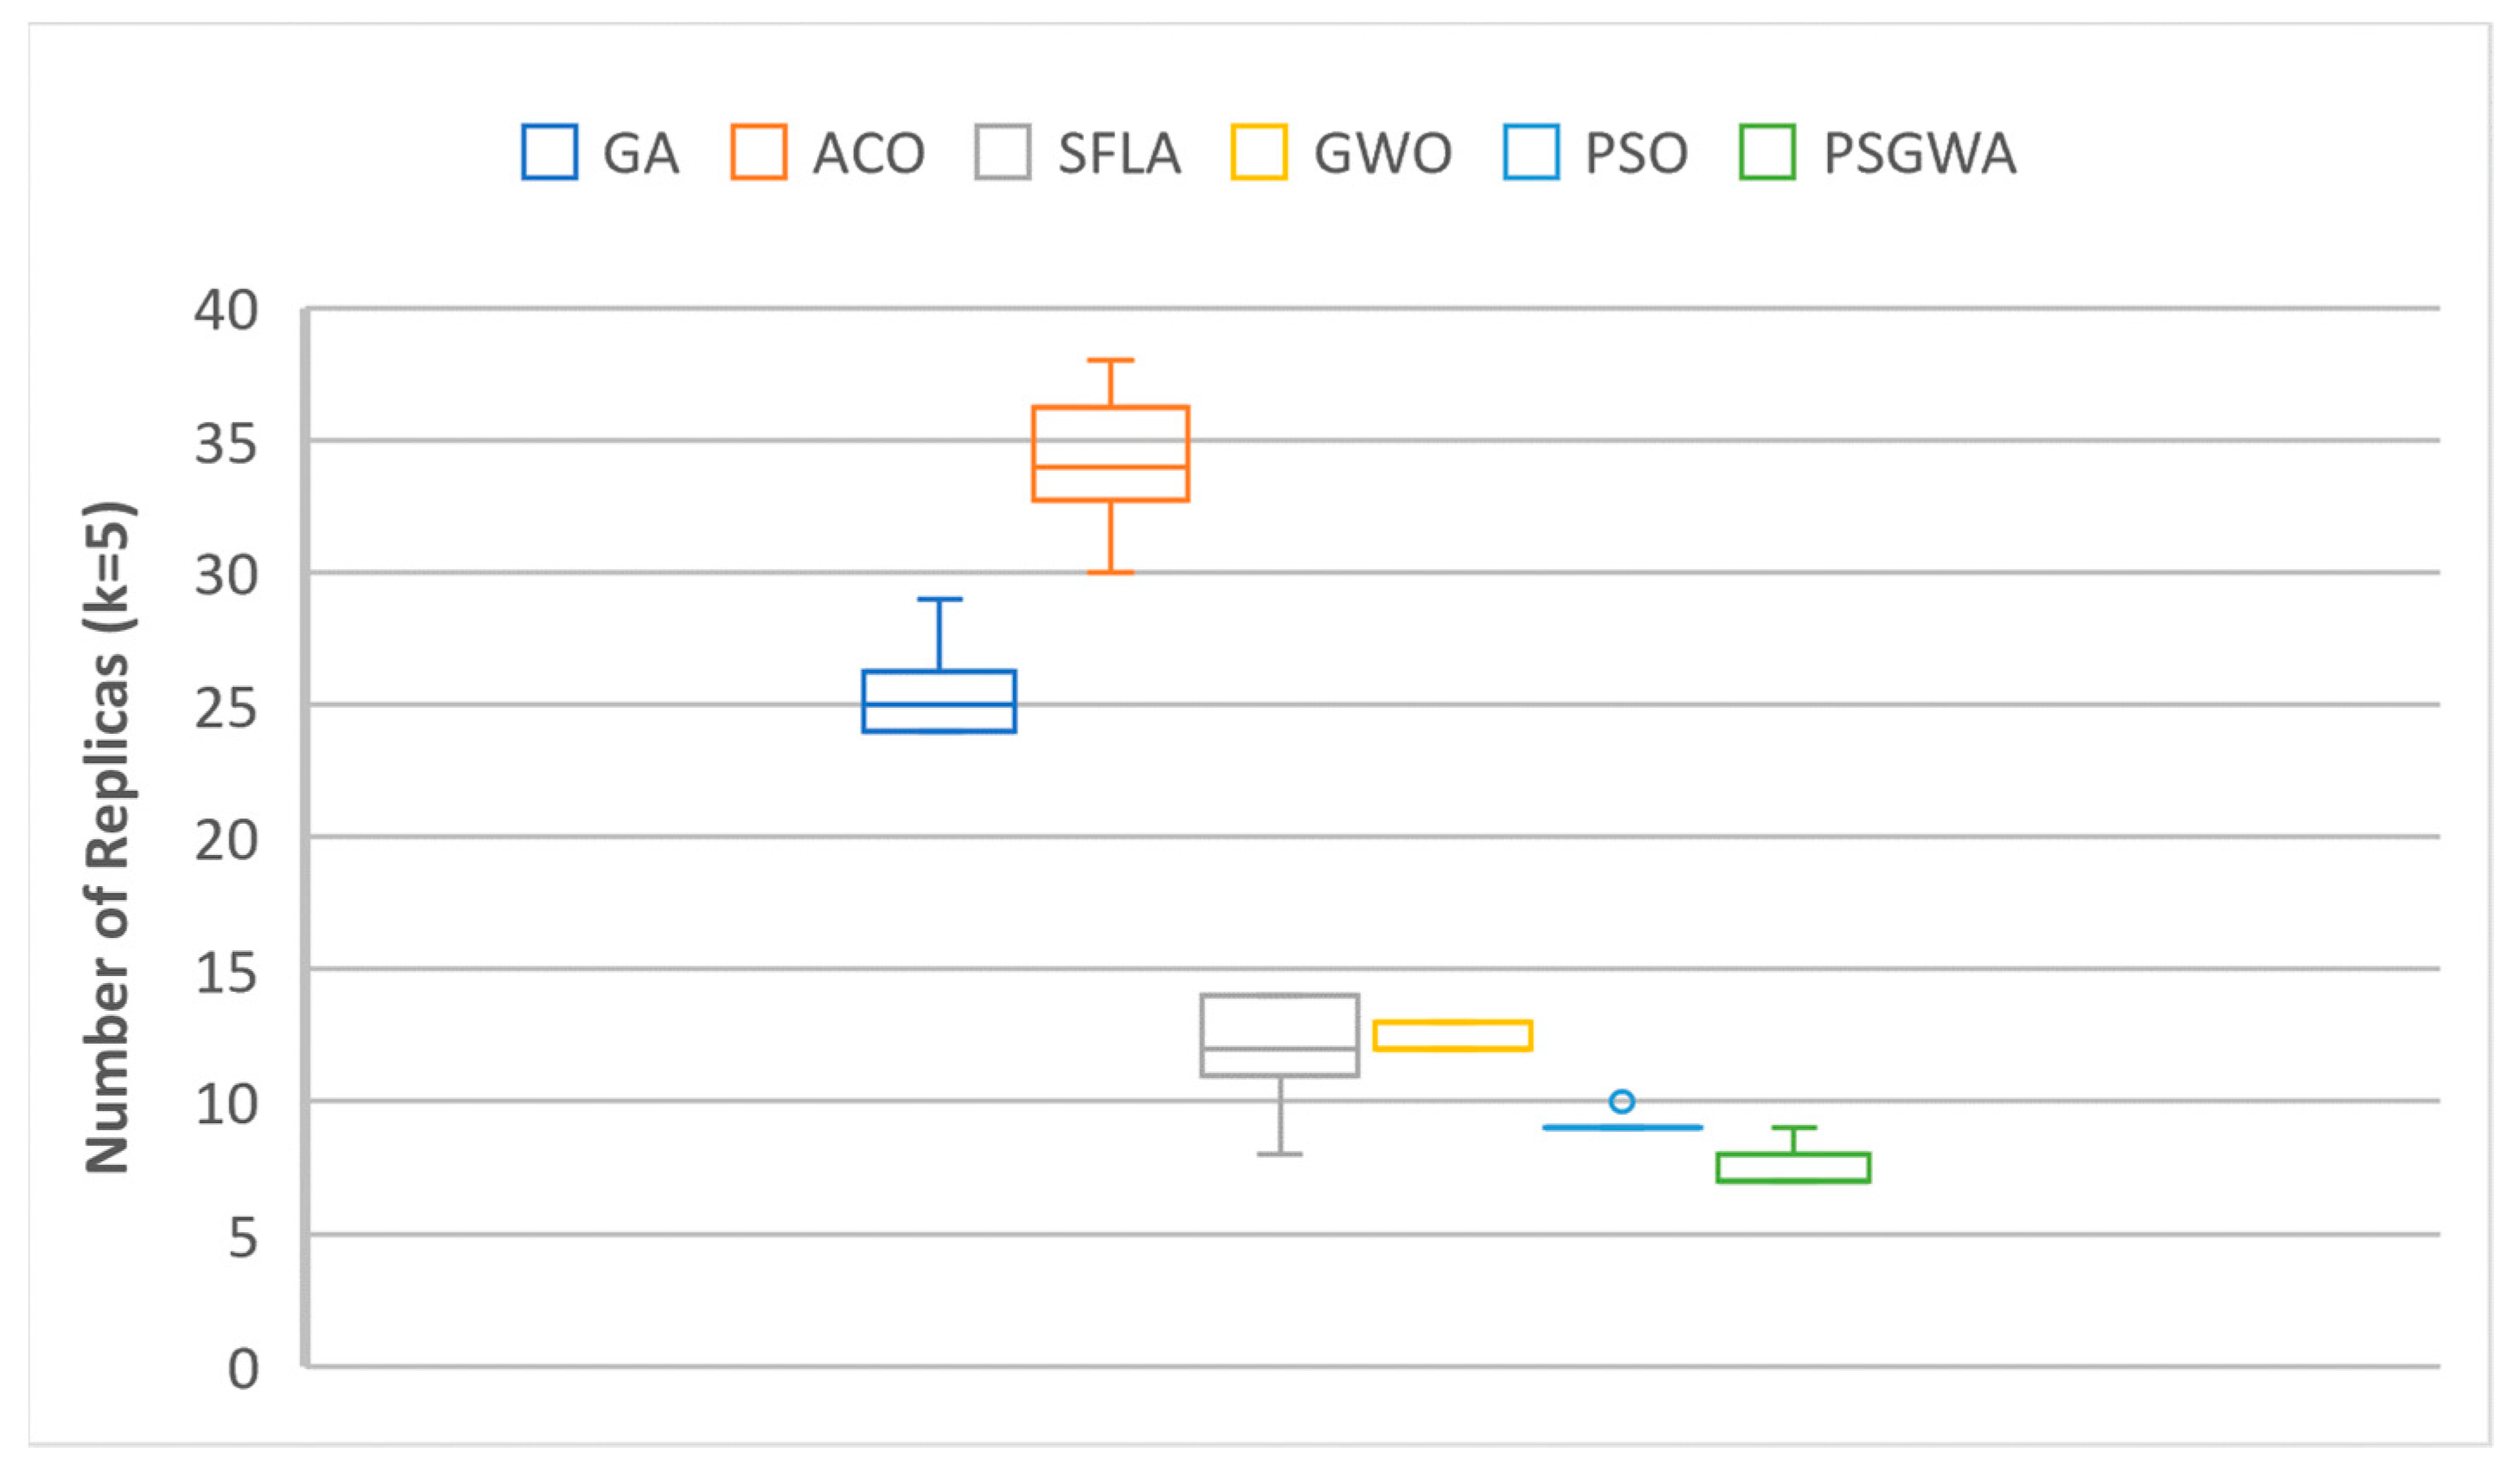
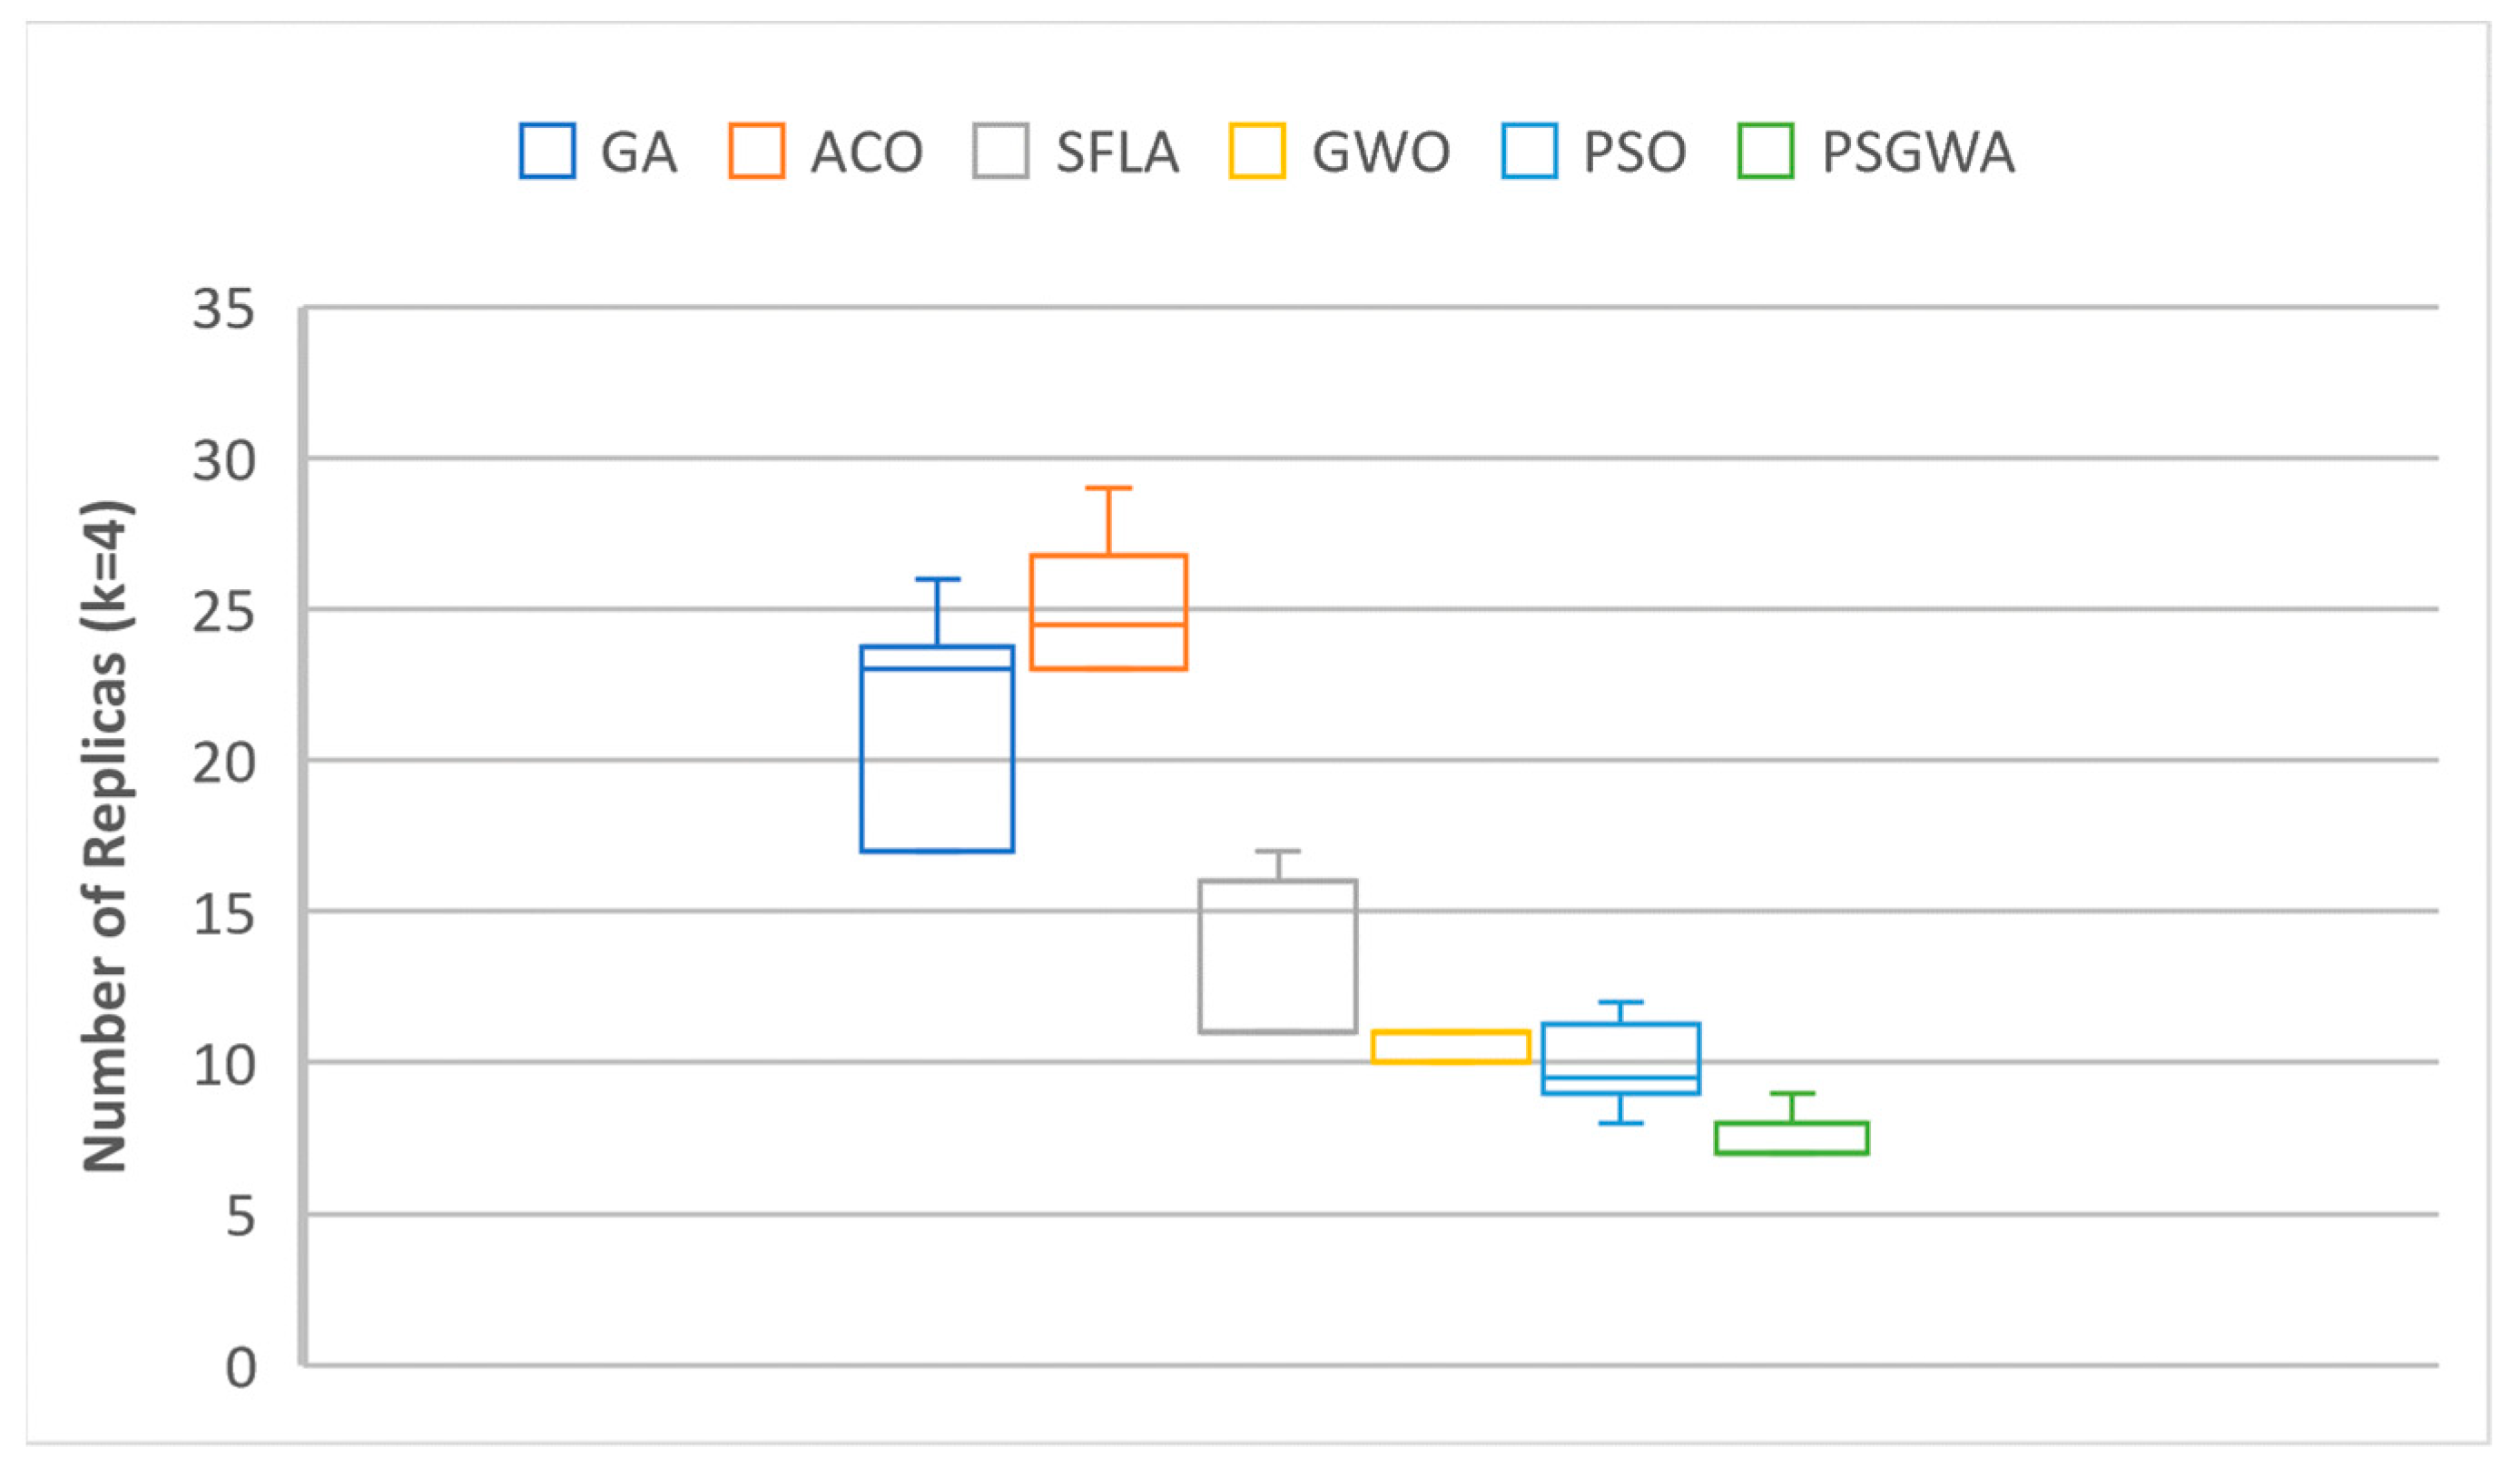
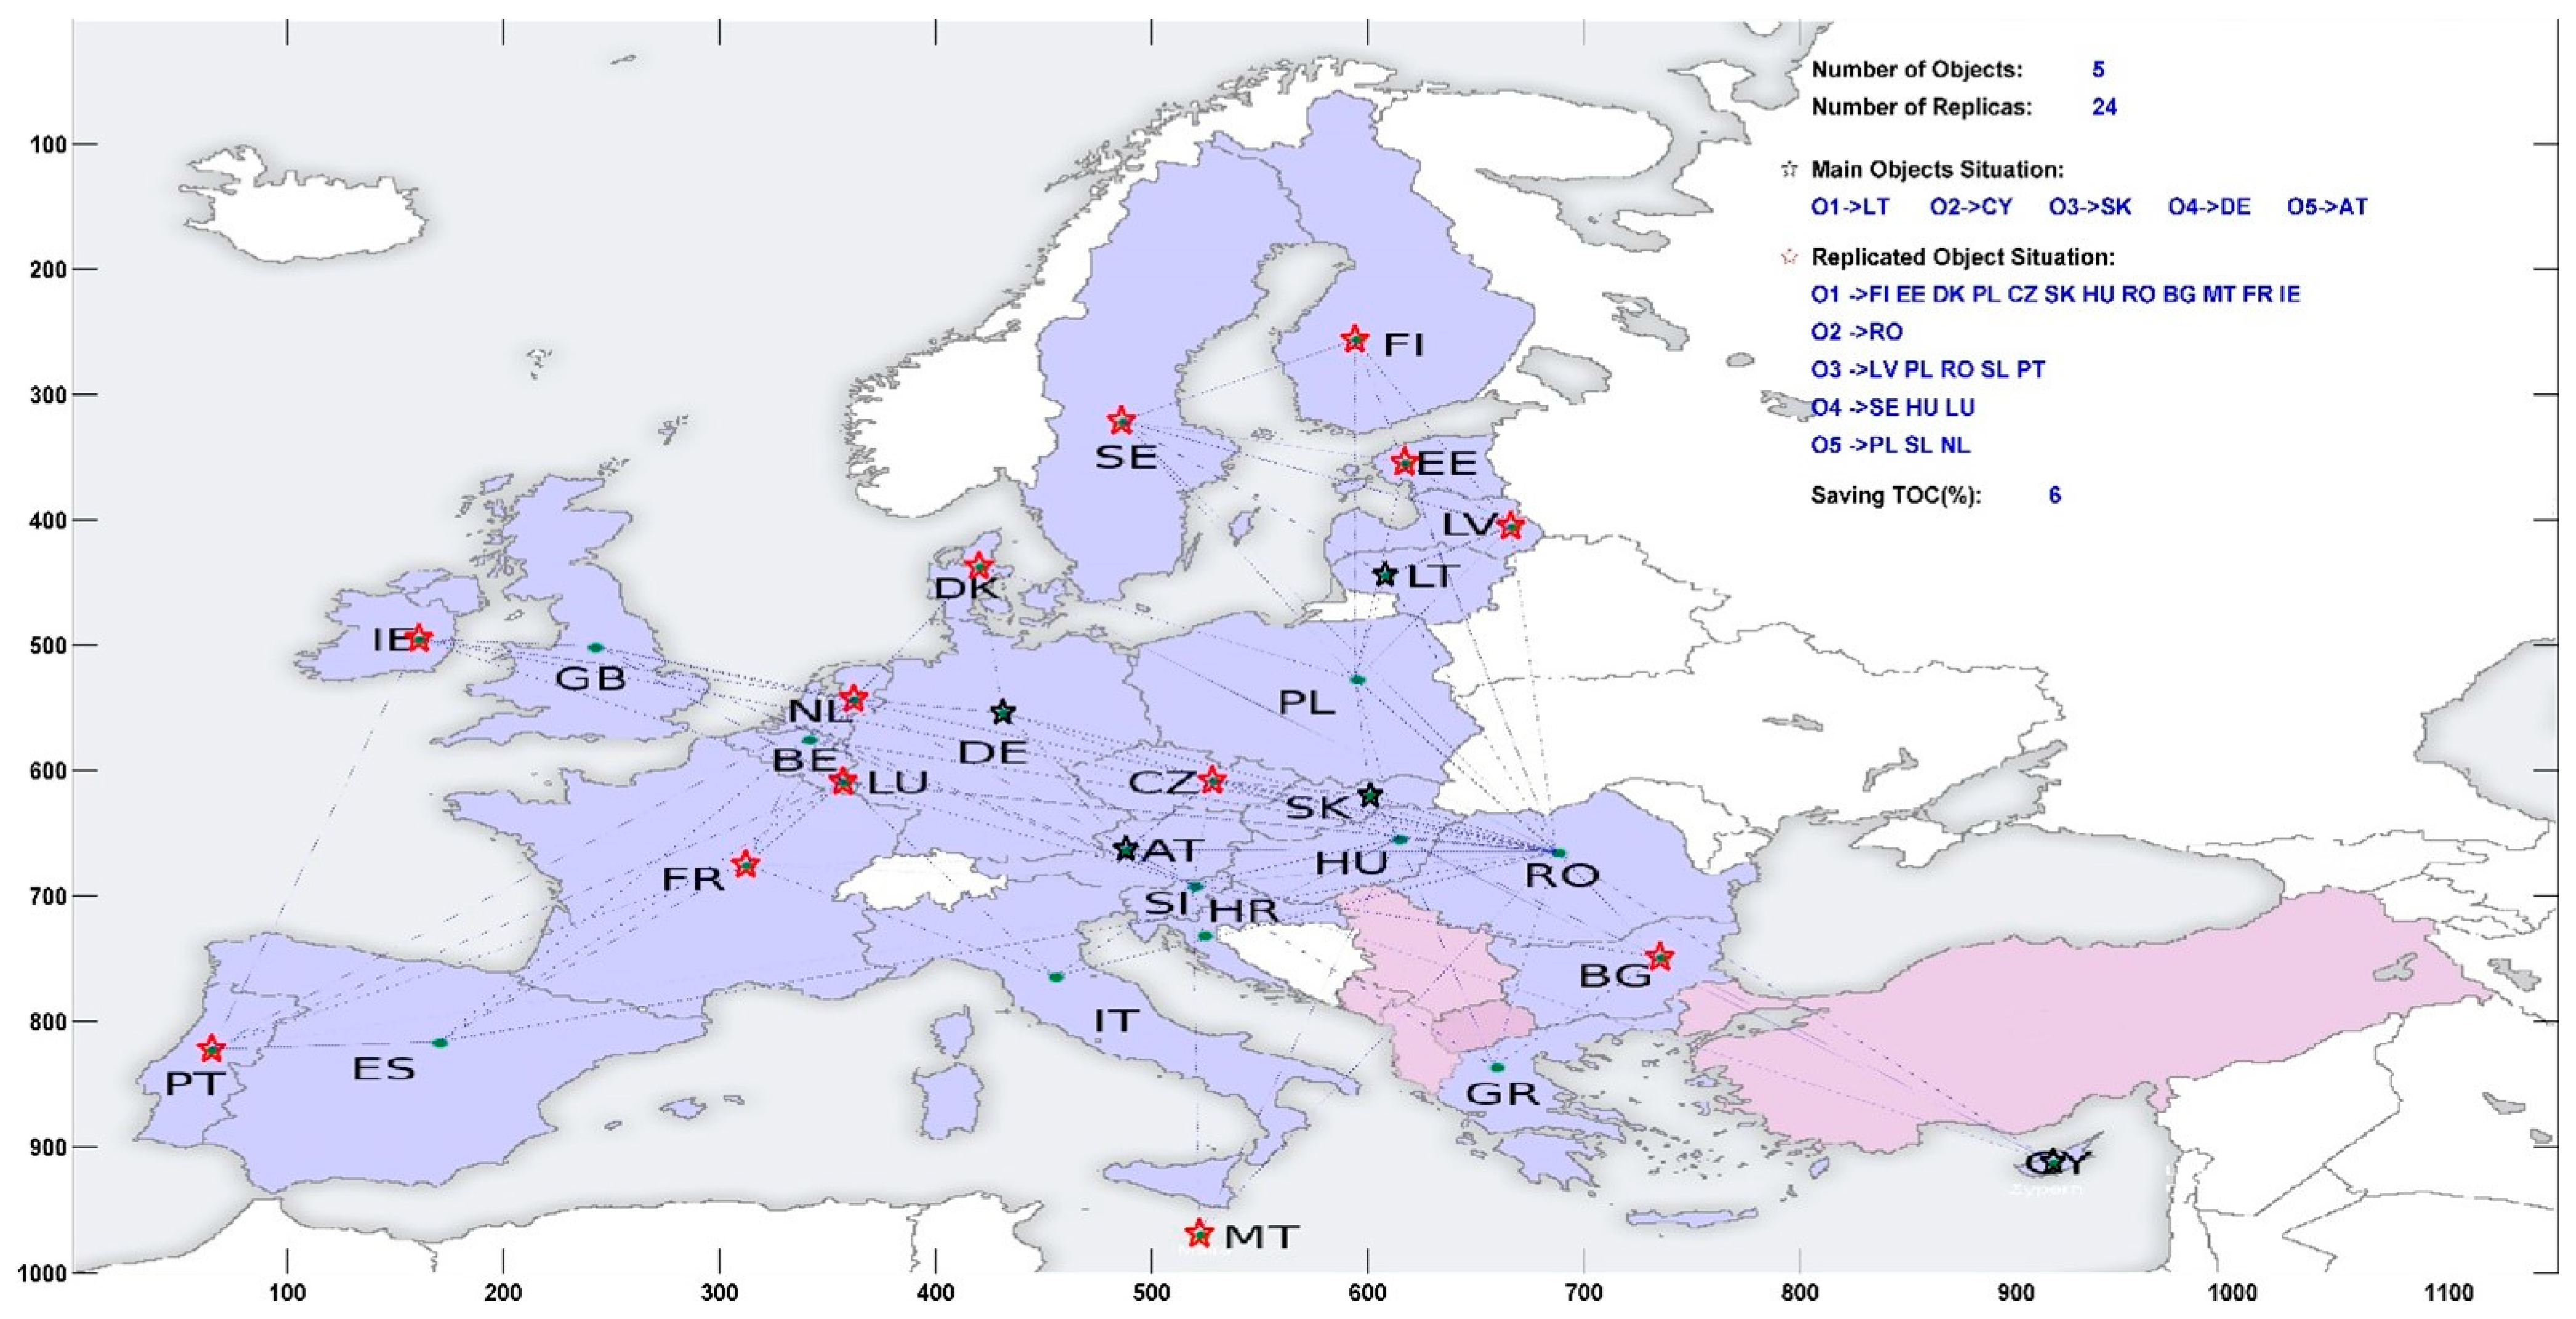
- The number of replica objects.
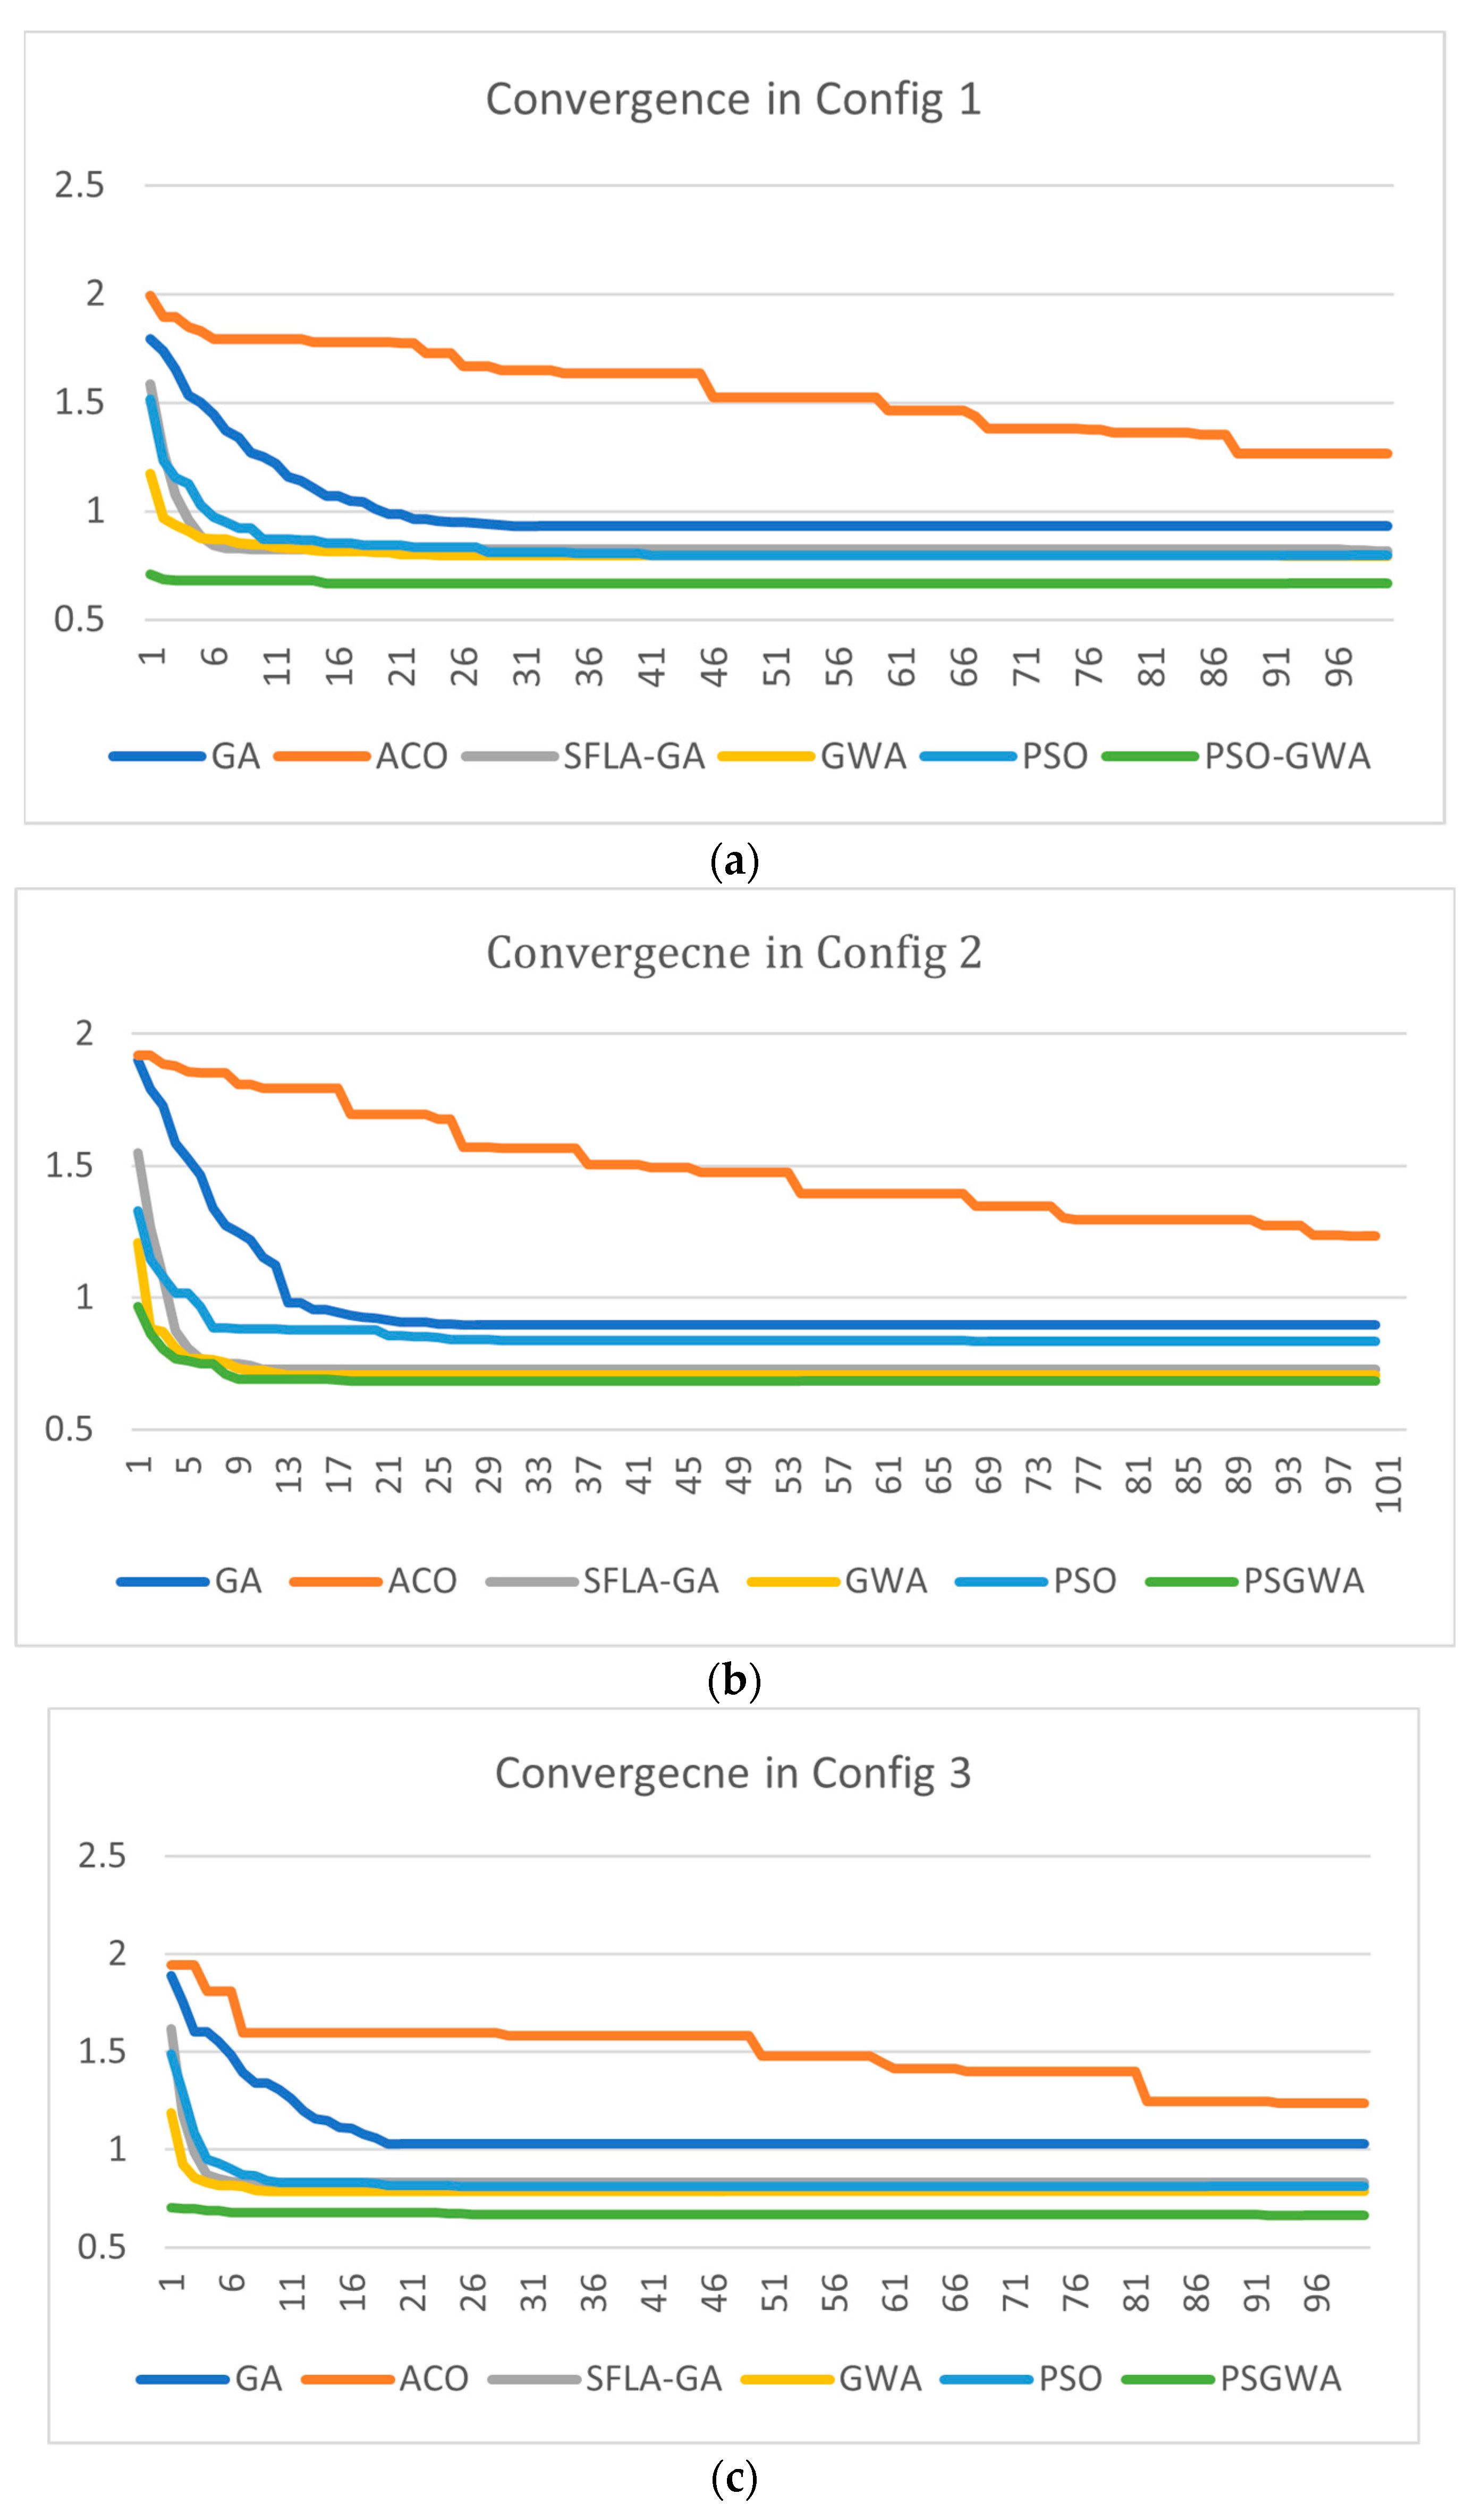
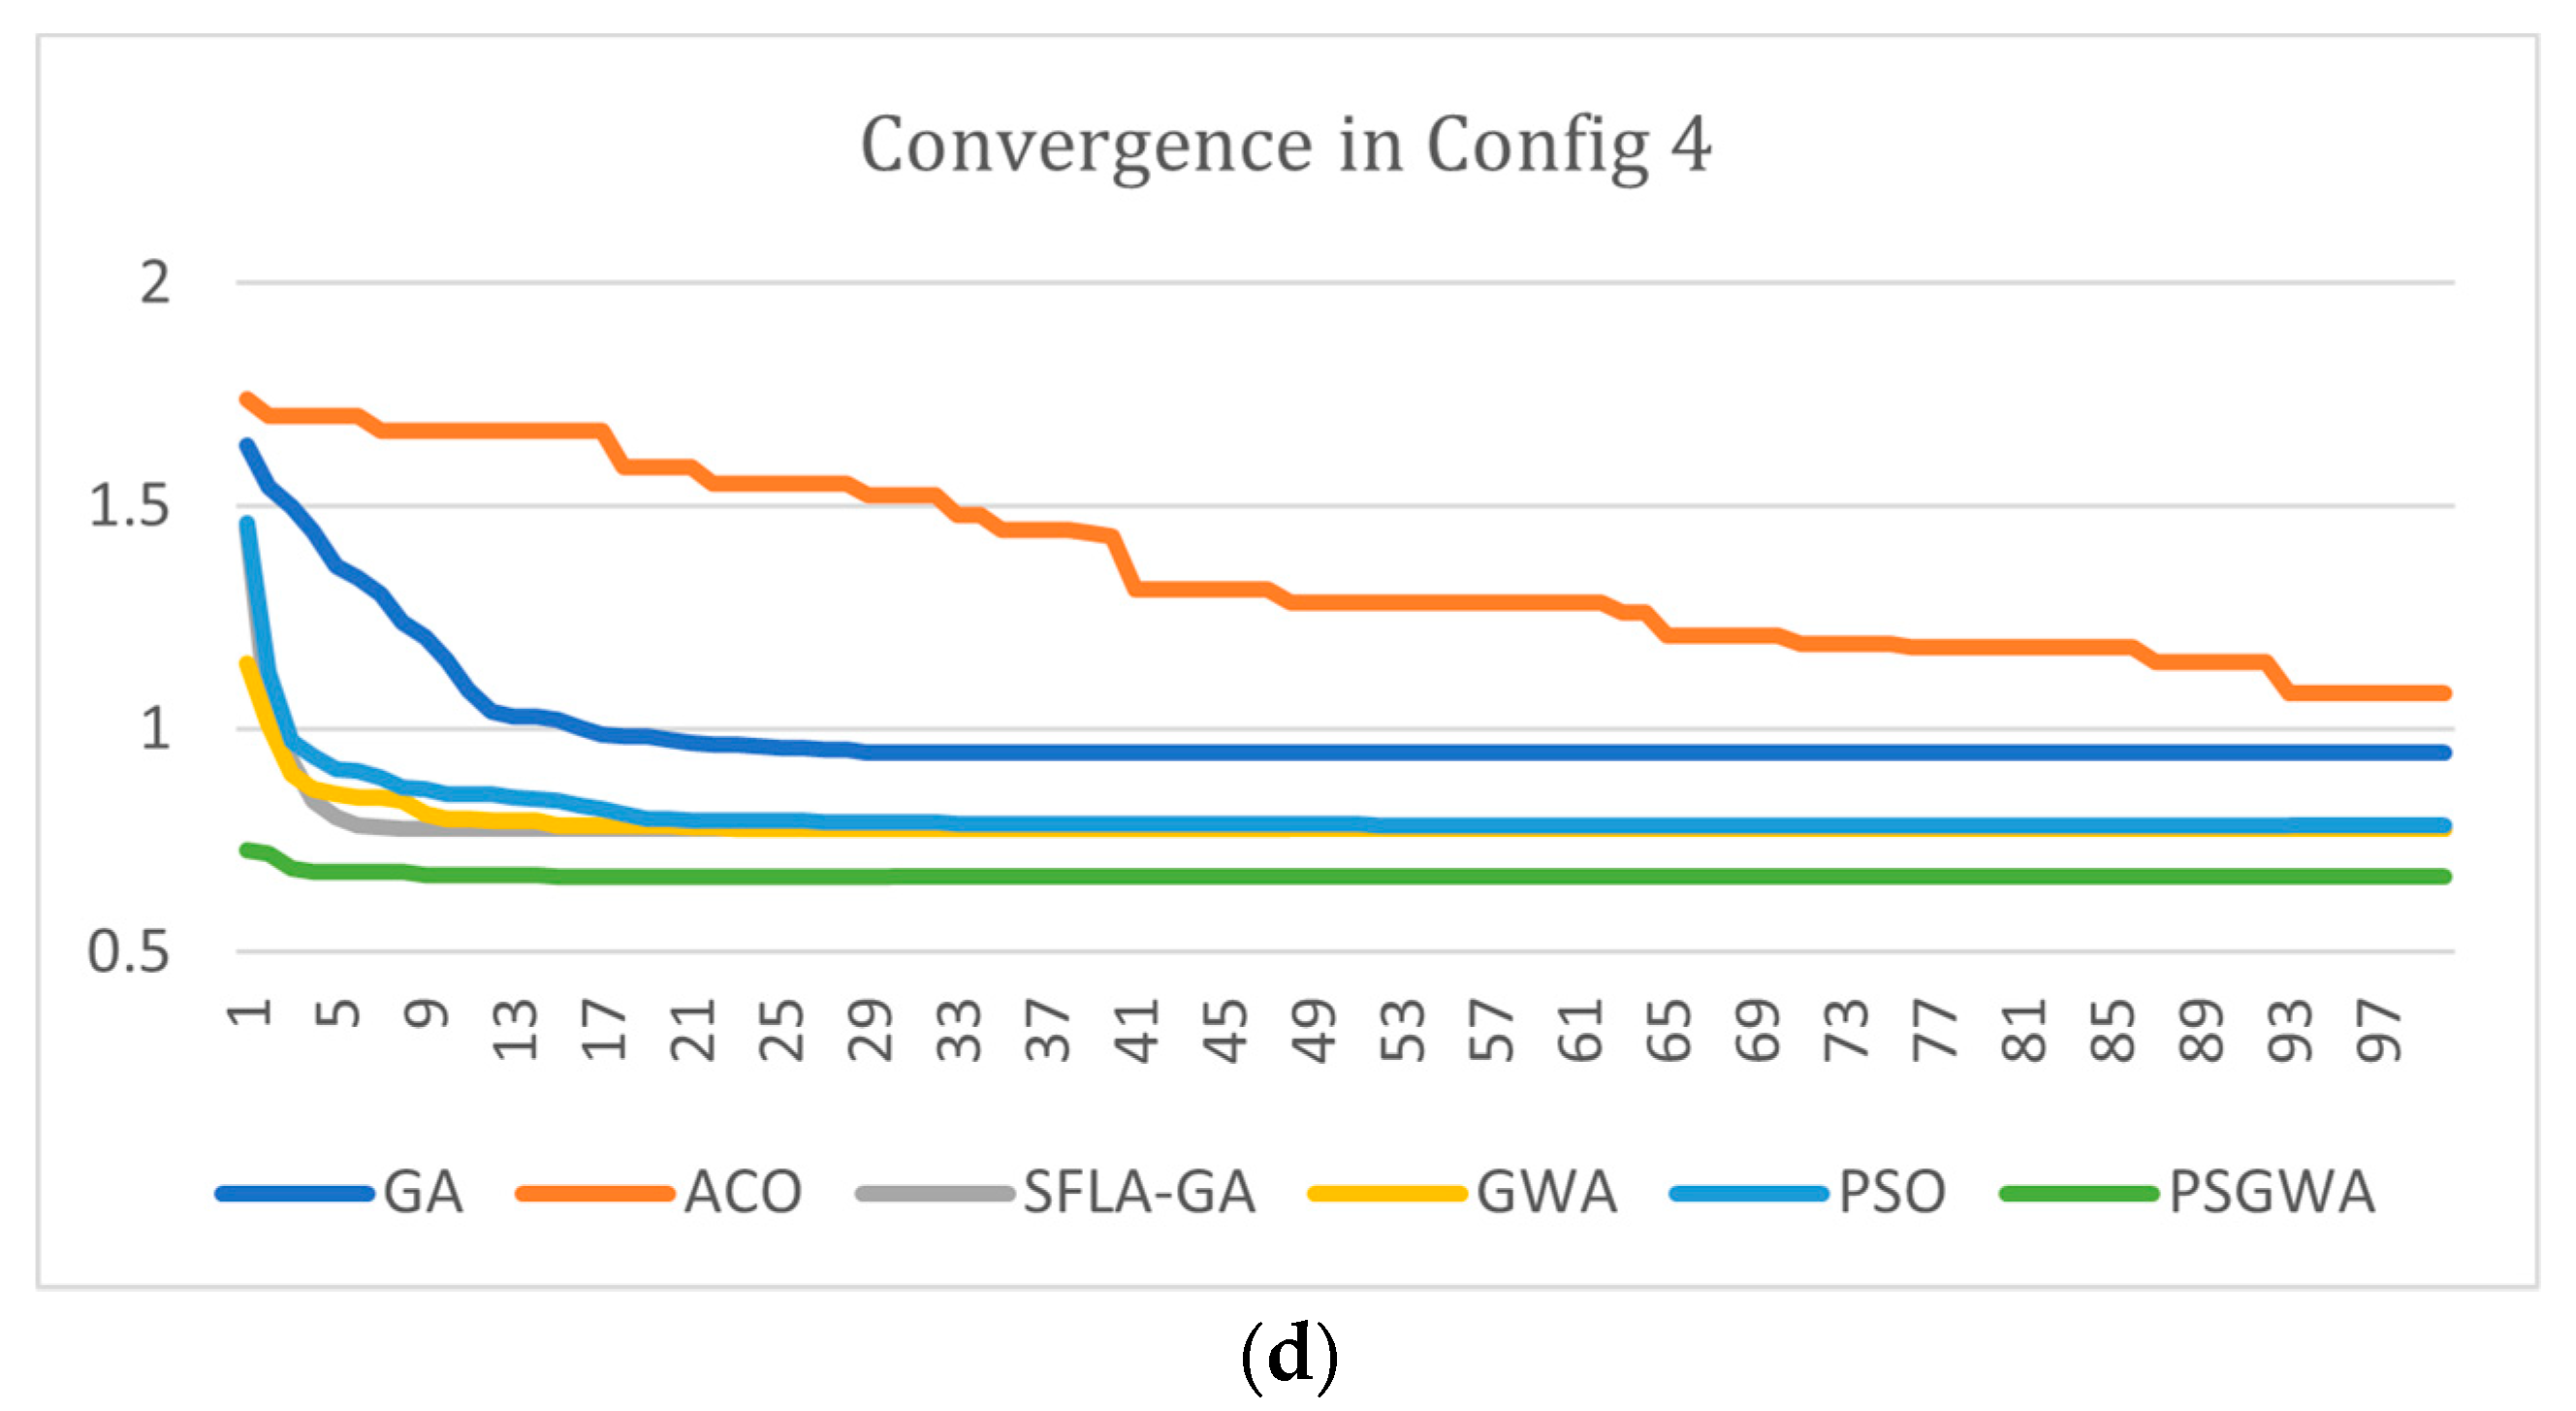
- Convergence speed of the algorithms in providing the best solution.
- Reliability of the algorithms in solving the replica-placement algorithms.
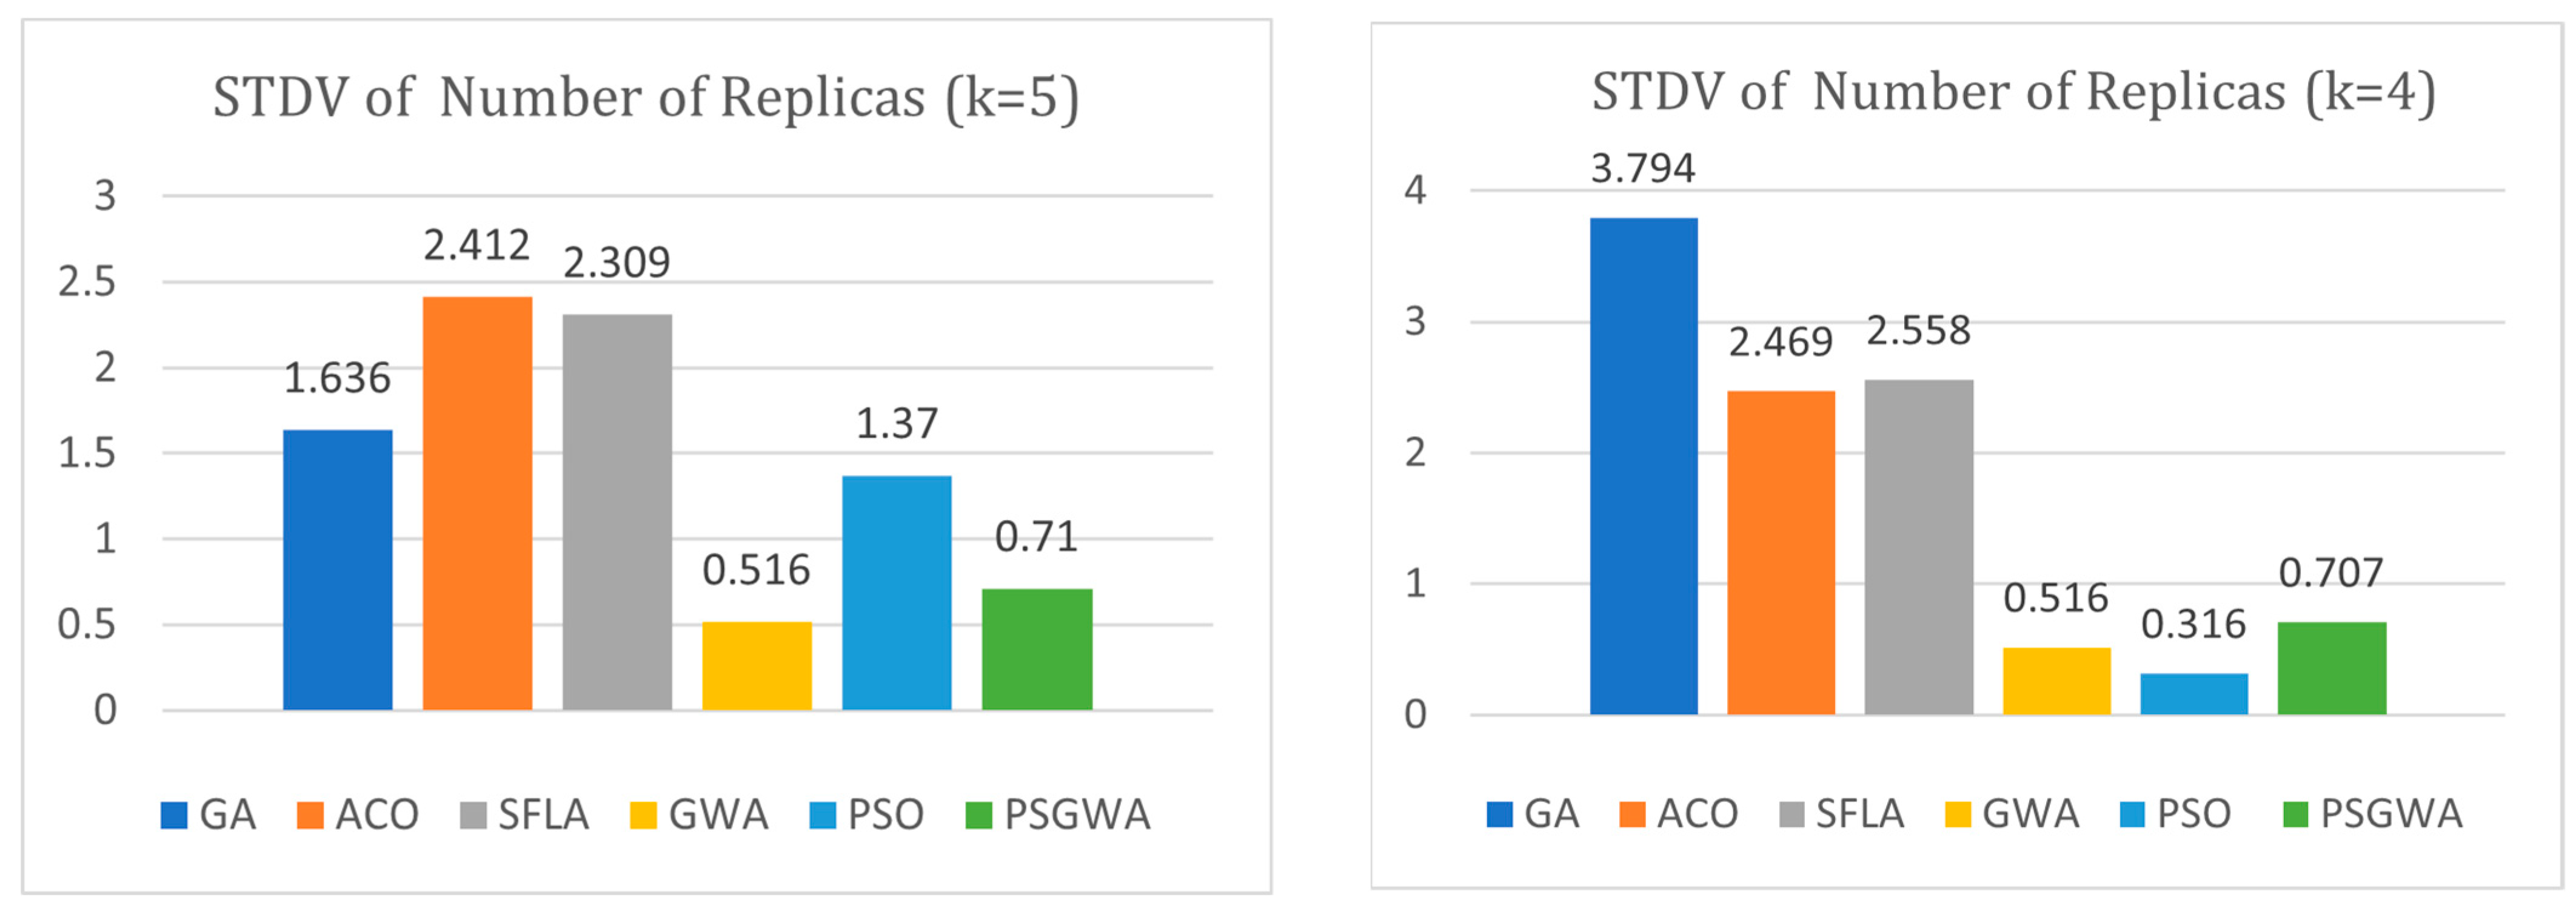
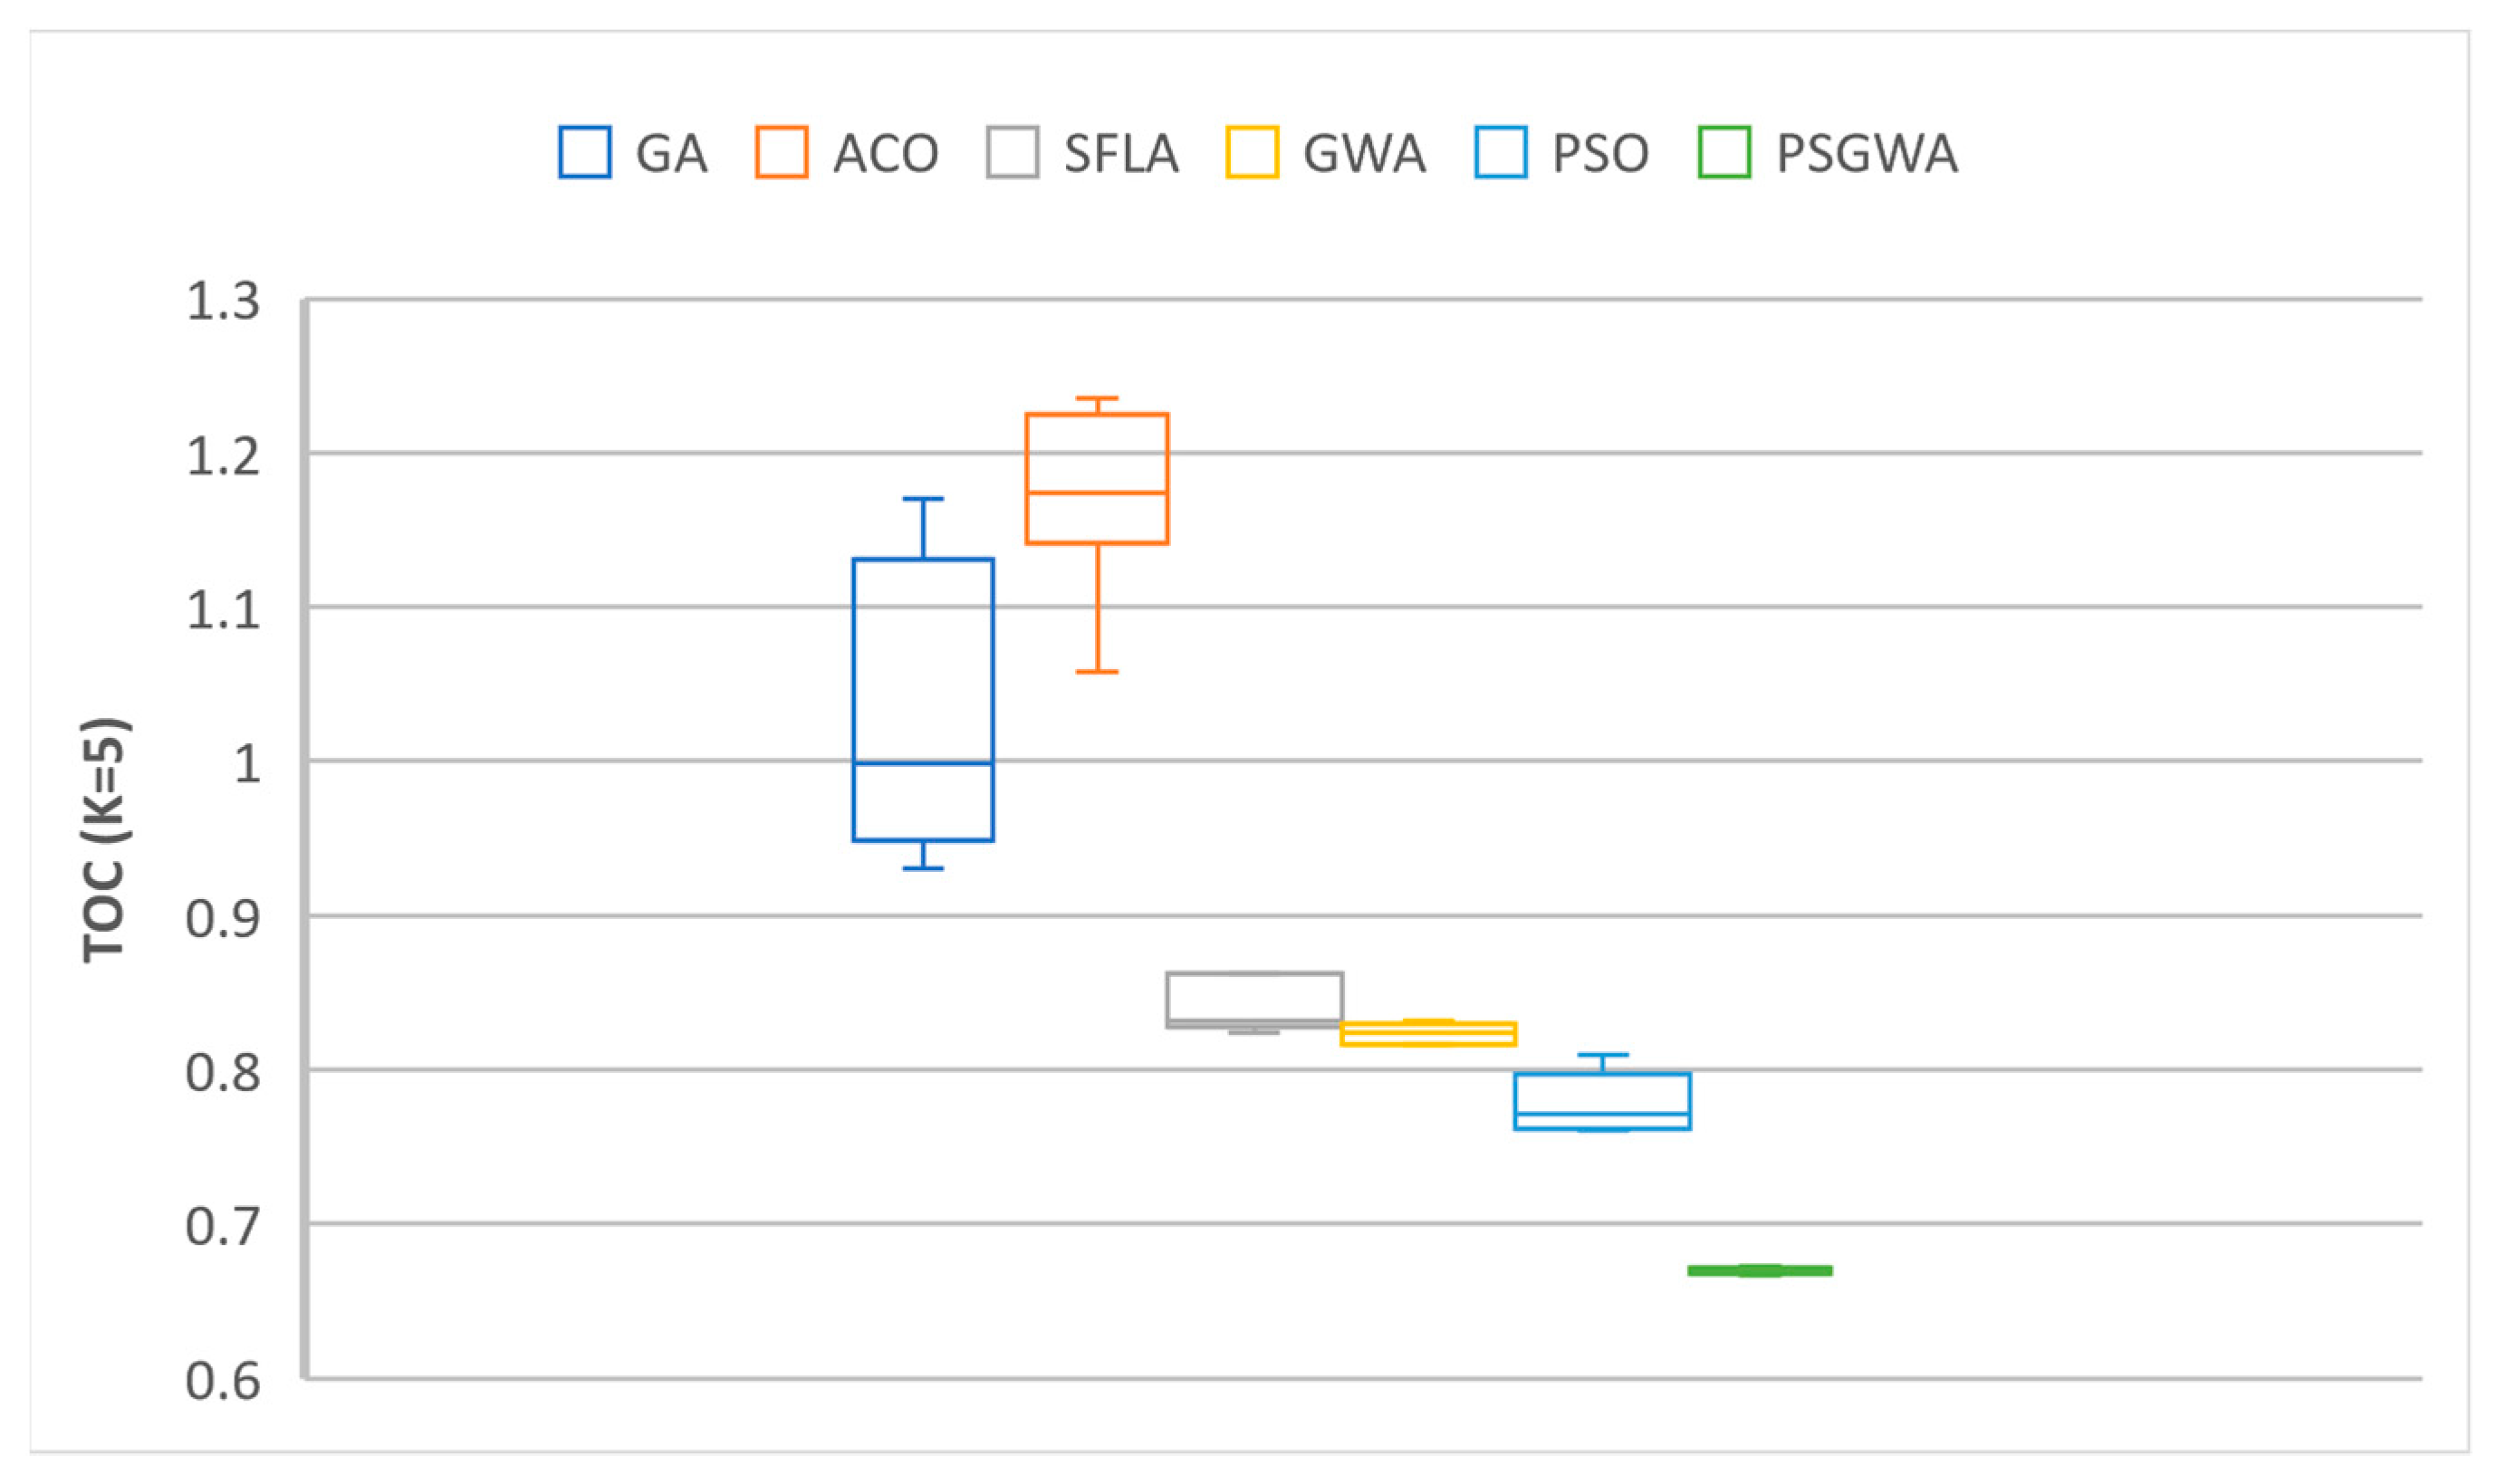
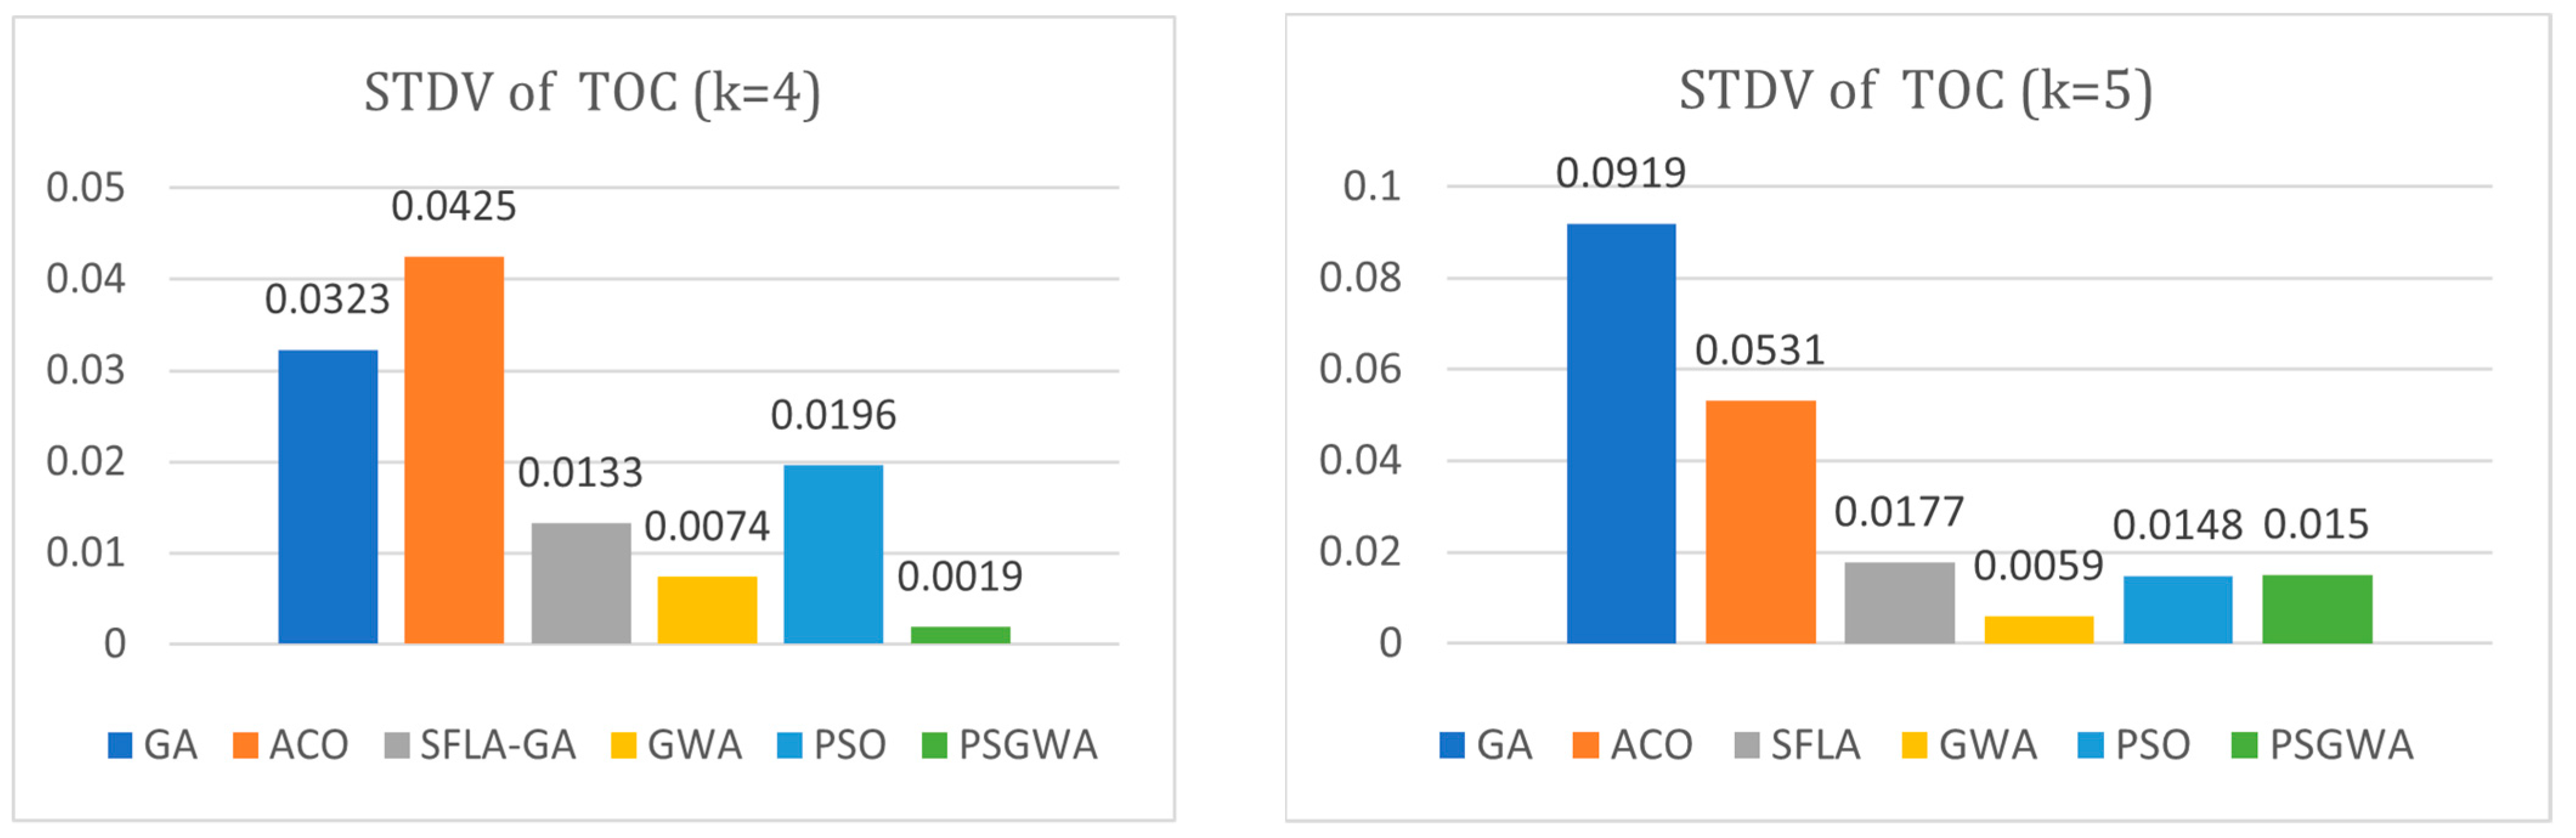
- Stability of the algorithm during different executions for a same data object.
Results
5. Conclusions and Future Work
Author Contributions
Funding
Institutional Review Board Statement
Informed Consent Statement
Data Availability Statement
Acknowledgments
Conflicts of Interest
Abbreviations
| Genetic Algorithm | GA |
| Particle Swarm Optimization | PSO |
| Ant Colony Optimization Algorithm | ACO |
| Gray Wolf Optimization Algorithm | GWO or GWA |
| Shuffle Frog Leaping Algorithm | SFLA |
| Particle Swarm based Gray Wolf Optimization Algorithm | PSGWA |
| Total data access operations (read and write) cost | TOC |
| Standard Deviation | STDV |
| Frog Leaping Algorithm | FLA |
| Local Best Individual | Pbest |
| Global Best Individual | Gbest |
| Velocity of Individuali | Vi |
| Position of Individuali | Xi |
References
- Qiu, L.; Padmanabhan, V.N.; Voelker, G.M. On the placement of Web server replicas. In Proceedings of the Twentieth Annual Joint Conference of the IEEE Computer and Communications Society, Anchorage, AK, USA, 22–26 April 2001; Volume 3, pp. 1587–1596. [Google Scholar] [CrossRef]
- Li, B.; Golin, M.J.; Italiano, G.F.; Deng, X.; Sohraby, K. On the optimal placement of web proxies in the Internet. In Proceedings of the Eighteenth Annual Joint Conference of the IEEE Computer and Communications Societies, New York, NY, USA, 21–25 March 1999; Volume 3, pp. 1282–1290. [Google Scholar] [CrossRef]
- Szymaniak, M.; Pierre, G.; Van Steen, M. Latency-driven replica placement. In Proceedings of the 2005 Symposium on Applications and the Internet, Trento, Italy, 4 February 2005; pp. 399–405. [Google Scholar]
- Ng, T.S.E.; Zhang, H. Predicting Internet network distance with coordinates-based approaches. In Proceedings of the Proceedings.Twenty-First Annual Joint Conference of the IEEE Computer and Communications Societies, New York, NY, USA, 23–27 June 2002; Volume 1, pp. 170–179. [Google Scholar] [CrossRef]
- Li, C.; Liu, J.; Lu, B.; Luo, Y. Cost-aware automatic scaling and workload-aware replica management for edge-cloud environment. J. Netw. Comput. Appl. 2021, 180, 103017. [Google Scholar] [CrossRef]
- Li, C.; Wang, Y.; Tang, H.; Zhang, Y.; Xin, Y.; Luo, Y. Flexible replica placement for enhancing the availability in edge computing environment. Comput. Commun. 2019, 146, 1–14. [Google Scholar] [CrossRef]
- Li, C.; Bai, J.; Chen, Y.; Luo, Y. Resource and replica management strategy for optimizing financial cost and user experience in edge cloud computing system. Inf. Sci. 2020, 516, 33–55. [Google Scholar] [CrossRef]
- Safaee, S.; Haghighat, A.T. Replica placement using genetic algorithm. In Proceedings of the 2012 International Conference on Innovation Management and Technology Research, Malacca, Malaysia, 21–22 May 2012; pp. 507–512. [Google Scholar] [CrossRef]
- Abawajy, J.H.; Deris, M.M. Data Replication Approach with Consistency Guarantee for Data Grid. IEEE Trans. Comput. 2014, 63, 2975–2987. [Google Scholar] [CrossRef]
- Rambabu, D.; Govardhan, A. Optimization assisted frequent pattern mining for data replication in cloud: Combining sealion and grey wolf algorithm. Adv. Eng. Softw. 2023, 176, 103401. [Google Scholar] [CrossRef]
- Shao, Y.; Li, C.; Fu, Z.; Jia, L.; Luo, Y. Cost-effective replication management and scheduling in edge computing. J. Netw. Comput. Appl. 2019, 129, 46–61. [Google Scholar] [CrossRef]
- Fu, C.; Zhou, Y.; Han, J. A hardware-efficient dual-source data replication and local broadcast mechanism in distributed shared caches. Microelectron. J. 2021, 118, 105286. [Google Scholar] [CrossRef]
- Subramanyam, G.; Lokesh, G.; Kumari, B.J. A Priori Data Replica Placement Strategy in Grid Computing. Int. J. Sci. Eng. Res. 2013, 4, 1070–1076. [Google Scholar]
- Shamsa, Z.; Dehghan, M. Placement of replicas in distributed systems using particle swarm optimization algorithm and its fuzzy generalization. In Proceedings of the 13th Iranian Conference on Fuzzy Systems (IFSC), Qazvin, Iran, 27–29 August 2013; pp. 1–6. [Google Scholar] [CrossRef]
- Kolisch, R.; Dahlmann, A. The dynamic replica placement problem with service levels in content delivery networks: A model and a simulated annealing heuristic. OR Spectr. 2015, 37, 217–242. [Google Scholar] [CrossRef]
- Tu, M.; Yen, I.L. Distributed replica placement algorithms for correlated data. J. Supercomput. 2014, 68, 245–273. [Google Scholar] [CrossRef]
- Mirjalili, S.; Mirjalili, S.M.; Lewis, A. Grey Wolf Optimizer. Adv. Eng. Softw. 2014, 69, 46–61. [Google Scholar] [CrossRef]
- Gad, A.G. Particle Swarm Optimization Algorithm and Its Applications: A Systematic Review. Arch. Comput. Methods Eng. 2022, 29, 2531–2561. [Google Scholar] [CrossRef]
- Jalali, M.; Bouyer, A.; Arasteh, B.; Moloudi, M. The effect of cloud computing technology in personalization and education improvements and its challenges. Procedia Soc. Behav. Sci. 2013, 83, 655–658. [Google Scholar] [CrossRef]
- Keshtgar, A.; Arasteh, B. Enhancing Software Reliability against Soft-Error using Minimum Redundancy on Critical Data. Int. J. Comput. Netw. Inf. Secur. 2017, 5, 21–30. [Google Scholar] [CrossRef]
- Zadahmad, M.; Arasteh, B.; YousefzadehFard, P. A Pattern-Oriented And Web-Based Architecture To Support Mobile Learning Software Development. Procedia Soc. Behav. Sci. 2011, 28, 194–199. [Google Scholar] [CrossRef]
- Bouyer, A.; Arasteh, B.; Movaghar, A. A New Hybrid Model Using Case-Based Reasoning and Decision Tree Methods for Improving Speedup and Accuracy. In Proceedings of the IADIS International Conference of Applied Computing, Salamanca, Spain, 18–20 February 2007. [Google Scholar]
- Arasteh, B.; Sadegi, R.; Arasteh, K. Bolen: Software module clustering method using the combination of shuffled frog leaping and genetic algorithm. Data Technol. Appl. 2021, 55, 251–279. [Google Scholar] [CrossRef]
- Arasteh, B.; Razieh, S.; Keyvan, A. ARAZ: A software modules clustering method using the combination of particle swarm optimization and genetic algorithms. Intell. Decis. Technol. 2020, 14, 449–462. [Google Scholar] [CrossRef]
- Arasteh, B.; Miremadi, S.G.; Rahmani, A.M. Developing Inherently Resilient Software Against Soft-Errors Based on Algorithm Level Inherent Features. J. Electron. Test. 2014, 30, 193–212. [Google Scholar] [CrossRef]
- Arasteh, B.; Fatolahzadeh, A.; Kiani, F. Savalan: Multi objective and homogeneous method for software modules clustering. J. Softw. Evol. 2022, 34, e2408. [Google Scholar] [CrossRef]
- Ghaemi, A.; Arasteh, B. SFLA-based heuristic method to generate software structural test data. J. Softw. Evol. Proc. 2020, 32, e2228. [Google Scholar] [CrossRef]
- Kennedy, J.; Eberhart, R. Particle swarm optimization. In Proceedings of the ICNN’95—International Conference on Neural Networks, Perth, WA, Australia, 27 November–1 December 1995; Volume 4, pp. 1942–1948. [Google Scholar] [CrossRef]


| Technique | Merits | Demerits | |
|---|---|---|---|
| Flexible Replica Placement [6] | Lower response time, higher data availability. | Data-file types and node types have not been considered. | |
| Experience-based Replica Placement [7] | Lower financial cost, lower storage cost and higher performance in large distributed systems. | collaborative resource management has not been considered. | |
| Replica placement using GA [8] | Lower run time and optimal placement. | Lower performance in large distributed systems. | |
| Consistency-based Replica Placement [9] | Higher data availability and lower response time. | Suitable just for the network that is fixed during the execution of the technique. | |
| Constraint-based Replica Placement [10] | Lower response time and memory consumption. | Need more internet bandwidth | |
| Workflow-based data replication method [11] | Lower data access costs under the deadline constraint. | Data and computational scheduler was not considered uniformly. | |
| Priority-based replica management [13] | Lower average response time and fault tolerance capability. | Suitable just for static systems. | |
| PSO and fuzzy-based replica-placement algorithm [14] | Higher data availability and lower response time. | Lower performance for the data writes transaction. | |
| Replica placement with service and content delivery networks [15] | Higher stability. | Local optimum probability. | |
| Correlated data-replicas placement [16] | Lower response time. | Lower performance for the data writes transaction. | |
| Algorithms | Parameters | Value |
|---|---|---|
| Genetic Algorithm (GA) | Number of chromosomes | 250 |
| Length of chromosome | 28 * k | |
| Number of iterations | 100 | |
| Cross-mutate rate | 0.7 | |
| Mutation rate | 0.05 | |
| Ant Colony Optimization (ACO) | Number of ants | 150 |
| Initial pheromone (τ) | 1 | |
| Q parameter | 1 | |
| Pheromone power weight (α) | 1 | |
| Number of iterations | 100 | |
| Evaporation rate (ρ) | 0.05 | |
| Shuffle Frog Leaping Algorithm (SFLA) | Memeplex Size | 12 |
| Number of Memeplexes | 8 | |
| Memplex size | 6 | |
| FLA iterations (Beta) | 7 | |
| Number of iterations | 100 | |
| Gray Wolf Optimizer (GWO) | Population size | 40 |
| a | Values between [0, 2] (using Equation (1)) | |
| C | Variable (using Equation (3)) | |
| A | Variable (using Equation (2)) | |
| r1, r2 | Random values between [0–1] | |
| Particle-based Gray Wolf Algorithm (PSGWA) | Population size | 30 |
| Particle.W | 0.8 | |
| Particle.C1 and Particle.C2 | 1.8 | |
| a | values between [0, 2] (using Equation (1)) | |
| C | Variable (using Equation (3)) | |
| A | Variable (using Equation (2)) | |
| r1, r2 | Random values between [0–1] | |
| Number of Subgroups | 3 | |
| Size of Subgroups | 10 | |
| Local Iteration | 30 |
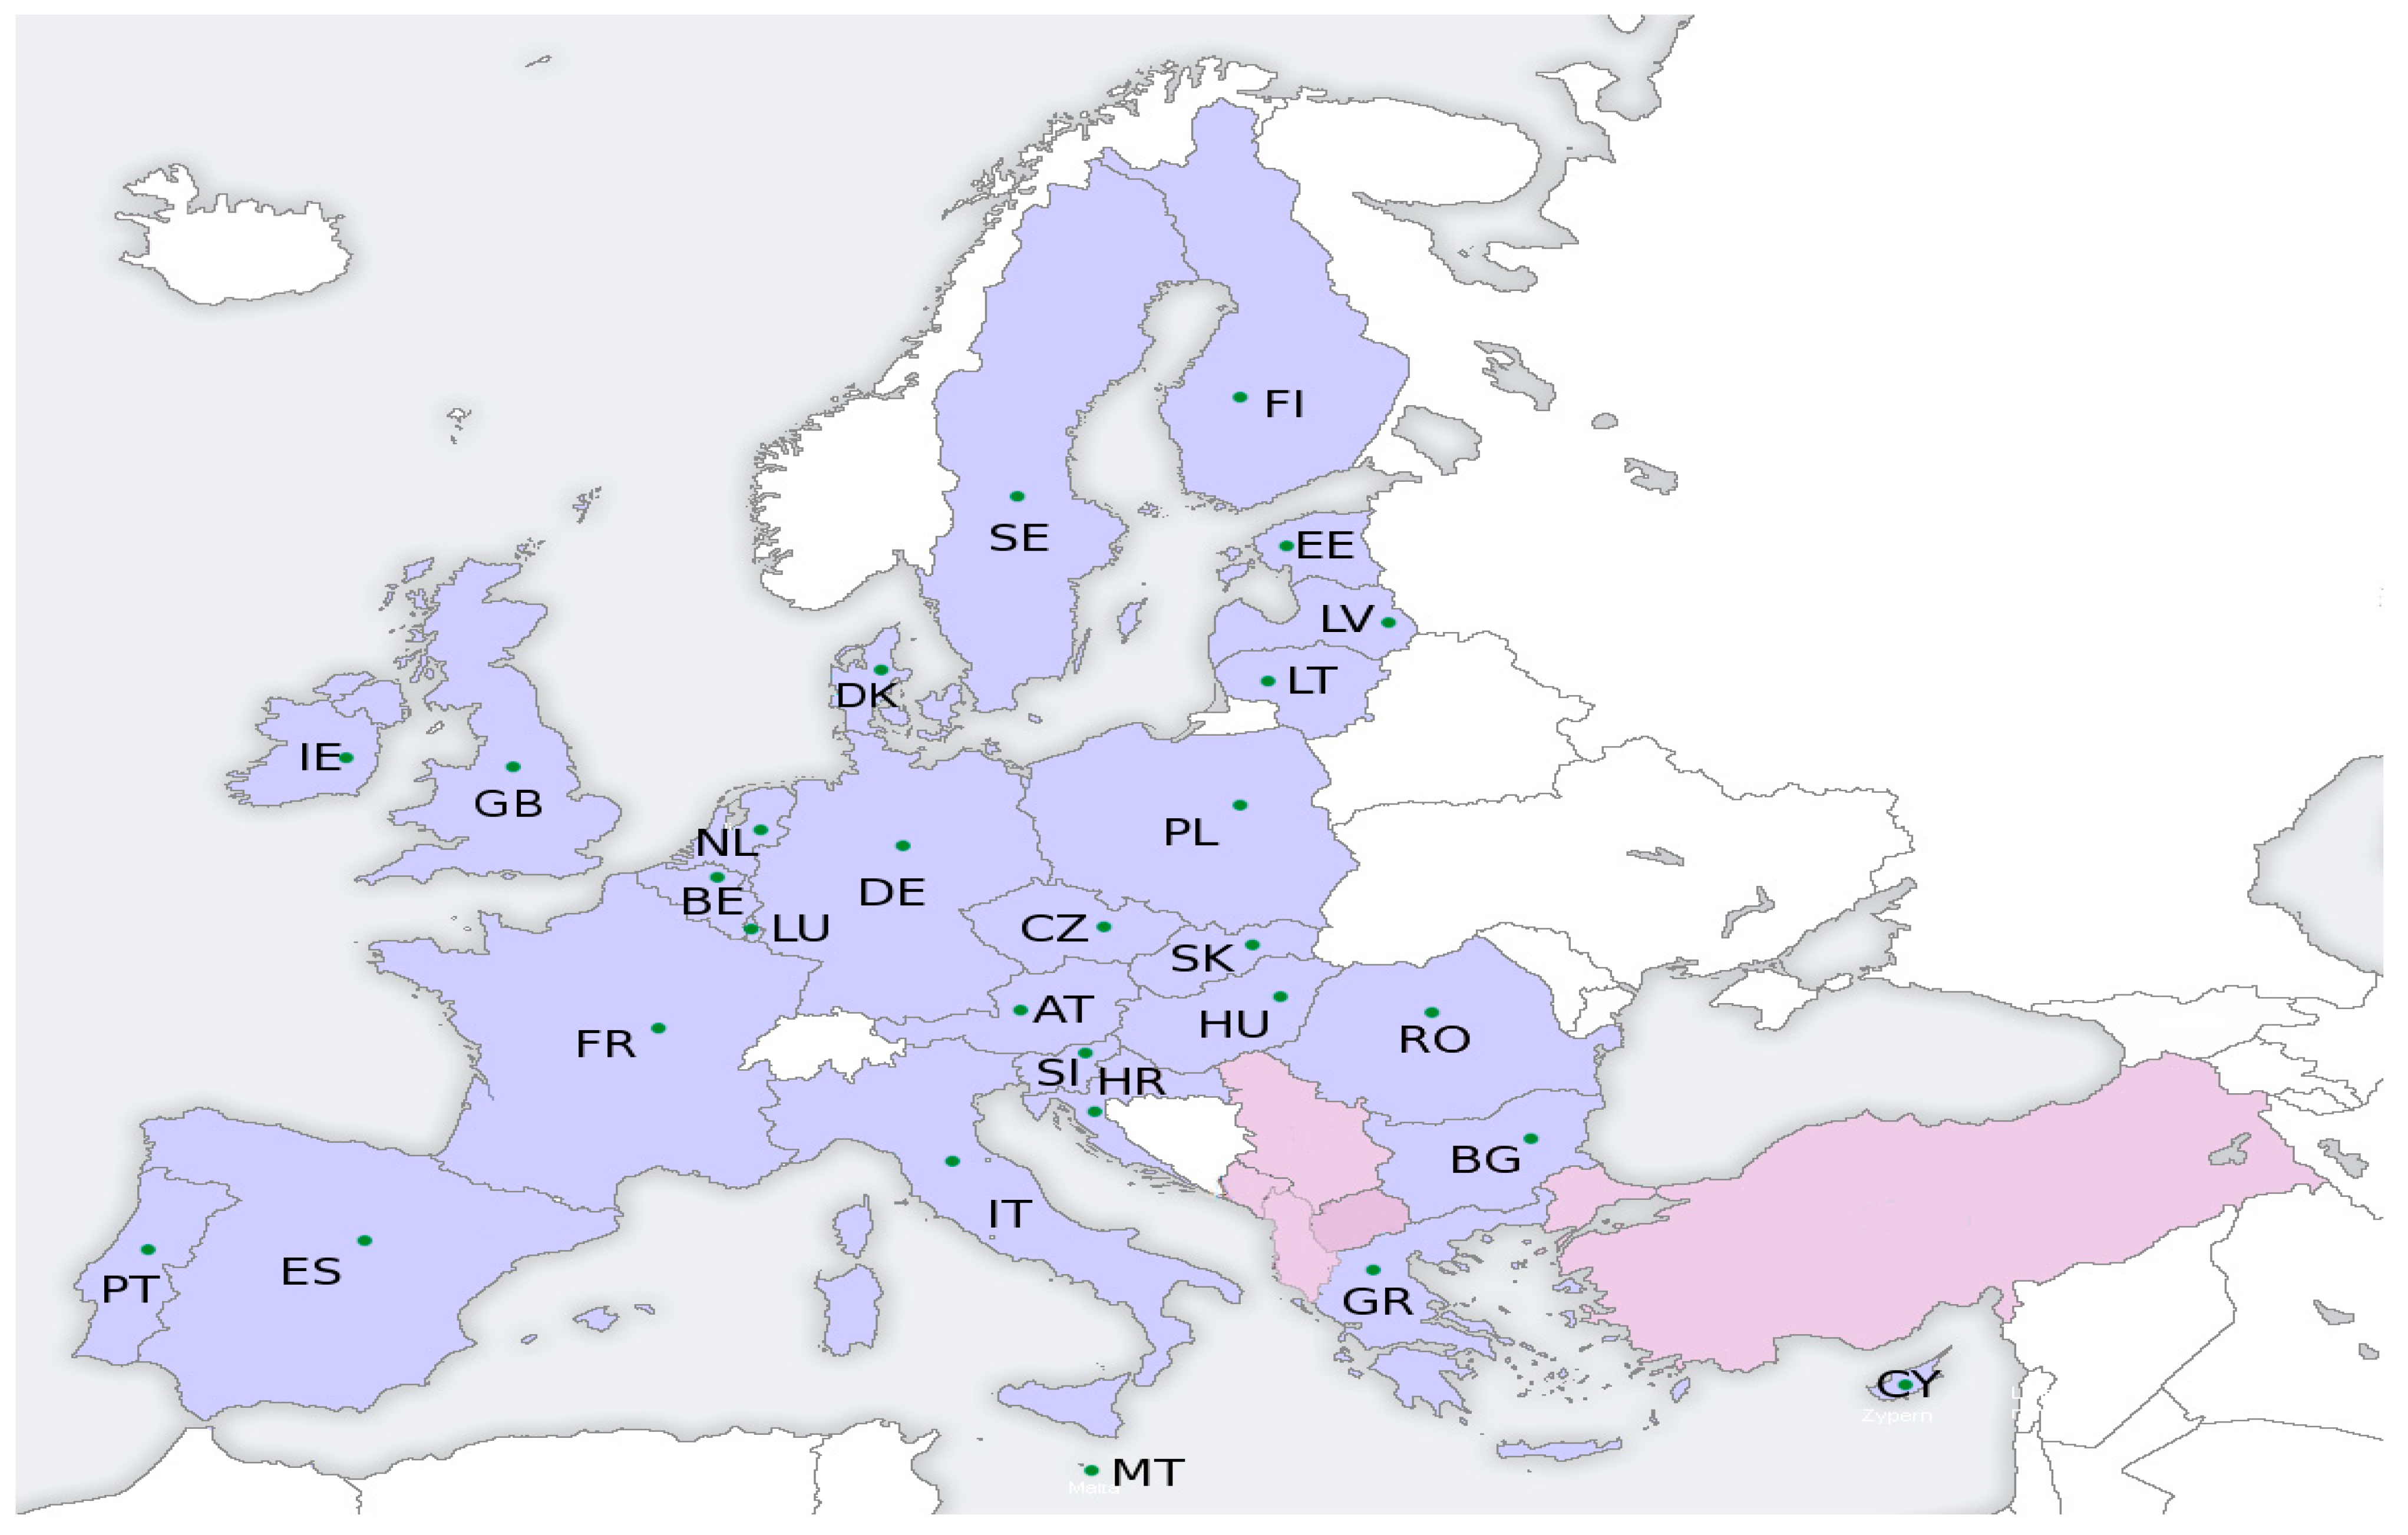
| Server Num. | Server Name | Country | Capacity of Server in Gigabytes |
|---|---|---|---|
| 1 | ‘FI’ | Finland | 10,021 |
| 2 | ‘SE’ | Sweden | 21,451 |
| 3 | ‘EE’ | Estonia | 21,110 |
| 4 | ‘LV’ | Lithonia | 30,000 |
| 5 | ‘LT’ | Lithuania | 32,002 |
| 6 | ‘DK’ | Denmark | 34,555 |
| 7 | ‘PL’ | Poland | 46,111 |
| 8 | ‘CZ’ | Czech | 48,121 |
| 9 | ‘SK’ | Slovakia | 42,121 |
| 10 | ‘HU’ | Hungary | 10,001 |
| 11 | ‘AT’ | Austria | 10,021 |
| 12 | ‘RO’ | Romania | 21451 |
| 13 | ‘IT’ | Italy | 21,110 |
| 14 | ‘SL’ | Slovenia | 30,000 |
| 15 | ‘BG’ | Bulgaria | 32,002 |
| 16 | ‘GR’ | Greece | 34,555 |
| 17 | ‘CY’ | Cyprus | 46,111 |
| 18 | ‘MT’ | Malta | 48,121 |
| 19 | ‘PT’ | Portugal | 42,121 |
| 20 | ‘ES’ | Spain | 10,001 |
| 21 | ‘FR’ | France | 34,555 |
| 22 | ‘DE’ | Germany | 46,111 |
| 23 | ‘LU’ | Luxembourg | 48,121 |
| 24 | ‘BE’ | Belgium | 42,121 |
| 25 | ‘NL’ | Netherlands | 10,001 |
| 26 | ‘GB’ | Great Britain | 34,555 |
| 27 | ‘IE’ | Ireland | 46,111 |
| 28 | ‘HR’ | Croatia | 48,121 |
| Data Object | K1 | K2 | K3 | K4 | K5 |
|---|---|---|---|---|---|
| Volume in Gigabytes | 0.1 | 0.15 | 0.16 | 0.18 | 0.2 |
| Primary Hosted Server | Server 5 (Lithuania) | Server 17 (Cyprus) | Server 9 (Slovakia) | Server 22 (Germany) | Server 11 (Austria) |
| Request Number | Read Request Array 28 × 5 | Write Request Array 28 × 5 |
|---|---|---|
| 1 | 5, 3, 3, 0, 1 | 1, 1, 0, 2, 1 |
| 2 | 0, 4, 1, 1, 1 | 0, 5, 2, 0, 2 |
| 3 | 1, 2, 7, 6, 0 | 1, 1, 1, 0, 0 |
| 4 | 4, 3, 8, 0, 6 | 0, 1, 0, 1, 0 |
| 5 | 0, 6, 11, 2, 1 | 0, 2, 0, 1, 0 |
| 6 | 9, 0, 4, 0, 9; | 0, 0, 0, 0, 0 |
| 7 | 3, 5, 2 1, 10 | 0, 0, 0, 0, 0 |
| 8 | 1, 4, 2, 0, 1 | 0, 0, 1, 0, 0 |
| 9 | 3, 5, 0, 8, 0 | 0, 0, 0, 1, 0 |
| 10 | 2, 3, 2, 4, 5 | 0, 1, 1, 0, 1 |
| 11 | 2, 1, 1, 8, 0 | 0, 0, 0, 1, 0 |
| 12 | 2, 0, 7, 4, 9 | 0, 1, 2, 0, 0 |
| 13 | 1, 1, 2, 4, 0 | 0, 0, 0, 0, 0 |
| 14 | 1, 1, 4, 1, 0 | 1, 2, 1, 0, 0 |
| 15 | 0, 4, 3, 0, 7 | 0, 1, 0, 2, 0 |
| 16 | 1, 1, 2, 2, 1 | 0, 1, 0, 1, 0 |
| 17 | 3, 6, 5, 4, 5 | 0, 0, 0, 0, 2 |
| 18 | 6, 0, 4, 0, 6 | 0, 1, 0, 1, 0 |
| 19 | 0, 4, 2, 3, 0 | 0, 0, 1, 0, 4 |
| 20 | 5, 3, 4, 0, 3 | 0, 1, 2, 4, 0 |
| 21 | 2, 10, 2, 6, 0 | 0, 0, 2, 0, 0 |
| 22 | 5, 4, 4, 0, 2 | 1, 0, 0, 1, 4 |
| 23 | 3, 0, 2, 3, 1 | 0, 0, 1, 0, 0 |
| 24 | 2, 7, 9, 0, 5 | 0, 3, 0, 0, 3 |
| 25 | 1, 4, 3, 3, 5 | 0, 0, 0, 2, 0 |
| 26 | 3, 6, 2, 10, 5 | 1, 0, 0, 1, 1 |
| 27 | 6, 0, 4, 0, 6 | 0, 0, 3, 0, 0 |
| 28 | 0, 4, 4, 3, 0 | 0, 2, 0, 0, 2 |
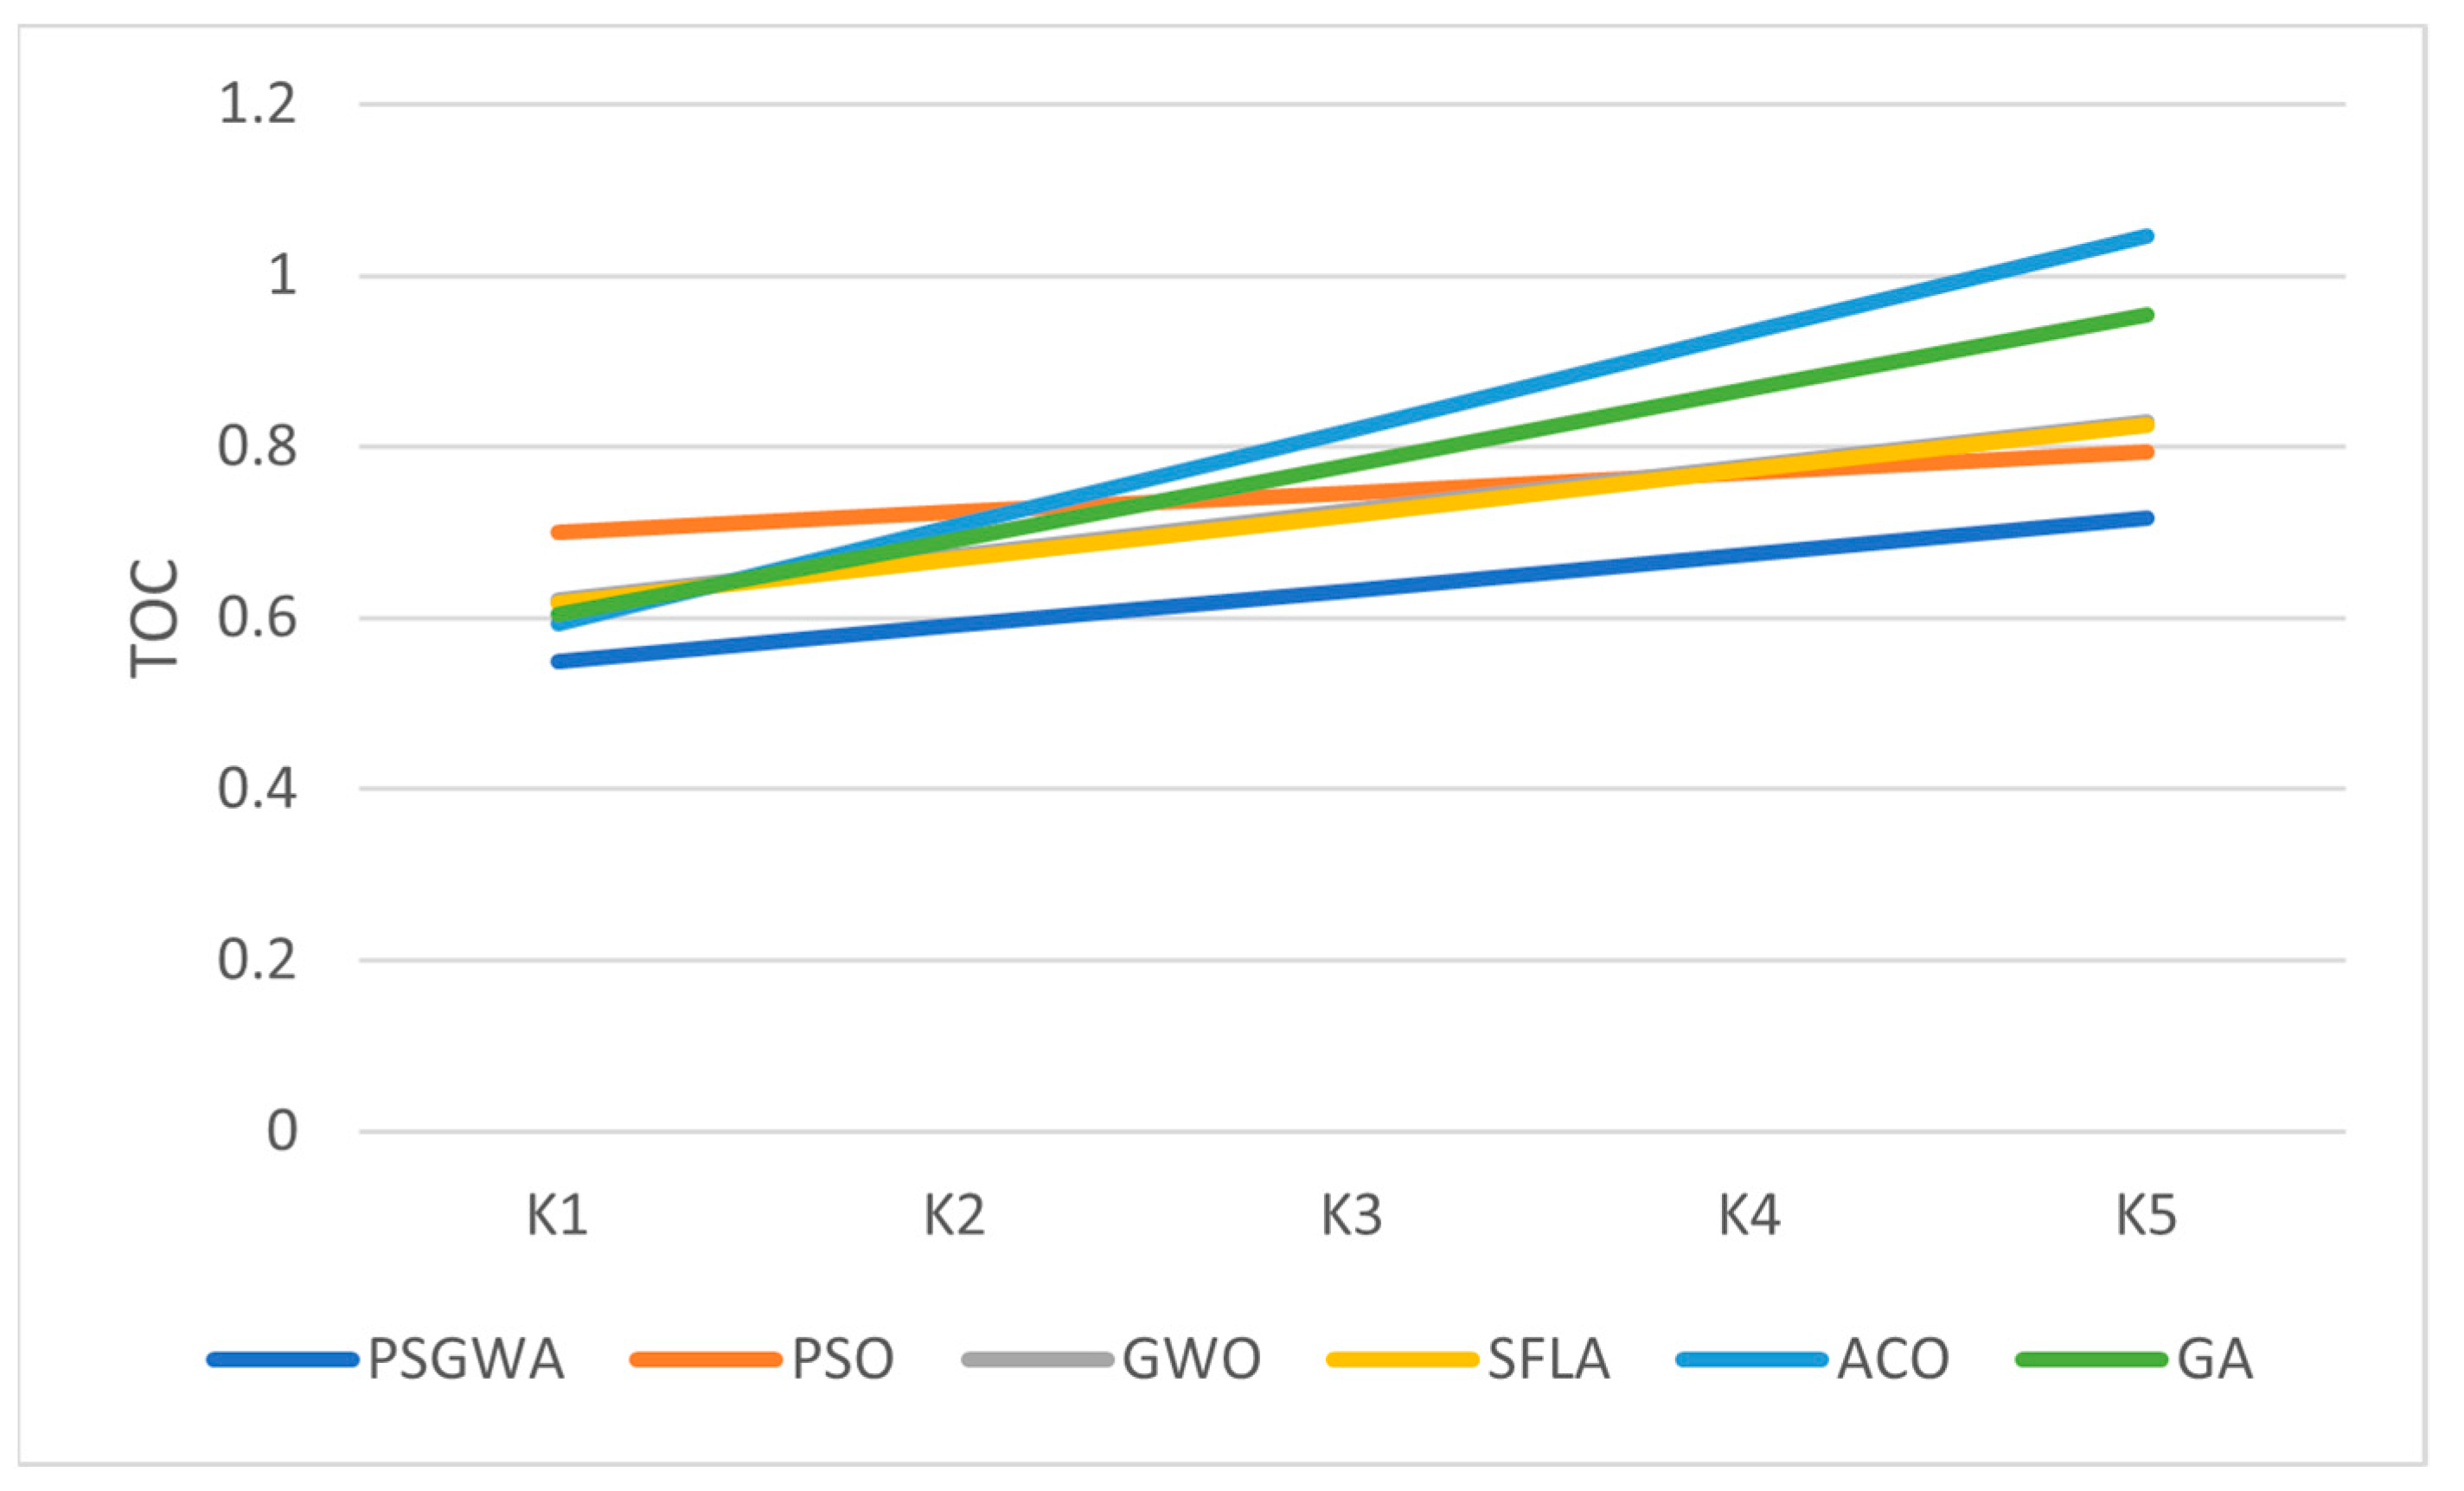
| Algorithm | Slopes of the Trendline |
|---|---|
| PSGWA | 0.04215 |
| PSO | 0.2705 |
| GWO | 0.0518 |
| SFLA | 0.0518 |
| ACO | 0.1132 |
| GA | 0.0877 |
| Configuration | Primary Servers | Volume of Data Objects (GB) |
|---|---|---|
| Configuration 1 | [15, 7, 3, 17, 27] | [0.1, 0.15, 0.16, 0.1, 0.2] |
| Configuration 2 | [1, 28, 11, 5, 3] | [0.7, 0.15, 0.86, 0.9, 0.7] |
| Configuration 3 | [19, 2, 17, 15, 6] | [0.3, 0.25, 0.1, 0.7, 0.25] |
| Configuration 4 | [11, 21, 1, 15, 3] | [0.9, 0.15, 0.3, 0.5, 0.60] |
Disclaimer/Publisher’s Note: The statements, opinions and data contained in all publications are solely those of the individual author(s) and contributor(s) and not of MDPI and/or the editor(s). MDPI and/or the editor(s) disclaim responsibility for any injury to people or property resulting from any ideas, methods, instructions or products referred to in the content. |
© 2023 by the authors. Licensee MDPI, Basel, Switzerland. This article is an open access article distributed under the terms and conditions of the Creative Commons Attribution (CC BY) license (https://creativecommons.org/licenses/by/4.0/).
Share and Cite
Arasteh, B.; Sefati, S.S.; Halunga, S.; Fratu, O.; Allahviranloo, T. A Hybrid Heuristic Algorithm Using Artificial Agents for Data Replication Problem in Distributed Systems. Symmetry 2023, 15, 487. https://doi.org/10.3390/sym15020487
Arasteh B, Sefati SS, Halunga S, Fratu O, Allahviranloo T. A Hybrid Heuristic Algorithm Using Artificial Agents for Data Replication Problem in Distributed Systems. Symmetry. 2023; 15(2):487. https://doi.org/10.3390/sym15020487
Chicago/Turabian StyleArasteh, Bahman, Seyed Salar Sefati, Simona Halunga, Octavian Fratu, and Tofigh Allahviranloo. 2023. "A Hybrid Heuristic Algorithm Using Artificial Agents for Data Replication Problem in Distributed Systems" Symmetry 15, no. 2: 487. https://doi.org/10.3390/sym15020487
APA StyleArasteh, B., Sefati, S. S., Halunga, S., Fratu, O., & Allahviranloo, T. (2023). A Hybrid Heuristic Algorithm Using Artificial Agents for Data Replication Problem in Distributed Systems. Symmetry, 15(2), 487. https://doi.org/10.3390/sym15020487