1. Introduction
Ratios represent a single-value metric but consist of two component parts: a numerator variable and a denominator variable. Strictly speaking, a ratio is defined as: “the quantitative relation between two amounts showing the number of times one value contains or is contained by another”. When we discuss symmetry in sport science, we are generally comparing values of some metric between left and right sides or between agonist and antagonist muscles. The typical practice is to express the comparison as a ratio (differences are also a way of standardizing under different assumptions), such as the injured limb having only 60% of the strength of the uninjured limb. Conceptually though, we are using the ratio as one way to standardize the value of one variable with respect to another.
In both applied practice and research in sport science, ratios are more common than many realise. Where strength is concerned, typical examples include standardizing data to the contralateral limb or to the antagonist muscle (i.e., hamstring to quadriceps strength ratio—H:Q). Other ratio measures are often obtained from commonly used performance tests, including the reactive strength index (RSI) calculated from the drop jump or the RSI Modified (RSI-Mod) from a countermovement jump (CMJ). In addition, ratios have emerged more recently in sport science that blend two different strength capacities, such as the dynamic strength index (DSI) that normalises the peak force obtained from an isometric strength test (e.g., mid-thigh pull) with the peak force measured during a ballistic jump (e.g., CMJ). Even common mathematical constructs arising from calculus-like derivatives (the rate of change of a variable such as the rate of force development) and integrals (the area under a curve such as impulse) can be seen as coupled outcomes arising from two independent measures (force and time). However, the relevance of an example-like impulse is that it is the key determinant of the vertical jump height by virtue of Newton’s laws of motion.
For context,
Table 1 provides some examples of ratio data that are often used in practice and research, with their associated method of calculation. Despite their common use, the interpretation of ratio standardisation, whether for symmetry or other reasons, often provides challenges, some of which are not always obvious to practitioners. Typically, when monitoring a change in ratios, if an intervention affects both the numerator and denominator, there will likely be challenges in interpreting the ratio appropriately. Therefore, the aim of this editorial is to use some examples to highlight when using this form of standardisation may be helpful, and when using it can lead to misinterpretations.
2. Multiplying Errors
Every test has some level of error due to the equipment, the testing methods, warm-up protocols, and the variability arising from the participants themselves [
7,
8]. When we combine two variables, we may sometimes compound the error if these measures are not closely correlated. This can negatively impact the reliability (and therefore usability) of the data. For example, Bishop et al. [
3] showed two measures of test–retest reliability (intraclass correlation coefficient [ICC] and coefficient of variation [CV]) for the unilateral DSI, which were notably worse than the reliability measures of both the numerator and denominator independently (
Table 2). This will likely pose a challenge for sport scientists wanting to track changes over time for decision-making purposes.
3. So, When Should We Standardise an Outcome?
While this editorial focuses on indexes and ratios of between-limb symmetry, a relatable example for the sport sciences on interpreting the effects of training on a ratio variable is shown in
Table 3. These data provide results from a hypothetical monitoring scenario, including the jump height, ground contact time (GCT), and the calculated RSI from these two measures. The RSI scores improve each week but the underlying reason for the improvement is sometimes due to the numerator (jump height) changing and sometimes due to the denominator (GCT) changing. For example, in week two, an increase in the jump height drives the increase in the RSI, but in week three, the improvements in the RSI are now attributable to a shorter GCT. Finally, in week four, there is a concurrent improvement in both the component parts (i.e., jump height increases and GCT decreases), which causes the largest improvement in the RSI.
The most important point is that practitioners might miss important training-related information if they were only tracking the ratio metric (RSI) without its component parts. First, because an increased jump height alone or a shorter GCT alone might be important for sport performance in some contexts, we may design training to affect only one of these depending on an athlete’s given strengths and weaknesses. In this instance, it would be prudent to follow the independent component parts over time rather than the ratio to ensure the desired adaptation occurs. Second, athletes can improve their RSI score by the same amount through being faster off the ground or jumping higher. Similarly, athletes might have a constant RSI if their jump height were to improve, but the GCT worsened by the same proportional amount. Thus, examining only the ratio is likely to miss important clinical- or training-related information.
With this in mind, we need to think carefully about when to use a ratio. Standardisation should be used when it directly answers the question being asked or provides some additional value that would help intervene and train an athlete beyond tracking the component parts themselves. To develop our RSI example further, consider a volleyball player that has a short GCT (e.g., 150 ms) but is not able to jump above the net. Clearly, we must increase the jump height for them to be effective at spiking or blocking. In this context, our intervention might be to have the athlete use a longer GCT so they can increase their net impulse and, therefore, jump height. Similarly, consider a volleyball player with a longer GCT (e.g., 600 ms) that jumps one metre above the net. For maximising the performance in volleyball, we might want to prioritise an intervention that encourages them to reduce their contraction time so that they are able to take spiking or blocking positions sooner, even if this results in a lower jump height, so they reach the requisite height to spike or block the shot. In both these contexts, the RSI does not address the performance-related training question.
Let us take one final example when standardisation could lead practitioners awry. Desirable ratios have been suggested for the H:Q ratio with respect to its relationship to a subsequent injury after an anterior cruciate ligament (ACL) reconstruction [
9,
10] given that the hamstring muscle group has been positioned as an ACL agonist that counteracts the anterior shear forces acting on the tibia. However, an ACL injury is known to impair the quadriceps strength and RFD capacity of both limbs (through decreased voluntary activation or other mechanisms), with the quadriceps strength also shown to predict a subsequent ACL reinjury [
11,
12]. A practitioner who is inclined to track only the H:Q data as the hallmark of a neuromuscular recovery may mistake the weakness of the quadriceps muscle for an “optimal H:Q” (i.e., the H:Q increases because the quadriceps strength decreases, not because hamstring strength increases) [
9]. Thus, we cannot think of a context where tracking the H:Q directly answers an important clinical question or provides extra value beyond tracking the individual component parts.
Despite the confusion around the standardisation of metrics such as the RSI or the H:Q, ratios can be meaningful in some contexts. For example, the game injury rate is a ratio of the number of injuries that occur relative to the number of games played. This appears reasonable because if twice the number of games are played, we expect twice the number of steps, plays, collisions, etc., and, therefore, twice the number injuries. As with all ratios, we can change its value by intervening to change the value of either the component part: the numerator (injuries) or the denominator (games). However, in the context of the sport and injury rate, our interventions are designed to affect the number of injuries for each game; we are much less likely to try to reduce the injury rate by changing the number of games played per se. Thus, we can infer changes in the risk of injury (i.e., the number of injuries, which is the numerator) from the ratio (injury rate) without any confusion arising from the other component. Similarly, ratios such as the velocity (the measured distance over time) are appropriate because our interventions are affecting the distance travelled in a set period of time, and our intervention does not affect time itself.
4. Symmetry and Standardisation
We now return to the topic of this Special Issue, symmetry. When an injury occurs, we are assuming that the uninjured muscle or limb is in its pre-injury state or displays an adequate strength and power capacity to meet the demands of the sport. However, if the athlete’s capacity levels are initially poor, then using pre-injury baseline levels may not be an appropriate reference point. It is important to note that the decreased frequency of training arising from an injury has the potential to impair the strength of the uninjured limb as well. Using post-injury symmetry ratios on their own as the benchmark of recovery increases our chances of a false positive indication that the athlete is ready to return to training or competition [
13]. This scenario describes why practitioners and clinicians should be extremely prudent when using either symmetry indices or strength ratios. If an injury can cause impairments to both limbs or muscles groups (i.e., both component parts are of causal interest), then we recommend tracking each component separately to avoid this false positive indication of neuromuscular recovery.
In practice, it may seem obvious that increasing symmetry is not the end goal in itself. To prevent a second injury, most clinicians would opt to increase the strength of the injured limb rather than weaken the strength of the uninjured limb. However, it is easy to imagine that a practitioner relying solely on ratios and not the component parts might mistake improved symmetry (that occurs because of a weakening of the uninjured limb) as beneficial. We believe practitioners can mitigate this risk by applying a simple concept from the emerging domain of ‘causal inference’ that aims to quantify causation in complex systems such as a sport injury or sport performance. A causal map links the possibility for effects and mediators between variables. In the case of an injury, we propose that there exists a plausible causal relationship between the injury and the strength capacity of both limbs [
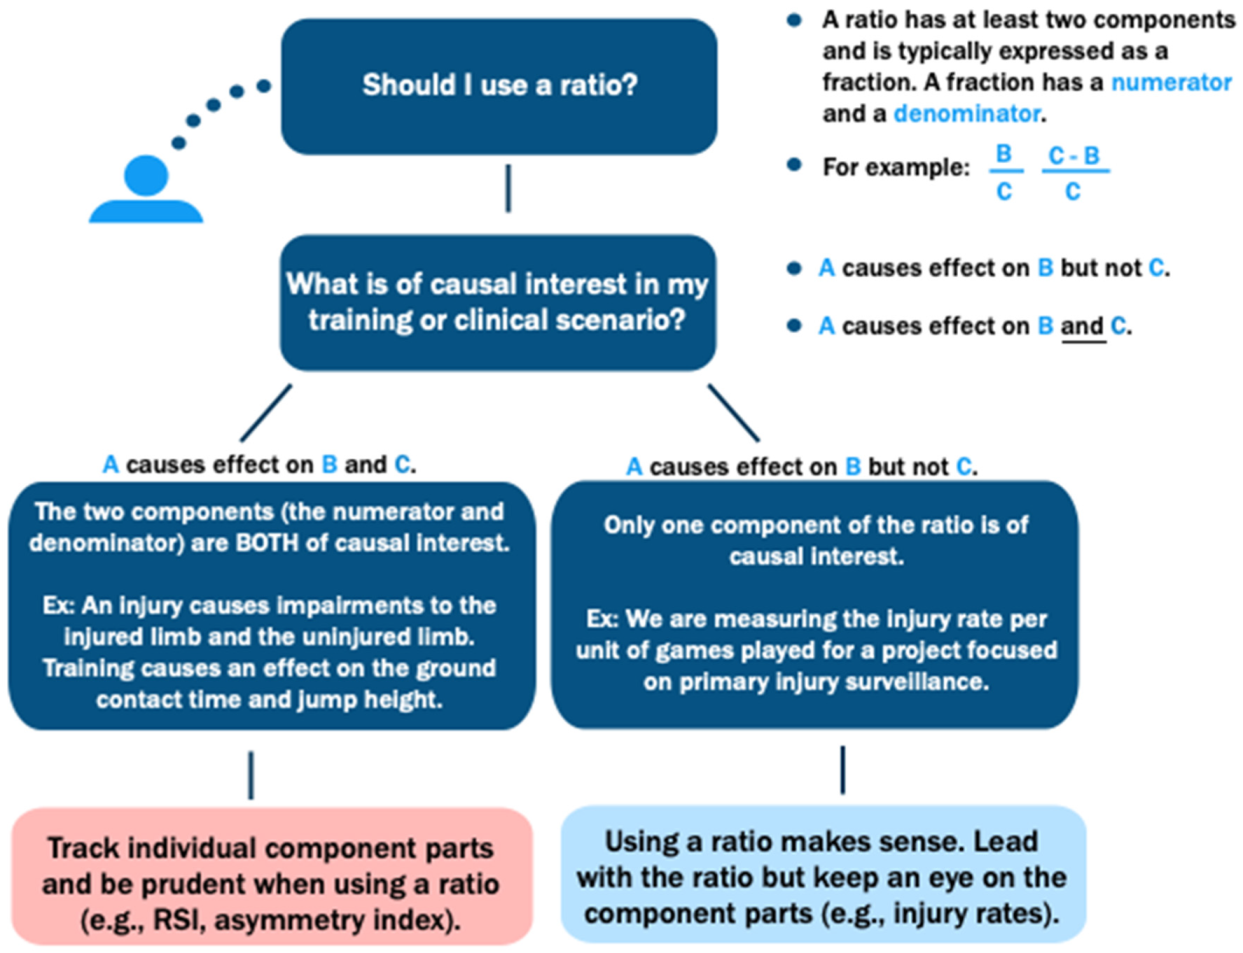
14]. If this exists, we recommend focusing on the component parts rather than the ratio per se. Conversely, in the case of examining the relationship between the games played and the number of sporting injuries, the variable with causal interest is the injury not the games played. Therefore, in this case, a ratio would likely be acceptable to use. We summarise these concepts in
Figure 1 and provide a decision-making tree for practitioners on when to use a ratio.
While we have limited our discussion to the symmetry defined by a ratio standardisation, we want to remind the reader that similar problems arise when expressing symmetry using absolute differences instead of ratios. This often occurs when the numerator and denominator have the same units. If the uninjured quadriceps produces 100 N and the injured quadriceps produces 70 N, we can say that the symmetry is a ratio of 70% or a difference of 30 N. In both cases, having only the summary measurement (ratio or difference) does not allow us to know whether any underlying changes are due to the strengthening of the injured limb or the weakening of the uninjured limb.
5. Conclusions
In summary, this article includes several examples to highlight some of the limitations that practitioners may face when interpreting standardised or ratio data. Furthermore, given the additional noise that may accompany ratios in some contexts (because of the multiple sources that make it up), practitioners are advised to also monitor each component part. Doing this will often help to contextualise the data we collect as part of the ongoing monitoring process, providing a better chance of being able to use the data as part of day-to-day decision-making. Specifically, practitioners are advised to first determine that each component part of any given ratio has an acceptable reliability, as even one ‘noisy metric’ will contribute to heightened noise when combined with another, to create the ratio. Finally, and perhaps most importantly, practitioners are advised to consider whether standardisation adds any additional value to the data interpretation or whether the interpretation of the component parts alone provides the necessary information to inform decision-making.


