1. Introduction
Although the anatomical definition of the intervertebral foramen is unambiguous, and the stenosis of its lumen is important from the point of view of diagnosis and treatment of back pain syndromes, only a limited number of studies are available on their morphometry [
1,
2,
3,
4,
5].
According to the definition, an intervertebral foramen is the space limited by the bases of the adjacent vertebrae in the upper and lower pole, the posterior edge of the vertebral body along the epiphysis and the corresponding fragment of the intervertebral disc in the anterior pole, and in the posterior part, the edge is a complex of the intervertebral joint [
6].
The knowledge in the field of intervertebral foramina morphometry is important due to practical clinical applications, both diagnostic and therapeutic. The diagnostic application of the assessment of the intervertebral foramen is used in diseases causing pressure on the neurovascular structures inside the foramen [
7,
8,
9]. Due to the lack of normative values, changes in the dimensions of the intervertebral foramen are defined in an indirect and descriptive manner. The most frequently used method of classification of lesions within the spinal canal was proposed by [
10]. This method is based on magnetic resonance imaging, in which it is possible to observe changes in the lumen of the spinal canal in the course of degenerative disease of the spine. The idea behind the above classification is the assessment of the space around the spinal nerve roots and the reduction in or loss of free space around them, resulting in a contact with the structures defining the intervertebral foramen [
10]. A more detailed classification system was proposed recently [
4]. The presented classifications do not represent absolute values and are only an individual analysis of the images obtained in the magnetic resonance imaging.
At this stage, it is worth emphasizing the weaknesses of the technique related to the radiological assessment of the intervertebral foramina. The orientation of the intervertebral foramina in relation to the sagittal plane, in which their morphology is normally assessed in imaging examinations, is variable both individually and depending on the motor segment, not mentioning the variability due to the position change. The modern trend in this area is fusing the different diagnostic tools to acquire the full spectrum of abovementioned modalities. The solution to this problem is the search for the reconstruction of the plane perpendicular to the course of the spinal nerve roots, proposed by [
11].
As mentioned, the morphometry of the intervertebral foramina also has therapeutic applications. The knowledge about the dimensions of the intervertebral foramina is important in the treatment of pain syndromes with the use of percutaneous procedures [
12], transforaminal endoscopy techniques as well as classical surgical treatment to decompress nerve structures [
13,
14].
Considering the diagnostic and clinical significance of the knowledge on the morphometry of the intervertebral foramina presented above, there is surprisingly little research on this issue. In addition, the data presented in the research are far from complete, and their clinical application is currently negligible.
In the available literature, the dimensions characterizing intervertebral foramina are presented in the following studies:
- -
Khalaf et al. [
12]—the surface area, vertical and horizontal dimensions were assessed in the magnetic resonance imaging. Mean morphometrics for all 304 IVFs (intervertebral foramina) in 10 males and 30 females of similar ages were: area 115.3 ± 29.5 mm
2; height 18.0 ± 2.4 mm; and width at mid-disc level 5.6 ± 2.1 mm.
- -
Giles [
15] mostly assessed the mutual relationship of the cross-sectional area ratio of the interpedicular zone of the intervertebral canal to large neural structures or the minimum distance between the large neural structures and the boundary of the interpedicular zone. Only absolute values were evaluated for the horizontal length of the interpedicular zone of the intervertebral canal that ranges from 8.2–12.2 mm.
- -
Fujiwara [
16] performed studies based on computed tomography images; however, the aim was to assess both the baseline parameters and in various functional positions—flexion and rotation. The only morphometric parameter useful from the point of our study is the assessment of the height of the intervertebral foramen in the initial position (
Figure 1).
The limited number of works in the presented scope was the starting point for the search for the assessment of the size of the intervertebral foramina and the analysis of asymmetry within a single motor segment, which so far has not been the subject of any of the previously published studies.
Since asymmetry has not been evaluated, it is not known whether it or the symmetry is the dominant phenotype. In the case of asymmetry, initially subtle, it may be the reason for the development of degenerative scoliosis.
Due to the epidemiology of osteoarthritis of the spine, the lower two motion segments within the lumbar spine were selected for analysis.
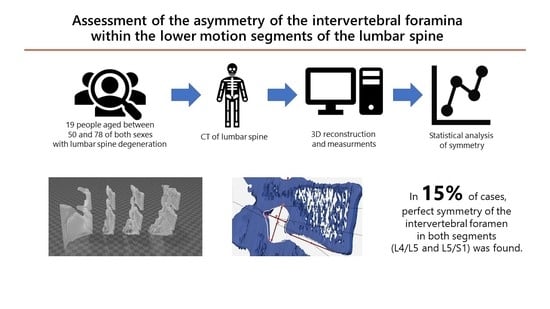
The study aim is to present the scope of potential asymmetry in the intervertebral foramina measurements in the group of people with no spine deformation or asymmetric or neurological findings secondary to the root compression.
2. Materials and Methods
Nineteen patients (six women and thirteen men) of W. Dega University Hospital in Poznan qualified for the study group. These were patients aged 40–78 who had a CT scan of the lumbosacral spine during the diagnosis of pain in the course of degenerative spine disease. Data were collected from the medical documentation from the past 10 years. The measurements were made on computed tomography images. The local pain complaints without root disorders were the basis of imaging diagnostics. In the clinical examination and imaging tests, scoliosis-like deformity and asymmetry of the position and shape of the pelvis were excluded. The patients were not eligible for surgical treatment. Patients whose lesions are not related to degenerative spine disease, e.g., congenital deformities of the spine, neoplastic diseases and post-traumatic lesions, were excluded from the study.
The radiological examinations were subjected to computer transformation with the use of InVesalius, Meshmixer, 3d Builder and GOM in order to obtain a three-dimensional image. In the obtained spatial visualization, the space of the root canal and the measurement planes were defined.
The root canal was defined according to the following process. Due to the fact that the root canals differ in spatial configuration depending on the assessed movement segment, the course of the base delimiting the root canal in its upper pole was assumed as the main element defining the root canal. Then, the cross-section of the root canal was determined, the course of which was consistent with the axis of the base delimiting the opening in the upper pole. The analysis covered only the bone boundaries, therefore all the contours of the soft tissues forming the walls of the root canal were eliminated: the contours of the intervertebral disc and the joint capsule. The circumference of the root canal at the site of the removed intervertebral disc contour was supplemented with a line connecting the lower posterior margin of the superior vertebral body and the upper posterior margin of the inferior vertebra. The image of the root canal obtained in the study is shown in
Figure 2.
The circumference of the root canal, the horizontal dimension and the vertical dimension were marked on the obtained contour of the root canal. The horizontal dimension is the longest segment within the contour, parallel to the lower end plate of the upper vertebra, whose elements limited the intervertebral foramen. The vertical dimension is the longest segment within the contour perpendicular to the end plate, as defined below (
Figure 2)
The obtained data for the L4/L5 motion segment are presented in
Table 1.
The obtained data for the L5/S1 motion segment are presented in
Table 2.
In order to be able to compare the results within the group and on both sides, the results matrix was transformed in the form of autoscaling to obtain commensurability of the variables. The variational scaling method was used in accordance with the formula:
z—Standardized feature value.
xa—Initial value of the variable.
xm—Average value of the variable.
sd—Standard deviation of the variable.
The obtained data matrices were used to evaluate the symmetry of the parameters describing the light of the intervertebral foramina in a graphic form. The traits are sorted by gender and age.
The presented sample does not present a normal distribution in any measurements.
The main tool we used is autoscaling. As a preliminary tool in chemometric analysis, it is a suitable method with multivariate analysis. This allows simultaneous analysis of different measurements, i.e., circumference, maximum horizontal and vertical dimension, to point out cases most symmetrical in all traits (
Figure 3 and
Figure 4). Additionally, there is no reference data in the literature for symmetry. Therefore, estimating sample size for statistical analysis at this stage is pointless, though chemometric analysis endorses even smaller samples than this one.
Additional classical statistical tools used were skewness and chi-square test, to look for any symmetry/asymmetry tendency in side or sex and age. As no significant relevance was obtained, we can skip the statistical analysis in favor of the principal component analysis, similarity or cluster analysis. However, the major parameters evaluated (circumference, maximum horizontal and vertical dimension) certainly may impair signal-to-noise ratio. Additionally, the profile of the group is not accurate for this type of analysis.
In terms of symmetry assessment, the skewness coefficient was assessed to indicate the direction of parameter grouping (left or right). Chi-square analysis was used to assess the relationship of asymmetry with gender.
3. Results
3.1. Motion Segment L4/L5
The distribution of the size of the circumferences in the study group and the difference between the parties is shown in
Figure 5.
The distribution of the maximum horizontal dimension in the study group and the difference between the sides is shown in
Figure 6.
The distribution of the maximum vertical dimension in the study group and the difference between the parties is shown in
Figure 7.
The figures show a graphical analysis of both the distribution of the feature in relation to the mean for the assessed group, with the possibility of comparing the right and left side. For example, the assessed features for the F64 case had higher values on the left side. However, the difference between the perimeters was much greater than the maximum horizontal and vertical dimensions. By contrast, in the case of the F40, the size of the circumference and the maximum vertical dimension were larger on the left side, and both dimensions were below the average for the group. However, the maximum vertical dimension was greater on the right and both sides included the group mean.
3.2. Segment L5/S1
The distribution of the size of the circumferences in the study group and the difference between the parties is shown in
Figure 8.
The distribution of the maximum horizontal dimension in the study group and the difference between the parties is shown in
Figure 9.
The distribution of the maximum vertical dimension in the study group and the difference between the parties is shown in
Figure 10.
The distribution of the examined features for the L5/S1 motion segment indicates that in the dominant part of cases, especially in terms of the circumference values, they were of similar size. For example, in the case of F64, all dimensions on the left side were larger with relatively discrete differences between the sides. In the case of M72 (the second one), despite the lack of significant circumference asymmetry, significant differences in the horizontal and vertical dimensions were observed with the dominance of the feature on opposite sides.
3.3. Assessment of Asymmetry
In order to be able to compare the asymmetry within the assessed motion segments, data transformation was performed. When the differences in the value of the examined feature after the variational scaling between the sides did not exceed 0.5, these features were considered symmetrical. Above this value, the features were classified as asymmetrical, with an indication of the direction of asymmetry between the right (R) and left (L) sides.
Only the transformation of the data allows the asymmetry to be assessed and the results to be compared between different segments. The asymmetry analysis shows that changes in both motion segments are similar in most cases.
The perfect symmetry within both segments was observed in three cases (F50, M62 and M75), which constituted 15% of the study group. Additionally, in one case the ideal symmetry was observed only within the L4/L5 (M45) motion segment, while within the L5/S1 motion segment, the maximum vertical and horizontal dimensions were symmetrical, but the difference in circumference (R > L) was demonstrated.
In the group of people with asymmetry (16 cases), it should be stated that the pattern of asymmetry was very similar in most cases. Identical asymmetries in both motion segments were found in eight cases—52%—F40, F46, F59, M41, M42, M43 (the first one), M72 (the first one) and M78. In the remaining eight cases, the asymmetry between the two motion segments differed in only one parameter.
On the basis of the obtained results, it was shown that an asymmetric distribution dominated in the morphometric evaluation of the intervertebral foramina of the L4/L5 and L5/S1 motion segments. Greater symmetry was found within the L5/S1 motion segment. In addition, within this segment, when asymmetry was found, higher values of the opening circumference and the maximum horizontal dimension were observed on the right side. However, it showed a statistically significant difference only in the case of the circumference of the intervertebral foramina (p < 0.05).
The analysis within the L4/L5 motion segment showed a greater degree of asymmetry without unequivocal skewness of the distribution of features.
At the same time, there was no statistically significant relationship between the asymmetry and sex and age in both motion segments.
4. Discussion
The factors that cause asymmetry in the lumbar spine can be divided into internal and external factors. Internal factors include asymmetry of the intervertebral joints and asymmetry of the disc protrusion. However, there are many more external factors. These include lateral curvature of the spine and asymmetry within the pelvis. The most frequently cited asymmetry within the skeletal system is the lateral curvature of the spine, the size of which up to 10 degrees is considered the norm [
17]. Above this value, the asymmetry is considered a scoliotic deformity. This type of asymmetry most often has a right-sided direction, and the causes are seen in functional laterality, i.e., manualness. The second factor for asymmetry in the spine is the position of the pelvis. This applies to both the asymmetry of the limb length and the asymmetry of the shape of the pelvic rim.
Moreover, apart from the above-mentioned static factors, there are also dynamic factors related mainly to gait disturbances.
Gait disturbances may have many causes, ranging from joint mobility disorders related to functional disorders, such as muscle contractures, to functional disorders in the course of back pain syndromes [
18].
Indication of asymmetry is difficult in the case of continuous variables, in particular in the case of the analysis of the structure of the anatomical structures of the skeletal system without taking into account population norms. Therefore, in our study, we used the data transformation method with their centering, which is used in chemometric analysis as the first stage of data preparation for similarity analysis. Such data transformation allows to obtain proportionality of the analyzed data. The analysis of similarities consists in obtaining a spatial representation of the tested samples, therefore, the commensurability of the data, eliminating both the differences related to the measurement method, parameter units and the variability of parameters within a given group, is the basic premise in the analysis of similarities. Autoscaling, used in the transformation, combines centering and variance scaling.
In the scope of the presented topic—the analysis of the size of the intervertebral foramina—the scientific literature is very limited, as we indicated in the introduction. Even more so, while browsing the literature, we did not come across any works that assessed their symmetry. Thus, the presented material is, in our opinion, the first in this thematic group. This does not allow us to relate our results to literature values. According to our knowledge, the presented technique of measurements is also the only one that is based on computed tomography images. Thus far, the data on the morphometry of the intervertebral foramina have been performed on magnetic resonance images or on histological material. Each of these methods has both advantages and disadvantages. The evaluation of magnetic resonance images does not allow for precise determination of the bone boundaries of their separation from soft tissues. Such a possibility is offered by both the histological technique and with the help of computed tomography. However, the histological technique depends on the execution of the cut plane, which is not a problem in the computed tomography technique, where the plane of the analysis can be freely adjusted to the individual anatomy of the case. The differences in the research technique are most likely the reason for the deviations in the results obtained in our study and in the previously cited works [
12,
15,
16].
It should be emphasized, however, that the discussed problem is more and more often perceived from the perspective of prevention and treatment of changes in the course of the degeneration of the spine. The most advanced stage of multilevel degenerative disease of the spine is degenerative scoliosis leading to asymmetric narrowing of the root canals. Deformation of degenerative scoliosis, unlike idiopathic scoliosis, is characterized by an unpredictable direction of deformation, and surgical treatment is a difficult process with a significant risk also due to the variety of factors affecting the clinical condition both before and after surgery [
19].
Presented results show that as for intervertebral foramina, the asymmetry is the dominant phenotype in the population with back pain with no radicular symptoms. Only in 15% (three cases) of the group the symmetry was confirmed on both levels, with an additional individual where symmetry was observed only in one of the evaluated motion segments. Presented asymmetry has no defined side tendency, which may to some extent be related to the unpredictive morphology of degenerative scoliosis [
20]. Although we know that the primary reason for degenerative scoliosis is desiccation of the intervertebral disc in the majority of the population, it is the symmetrical process, therefore it is postulated that other elements i.e., facet joints and their asymmetrical degeneration, may pay the key role in deformation development [
21]. This was one of the concerns of the presented study, where three elements describing the intervertebral foramina were measured. In that way several markers were taken under consideration to define the symmetry, which increases the sensitivity.
The analysis of the asymmetry of the intervertebral foramina can be a precise prognostic method of the de novo scoliotic deformation risk assessment. Attempts of this type were performed based on clinical evaluation during diagnostics and manual therapy, but the obtained results did not allow to classify the technique as repeatable [
22].
The presented material demonstrates the possibility of a precise assessment of the asymmetry of the intervertebral foramina. However, we were not able to confirm the derangement of symmetry with age. That in turn questions the supposition that primary asymmetry and its magnitude may influence the development of scoliosis. It may be hypothesized that a specific pattern of asymmetry is a prognostic feature to develop scoliosis in the degenerative process of the spine. For that, longitudinal studies with multilevel assessment are essential.
This is definitely not a population study allowing the generalization of the obtained parameters, although results are comparable to published data of Khalaf et al. [
12], Giles [
15] and Fujiwara [
16]. The significant difference between our study and the one mentioned above is the fact that our study was performed on CT three-dimensional reconstructed images, where others used source images. Methods used in our study allow single motion segment processing with a liberty of plane selection for the tightest lumen of the canal. Nevertheless, it has to be kept in mind that it is not the absolute values that matter. For clinical application, in neurological presentation, it is the ratio of the foramina and contents in its structures, as well as the functionality of the nerves. This is why still in grading not absolute values are employed, but descriptive methods [
23].
The concern is still the methodology and source data for this type of analysis. There is a remarkable discrepancy between MRI and CT images. As the MRI images better reconstruct the soft tissue anatomy, it is CT where the mechanics of bone anatomy is evaluated. In our opinion, asymmetry of the intervertebral foramina is more suitable for constructing predictive models for development of degenerative scoliosis rather than the supplementary diagnostic tool for neurological findings. As mentioned above, advanced types of these studies have to be implemented, where not only the morphology of the foramina but also changes within the posterior and anterior column of the spine has to be considered. Further research requires long-term observations, in which asymmetries will be related to the development of scoliotic deformity, the possibility of predicting the direction of deformation and what degree of asymmetry is associated with the occurrence of clinical symptoms, in this case, local pain related to overloading mechanical elements or root symptoms related to pressure on root canal structures, as well as pain observed on the convex side of the degenerative scoliosis which is attributed to distractive overload.


