Abstract
We present the likelihood inferences on the lifetime performance index CL to evaluate the performance of lifetimes of products following the skewed Exponentiated Frech’et distribution in many manufacturing industries. This research is related to the topic of skewed Probability Distributions and Applications across Disciplines. Exponentiated Frech’et distribution is a generalization of some lifetime distributions. The maximum likelihood estimator for CL for lifetimes with exponentiated Frech’et distribution is derived to develop a computational testing procedure so that experimenters can implement it to test whether the lifetime performance reached the pre-assigned level of significance with a given lower specification limit under progressive type I interval censoring. At the end, two examples are provided to demonstrate the implementation on the algorithm for our proposed computational testing procedure.
1. Introduction
In this artificial intelligence era, the constantly changing of technology makes production techniques become sophisticated and complicated. The longer lifetime of products has an economic benefit related to an increase in the overall competitiveness of companies via the increase of the value added to products (see Montalvo et al. [1]). There are many process capability indices are developed (see Montgomery [2]) to control the quality of products with unilateral specifications or bilateral specifications. The lifetime performance index CL we used is an index with unilateral specification and the larger lifetime will result in a larger index. In this research, we make use of this index to assess the lifetime performance for products with exponentiated Frech’et distribution lifetime. For other kinds of lifetime distributions, Tong et al. [3] proposed a testing algorithm for exponential distribution lifetime based on a complete sample.
For some reasons including the limitation of time, shortage of material resources, some restrictions on the cost or time, the experimenters will not be able to collect data of lifetimes of all products completely and thus only the censored data is collected. There are two types of censoring frequently considered by researchers. One is the type II censoring which has fa ixed number of samples observed and the other is type I censoring which terminates the experiment at fixed time T. In this research, we focus on the progressive type I interval sampling since it has the advantage of the convenience of collecting data. There are some notations for this type of censoring needed to be addressed as follows: Set up the experimental time as T and the number of intervals as m. Therefore, the quality engineer will collect the data of number of failure items at the time points , where T = . At each time point, are removed sequentially with removing rates of , where ~binomial(, ), and . For this type of interval censoring, Utilize the maximum likelihood estimator (MLE) for to propose a hypothesis testing procedure for various kinds of lifetime distributions can be referred to Wu and Lin [4] for one-parameter exponential distribution; Wu and Lin [5] for Weibull distribution; Wu and Lu [6] for Pareto products; Wu [7] for Chen lifetime distribution; Wu et al. [8] for Burr XII distribution; Wu et al. [9] for Rayleigh distribution; Wu and Hsieh [10] for Gompertz distribution. The Frech’et distribution is first introduced in Frech’et [11] and it has good applications on flood flows. To generalize the Frech’et distribution, Nadarajah and Kotz [12] proposed a new lifetime distribution called the exponentiated Frech’et distribution (EF distribution) through exponentiation of Frech’et distribution. It also has good application on lifetimes of products (see examples in Rao et al. [13]). In this paper, we derived the maximum likelihood estimators of the index of for lifetimes following EF distribution and utilized this estimator to construct a testing procedure to reach a specified level of significance under a lower specification limit L.
The organization of the whole manuscript is summarized as follows: We introduced the lifetime performance index for products following EF lifetimes and the monotonic increasing relationship between this index and the conforming rate is further addressed in Section 2. In Section 3.1, we derived the maximum likelihood estimator of this index and its asymptotic distribution so that we can construct a hypothesis testing procedure based on the asymptotic sampling distribution of this estimator. We plotted power curves and constructed some tables to analyze the power performance of our proposed testing procedure and the impacts of different setup are also analyzed. In order to guide users to implement our proposed procedures, we give two practical examples to demonstrate the steps to execute the proposed testing procedure and make a decision to see if the process meets the pre-assigned lower specification limit in Section 3.2. In the end, we summarized the findings and conclusions for this paper in the Conclusions.
2. The Monotonic Relationship between the Lifetime Performance Index and the Conforming Rate
Let the random variable represent the lifetime of the product following an EF distribution. The probability density function (pdf) , cumulative distribution function (cdf) and hazard function are defined in Equations (1)–(3):
The pdf for = 1, 3, 5 under = 2 is displayed in Figure 1a and for = 2, 4, 6 under = 1 is displayed in Figure 1b. It is shown that it’s a right-skewed distribution. The hazard function for = 1, 3, 5 under = 2 is displayed in Figure 2a and for = 2, 4, 6 under = 1 is displayed in Figure 2b. It is shown that the hazard function has mono peak shape and the hazard rate is an increasing function of parameter when is fixed and is also an increasing function of parameter when is fixed.
Figure 1.
(a) pdf curve for = 1, 3, 5 under = 2; (b) pdf curve for = 2, 4, 6 under = 1.
Figure 2.
(a) hazard function for = 1, 3, 5 under = 2; (b) hazard function for = 2, 4, 6 under = 1.
Transform the lifetime U to the new lifetime variable Y through . Then, this new random variable Y has one-parameter exponential distribution and its pdf, cdf and hazard function are given in Equations (4)–(6):
The parameter is assumed to be known and this value can be determined by the Gini test with maximum p-value, where the Gini test (see Gill and Gastwirth [14]) is a scale-free goodness of fit for exponential distribution. The steps to implement this test is depicted as follows: At first, we set up the null hypothesis as .
Secondly, calculate the Gini test statistic , where and
. For large sample, the asymmetric distribution of is a standard normal distribution. Then, we calculate the observed value of Z as z. Hence, the p-value to test if the data is following the EF distribution can be calculated as . The p-value is a function of . The value of is determined with the maximum p-value. The lifetime of products is a unilateral specification quality characteristic and the larger the lifetime would be more attractive to picky consumers and to increase the sales in these competitive emerging markets. Let be the pre-assigned lower specification limit in the quality control and an item is considered to be conformative if its lifetime exceeds this lower specification. Montgomery [2] proposed the process capability index in Equation (7), where represents the mean of the process and represents the standard deviation of the process.
This index is called the lifetime performance index this index and it is frequently used to assess the performance of lifetime. Using the pdf defined in Equation (4), the mean and standard deviation for the new lifetime variable Y can be found as and . If is the given lower specification limit for lifetime variable U, then is the new lower specification limit for new lifetime variable Y. Replacing and by in Equation (7), this index can be rewritten as
Observe that this index is a non-increasing function of scale parameter and so is the hazard function. It means that the larger this index, the smaller the hazard rate.
The conforming rate is defined as the proportion of products with lifetime exceeding the given lower specification limit and it is calculated in Equation (9):
It is observed that there is a monotonic increasing relationship between the conforming rate and the lifetime performance index For example, if the experimenter hoped to be greater than 0.8187308, then must be greater than 0.80 to attain the desired conforming rate.
3. Results
3.1. The Maximum Likelihood Estimator for the Lifetime Performance Index and the Testing Procedure
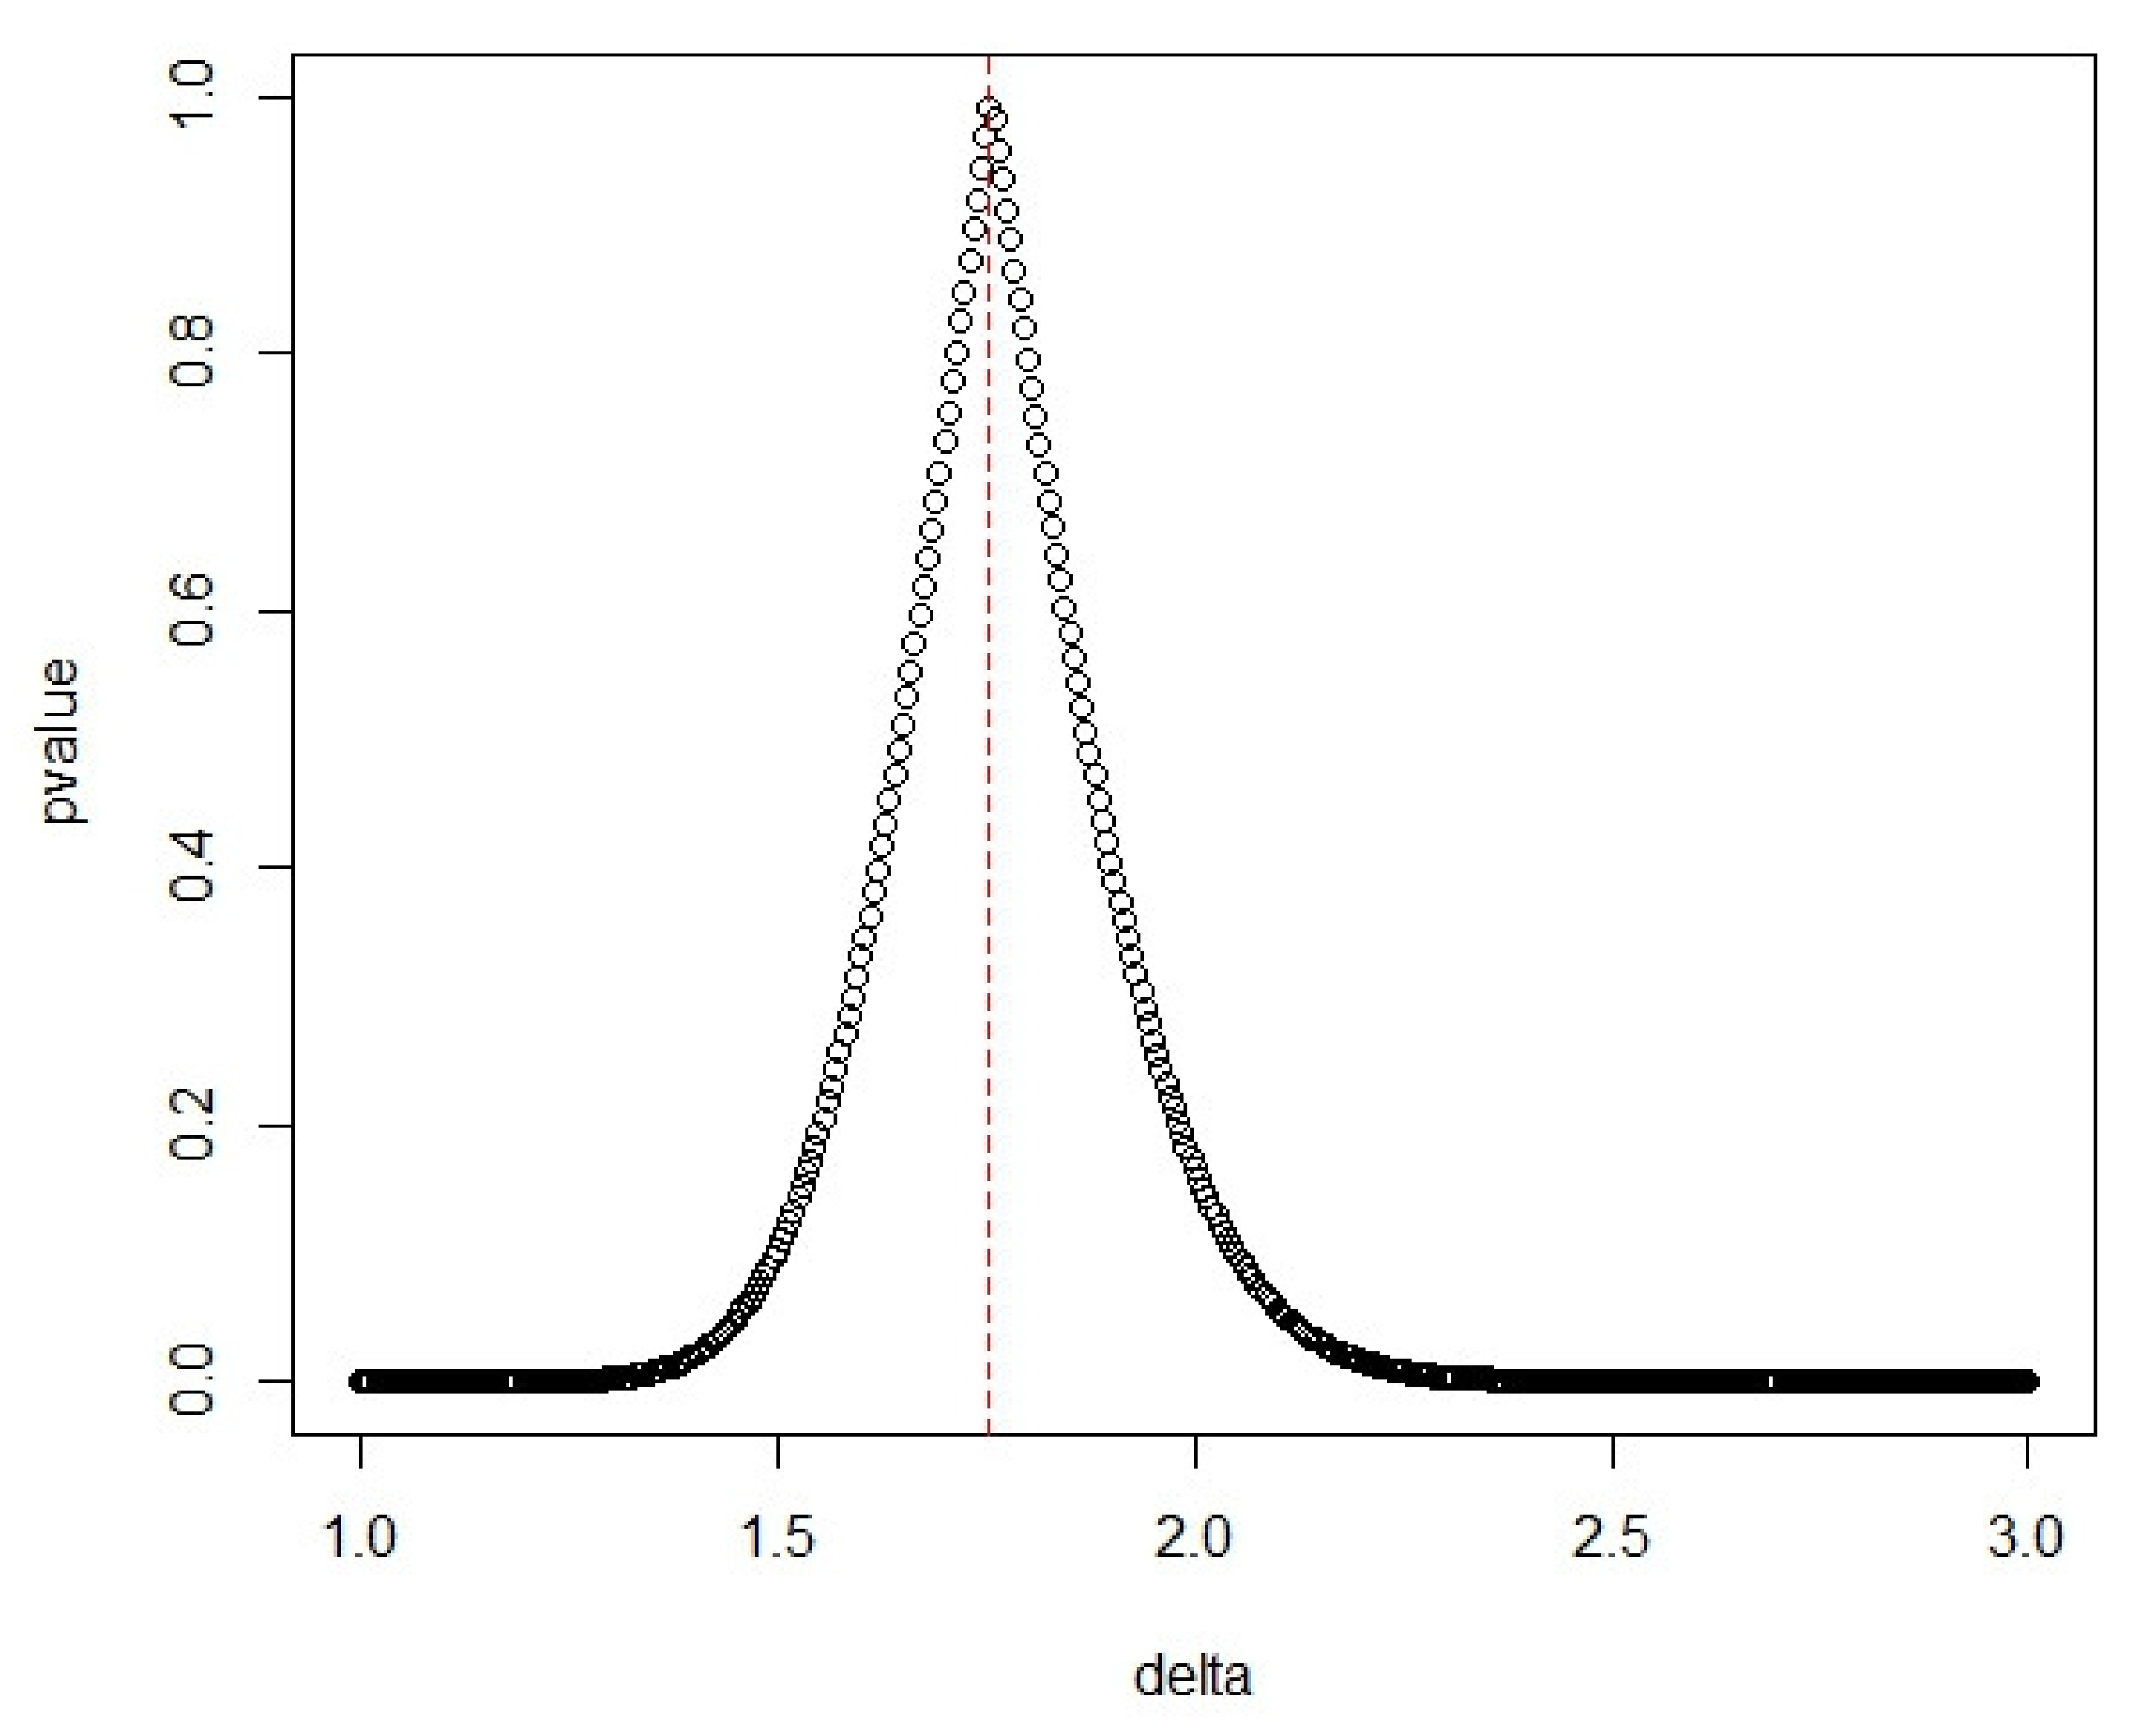
Let be the progressive type I interval censored sample observed at time points under random progressive censoring scheme with removal percentages , where and . The random variable is the number of failure items among items on the life test in the ith time interval []. The failure rate in the ith time interval is
The distribution of is denoted as
The random variable is the number of removing items at time point from the remaining items on the life test.
The distribution of is denoted as
From the distributions of and given in Equations (10) and (11), we can obtain the likelihood function based on progressive type I interval censored sample as
We can obtain the log-likelihood function
Then, the log-likelihood equation can be obtained as
The solution of the above log-likelihood equation is the MLE of and is denoted by . There is no close-form for this solution and it can only be solved numerically. From chapter 10 of Casella and Berger [15], the limiting distribution of MLE is a normal distribution with mean of and variance of the reciprocal of the Fisher’s information , where
From Equation (14), we can obtain
Refer to Equation (15) of Wu [7], we have
where
Using Equation (16), we can obtain the Fisher’s information number as
Then, the limiting distribution of the MLE of is determined as .
By the property of the invariance of MLE, the MLE of can be obtained as
with limiting distribution as
It’s always more convenient for experimenter to collect sample by considering equal interval lengths t for all m intervals such that . Therefore, we have For this case, the log-likelihood equation in Equation (14) became
The information number became
Making use of the maximum likelihood estimator of as the testing statistic, a testing procedure is developed as follows:
Let be the desired level for a quality engineer so that the manufacturing process is capable if the lifetime performance index exceeds . The null hypothesis and alternative hypothesis are set up as follows:
(the process is not capable) vs. (the process is capable). Let be the critical value and is determined as follows:
where
When , the sup can be attained.
Therefore,
We yield the critical value as
where denotes the left-tailed percentile of a standard normal distribution.
Thus, the critical values can be determined as
This manufacturing process is concluded to be capable if .
The steps to implement the hypothesis are summarized as follows:
Step 1: Specify the level of significance and the lower specification for lifetime U. Thus we can obtain the lower specification for the new lifetime Y. The progressive type I interval censored sample is collected at the pre-set times with censoring schemes of with removal probability from the EF distribution.
Step 2: For a given conforming rate , one can determine the required level = 1 + ln(). Then, the null and alternative hypothesis and are determined.
Step 3: Find the maximum likelihood estimator of as , where is the maximum likelihood estimator of by solving the log-likelihood equation defined in Equation (14).
Step 4: Compute the critical value , where .
Step 5: If , we can conclude that this manufacturing process is capable. Otherwise, this process is not capable.
In order to conduct the power analysis, the power of the proposed procedure is needed to be computed.
At the point of in alternative hypothesis, let be the deviation of true parameter from the desired target . The power is
where is the cdf for Z and Z~N(0,1), and . Apparently, the power is an increasing function of .
Given the lower specification limit 0.06306, then the lower specification limit for new lifetime variable Y is Let the total experimental time be T = 0.5. Suppose the quality engineer wants the conforming rate to be greater than 0.8187308, then the target level = 0.8, i.e., the null hypothesis is set up to be . Testing this hypothesis, the power in Equation (24) are computed and listed in Table 1 and Table A1 and Table A2 in Appendix A at respectively for 0(0.025)0.125, = 60(20)100 and . For some typical cases, the power curves are obtained in Figure 3, Figure 4, Figure 5 and Figure 6.
Table 1.
The power at = 0.01.
Figure 3.
Power function for the test at under and .
Figure 4.
Power function for the test at under and .
Figure 5.
Power function for the test under , and .
Figure 6.
Power function for the test at under and .
From Table 1, Table A1, Table A2 and Figure 3, Figure 4, Figure 5 and Figure 6, we found that the power is an increasing function of for any combinations of and . That is if the true index is further deviated from the target level , we obtained the higher test power as expected; The power is an increasing function of for fixed and as expected; Not surprisingly, the power is an increasing function of for fixed n, and ; The power is an increasing function of for any combinations of and as expected; The power is a decreasing function of for fixed n, and as expected.
The simulated type I error under = 0.000 and the simulated test power under = 0.025, 0.050, 0.100 for the case of = 0.01, 0.05, p = 0.05 and n = 10, 20, 40, 60, 80, 100, 200, 500 using 100,000 repetitions by Monte-Carlo method are listed in Table 2. Referring to = 0.05 and smaller sample sizes n = 10, 20, 40, the simulated type I error are 0.01448, 0.02244, 0.02930. They are not equal to the nominal type I error = 0.05 and all of them are much smaller than the nominal one. For larger sample sizes n = 60, 80, 100, 200, 500, the simulated type I error are 0.03189, 0.03411, 0.03565, 0.03987, 0.04267. They are also not equal to the nominal type I error and smaller than the nominal one. However, the simulated type I error for larger sample sizes are closer to the nominal one. Apparently, the simulated type I errors are approaching to the nominal one when the sample size is increasing and no one can really reach the nominal type I error. Under = 0.100, the simulated test power for sample sizes n = 10, 20, 40, 60, 80, 100, 200, 500 are 0.28509, 0.61186, 0.91324, 0.98347, 0.99741, 0.99955, 1.00000, 1.00000. As you can see, the simulated test power is increasing when the sample size is increasing and they are reaching one for sample size being at least 60. To sum up, we will suggest users to consider sample size n ≥ 60 to get type I error closer to the nominal one and to yield much higher test power.
Table 2.
The simulated type I error and test power.
3.2. Example
In order to guide users to fulfill our proposed hypothesis testing procedure to practical problems, one numerical example given below is taken into account.
We consider the data of relief times (in hours) for 50 arthritic patients in Wingo [16]. The parameter in [1,3] is determined by the Gini test with the maximum p-value in Figure 7. It shows that the optimal value of is identified as = 1.755 with the maximum p-value of 0.992592 and it indicates this data fits EF distribution the most at = 1.755.
Figure 7.
The p-values versus the parameter .
In this example, we consider the setup of , = 0.2 (h) and Now the steps to do the proposed testing procedure about are enumerated as follows:
Step 1: Specify the level of significance as 0.05 and the lower specification = 0.3611833 for lifetime U. Thus we can obtain the lower specification = 0.00255 for the new lifetime Y. The progressive type I interval censored sample are created as
= (19,3,2,0,0,1) at the time points of = (5,10,15,20,25,30) with progressive censoring schemes of (2,0,1,0,1,1).
Step 2: If the user wishes the conforming rate to be greater than = 0.860708, then the corresponding lifetime performance index target value should be = 1 + ln() = 0.85. Then, the null and alternative hypothesis and are determined.
Step 3: Solving Equation (14) numerically to find the MLE of as = 9.252991. Then, the maximum likelihood estimator of can be found as = 1 – 9.252991 (0.00255) = 0.9764049.
Step 4: The critical value can be computed as = 0.9039645.
Step 5: Since , we concluded that there is enough evidence to support so that this manufacturing process is capable.
4. Conclusions
It’s very crucial to upgrade the quality of products in the competitive emerging markets and the lifetime performance index is an effective measurement on the quality of products in terms of lifetime. The attractive property of progressive type I interval censoring is the convenient collection of data for a quality engineer. We presented an algorithm for users to fulfill the testing procedure about the lifetime performance index for EF distribution based on the asymptotic distribution of the maximum likelihood estimator under this censoring. Since we use normal approximation to the MLE distribution to develop the testing procedure and compute the test power, this approximation would be good if we have a large enough sample size. The power analysis shows that the proposed procedure reached the pre-assigned level of significance. The impact of the different setup of values of , and on the test power is also analyzed and concluded. For the guideline of users, we give two numerical examples to demonstrate the enumerated algorithm to conduct the testing procedure. In the future, we can investigate the inferences on the lifetime performance index for other lifetime distribution like exponentiated Weibull distribution.
Author Contributions
Conceptualization, S.-F.W.; methodology, S.-F.W.; software, S.-F.W. and W.-T.C.; validation, S.-F.W. and W.-T.C.; formal analysis, S.-F.W.; investigation, S.-F.W. and W.-T.C.; resources, S.-F.W.; data curation, W.-T.C.; writing—original draft preparation, S.-F.W. and W.-T.C.; writing—review and editing, S.-F.W.; visualization, W.-T.C.; supervision, S.-F.W.; project administration, S.-F.W.; funding acquisition, S.-F.W. All authors have read and agreed to the published version of the manuscript.
Funding
This research was funded by [Ministry of Science and Technology, Taiwan] MOST 108-2118-M-032-001-and MOST 109-2118-M-032-001-MY2 and the APC was funded by MOST 109-2118-M-032-001-MY2.
Institutional Review Board Statement
Not applicable.
Informed Consent Statement
Not applicable.
Data Availability Statement
Data available in a publicly accessible repository. The data presented in this study are openly available in Wingo [13].
Conflicts of Interest
The authors declare no conflict of interest.
Appendix A
Table A1.
The power at = 0.05.
Table A1.
The power at = 0.05.
| m | n | 0.000 | 0.025 | 0.050 | 0.075 | 0.100 | 0.125 | |
| 3 | 60 | 0.000 | 0.0500 | 0.1404 | 0.3432 | 0.6636 | 0.9298 | 0.9982 |
| 0.050 | 0.0500 | 0.1372 | 0.3312 | 0.6429 | 0.9174 | 0.9972 | ||
| 0.075 | 0.0500 | 0.1356 | 0.3253 | 0.6325 | 0.9106 | 0.9966 | ||
| 80 | 0.000 | 0.0500 | 0.1664 | 0.4358 | 0.7960 | 0.9817 | 0.9999 | |
| 0.050 | 0.0500 | 0.1622 | 0.4208 | 0.7770 | 0.9766 | 0.9999 | ||
| 0.075 | 0.0500 | 0.1601 | 0.4134 | 0.7673 | 0.9737 | 0.9998 | ||
| 100 | 0.000 | 0.0500 | 0.1918 | 0.5206 | 0.8818 | 0.9957 | 1.0000 | |
| 0.050 | 0.0500 | 0.1866 | 0.5035 | 0.8667 | 0.9941 | 1.0000 | ||
| 0.075 | 0.0500 | 0.1840 | 0.4950 | 0.8587 | 0.9931 | 1.0000 | ||
| 4 | 60 | 0.000 | 0.0500 | 0.1532 | 0.3919 | 0.7422 | 0.9670 | 0.9997 |
| 0.050 | 0.0500 | 0.1482 | 0.3732 | 0.7142 | 0.9561 | 0.9995 | ||
| 0.075 | 0.0500 | 0.1457 | 0.3642 | 0.7001 | 0.9497 | 0.9992 | ||
| 80 | 0.000 | 0.0500 | 0.1833 | 0.4960 | 0.8631 | 0.9941 | 1.0000 | |
| 0.050 | 0.0500 | 0.1767 | 0.4733 | 0.8404 | 0.9909 | 1.0000 | ||
| 0.075 | 0.0500 | 0.1735 | 0.4622 | 0.8285 | 0.9889 | 1.0000 | ||
| 100 | 0.000 | 0.0500 | 0.2126 | 0.5882 | 0.9313 | 0.9991 | 1.0000 | |
| 0.050 | 0.0500 | 0.2045 | 0.5632 | 0.9155 | 0.9984 | 1.0000 | ||
| 0.075 | 0.0500 | 0.2006 | 0.5508 | 0.9069 | 0.9979 | 1.0000 | ||
| 5 | 60 | 0.000 | 0.0500 | 0.1626 | 0.4275 | 0.7922 | 0.9823 | 0.9999 |
| 0.050 | 0.0500 | 0.1558 | 0.4026 | 0.7590 | 0.9732 | 0.9999 | ||
| 0.075 | 0.0500 | 0.1526 | 0.3907 | 0.7421 | 0.9676 | 0.9998 | ||
| 80 | 0.000 | 0.0500 | 0.1957 | 0.5390 | 0.9010 | 0.9977 | 1.0000 | |
| 0.050 | 0.0500 | 0.1868 | 0.5093 | 0.8766 | 0.9957 | 1.0000 | ||
| 0.075 | 0.0500 | 0.1826 | 0.4950 | 0.8634 | 0.9943 | 1.0000 | ||
| 100 | 0.000 | 0.0500 | 0.2280 | 0.6350 | 0.9558 | 0.9997 | 1.0000 | |
| 0.050 | 0.0500 | 0.2170 | 0.6031 | 0.9405 | 0.9994 | 1.0000 | ||
| 0.075 | 0.0500 | 0.2118 | 0.5874 | 0.9317 | 0.9991 | 1.0000 | ||
Table A2.
The power at = 0.1.
Table A2.
The power at = 0.1.
| m | n | 0.000 | 0.025 | 0.050 | 0.075 | 0.100 | 0.125 | |
| 3 | 60 | 0.000 | 0.1000 | 0.2473 | 0.5124 | 0.8179 | 0.9786 | 0.9998 |
| 0.050 | 0.1000 | 0.2426 | 0.4991 | 0.8025 | 0.9737 | 0.9997 | ||
| 0.075 | 0.1000 | 0.2403 | 0.4926 | 0.7946 | 0.9710 | 0.9996 | ||
| 80 | 0.000 | 0.1000 | 0.2833 | 0.6076 | 0.9053 | 0.9959 | 1.0000 | |
| 0.050 | 0.1000 | 0.2775 | 0.5927 | 0.8937 | 0.9945 | 1.0000 | ||
| 0.075 | 0.1000 | 0.2746 | 0.5853 | 0.8876 | 0.9936 | 1.0000 | ||
| 100 | 0.000 | 0.1000 | 0.3170 | 0.6866 | 0.9524 | 0.9993 | 1.0000 | |
| 0.050 | 0.1000 | 0.3102 | 0.6712 | 0.9447 | 0.9989 | 1.0000 | ||
| 0.075 | 0.1000 | 0.3068 | 0.6633 | 0.9405 | 0.9987 | 1.0000 | ||
| 4 | 60 | 0.000 | 0.1000 | 0.2657 | 0.5650 | 0.8730 | 0.9918 | 1.0000 |
| 0.050 | 0.1000 | 0.2586 | 0.5454 | 0.8544 | 0.9883 | 1.0000 | ||
| 0.075 | 0.1000 | 0.2551 | 0.5358 | 0.8447 | 0.9861 | 0.9999 | ||
| 80 | 0.000 | 0.1000 | 0.3064 | 0.6658 | 0.9435 | 0.9990 | 1.0000 | |
| 0.050 | 0.1000 | 0.2975 | 0.6445 | 0.9314 | 0.9983 | 1.0000 | ||
| 0.075 | 0.1000 | 0.2932 | 0.6340 | 0.9247 | 0.9978 | 1.0000 | ||
| 100 | 0.000 | 0.1000 | 0.3444 | 0.7458 | 0.9760 | 0.9999 | 1.0000 | |
| 0.050 | 0.1000 | 0.3339 | 0.7246 | 0.9689 | 0.9998 | 1.0000 | ||
| 0.075 | 0.1000 | 0.3288 | 0.7139 | 0.9649 | 0.9997 | 1.0000 | ||
| 5 | 60 | 0.000 | 0.1000 | 0.2791 | 0.6019 | 0.9049 | 0.9963 | 1.0000 |
| 0.050 | 0.1000 | 0.2696 | 0.5767 | 0.8844 | 0.9937 | 1.0000 | ||
| 0.075 | 0.1000 | 0.2651 | 0.5644 | 0.8735 | 0.9921 | 1.0000 | ||
| 80 | 0.000 | 0.1000 | 0.3231 | 0.7051 | 0.9627 | 0.9997 | 1.0000 | |
| 0.050 | 0.1000 | 0.3113 | 0.6785 | 0.9508 | 0.9993 | 1.0000 | ||
| 0.075 | 0.1000 | 0.3057 | 0.6654 | 0.9440 | 0.9990 | 1.0000 | ||
| 100 | 0.000 | 0.1000 | 0.3642 | 0.7841 | 0.9861 | 1.0000 | 1.0000 | |
| 0.050 | 0.1000 | 0.3503 | 0.7585 | 0.9800 | 0.9999 | 1.0000 | ||
| 0.075 | 0.1000 | 0.3437 | 0.7456 | 0.9763 | 0.9999 | 1.0000 | ||
References
- Montalvo, C.; Peck, D.; Rietveld, E. A Longer Lifetime for Products: Benefits for Consumers and Companies; Directorate General for Internal Policies: Luxembourg; Policy Deparment A: Economic and Scientific Policy of European Parliament: Brussels, Belgium, 2016. [Google Scholar]
- Montgomery, D.C. Introduction to Statistical Quality Control; John Wiley and Sons: New York, NY, USA, 1985. [Google Scholar]
- Tong, L.I.; Chen, K.S.; Chen, H.T. Statistical testing for assessing the performance of lifetime index of electronic components with exponential distribution. Int. J. Qual. Reliab. Manag. 2002, 19, 812–824. [Google Scholar] [CrossRef]
- Wu, S.F.; Lin, Y.P. Computational testing algorithmic procedure of assessment for lifetime performance index of products with one-parameter exponential distribution under progressive type I interval censoring. Math. Comput. Simul. 2016, 120, 79–90. [Google Scholar] [CrossRef]
- Wu, S.F.; Lin, M.J. Computational testing algorithmic procedure of assessment for lifetime performance index of products with weibull distribution under progressive type I interval censoring. J. Comput. Appl. Math. 2017, 311, 364–374. [Google Scholar] [CrossRef]
- Wu, S.F.; Lu, J.Y. Computational testing algorithmic procedure of assessment for lifetime performance index of Pareto products under progressive type I interval censoring. Comput. Stat. 2017, 32, 647–666. [Google Scholar] [CrossRef]
- Wu, S.F. The performance assessment on the lifetime performance index of products following Chen lifetime distribution based on the progressive type I interval censored sample. J. Comput. Appl. Math. 2017, 334, 27–38. [Google Scholar] [CrossRef]
- Wu, S.F.; Chen, T.C.; Chang, W.J.; Chang, W.C.; Lin, C. A hypothesistesting procedure for the evaluation on the lifetime performance index of products with Burr XII distribution under progressive type I interval censoring. Commun. Stat. Simul. Comput. 2018, 47, 2670–2683. [Google Scholar] [CrossRef]
- Wu, S.F.; Lin, Y.T.; Chang, W.J.; Chang, C.W.; Lin, C.A. Computational algorithm for the evaluation on the lifetime performance index of products with Rayleigh distribution under progressive type I interval censoring. J. Comput. Appl. Math. 2018, 328, 508–519. [Google Scholar] [CrossRef]
- Wu, S.F.; Hsieh, Y.T. The assessment on the lifetime performance index of products with Gompertz distribution based on the progressive type I interval censored sample. J. Comput. Appl. Math. 2019, 351, 66–76. [Google Scholar] [CrossRef]
- Frech’et, M. Sur la loi de probabilit de l’ecart maximum. Ann. Soc. Polon. Math. 1927, 6, 93–116. [Google Scholar]
- Nadarajah, S.; Kotz, S. The Exponentiated Type Distributions. Acta Appl. Math. 2006, 92, 97–111. [Google Scholar] [CrossRef]
- Rao, G.S.; Rosaiah, K.; Sridhar Babu, M. Group acceptance sampling plans for resubmitted lots under exponentiated Fréchet distribution. Int. J. Comput. Sci. Math. 2019, 10, 11–21. [Google Scholar] [CrossRef]
- Gill, M.H.; Gastwirth, J.L. A scale-free goodness-of-fit Test for the Exponential Distribution Based on the Gini Statistic. J. R. Stat. Soc. Ser. B Methodol. 1978, 40, 350–357. [Google Scholar] [CrossRef]
- Casella, G.; Berger, R.L. Statistical Inference, 2nd ed.; Duxbury Press: Pacific Grove, CA, USA, 2002. [Google Scholar]
- Wingo, D.R. Maximum likelihood methods for fitting the Burr type XII distribution to life test data. Biom. J. 1983, 25, 77–84. [Google Scholar] [CrossRef]
Publisher’s Note: MDPI stays neutral with regard to jurisdictional claims in published maps and institutional affiliations. |
© 2021 by the authors. Licensee MDPI, Basel, Switzerland. This article is an open access article distributed under the terms and conditions of the Creative Commons Attribution (CC BY) license (https://creativecommons.org/licenses/by/4.0/).