Abstract
In this article, a discrete analogue of an extension to a two-parameter half-logistic model is proposed for modeling count data. The probability mass function of the new model can be expressed as a mixture representation of a geometric model. Some of its statistical properties, including hazard rate function, moments, moment generating function, conditional moments, stress-strength analysis, residual entropy, cumulative residual entropy and order statistics with its moments, are derived. It is found that the new distribution can be utilized to model positive skewed data, and it can be used for analyzing equi- and over-dispersed data. Furthermore, the hazard rate function can be either decreasing, increasing or bathtub. The parameter estimation through the classical point of view has been performed using the method of maximum likelihood. A detailed simulation study is carried out to examine the outcomes of the estimators. Finally, two distinctive real data sets are analyzed to prove the flexibility of the proposed discrete distribution.
1. Introduction
In probability theory, the half-logistic (HLo) distribution is a continuous probability (CPr) model for nonnegative-valued random variables (RVs). The HLo model is a random distribution reported by folding at zero the logistic (Lo) distribution centered around the origin. Due to the flexibility of the HLo model, several authors aimed to propose and study many extensions and generalizations for this model with its applications in various fields, for instance, Balakrishnan [1], Balakrishnan and Wong [2], Torabi and Bagheri [3], Olapade [4,5,6], Kantam et al. [7], Jose and Manoharan [8], Krishnarani [9], Oliveira et al. [10], Usman et al. [11], Cordeiro et al. [12], Muhammad and Liu [13], Samuel and Kehinde [14], Xavier and Jose [15], Eliwa et al. [16] and El-Morshedy et al. [17], among others. Among all these generalizations, we take in our consideration the HLo model with two parameters (see Hashempour, [18]). An RV X is said to have the continuous two-parameter half-logistic (HLo-II) distribution if its cumulative distribution function (CDF) is given as
where and .
In several cases, lifetimes need to be recorded on a discrete scale rather than on a continuous analogue. Thus, discretizing CPr distributions has received noticeable attention in recent years. See, for example, Pillai and Jayakumar [19], Kemp [20], Roy [21], Johnson et al. [22], Jazi et al. [23], Nekoukhou et al. [24], Bakouch et al. [25], Almalki and Nadarajah [26], Chakraborty and Chakravarty [27], Shanker and Fesshaye [28], Inusah and Kozubowski [29], Barbiero and Hitaj [30], Eliwa et al. [31,32], Nezampour and Hamedani [33], El-Morshedy et al. [34,35,36] and Eliwa and El-Morshedy [37], among others. Although there are a number of discrete models in the statistical literature, there is still a lot of space left to build a new discretized model that is proper under various conditions. In this article, we propose and study the discrete analogue of the HLo-II (DHLo-II) model. Some characteristics of the proposed distribution can be summarized as follows: its CDF and probability mass function (PMF) can be expressed as closed-forms; its hazard rate function (HRF) can be bathtub-, increasing- and decreasing-shaped; it can be utilized for modelling equi- and over-dispersion phenomena; and it provides the best fit for various types of data in several fields in spite of having only two parameters, especially for over-dispersion data.
The article is organized as follows. In Section 2, we introduce the DHLo-II model based on the survival discretization approach; for more detail around this technique see Roy and Ghosh [38] and Chakraborti et al. [39]. Different statistical properties are discussed in Section 3. In Section 4, the model parameters are estimated by using the maximum likelihood method. A simulation study is presented in Section 5. Two distinctive data sets are analyzed to show the flexibility of the DHLo-II distribution in Section 6. Finally, Section 7 provides some conclusions.
2. Synthesis of the DHLo-II Model
In this Section, the new discrete model can be generated by utilizing the survival discretization technique. Thus, the CDF of the DHLo-II distribution can be expressed as
where , and . The corresponding PMF to Equation (2) can be listed as
Using generalized binomial expansion, Equation (3) can be proposed as a mixture representation of geometric (Geo) model as follows
where
and denote the PMF of Geo distribution with parameter . The HRF can be expressed as
where . Figure 1 shows the PMF and HRF plots for various values of the DHLo-II parameters.
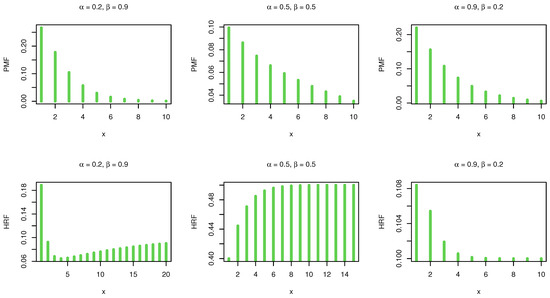
Figure 1.
The PMF and HRF plots.
It is noted that the shape of the PMF is always unimodal. Further, the DHLo-II distribution can be used to model asymmetric data. Regarding the HRF, it is found that the proposed model has several shapes including bathtub, increasing and decreasing, which means this model can be utilized to analyze various types of data in different fields, especially in medicine, insurance and engineering.
3. Statistical Properties
3.1. Moments and Generating Functions
Assume X to be a DHLo-II RV, then the probability generating the function (PrGF) can be listed as
Onreplacing s by in Equation (6), the moment generating function (MGF) can be derived. Thus, the first moment of the DHLo-II distribution is
Similarly, the other moments can be derived. Based on the MGF, the mean, variance, index of dispersion (IOD), skewness and kurtosis can be listed in Table 1, Table 2, Table 3, Table 4 and Table 5 as numerical computations (NuCo).

Table 1.
Some NuCo of the DHLo-II distribution for = 0.001.
Table 2.
Some NuCo of the DHLo-II distribution for = 0.01.
Table 3.
Some NuCo of the DHLo-II distribution for = 0.1.
Table 4.
Some NuCo of the DHLo-II distribution for = 0.3.
Table 5.
Some NuCo of the DHLo-II distribution for = 0.5.
From Table 1, Table 2, Table 3, Table 4 and Table 5 it is clear that: the mean, variance and IOD increase for constant values of with ; the proposed model is appropriate only for modelling equi- and over-dispersed data, because the IOD always is greater than or equal one; and this distribution is capable of modeling positively skewed and leptokurtic data sets.
3.2. Conditional Moments
This section lists results of the conditional moments (CoMos) for the DHLo-II distribution. The CoMos can be utilized to derive the mean deviations, Bonferroni and Lorenz curves. The CoMo of the DHLo-II model under and can be expressed as
and
respectively. The mean residual life function is given by , where is referred to as the vitality function of the distribution function F.
3.3. Stress-Strength Analysis
Stress-strength analysis has been utilized in mechanical component design. Let DHLo-II and DHLo-II be two independent RVs, then
It is noted that the value of stress-strength depends on the model parameters only.
3.4. Residual Entropy and Cumulative Residual Entropy
Residual entropy (RE) and cumulative residual entropy (CRE) are two important measures of information theory. The RE of the RV X is given by
whereas the CRE can be listed as
where represents the survival function of the distribution. The previous two equations can be derived by using geometric expansion and generalized binomial expansion (simple algebra).
3.5. Order Statistics
Order statistics (OrSt) play an important role in different fields of statistical theory. Suppose , to be a random sample (RS) from the DHLo-II, and let ,…, be their corresponding OrSt. Then, the CDF of the ith OrSt for an integer value of x is proposed as
where
The PMF of the ith OrSt can be formulated as
where . The moments of can be proposed as
Based on Equation (14), L-moments can be listed as
which can be utilized to discuss some descriptive statistics.
4. Maximum Likelihood Estimation (MLE)
In this section, we determine the MLE of the DHLo-II parameters according to a complete sample. Assume to be an RS of size n from the DHLo-II distribution. The log-likelihood function (L) can be listed as follows
To estimate the model parameters and , the first partial derivatives and should be obtained, and then equating the resulted equations to zero “normal equations”. These two equations cannot be solved analytically. Thus, an iterative procedure such as Newton–Raphson is required to solve it numerically.
5. Simulation
In this section, we assess the performance of the maximum likelihood estimators (MLEs) with respect to sample size n using R software. The assessment is based on a simulation study: generate 10,000 samples of size from DHLo-II and DHLo-II, respectively; compute the MLEs for the 10,000 samples, say for ; and compute the biases and mean-squared errors (MSEs), where biasand MSE. The empirical results are given in Figure 2 and Figure 3, respectively.
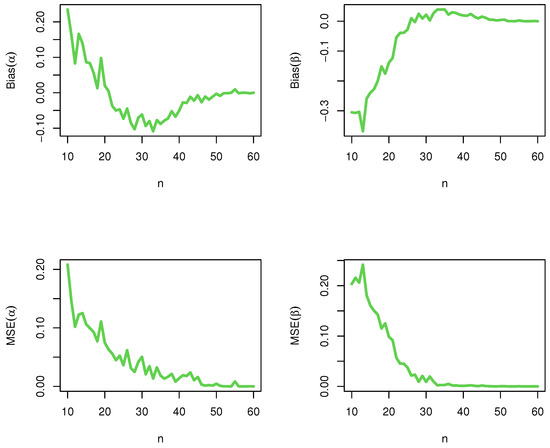
Figure 2.
DHLo-II.
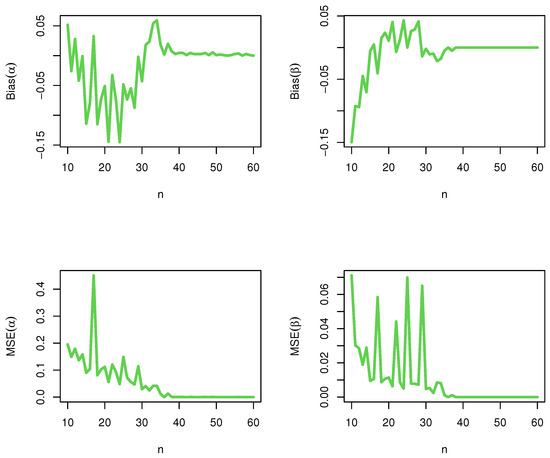
Figure 3.
DHLo-II.
From Figure 2 and Figure 3, it is noted that the magnitude of bias and MSE always decrease to zero as n grows. This shows the consistency of the MLEs. We can say that the maximum likelihood approach works quite well in estimating the model parameters, and consequently, it can be used effectively for analyzing the count data.
6. Applications
In this section, we illustrate the importance and the flexibility of the DHLo-II distribution by utilizing data from different fields. We shall compare the fits of the DHLo-II distribution with some competitive models such as discrete inverse Weibull (DIW), discrete gamma Lindley (DGL), discrete Burr II (DB-II), discrete log-logistic (DLL), discrete inverse Rayleigh (DIR), discrete Burr-Hatke (DBH), discrete Lindley and discrete Pareto (DP). The fitted models are compared using some criteria, namely, the maximized log-likelihood (L), Akaike information criterion (Aic) and its corrected (Caic), Hannan–Quinn information criterion (Hqic), Bayesian information criterion (Bic), and Chi-square (Chi) test with its corresponding P-value (Pv).
6.1. Data set I: COVID-19 in Armenia
The data are listed in (https://www.worldometers.info/coronavirus/country/armenia/, accessed on 20 July 2021) and represent the daily new deaths in Armenia for COVID-19 from 15 February to 4 October 2020. The initial mass shape for these data are explored utilizing the nonparametric kernel mass estimation (Kme) technique in Figure 4, and it is observed that the mass is asymmetric function. The normality condition (Nc) is checked by the quantile-quantile (Qu-Qu) plot in Figure 4. The extreme observations (ExOb) are spotted from the box plot in Figure 4, and it is observed that some ExOb were listed.
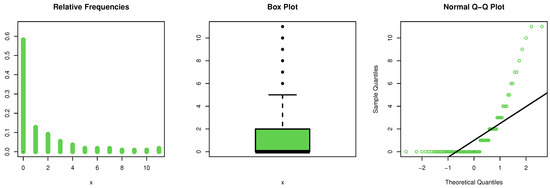
Figure 4.
The Kme, Qu-Qu, and box plots for data set I.
The MLEs with their corresponding standard errors (Se), confidence intervals (CI) for the parameter(s) and goodness of fit tests for data set I are listed in Table 6 and Table 7.
Table 6.
The MLEs, Se and CI for data set I.
Table 7.
The goodness-of-fit test for data set I.
The abbreviations “Of” and “Df” represent the observed frequency and degree of freedom, respectively. From Table 7, it is noted that the DGL distribution works quite well in addition to the DHLo-II distribution. However, the DHLo-II model is the best among all tested distributions. Figure 5 shows that the MLEs are unique because the L profiles have only unimodal shapes.
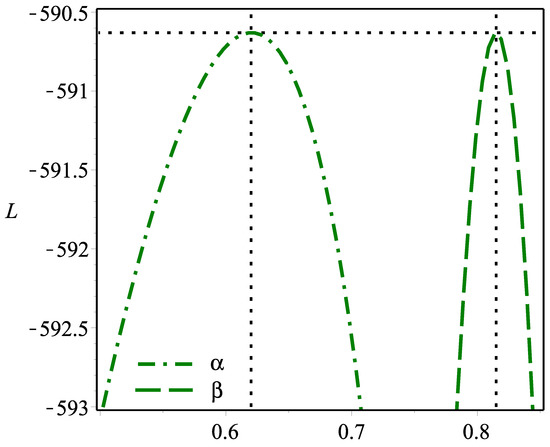
Figure 5.
The L profiles for the DHLo-II parameters based on data set I.
Figure 6 supports our empirical results where the DHLo-II is more fit to analyze these data, whereas Figure 7 shows the probability–probability (Pr–Pr) plot for data set I, which proves that the data set plausibly came from the DHLo-II distribution.
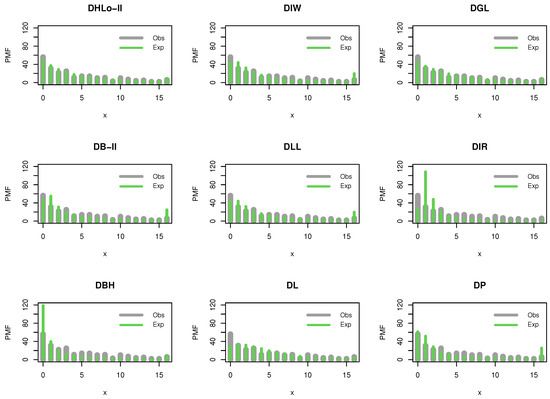
Figure 6.
The fitted PMFs for data set I.
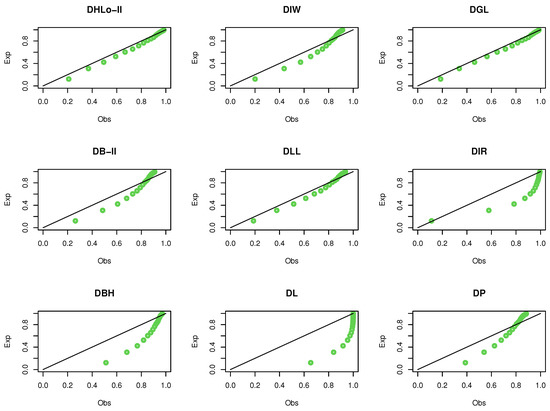
Figure 7.
The Pr–Pr plots for data set I.
According to the MLEs, the empirical descriptive statistics (EDS) for mean, variance, IOD, skewness and kurtosis are , , , and , respectively. The data exhibit over-dispersion. Moreover, they are moderately skewed to the right and leptokurtic.
6.2. Data Set II: Kidney Dysmorphogenesis
This data set is taken from the study of Chan et al. [40]. Initial mass shape for the kidney data is explored using the nonparametric Kme approach in Figure 8, and it is noted that the mass is asymmetric and multimodal functions. The Nc is checked via the Qu-Qu plot in Figure 8. The ExOb are spotted from the box plot in Figure 8, and it is noted that some ExOb were reported.
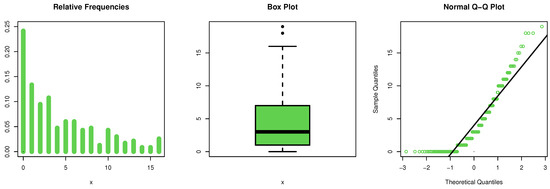
Figure 8.
The Kme, Qu-Qu and box plots for data set II.
Here, we examine the fitting capability of the DHLo-II distribution with some other competitive distributions. The MLEs, Se and CI for the parameter(s) as well as goodness of fit test for this data are reported in Table 8 and Table 9.
Table 8.
The MLEs, Se and CI for data set II.
Table 9.
The goodness-of-fit test for data set II.
It is noted that the DIW, DB-II, DLL, DBH and DP distributions work quite well in addition to the DHLo-II distribution. However, the DHLo-II distribution is the best model among all tested models. Figure 9 shows that the MLEs are unique.
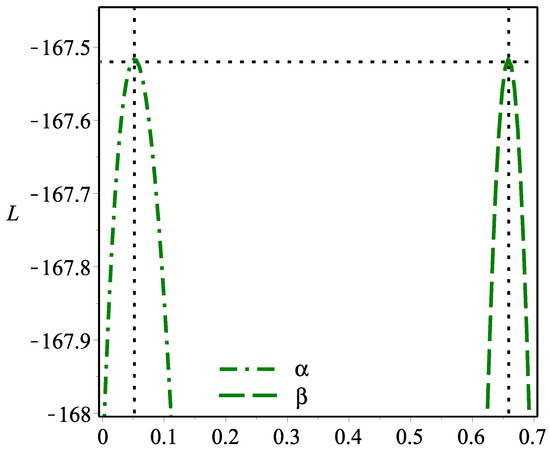
Figure 9.
The L profiles for the DHLo-II parameters based on dataset II.
Figure 10 supports our empirical results where the DHLo-II is more fit to analyze data set II, whereas Figure 11 shows the Pr–Pr plot for the same data.
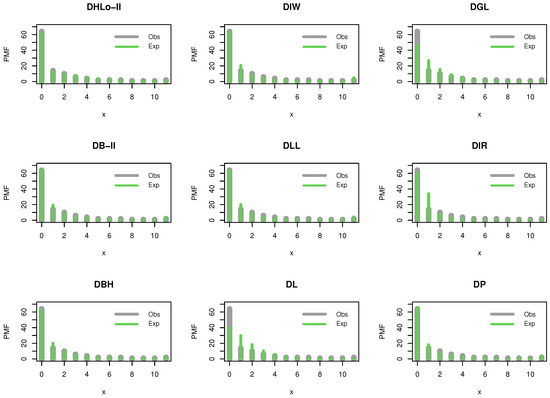
Figure 10.
The estimated PMFs for data set II.
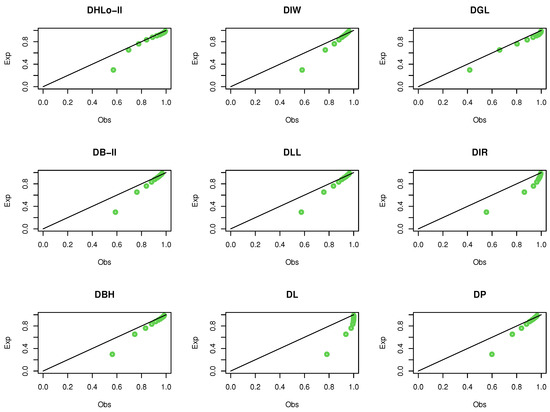
Figure 11.
The Pr-Pr plots for data set II.
According to the MLEs, the EDS for mean, variance, IOD, skewness and kurtosis are , , , and , respectively. The data are over-dispersed, skewed to the right and leptokurtic.
7. Conclusions
In this paper, we proposed a flexible discrete probability model with two parameters, in the so-called discrete half-logistic (DHLo-II) distribution. Various statistical properties of the proposed model have been derived. It was found that the DHLo-II model is convenient for modelling skewed data sets, especially those which have very extreme observations. Furthermore, it can be used as a flexible model to analyze equi- and over-dispersed phenomena, especially in medicine, insurance and engineering fields. More advantages of the proposed model are that it provides a wide variation in the shape of the HRF, including decreasing, increasing and bathtub, and consequently this distribution can be used in modelling various kinds of data. The DHLo-II parameters have been estimated via the MLE approach. A simulation has been performed based on different sample sizes, and it was found that the MLE method works quite effectively in estimating the DHLo-II parameters due to the consistency property. Finally, two distinctive data sets “COVID-19 and kidney dysmorphogenesis” have been analyzed to illustrate the flexibility of the DHLo-II model. In our future work, the bivariate and multivariate extensions will be derived for the DHLo-II distribution with its applications in medicine and engineering fields.
Author Contributions
M.E.-M.: Data curation; Methodology; Resources; Software; Writing—review and editing; M.A.: Methodology; Resources; Validation; A.A.-B.: Writing—review and editing; Funding acquisition; Methodology; M.S.E.: Conceptualization; Formal analysis; Methodology; Software; Writing—review and editing. All authors have read and agreed to the published version of the manuscript.
Funding
This research received no external funding.
Institutional Review Board Statement
Not applicable.
Informed Consent Statement
Not applicable.
Data Availability Statement
Not applicable.
Conflicts of Interest
The authors declare no conflict of interest.
References
- Balakrishnan, N. Order statistics from the half logistic distribution. J. Stat. Comput. Simul. 1985, 20, 287–309. [Google Scholar] [CrossRef]
- Balakrishnan, N.; Wong, K.H.T. Approximate MLEs for the location and scale parameters of the half-logistic distribution with Type-II right-censoring. IEEE Trans. Reliab. 1991, 40, 140–145. [Google Scholar] [CrossRef]
- Torabi, H.; Bagheri, F.L. Estimation of Parameters for an Extended Generalized Half Logistic Distribution Based on Complete and Censored Data. JIRSS 2010, 9, 171–195. [Google Scholar]
- Olapade, A.K. On Characterizations of the Half Logistic Distribution; InterStat: Johannesburg, South Africa, 2003; Issue 2. [Google Scholar]
- Olapade, A.K. On a four-parameter type I generalized half logistic distribution. Proc. Jangjeon Math. 2011, 2, 189–198. [Google Scholar]
- Olapade, A.K. The type I generalized half logistic distribution. J. Iran. Stat. Soc. 2014, 13, 69–82. [Google Scholar]
- Kantam, R.R.L.; Ramakrishna, V.; Ravikumar, M.S. Estimation and testing in type I generalized half logistic distribution. J. Mod. Appl. Stat. Methods 2013, 12, 22. [Google Scholar] [CrossRef]
- Jose, J.K.; Manoharan, M. Beta half-logistic distribution: A new probability model for lifetime data. J. Stat. Manag. Syst. 2016, 19, 587–604. [Google Scholar] [CrossRef]
- Krishnarani, S.D. On a power transformation of half-logistic distribution. J. Probab. Stat. 2016, 2016, 2084236. [Google Scholar] [CrossRef] [Green Version]
- Oliveira, J.; Santos, J.; Xavier, C.; Trindade, D.; Cordeiro, G.M. The McDonald half-logistic distribution: Theory and practice. Commun. Stat.-Theory Methods 2016, 45, 2005–2022. [Google Scholar] [CrossRef]
- Usman, R.M.; Haq, M.; Talib, J. Kumaraswamy half-logistic distribution: Properties and applications. J. Statist. Appl. Probab. 2017, 6, 597–609. [Google Scholar] [CrossRef]
- Cordeiro, G.M.; de Andrade, T.A.; Bourguignon, M.; Gomes-Silva, F. The exponentiated generalized standardized half-logistic distribution. Int. J. Stat. Probab. 2017, 6, 24–42. [Google Scholar] [CrossRef] [Green Version]
- Muhammad, M.; Liu, L. A new extension of the generalized half logistic distribution with applications to real data. Entropy 2019, 21, 339. [Google Scholar] [CrossRef] [PubMed] [Green Version]
- Samuel, A.F.; Kehinde, O.A. A study on transmuted half logistic distribution: Properties and application. Int. Stat. Distrib. Appl. 2019, 5, 54. [Google Scholar]
- Xavier, T.; Jose, J.K. A study of stress-strength reliability using a generalization of power transformed half-logistic distribution. Commun. Stat.-Theory Methods 2020, 50, 4335–4351. [Google Scholar] [CrossRef]
- Eliwa, M.S.; Alshammari, F.S.S.; Abualnaja, K.M.; El-Morshedy, M. A flexible extension to an extreme distribution. Symmetry 2021, 13, 745. [Google Scholar] [CrossRef]
- El-Morshedy, E.M.; Alshammari, F.S.; Tyagi, A.; Elbatal, I.; Hamed, Y.S.; Eliwa, M.S. Bayesian and frequentist inferences on a type I half-logistic odd Weibull generator with applications in engineering. Entropy 2021, 23, 446. [Google Scholar] [CrossRef]
- Hashempour, M. A new two-parameter lifetime distribution with flexible hazard rate function: Properties, applications and different method of estimations. Math. Slovaca 2021, 71, 983–1004. [Google Scholar] [CrossRef]
- Pillai, R.N.; Jayakumar, K. Discrete Mittag–Leffler distributions. Stat. Probab. Lett. 1995, 23, 271–274. [Google Scholar] [CrossRef]
- Kemp, A.W. Characterizations of a discrete normal distribution. J. Stat. Plan. Inference 1997, 63, 223–229. [Google Scholar] [CrossRef]
- Roy, D. Discrete Rayleigh distribution. IEEE Trans. Reliab. 2004, 53, 255–260. [Google Scholar] [CrossRef]
- Johnson, N.L.; Kemp, A.W.; Kotz, S. Univariate Discrete Distributions; John Wiley & Sons: Hoboken, NJ, USA, 2005; Volume 444. [Google Scholar]
- Jazi, M.A.; Lai, C.D.; Alamatsaz, M.H. A discrete inverse Weibull distribution and estimation of its parameters. Stat. Methodol. 2010, 7, 121–132. [Google Scholar] [CrossRef]
- Nekoukhou, V.; Alamatsaz, M.H.; Bidram, H. Discrete generalized exponential distribution of a second type. Statistics 2013, 47, 876–887. [Google Scholar] [CrossRef]
- Bakouch, H.S.; Jazi, M.A.; Nadarajah, S. A new discrete distribution. Statistics 2014, 48, 200–240. [Google Scholar] [CrossRef]
- Almalki, S.J.; Nadarajah, S. A new discrete modified Weibull distribution. IEEE Trans. Reliab. 2014, 63, 68–80. [Google Scholar] [CrossRef]
- Chakraborty, S.; Chakravarty, D. A new discrete probability distribution with integer support on (-∞,∞). Commun. Stat.-Theory Methods 2016, 45, 492–505. [Google Scholar] [CrossRef]
- Shanker, R.; Fesshaye, H. On discrete Poisson-Shanker distribution and its applications. Biom. Biostat. J. 2017, 5, 00121. [Google Scholar] [CrossRef] [Green Version]
- Inusah, S.; Kozubowski, T.J. A discrete analogue of the Laplace distribution. J. Stat. Plan. Inference 2006, 136, 1090–1102. [Google Scholar] [CrossRef]
- Barbiero, A.; Hitaj, A. A discrete analogue of the half-logistic distribution. In Proceedings of the 2020 International Conference on Decision Aid Sciences and Application (DASA), Sakheer, Bahrain, 8–9 November 2020; IEEE: Piscataway, NJ, USA, 2020; pp. 64–67. [Google Scholar]
- Eliwa, M.S.; Alhussain, Z.A.; El-Morshedy, M. Discrete Gompertz-G family of distributions for over-and under-dispersed data with properties, estimation, and applications. Mathematics 2020, 8, 358. [Google Scholar] [CrossRef] [Green Version]
- Eliwa, M.S.; Tyagi, A.; Alshammari, F.S.; El-Morshedy, M. Modelling coronavirus and larvae Pyrausta data: A discrete binomial exponential II distribution with properties, classical and Bayesian estimation. J. Appl. Stat. 2021. [Google Scholar]
- Nezampour, S.; Hamedani, G.G. Characterizations of three 2020 introduced discrete distributions. Pak. J. Stat. Oper. Res. 2020, 16, 609–616. [Google Scholar] [CrossRef]
- El-Morshedy, M.; Altun, E.; Eliwa, M.S. A new statistical approach to model the counts of novel coronavirus cases. Math. Sci. 2021, 1–14. [Google Scholar]
- El-Morshedy, M.; Eliwa, M.S.; Tyagi, A. A discrete analogue of odd Weibull-G family of distributions: Properties, classical and Bayesian estimation with applications to count data. J. Appl. Stat. 2021, 1–25. [Google Scholar] [CrossRef]
- El-Morshedy, M.; Eliwa, M.S.; Nagy, H. A new two-parameter exponentiated discrete Lindley distribution: Properties, estimation and applications. J. Appl. Stat. 2020, 47, 354–375. [Google Scholar] [CrossRef]
- Eliwa, M.S.; El-Morshedy, M. A one-parameter discrete distribution for over-dispersed data: Statistical and reliability properties with applications. J. Appl. Stat. 2021. [Google Scholar] [CrossRef]
- Roy, D.; Ghosh, T. A new discretization approach with application in reliability estimation. IEEE Trans. Reliab. 2009, 58, 456–461. [Google Scholar] [CrossRef]
- Chakraborti, S.; Jardim, F.; Epprecht, E. Higher-order moments using the survival function: The alternative expectation formula. Am. Stat. 2018, 73. [Google Scholar] [CrossRef]
- Chan, S.K.; Riley, P.R.; Price, K.L.; McElduff, F.; Winyard, P.J.; Welham, S.J.; Woolf, A.S.; Long, D.A. Corticosteroid-induced kidney dysmorphogenesis is associated with deregulated expression of known cystogenic molecules, as well as Indian hedgehog. Am. J. Physiol.-Ren. Physiol. 2010, 298, F346–F356. [Google Scholar] [CrossRef] [PubMed] [Green Version]
Publisher’s Note: MDPI stays neutral with regard to jurisdictional claims in published maps and institutional affiliations. |
© 2021 by the authors. Licensee MDPI, Basel, Switzerland. This article is an open access article distributed under the terms and conditions of the Creative Commons Attribution (CC BY) license (https://creativecommons.org/licenses/by/4.0/).