Abstract
Quality of service (QoS) and quality of experience (QoE) are two major concepts for the quality evaluation of video services. QoS analyzes the technical performance of a network transmission chain (e.g., utilization or packet loss rate). On the other hand, subjective evaluation (QoE) relies on the observer’s opinion, so it cannot provide output in a form of score immediately (extensive time requirements). Although several well-known methods for objective evaluation exist (trying to adopt psychological principles of the human visual system via mathematical models), each of them has its own rating scale without an existing symmetric conversion to a standardized subjective output like MOS (mean opinion score), typically represented by a five-point rating scale. This makes it difficult for network operators to recognize when they have to apply resource reservation control mechanisms. For this reason, we propose an application (classifier) that derivates the subjective end-user quality perception based on a score of objective assessment and selected parameters of each video sequence. Our model integrates the unique benefits of unsupervised learning and clustering techniques such as overfitting avoidance or small dataset requirements. In fact, most of the published papers are based on regression models or supervised clustering. In this article, we also investigate the possibility of a graphical SOM (self-organizing map) representation called a U-matrix as a feature selection method.
1. Introduction and Motivation
Streaming media has become a popular technology in recent years and represents a major amount of the data delivered via internet protocol (IP)-based networks. Adoption of the next-generation network (NGN) concept allows us to transmit not only data but also voice and video in their digital form via transmission chains originally projected for data transfer (such as e-mail communication, web browsing, etc.).
Since multimedia services (especially video) are generally asymmetric (the content is delivered in one direction) real-time critical services, transmission control protocol (TCP) had to be replaced by a connectionless user datagram protocol (UDP) with no guarantee of data delivery (data retransmission causes additional overhead time in the communication process). The UDP avoids the overhead time of the TCP handshake procedure. On the other hand, lost data can create visual impairments during video decoding and playback.
Well-known video on demand (VoD) services, e.g., HBO Go, Netflix, and YouTube, still use a reliable connection established by TCP, but are in fact not live stream broadcasting. They use buffers to preload data into reserved area of memory; for instance, YouTube stores approximately 60 s of the encoded video before playback, and Netflix has a 240-s playback buffer.
If providers of internet protocol television (IPTV) services want to become successful competitors of traditional terrestrial video broadcasting service companies, they must control and analyze the service quality they promote. Because subjective tests require the participation of many observers, the picture quality is calculated by objective video quality methods. Several well-known methods have been defined for this, such as peak signal to noise ratio (PSNR), video quality metric (VQM), and structural similarity index (SSIM). PSNR is the oldest method but provides fast calculation of results; SSIM and VQM reflect better on end-user subjective video quality perception [1,2]. Generally, subjective evaluation is represented in the form of five-point scale, standardized by the International Telecommunication Union (ITU), called the mean opinion score, where five points stands for the highest perceived quality. Each of these objective metrics uses its own scale. The relationship between the subjective and objective results has not yet been defined exactly, so it is not known how to correctly interpret objective results on the subjective MOS scale.
The possibility of using subjective MOS data measured for different QoS scenarios has been explored to come up with a model allowing the prediction of QoE based on QoS results, as well as the derivation of QoS parameters for a given QoE requirement. In order to achieve this, it is essential to understand how measurable parameters reflect the quality of service. QoS and QoE are important for both customers (individuals and businesses) and service providers, and their provision should not only be monitored, but also encouraged and enforced when needed.
IPTV, as a part of triple play (a marketing term for offering data, voice, and video services from one service provider), is under the regulations in numerous countries. National regulatory authorities need to prepare qualitative criteria (a set of measured parameters and their limits), as well as to have applications able to measure customer satisfaction levels. QoS regulation should be a part of customer protection, aiming to provide an objective quality of delivered service comparison between providers. In addition, given the importance of better picture quality with IPTV, it is in the company’s best interest to provide a high-quality service; otherwise, the customer will go elsewhere. Our created model takes into account the concepts of both quality evaluation techniques, which results in a functional monitoring system.
For that reason, the key objective and motivation behind this work is to combine the results provided by the objective and subjective methods. The proposed system will be in a form of a so-called passive monitoring (nonintrusive) tool that does not affect the inspected transmission chain (e.g., packets manipulation) and will be based on the machine learning algorithm. Machine learning offers data analysis that automates prediction model building. A selected algorithm can organize large, complex datasets, and the training procedure is very fast in comparison to traditional solutions based on back-propagation neural networks. We also tried to inspect the clustering ability of algorithm for feature selection. A Kohonen map allows us to identify and select important variables in the feature spaces, which is another benefit of the clustering technique, but only a few studies have contributed to this knowledge. Our application can be operated as an end-user video quality perception estimator and can help with data flow prioritization settings in content delivery networks.
2. Related Works
Several studies propose mapping functions to translate objective results into a subjective point of view. The first endeavor to apply machine learning to this research issue was called pseudo-subjective quality assessment (PSQA) [3]. Mohamed and Rubino worked with parameters such as packet loss or bitrate as an input to neural network modelling, followed by the objective score, to compute a subjectively perceived quality. They used a very old (nowadays) codec, MPEG 2, altogether with low resolution (352 × 288) and a small sample size dataset, but their article still serves as a basic reference for this work.
Valderrama and Gómez [4] chose a different set of inputs, including different lengths of the group of pictures (GOP), two prioritization techniques (DiffServ or BestEffort), and bandwidth bottlenecks in the experimental network. They obtained a Pearson correlation coefficient (PCC) slightly above 0.9, but only one resolution (740 × 480) and a high packet loss rate were used. Ma et al. [5] prepared an error sensitivity model based on spatial and temporal features to estimate the robustness of videos to different packet loss scenarios.
The paper by Søgaard et al. [6] suggested a regression equation for video quality estimation with a PCC oscillating between 0.7 to 0.9, based on the video content type. The main benefit of the paper by Loh and Bong [7] is the enhancement of the SSIM index. They incorporated the idea of spatial and temporal scene characteristics into the SSIM methodology. They obtained an improvement in precision but, on the other hand, the computational time of their metric doubled compared to the “baseline” performance of SSIM. The successor of video codec H.264, namely H.265/HEVC (high-efficiency video coding), but without ultra-high definition (UHD) sequences included in the testing dataset, was taken into account to create a regression for prediction of the subjective score in [8,9] with an obtained PCC of 0.92.
Mustafa and Hameed [10] had many testing scenarios (packet loss rate, various bitrates and scenes) but worked only with low resolution for video encoding (H.264 codec). They applied a new methodology to numerous machine learning applications (neural network, naïve Bayes, or decision tree) and obtained a classification rate ranging from 0.86 to 0.88. The article by Akhtar et al. [11] summarizes the recent innovations in this research topic and studies several approaches such as linear and nonlinear associations between the QoE and QoS parameters. Bampis and Bovik [12] used temporal and spatial information indexes as inputs into the model developing process and gained a high level of model veracity of about 0.9 (PCC). The article by Gu et al. [13] dealt with the no-reference estimation model. They used input vector elements such as contrast, sharpness, and brightness. They verified their model on six video databases and obtained a classification rate oscillating between 0.73 and 0.9 according to the particular test database. The benefits and drawbacks of backpropagation neural network usage for video quality estimation are described in [14]. The authors performed several test scenarios and put forward the improvement schemes of a neural network. They prepared a selection of important video sequence characteristics and analyzed their impact on quality prediction. The proposed model operated with a PCC of about 0.91.
The authors of this proposed article also contributed to this research. We designed a hybrid method for IPTV quality evaluation based on a backpropagation neural network [2]. Our application takes content type, bitrate, packet loss rate, and resolution into consideration as input elements, followed by the popular video formats (H.264 and H.265/HEVC). At the time of writing, our model can estimate the end-user perception of picture quality for both video profiles concurrently, which is something that none of the state-of-the-art models do.
All papers described in this section tried to develop a model for solving pattern recognition problems. The authors wanted to find regularities (patterns) in data obtained from subjective testing and qualitative parameters of video sequences. This study contributes to filling this gap. We chose a self-organizing map due to its ability of learning without a supervision model and clustering. We wanted to inspect the suitability of unsupervised learning and clustering techniques for video quality prediction. As a type of neural network, a Kohonen map offers generalization ability to estimate the data it has not trained on. A Kohonen map is easy to create, and the training process does not require deep knowledge about machine learning.
However, service providers need to know if the offered video stream is of sufficient quality or not. Precise information on the MOS rating does not play a major role in network administrator decisions regarding network settings. Our proposed system has all the advantages of our previously published model, namely, almost real-time quality estimation for both of the most popular video codecs.
3. Methodology
In our last paper related to this research topic [2], we proposed a distorted video database where each of the test video sequences obtained a score extracted from subjective and objective evaluation procedures. We selected the objective testing methodology SSIM for its good representation of human quality perception. Another benefit of the SSIM metric is its scale range (0–1), which is easy to normalize for successful used in network training. SSIM is a full reference metric, so it requires original undistorted (reference) video sequences for similarity calculation. The final score ranges from 0 (totally different samples) to 1 (two samples that are exactly alike). The video quality investigation process is affected by three components. Luminance l and contrast c are measured and compared, followed by structural comparison s. The overall index is a multiplicative combination of these components, as depicted in Figure 1. The similarity measure of two sequences (reference x and test sequence y) can be expressed as follows [1,2]:
where exponents α > 0, β > 0, and γ > 0 measure the weight of each component. The default setting is α = β = γ = 1.
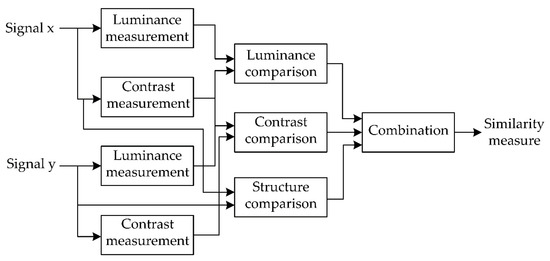
Figure 1.
SSIM metric scheme.
The absolute category rating (ACR) is an assessment method developed by the International Telecommunication Union (ITU). The test sequences are shown separately, i.e., one at a time. Each test sequence has to be evaluated by real observers. The results are reported as a MOS value (the rating scale is shown in Table 1). Figure 2 shows the whole procedure. As can be seen, the voting limit is approximately 10 s. The ACR method represents the real situation better because end-users cannot compare the received video stream with the original stream made by the content owner (e.g., a TV station). The test environment (lighting conditions, viewing distance) with a 24” Dell P2415Q UHD met the conditions specified in the recommendations [15]. The recommended number of observers is at least 15, but we had 60 viewers who participated in this experiment (between 18 and 40 years old), with men predominating by 39:21. Viewers had a short break every 30 min, and the maximum test session duration was 1.5 h [15].

Table 1.
The rating scale of mean opinion score (MOS) [15].
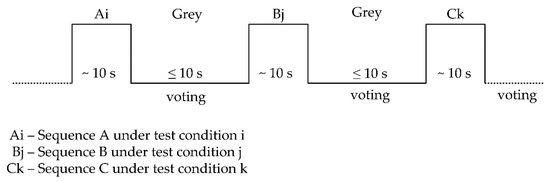
Figure 2.
Absolute category rating (ACR) testing procedure [15].
The video content type can be defined by the temporal (objects motion) and spatial (luminance) information (TI/SI). The recommendation [16] recognizes several types of video content regarding to these two indexes. Our model then estimates the subjective score (MOS) by extraction of information from the situation in the network (packet loss rate), video encoding parameters (i.e., bitrate, codec type) and the content type.
The Shanghai Jiao Tong University research group made available their database of uncompressed UHD video sequences that contain various video content types [17]. These video sequences have a duration of 10 s with a frame rate of 30/s.
First, selected video sequences were downloaded in UHD resolution (3840 × 2160), 4:2:0 color sampling with 8-bit color depth (YUV format). These settings represent standard TV broadcasting profile. Secondly, all video sequences were encoded to video profiles, namely H.264/AVC and H.265/HEVC, by using the FFmpeg tool version 4.2 (includes x264 and x265 encoders), which allows for modifying bitrates and resolutions. A streaming process was performed by a combination of FFmpeg (as a streaming server) and VLC Player software (version 3.0.6—receiving side). We captured and saved the video stream transmitted via the local network interface using VLC Player. During the streaming procedure, we initially set the packet loss to 0.1% (the application drops randomly selected packets) at the local interface. Then we repeated this step for packet loss in increments of 0.2%, 0.3%, 0.5%, 0.75%, and 1%. The streaming process simulated the RTP/UDP/IP configuration (FFmpeg: -c copy -f mpegts udp://127.0.0.1:1234) with payload encapsulation in MPEG-TS (transport stream) format; thus, we fully adopted the principles of IPTV stream transportation over the IP network [17]. The total number of distorted video sequences was 432. The whole process of making the dataset and evaluation performance is depicted in Figure 3. The descriptive characteristics of the chosen scenes are displayed in Figure 4. For more detailed information on the preparation of the testing video sequences, please see our other paper [2].
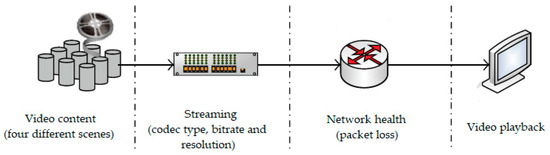
Figure 3.
Dataset making procedure.
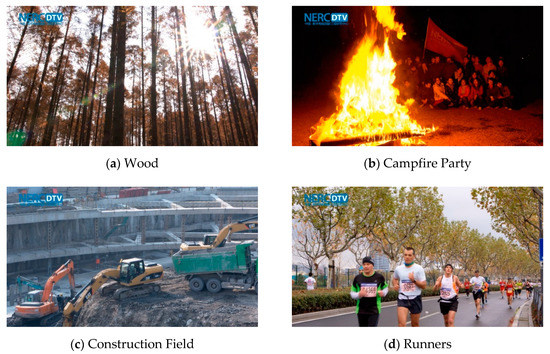
Figure 4.
Test sequences [2,17] (clockwise): (a) a high-motion scene (fast camera rotation); (b) night scene (people sitting next to a fire); (c) low-motion scene (moving of bulldozer, static background); (d) Shanghai marathon (static shooting).
Digital television terrestrial broadcasting has a theoretical bandwidth limitation of about 31 Mbps per single radio frequency channel (64—Quadrature amplitude modulation and 8 MHz wide channel). As a result of this restriction, the bitrate of one TV signal can oscillate between 5 Mbps (standard quality), 10 Mbps (FullHD), and 15 Mbps (UHD or premium quality). Typically, several TV signals are broadcasted via one radio channel (multiplexing).
Our previously mentioned paper [2] inspected many video sequence features with potential to be a part of the input dataset. The motion characteristics of a video have an impact on how codec can mask missing data during the video reconstruction. In a monochromatic static part of the frame (e.g., sky or grass), it is easy to calculate the missing blocks for the decoding of the video frame. However, in an action movie, scenes change very often. As a result, missing data cause visible compression artifacts. Codec with a high compression ratio (in our case, H.265) is more sensitive to data losses because each block carries more information than the codec with a lower compression ratio (H.264). The bitrate defines how much visual information is encoded, typically per second. Higher resolution requires a better bitrate than a low-resolution video does, but a very high bitrate (e.g., 15 Mbps) is counterproductive if low resolution is selected (redundant information that cannot improve the visual quality) [2,18].
A complete list of the chosen parameters, as well as the projected model output, is given in Table 2. Elements of the input vector are in bold, while MOS (in italics) characterizes customer subjective opinion. As can be seen in Table 2, resolution and codec type were not included in the set of inputs. We used a feature selection technique that proved that the boldface parameters have a serious effect on cluster making. One of the well-known statistical methods for input vector dimensionality reduction (feature selections) is called principal component analysis (PCA). PCA is an algorithm allowing us to reduce the set of variables in a way that analyses the potential correlation between them. As a result of this method, a set of variables called principal components is provided, where none of these variables are cross-correlated [19,20,21]. We verified the results of this standard procedure by U-matrix visualization (an additional advantage of Kohonen maps) to find the minimum set of input vector elements. In order to reduce redundancy in the data space (potential correlation), SOM can be used by considering the so-called component (or weight) planes. We tested all inputs listed in Table 2; according to the generated planes visualization, we selected four inputs without any visual mutual correlation. We can declare that unselected input aspirants were approximated by the variables presented in bold in Table 2.
Table 2.
List of dataset variables.
The input vector x consists of the parameters set of segment n, as defined in the example below:
The category of the scene parameter is 1 for static, 2 for a night scene, 3 for sport, and 4 for a highly dynamic scene. N is the number of segments in a session. In this case, the input matrix composed of the vectors of all the segments is as follows:
3.1. Self-Organizing Map (Kohonen Map)
A Kohonen (or self-organizing) map tries to categorize inputs based on their similarity in the input space. This approach differs from learning with a teacher due to its weight modification. A Kohonen map uses competitive learning. Output neurons compete among themselves. The neuron that “wins” this competition (the so-called “winner takes all” neuron) is active and its weight vector is updated (and nodes in its neighborhood, too).
SOM can be used for many classification problems because competitive learning makes clusters of neurons (with similar characteristics), while each of the formed groups can be considered as a classification class.
A Kohonen map contains only two layers, namely, input and output (competitive) layers. This map allows us to transform a multidimensional dataset into a symmetrical structure of 2D nodes. In the worst-case scenario, this algorithm creates as many classification classes as the competitive layer has nodes. This type of neural network was created by Finnish professor Teuvo Kohonen; therefore, SOM and Kohonen map are interchangeable expressions [22]. Unsupervised learning does not request target outputs to be included in the dataset; thus, no optimization algorithm (for finding a minimum of the cost function) or linear correlation is presented. Classification rate is the way to evaluate the accuracy of the trained model. We measured the classification rate of different network topologies. The average rate of success actions using SOM should be 85–90% to achieve excellent output veracity.
A successfully trained network can predict the response from a set of inputs in the form of an exact position (2D grid x and y coordinates) of an exciting node within the output layer. We can decide if this node belongs to a particular cluster: cluster labelling depends on its dominant content representation—in our case, the most frequently occurring MOS score within each cluster.
Kohonen Map Algorithm
First, the weight initialization of each node was performed. The sample input vector was chosen from the training dataset. Then the algorithm tried to find the neuron with the weight vector closest to the input vector. This neuron is called the best matching unit (BMU), and its calculation was based on Euclidean distance (we also tested Manhattan city block distance, but obtained worse results for all tested topologies), as follows [23]:
where represents individual elements of the input variables rows, and represents the weight between the i-th input and the j-th output node. Then BMU is a node with the minimum Euclidean distance:
Weight adaptation is given by this expression:
where is a learning rate and defines weight adaptation within a certain radius. Each iteration makes the radius of neighborhood function decrease. The basic height of neighborhood function h for a Kohonen map is:
where stands for the distance between the winning neuron and specific neuron , and is devoted to the radius. The topology may not be circular (grid) only. As depicted in Figure 5, symmetric hexagonal topology is preferred, for instance, by MATLAB software. We chose a batch algorithm for the training procedure. MATLAB creates one batch containing all samples of training data. At the end of the batch (iterative loop), weights are updated and BMU is determined. This approach is much faster in comparison to the sequential mode [24,25].
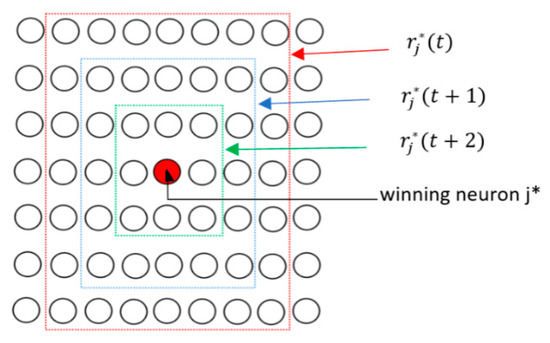
Figure 5.
Area of weight modification reducing over time.
The last step of the training is the validation of classifier outputs for each tested network topology. U-matrix is a useful method for network outputs visualization. The unified distance matrix (U-matrix) shows the position and size of the grouped nodes, as shown in Figure 6. A graphic analysis is formulated on the Euclidean metric between the inputs and nodes of a competitive layer (MATLAB uses yellow to black scale). Yellow zones can be denoted as clusters and black (dark red) parts as cluster boundaries [26]. We consider the U-matrix a useful graphical interpretation of the results in case someone attempts to identify similarities in the input dataset and they are not familiar with machine learning applications.
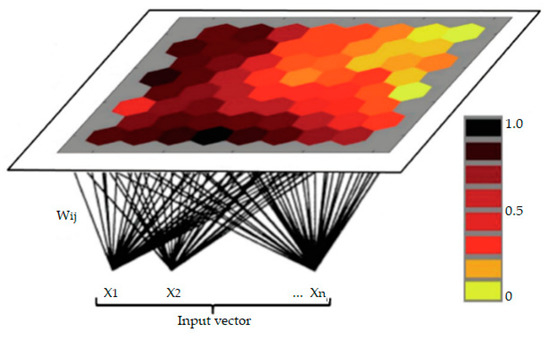
Figure 6.
Cluster identification by U-matrix.
From the gathered data [2] that is shown in Table 3, we set a SSIM interval range related to each MOS rating. The whole procedure of data preparation and modelling is shown in Figure 7. If the subjective rating is worse than 3 on the MOS scale, the delivered video stream is of poor quality, with considerable artifacts appearing in the image (blurring, ringing artifacts, etc.)
Table 3.
Extracted structural similarity index (SSIM) scores related to the MOS scale obtained from subjective testing. Data are taken from our previous paper [2].
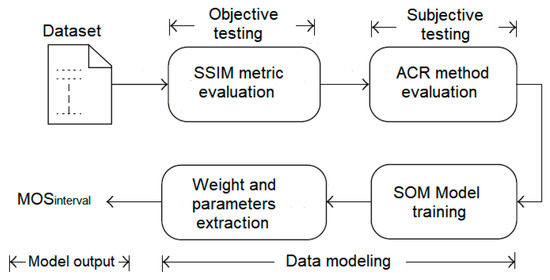
Figure 7.
The diagram of self-organizing map (SOM) classifier modelling.
The obtained results show that a MOS value of 4 or higher might correlate to a SSIM score of 0.98; a MOS rating between 3 and 4 belongs to the interval 0.95–0.979, and the rest is lower than 3 on the MOS scale.
4. Results
There are many tools and applications for the creation of a Kohonen map. We used MATLAB (R2019b, The MathWorks, Inc., Natick, MA, USA) with its Neural Network Toolbox (version 13.0). This toolbox contains Kohonen map implementation and supports the batch algorithm for training. Our database consists of 432 testing sequences affected by packet loss [2]. We divided the dataset into training and testing sets at a ratio of 95:5. A relatively small number of samples were allocated to the testing set because of the unsupervised learning technique. We need to have much more data for precise SOM training.
To reach a sufficient level of end-user satisfaction, at least three on the MOS scale must be ensured by service providers.
This demand has led us to set three classification classes (like a traffic light) for SOM implementation:
- Green—High quality of IPTV service.
- Orange—Tolerable quality of IPTV service. Customers can post complaints.
- Red—Poor quality of IPTV service. Network intervention is required.
Figure 8 depicts weight planes for each of the selected elements. None of the input elements can be seen cross-correlating; therefore, all of them are principal components. This proves that a U-matrix can be used as a dimensionality reduction technique.
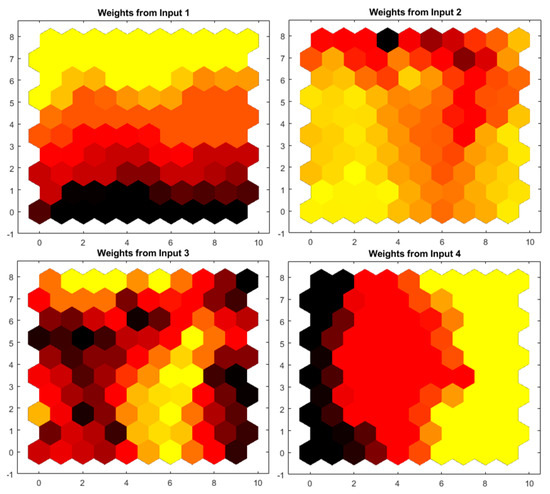
Figure 8.
The U-matrix weight plane for each parameter of the training set (content type, SSIM index, packet loss rate, and bitrate). Input 1 has connections with output neurons that are very dissimilar to those of inputs 2, 3, and 4.
An effectively designed SOM can group training samples into particular clusters. In order for the inputs to be classified, we had to reconsider which cluster they belong to by applying a Kohonen map. Figure 9 depicts the position of created clusters and how we labelled them (based on the frequency of inputs’ occurrence with respect to one of the selected MOS intervals). Any set of inputs may belong to one class in this case.
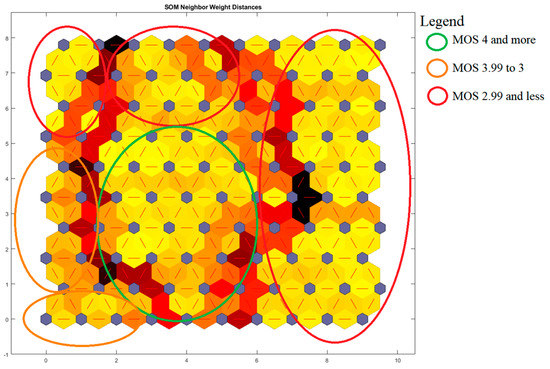
Figure 9.
Kohonen map topology with designed clusters.
Figure 10 depicts a hit diagram with each node showing the number of inputs that it classifies. As can be seen from this figure, the trained network interconnects three input vectors from the testing set (cross-validation) with the wrong output node, which can be interpreted as 86% success in terms of the classification rate. All the tested topologies with their classification rates are shown in Table 4. Since there are no target data (learning without a teacher), a Kohonen map can easily avoid overfitting, which improves the credibility of the delivered output [26,27]. Another benefit of using a Kohonen map is that the results can be easily presented in graphical form. The reduction of dimensionality and node grouping provides effective similarity detection within the input dataset. We used these benefits and developed a pilot version of a practical real-time IPTV quality classifier for network administrators or regulatory authorities using SOM principles.
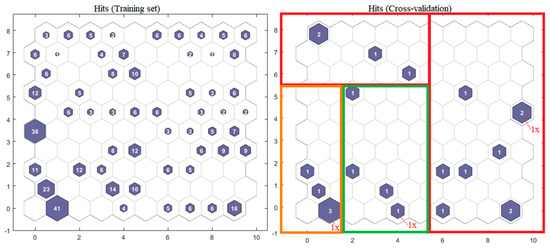
Figure 10.
The hit diagram: training set (left) and cross-validation (right). Three inputs were wrongly classified during the cross-validation.
Table 4.
Classification rates for tested topologies. The best one is in bold.
Each of the selected clusters (represented by MOS interval) can be considered as a two-class classification problem (the position of the input may or may not be inside the cluster). Due to this fact, we formed a receiver operating characteristic (ROC) curve that is able to interpret the diagnostic ability of a binary classifier system. Parameter AUC (area under the ROC curve) is a performance measurement method used to evaluate the classifier output quality (a trapezoid is used for approximation); we obtained a value of 0.927 by using it, which is considered acceptable for a pilot study. A model with 100% wrong predictions has an AUC of 0.0; a model with 100% correct predictions has an AUC of 1.0. In order to verify the veracity of the proposed classifier, we also created a multiclass confusion matrix, as shown in Table 5. The confusion matrix evaluates the correctness of the machine learning classification. It divides outcomes into four classes, namely: true positive (TP), false positive (FP), true negative (TN), and false negative (FN). True positive and true negative characterize the correct classification. False positive and false negative are Type I and Type II errors. This is extremely useful for the measuring of recall, precision, and F1 score, which are briefly described below [27].
Table 5.
Multi-class confusion matrix.
- Recall (or sensitivity) points out the number of properly predicted positive cases within a dataset.
- Precision represents the number of properly predicted positive identifications against the overall predicted positive cases.
- F1 score is the weighted mean of recall and precision. Thus, this parameter is affected by both the FP and FN classification classes. Macro F1 score is counted as the mean average of the partial F1 scores.
Now we can compare our model with the backpropagation neural network (BPNN) we published last year [2]. We slightly modified the BPNN to ensure classification into three classes instead of exact MOS value calculation. The ROC curve for both models is depicted in Figure 11.
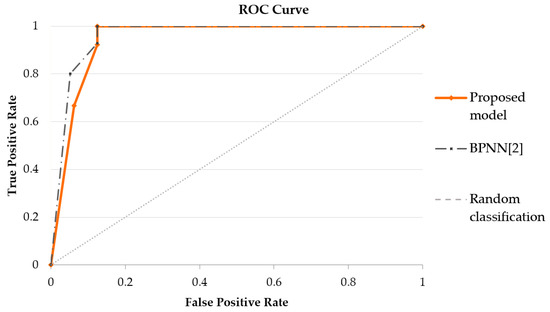
Figure 11.
The receiver operating characteristic (ROC) curve for the current model and our previous deep learning model published in [2].
5. Discussion
As depicted in Figure 11, the BPNN has slightly better overall performance in terms of the AUC (0.959). The model successfully classified 20 testing inputs, which is only one testing input more than in the model based on the Kohonen map. These results lead us to conclude that the proposed model is suitable for further investigation, especially for its significantly better training time (97 s in comparison to 17 s for the SOM model) and easy perceptual quality interpretation (three stages of video quality instead of exact numbers). The BPNN requires deep knowledge of the activation functions or algorithms for weights modification (gradient descent, momentum, or adaptive moment estimation). On the other hand, the SOM is quick and easy to train (especially for people without prior knowledge of neural network algorithms). There are also no target data and cost function, so SOM is more robust to overfitting. Modelling of BPNN has to adopt the techniques of overfitting avoidance such as early stopping or dropout.
Our model combines both methods of pattern identification. Classification requires predefined classes in which inputs are assigned. Clustering can be used as a data preprocessing step, prior to classification. The data were divided into several clusters, having separate decision boundaries for each cluster (MOS intervals). Video sequences were categorized manually during the subjective evaluation by the ACR method (Figure 7). Then we gave a classification to each created cluster using the majority label of the labelled video sequences in that cluster. A similar methodology based on “semisupervised” images and video classification was used in papers by Suying et al. and Peng et al. The macro F1 score ranged from 0.7 to 0.75 [28,29]. Clustering algorithms for the use of image classification are relatively unexplored in the literature. At the time of writing this study, an interesting paper by Bhat et al. was published [30]. They prepared a model for video quality estimation that is suitable for video on-demand technology. They tested BPNN, random forests, and support vector machine and obtained F1 scores oscillating from 0.85 to 0.88. In [31], machine learning algorithms based on clustering (but supervised learning) for the QoE prediction of 360° videos in virtual reality were used, while [32] deals with monitoring QoE based on random forests. Both models achieved a lower classification rate than our model.
It is not a trivial task to compare models based on regression and classification. Regression models use a correlation coefficient for model veracity analysis. However, this procedure cannot be used for classification models (a combination of unsupervised learning and clustering is the novelty of this paper). According to the paper [28], an F1 score higher than 0.7 should be considered to indicate a model with good performance. Analogically, regression models use R2, which represents the portion of variance that can be explained by the model. If R2 is higher than 0.7, we can say that the model offers a good prediction ability. In a very simplified view, we can compare state-of-the-art models regardless of what approach has been used. According to these results, as is shown in Table 6, our paper has proven that clustering algorithms can be used in various ways (proof-of-concept), delivering benefits that supervised algorithms cannot.
Table 6.
Comparison of the proposed model with published classification models for internet protocol television (IPTV) quality estimation (all of them use supervised learning) and list of regression models with computed parameter for a simplified similarity analysis.
6. Conclusions
This paper proposes a novel video streaming quality prediction tool based on the unsupervised learning approach, which has not been investigated in the literature to date. We assume that it is more important for network administrators to know if the delivered video stream is of sufficient quality, instead of having information about the exact mean opinion score.
Our model classifies IPTV service into three easy-to-understand classes. Quality prediction is delivered almost immediately for the most recent video codecs (H.264 and H.265). Via this model, service providers can predict the end-user’s QoE in their network infrastructure; moreover, network administrators can avoid needless investment in network capacity expansion without any effect on customer satisfaction. As a form of passive monitoring tool, it works on a real-time basis and facilitates early quality management (before customer satisfaction drops sharply). It interacts with all key elements of video distribution, such as content and coder type, network performance, and end-user visual quality perception. This paper can be considered as a proof of concept, and our results have confirmed that a SOM (or Kohonen map) can be useful when compared to supervised machine learning. In comparison with deep learning (such as BPNN), unsupervised learning does not require large datasets with labelled training data. This approach significantly reduces the training time of the model and provides an easy-to-understand classification of video quality. SOM can work on a small dataset, so we did not have to collect many observers’ opinions, which is another important benefit of SOM usage because subjective testing is costly.
The contribution of this paper is two-fold. Firstly, we proposed a mapping function (a combination of unsupervised learning and clustering—a novel approach) able to interconnect subjective and objective assessment and proved that SOM can be used for IPTV estimation (network administrators do not have to be familiar with deep learning, as our tool offers three easy-to-recognize classes of IPTV quality). We think that SOM has hidden potential and should be subject to further investigation due to its model simplicity, fast training process, and overfitting avoidance. Secondly, we investigated the possibility of the U-matrix technique serving as a substitute for the popular PCA method for dimensionality reduction, which is also unexplored in the literature.
We plan to continue finding ways to improve the classification rate of our proposed model, as well as prepare the dataset extension. The dataset will include additional scenes for better content-type identification. A large dataset also secures better network adaptation on input variables, which helps to develop unambiguous classification areas. The weight vectors reflect data rows that can effectively group and differentiate inputs.
The technical limitations of a terrestrial broadcasting mean that individual TV channels have a bitrate of between 5 and 15 Mbps. Thus, our application will meet broadcasting standards for the forthcoming years. We will also look into ways to incorporate other objective video quality assessment methods into our proposed classifier.
Author Contributions
Conceptualization, methodology, software, and writing—original draft preparation, J.F.; validation, J.F., J.N., R.M., and M.F.; formal analysis, J.F., J.N., and M.F.; writing—review and editing, J.F., J.N., and R.M. All authors have read and agreed to the published version of the manuscript.
Funding
This paper was funded by the Institutional Research of Faculty of Operation and Economics of Transport and Communications—University of Zilina no. 11/PEDAS/2019. This work was supported by Grant System of University of Zilina No. 1/2020. (project no. 7962), and the European Regional Development Fund in the Research Centre of Advanced Mechatronic Systems project number CZ.02.1.01/0.0/0.0/16019/0000867 within the Operational Programme Research, Development and Education.
Conflicts of Interest
The authors declare no conflict of interest.
References
- Frnda, J.; Voznak, M.; Fazio, P.; Rozhon, J. Network Performance QoS Estimation. In Proceedings of the 38th International Conference on Telecommunications and Signal Processing (TSP), Prague, Czech Republic, 9–11 July 2015. [Google Scholar]
- Frnda, J.; Nedoma, J.; Vanus, J.; Martinek, R. A Hybrid QoS-QoE Estimation System for IPTV Service. Electronics 2019, 8, 585. [Google Scholar] [CrossRef]
- Mohamed, S.; Rubino, G. A Study of Real-Time Packet Video Quality Using Random Neural Networks. IEEE Trans. Circuits Syst. Video Technol. 2002, 12, 1071–1083. [Google Scholar] [CrossRef]
- Valderrama, D.; Gómez, N. Nonintrusive Method Based on Neural Networks for Video Quality of Experience Assessment. Adv. Multimed. 2016, 2016. [Google Scholar] [CrossRef][Green Version]
- Ma, R.; Li, T.; Bo, D.; Wu, Q.; An, P. Error sensitivity model based on spatial and temporal features. Multimed. Tools Appl. 2020. [Google Scholar] [CrossRef]
- Søgaard, J.; Forchhammer, S.; Korhonen, J. Video quality assessment and machine learning: Performance and interpretability. In Proceedings of the 7th International Workshop on Quality of Multimedia Experience (QoMEX), Pylos-Nestoras, Greece, 26–29 May 2015. [Google Scholar]
- Loh, W.; Bong, D.B.L. A Just Noticeable Difference-Based Video Quality Assessment Method with Low Computational Complexity. Sens. Imaging 2018, 19, 33. [Google Scholar] [CrossRef]
- Cheng, Z.; Ding, L.; Huang, W.; Yang, F.; Qian, L. A unified QoE prediction framework for HEVC encoded video streaming over wireless networks. In Proceedings of the IEEE International Symposium on Broadband Multimedia Systems and Broadcasting (BMSB), Cagliari, Italy, 7–9 June 2017; pp. 1–6. [Google Scholar]
- Anegekuh, L.; Sun, L.; Jammeh, E.; Mkwawa, I.; Ifeachor, E. Content-Based Video Quality Prediction for HEVC Encoded Videos Streamed Over Packet Networks. IEEE Trans. Multimed. 2015, 17, 1323–1334. [Google Scholar] [CrossRef]
- Mustafa, S.; Hameed, A. Perceptual quality assessment of video using machine learning algorithm. Signal. Image Video Process. 2019, 13, 1495–1502. [Google Scholar] [CrossRef]
- Akhtar, Z.; Siddique, K.; Rattani, A.; Lutfi, S.L.; Falk, T.H. Why is Multimedia Quality of Experience Assessment a Challenging Problem? IEEE Access. 2019, 7, 117897–117915. [Google Scholar] [CrossRef]
- Bampis, C.G.; Li, Z.; Bovik, A.C. Spatiotemporal Feature Integration and Model Fusion for Full Reference Video Quality Assessment. IEEE Trans. Circuits Syst. Video Technol. 2019, 29, 2256–2270. [Google Scholar] [CrossRef]
- Gu, K.; Tao, D.; Qiao, J.; Lin, W. Learning a No-Reference Quality Assessment Model of Enhanced Images with Big Data. IEEE Trans. Neural Netw. Learn. Syst. 2018, 29, 1301–1313. [Google Scholar] [CrossRef]
- Yuana, Y.; Wang, C. IPTV video quality assessment model based on neural network. J. Vis. Commun. Image Represent. 2019, 64, 102629. [Google Scholar] [CrossRef]
- International Telecommunications Union. ITU-T P.913. Methods for the Subjective Assessment of Video Quality. Audio Quality and Audiovisual Quality of Internet Video and Distribution Quality Television in Any Environment. 2016. Available online: https://www.itu.int/rec/T-REC-P.913/en (accessed on 12 August 2020).
- International Telecommunications Union. ITU-T P.910. Subjective Video Quality Assessment Methods for Multimedia Applications. 2008. Available online: https://www.itu.int/rec/T-REC-P.910/en (accessed on 12 August 2020).
- Song, L.; Tang, X.; Zhang, W.; Yang, X.; Xia, P. The SJTU 4K video sequence dataset. In Proceedings of the 5th International Workshop on Quality of Multimedia Experience (QoMEX), Klagenfurt, Austria, 3–5 July 2013. [Google Scholar]
- Paudyal, P.; Battisti, F.; Carli, M. Impact of video content and transmission impairments on quality of experience. Multimed. Tools Appl. 2016, 75, 16461–16485. [Google Scholar] [CrossRef]
- Cao, L.J.; Chua, K.S.; Chong, W.K.; Lee, H.P.; Gu, Q.M. A comparison of PCA, KPCA and ICA for dimensionality reduction in support vector machine. Neurocomputing 2003, 55, 321–336. [Google Scholar] [CrossRef]
- Belkin, M.; Niyogi, P. Laplacian eigenmaps for dimensionality reduction and data representation. Neural Comput. 2003, 15, 1373–1396. [Google Scholar] [CrossRef]
- Mousas, C.; Newbury, P.; Anagnostopoulos, C.N. Evaluating the covariance matrix constraints for data-driven statistical human motion reconstruction. In Proceedings of the 30th Spring Conference on Computer Graphics, Smolenice, Slovakia, 28–30 May 2014; Association for Computing Machinery: New York, NY, USA; pp. 99–106. [Google Scholar]
- Kohonen, T. The self-organizing map. Neurocomputing 1998, 21, 1–6. [Google Scholar] [CrossRef]
- Lendel, V.; Pancikova, L.; Falat, L.; Marcek, D. Intelligent Modelling with Alternative Approach Application of Advanced Artificial Intelligence into Traffic Management. Commun.-Sci. Lett. Univ. Zilina 2017, 19, 36–42. [Google Scholar]
- Xiaofei, Q.; Lin, Y.; Kai, G.; Linru, M.; Tao, F.; Shuangyin, R.; Meng, S. Statistics-Enhanced Direct Batch Growth Self-Organizing Mapping for Efficient DoS Attack Detection. Neurocomputing 2016, 182, 66–81. [Google Scholar]
- Wehrens, R.; Kruisselbrink, J. Flexible Self-Organizing Maps in kohonen 3.0. J. Stat. Softw. 2018, 87, 1–18. [Google Scholar] [CrossRef]
- Yugendar, P.; Ravishankar, K.R. Analysis of Crowd Flow Parameters Using Artificial Neural Network. Transp. Telecommun. J. 2018, 19, 335–345. [Google Scholar] [CrossRef]
- Minihi, R.; AlSabbagh, H.M.; Al-Rizzo, H.; Al-Omary, A. End-To-End Throughput for Vanet with and without Cloud Effect. Transp. Telecommun. J. 2019, 20, 52–61. [Google Scholar] [CrossRef]
- Suying, Y.; Guo, Y.; Chen, Y.; Xie, F.; Yu, C.; Liu, Y. Enabling QoE Learning and Prediction of WebRTC Video Communication in WiFi Networks. 2016. Available online: http://eeweb.poly.edu/faculty/yongliu/docs/yishuai_icc17.pdf (accessed on 2 September 2020).
- Peng, B.; Lei, J.; Fu, H.; Shao, L.; Huang, Q. A Recursive Constrained Framework for Unsupervised Video Action Clustering. IEEE Trans. Ind. Inform. 2020, 16, 555–565. [Google Scholar] [CrossRef]
- Bhat, M.; Thiesse, J.; Le Callet, P. A Case Study of Machine Learning Classifiers for Real-Time Adaptive Resolution Prediction in Video Coding. In Proceedings of the 2020 IEEE International Conference on Multimedia and Expo (ICME), London, UK, 6–10 July 2020; pp. 1–6. [Google Scholar]
- Anwar, M.S.; Wang, J.; Khan, W.; Ullah, A.; Ahmad, S.; Fei, Z. Subjective QoE of 360-Degree Virtual Reality Videos and Machine Learning Predictions. IEEE Access. 2020, 8, 148084–148099. [Google Scholar] [CrossRef]
- Khokhar, M.; Ehlinger, T.; Barakat, C. From Network Traffic Measurements to QoE for Internet Video. In Proceedings of the IFIP Networking Conference, Warsaw, Poland, 20–22 May 2019; pp. 1–9. [Google Scholar]
© 2020 by the authors. Licensee MDPI, Basel, Switzerland. This article is an open access article distributed under the terms and conditions of the Creative Commons Attribution (CC BY) license (http://creativecommons.org/licenses/by/4.0/).