Application of Six Sigma Model on Efficient Use of Vehicle Fleet


Abstract
1. Introduction
2. The Concept of Six Sigma
2.1. Background of the Research
- improving user satisfaction (customers);
- decreasing the product-making time (cycle time reduction);
- reducing the number of defects (errors) in products and services.
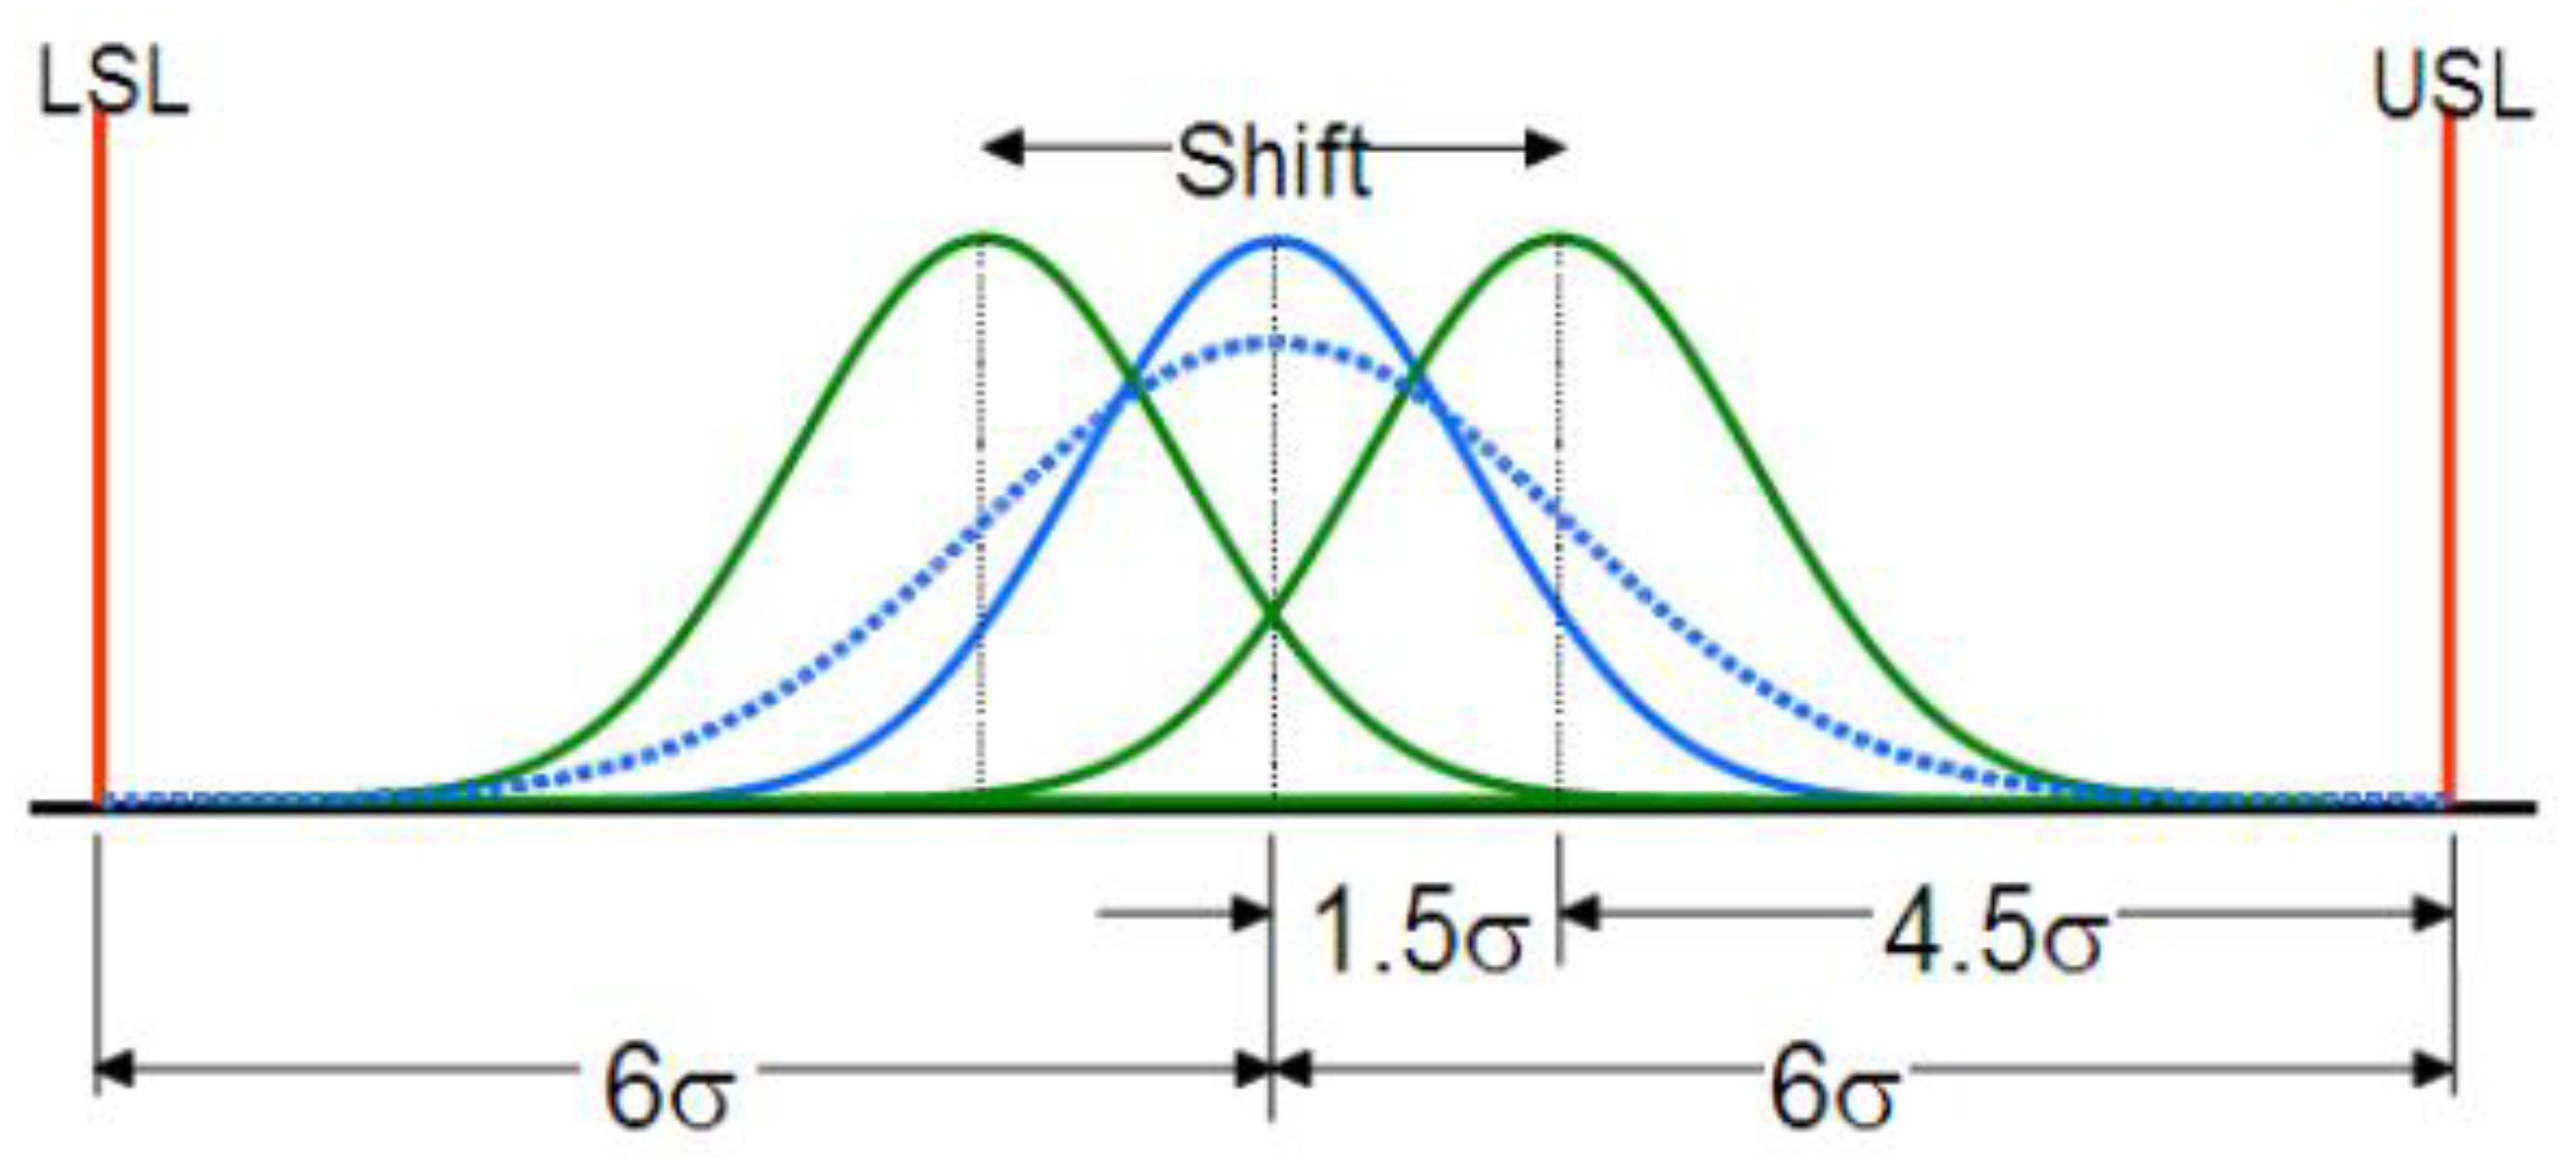
2.2. Six Sigma Model
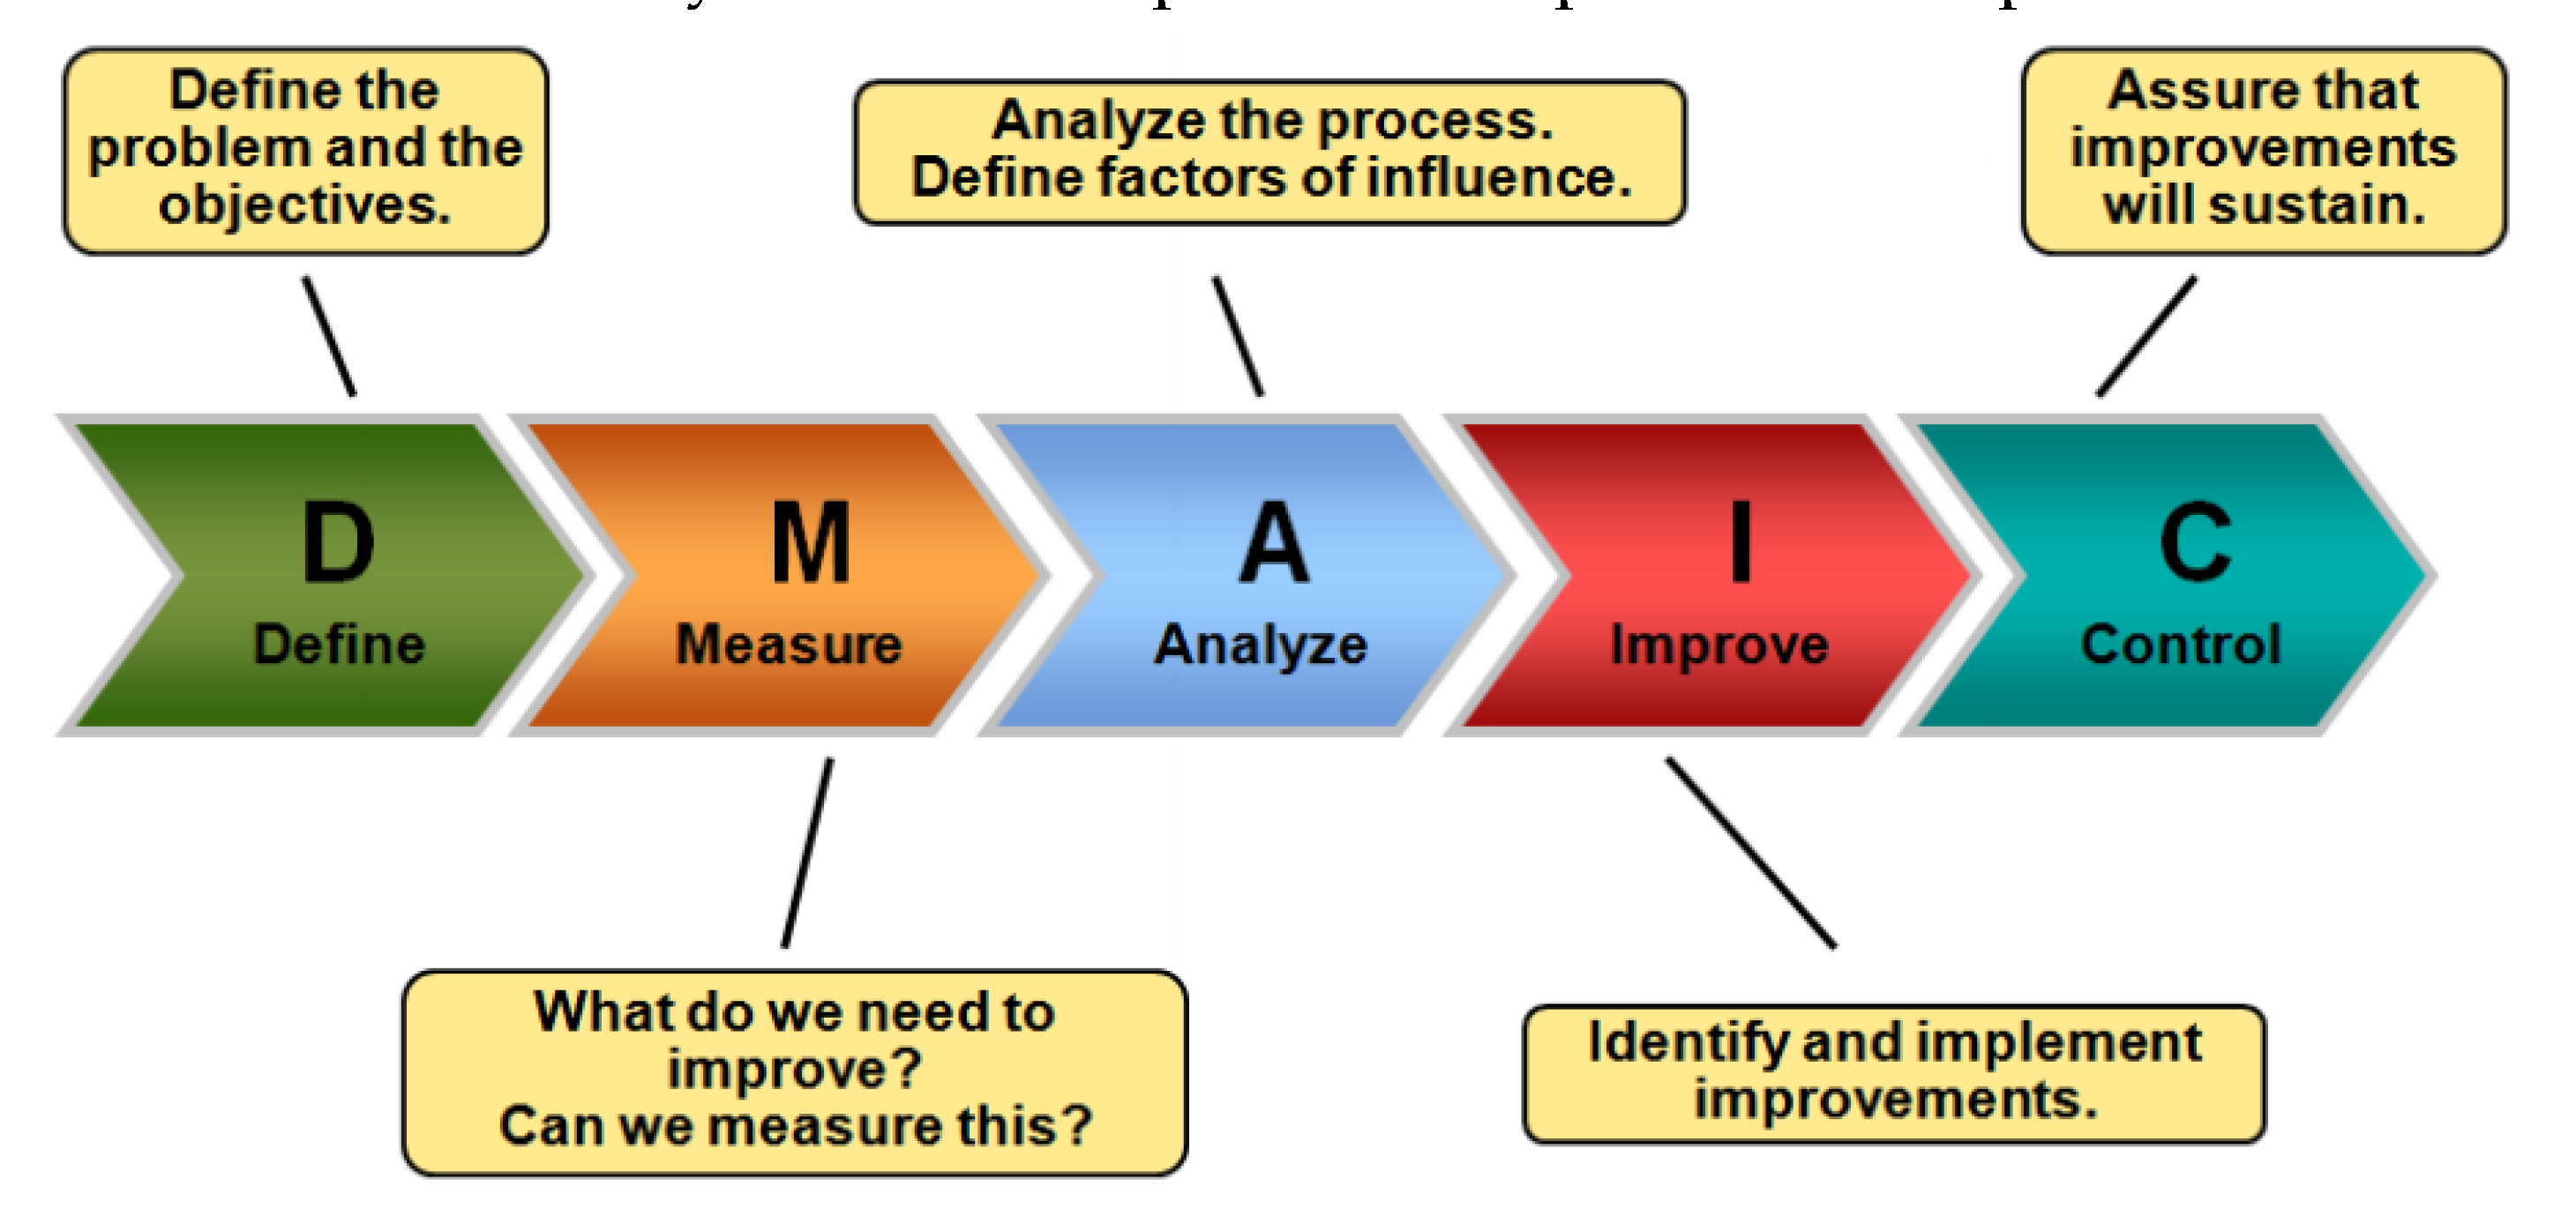
3. Solution Approaches for Vehicle Fleet by DMAIC Method
3.1. Problem Presentation
3.2. Methodology
- non-defined vehicle class;
- reports (local order—a travel warrant for the narrow geographical area within facilities Q) on the use of the vehicle;
- procedures for updating the vehicle fleet;
- procedures for maintenance and use of official vehicles should include: travel plan (approval), the number of passengers per vehicle (optimal), report and maintenance plan, fault books;
- technical booklets.
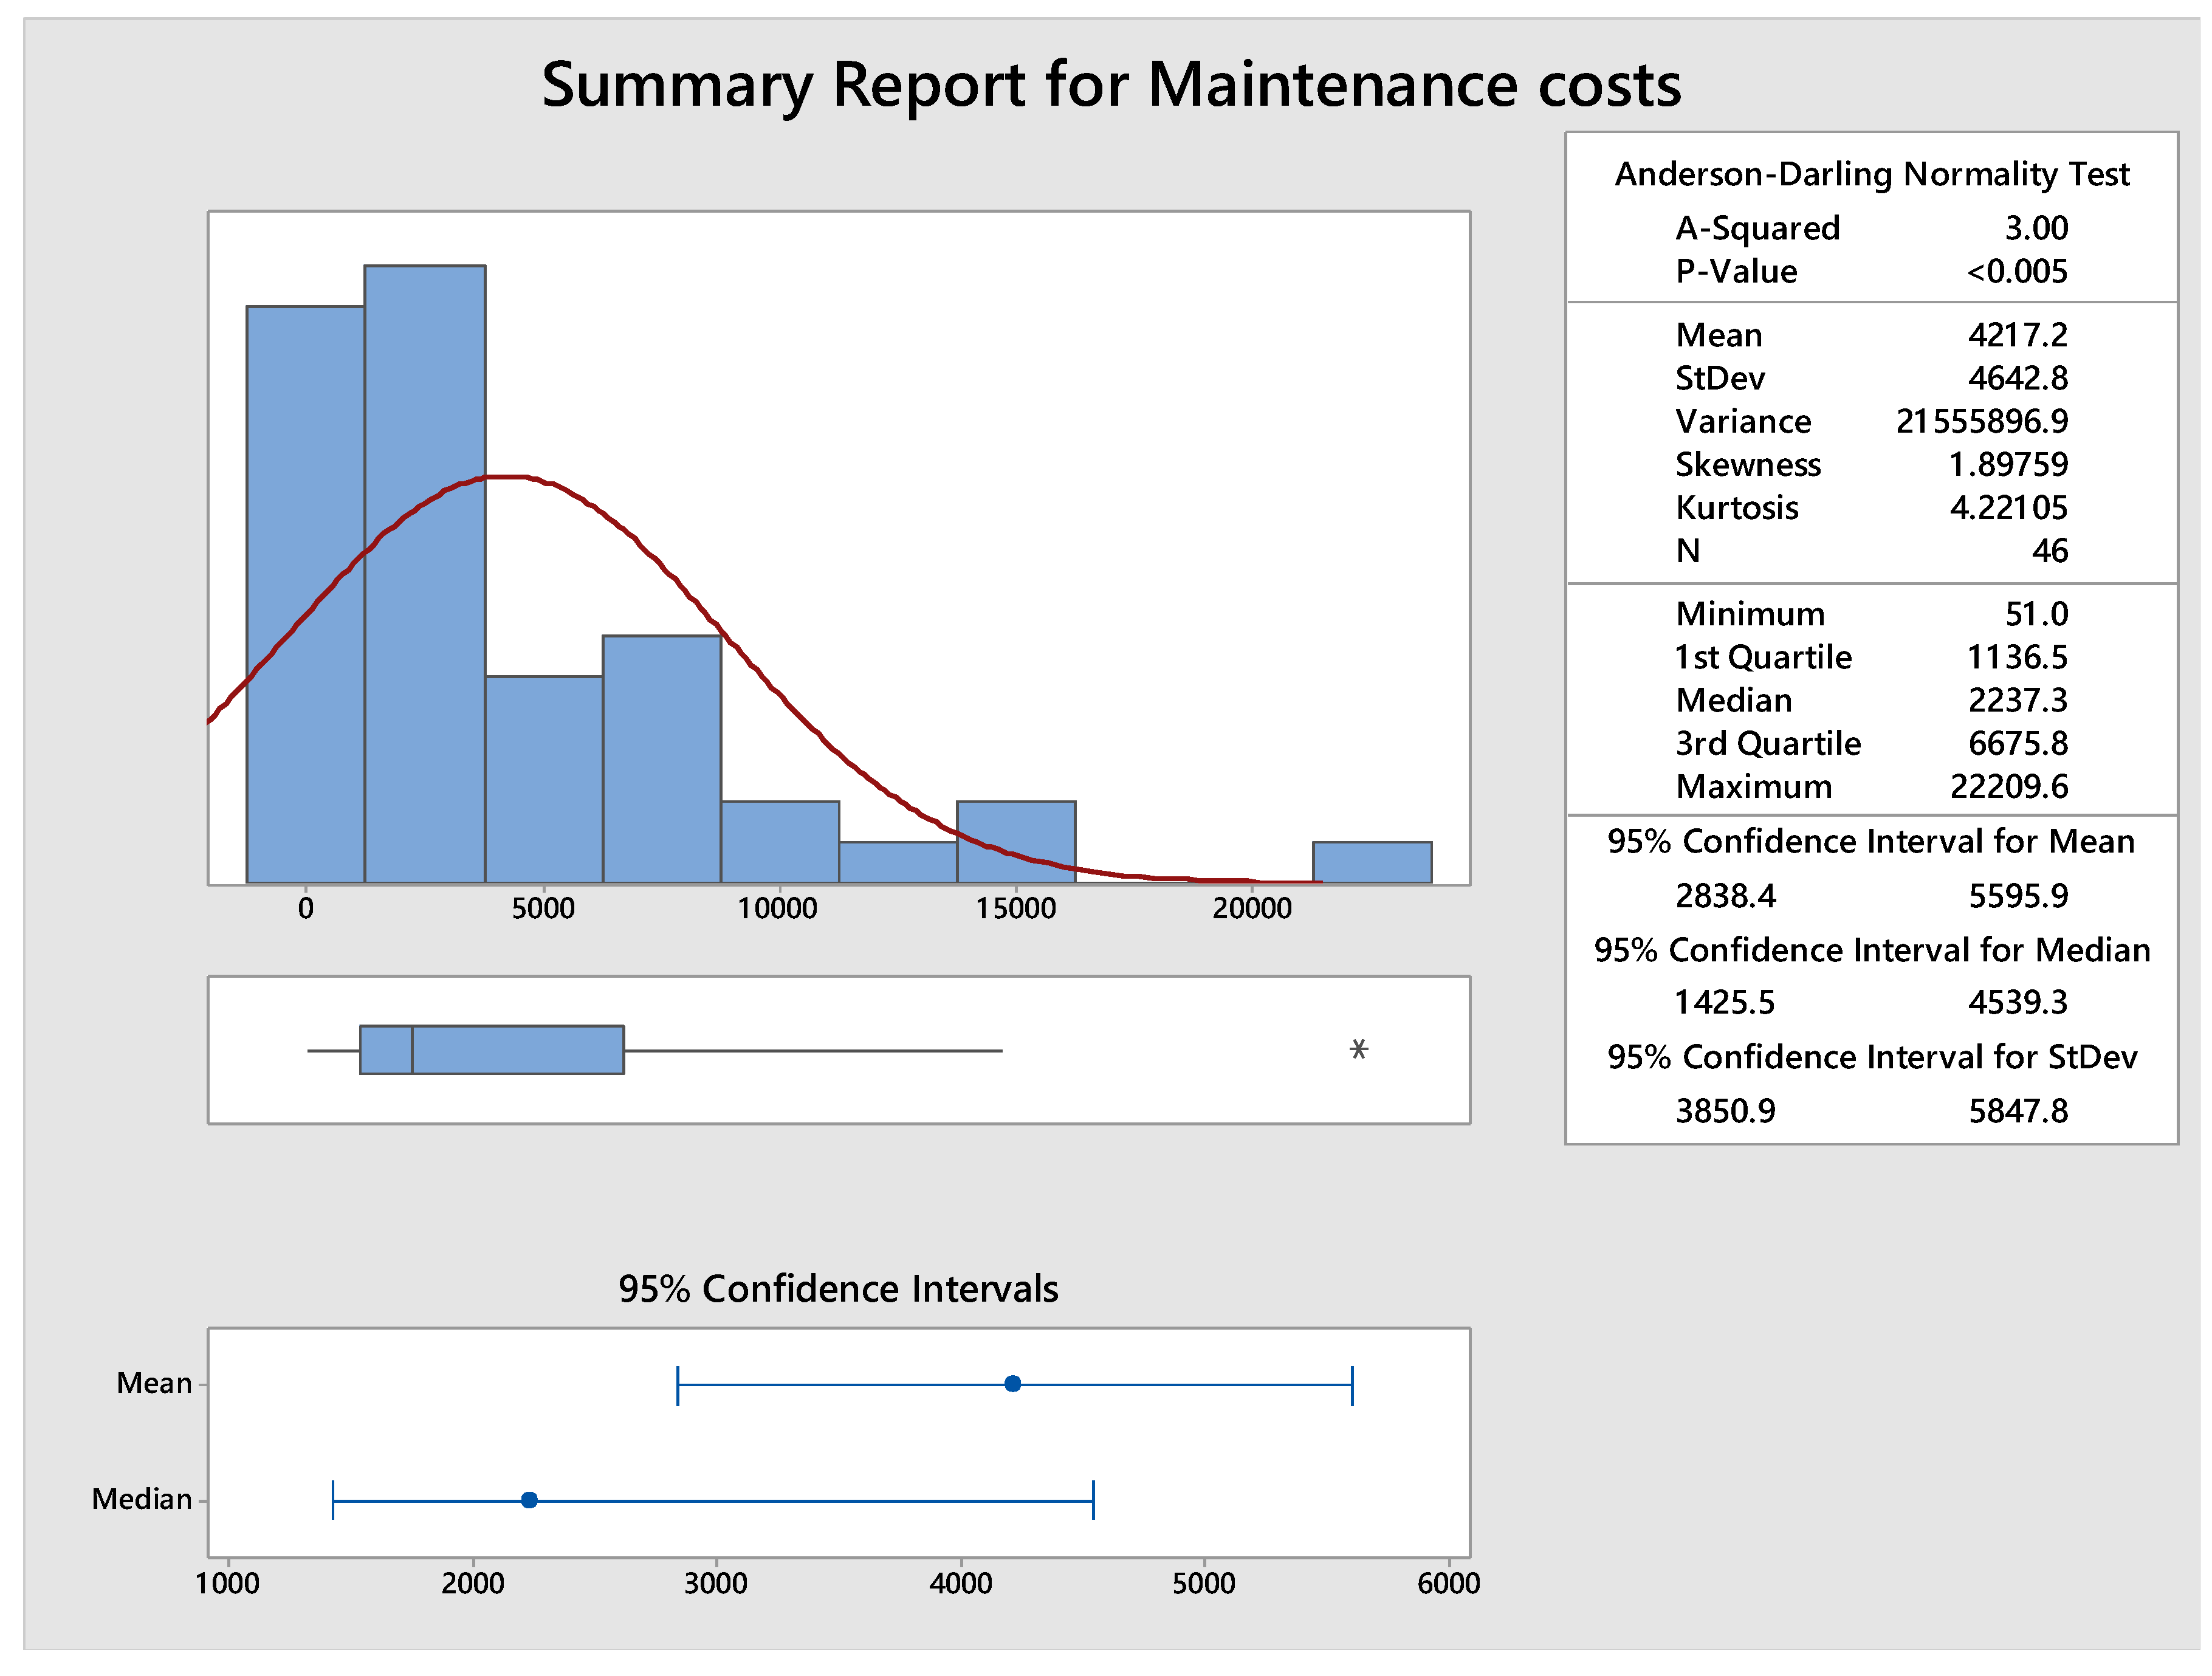
3.3. Results and Discussion
- detect variations in specific causes quickly;
- stop activities until the process is rectified (reactively);
- identify and permanently eliminate specific causes (preventively);
- adjust the process if specific causes cannot be eliminated.
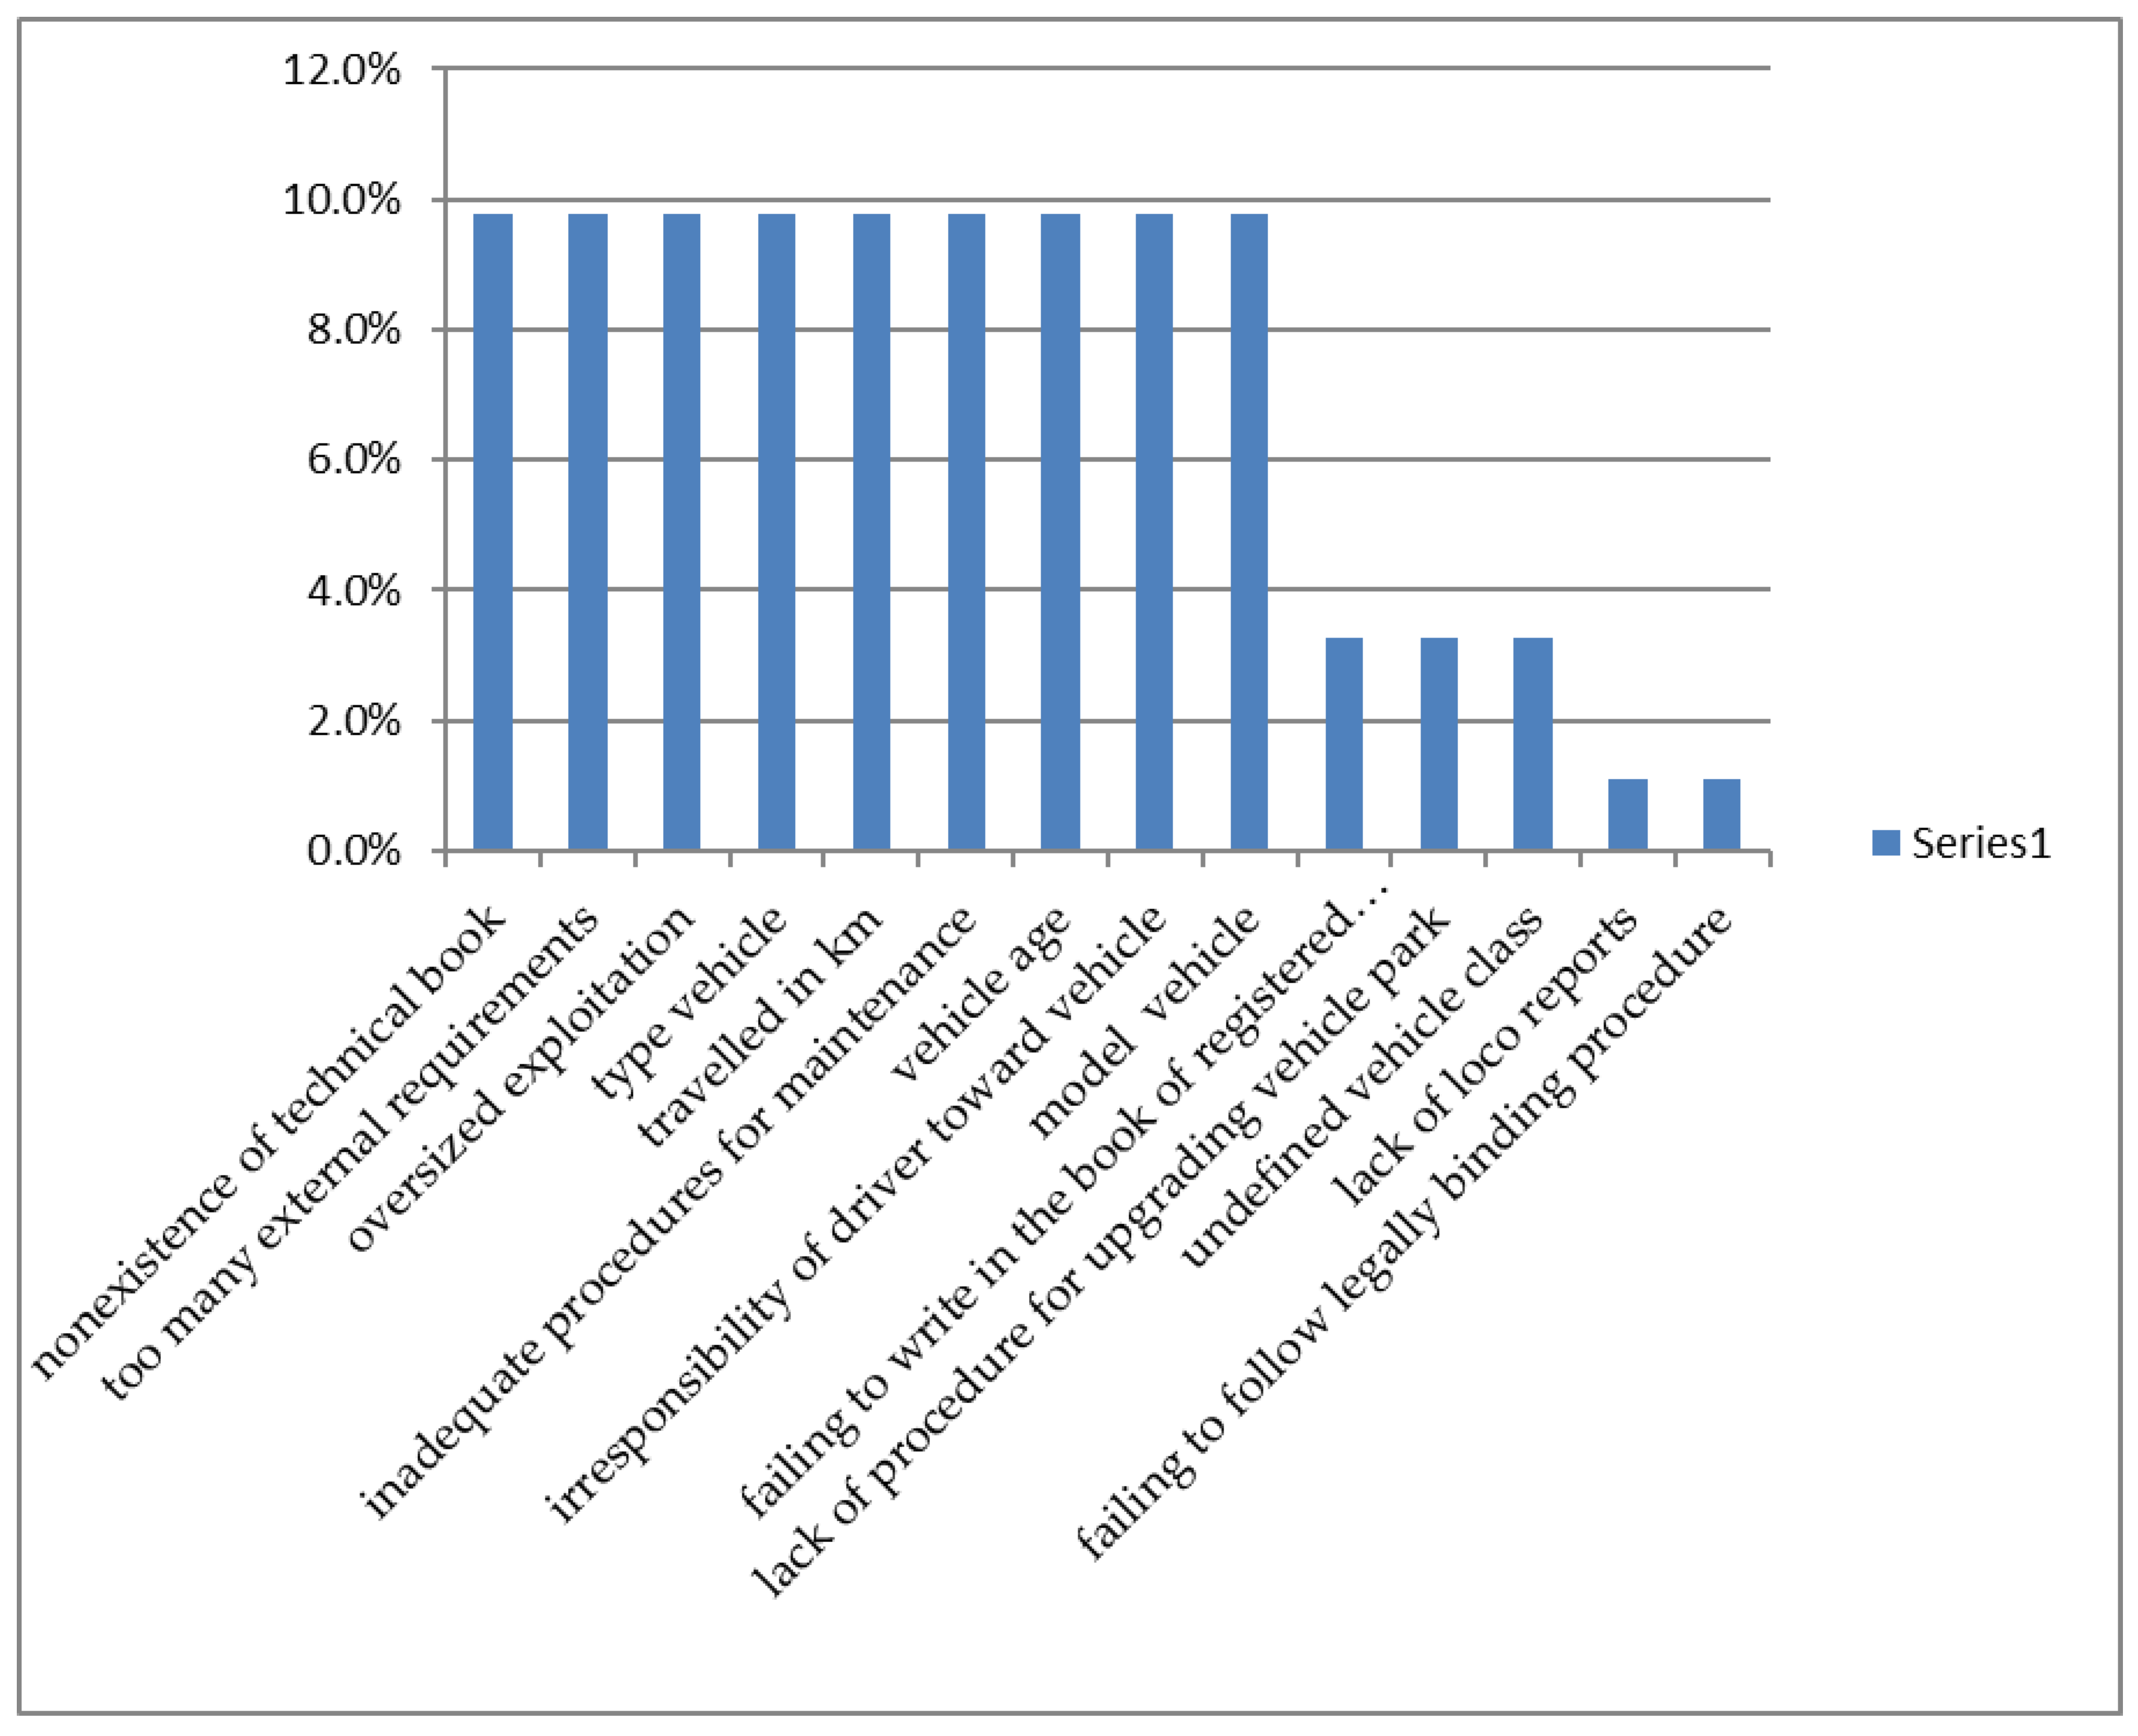
- the nonexistence of a technical book;
- too many external requirements;
- oversized exploitation;
- the type of the vehicle;
- kilometers travelled;
- inadequate procedures for maintenance;
- the age of the vehicle (year of production);
- the irresponsibility of the driver;
- the model of the vehicle.
- detect errors and prevent them before they occur;
- reduce costs by identifying potential improvements early in the development cycle;
- evaluate the process/product from a new perspective.
- documents are updated;
- the training required due to the changes in the processes is carried out;
- an audit plan is created for control activities.
4. Conclusions
Author Contributions
Funding
Conflicts of Interest
References
- Desai, T.N.; Shrivastava, R.L. Six Sigma A New Direction to Quality and Productivity Management. In Proceedings of the World Congress on Engineering and Computer Science WCECS 2008, San Francisco, CA, USA, 22–24 October 2008; ISBN 978-988-98671-0-2. Available online: http://www.iaeng.org/publication/WCECS2008/WCECS2008_pp1047-1052.pdf (accessed on 1 March 2020).
- Kumar, S.; Satsangi, P.S.; Prajapati, D.R. Six Sigma an excellent tool for process improvement—A case study. Int. J. Scie. Eng. Res. 2011, 2, 1–10. [Google Scholar]
- Sujova, A.; Simanova, L.; Marcinekova, K. Sustainable Process Performance by Application of Six Sigma Concepts: The Research Study of Two Industrial Cases, Sustainability, Sustainable Business Models, Printed Edition of the Special Issue Published in Sustainability. Sustainability 2016, 8, 260. [Google Scholar] [CrossRef]
- Habul, A.; Pilav-Velić, A.; Kremić, E. Improvements of Business Process by Implementing Six Sigma Model. In Proceedings of the Scientific Conference with International Participation “Quality 2011”, Neum, Bosnia & Herzegovina, 01–04 June 2011; pp. 7–12. Available online: http://www.quality.unze.ba/zbornici/QUALITY%202011/002-Q11-017.pdf (accessed on 3 March 2020).
- Bratić, D.; Optimizing the Printing Concept on Six Sigma Principles. Ph. D. Thesis, University of Zagreb, Faculty of Graphic Arts, Zagreb, Croatia, 2015; p. 15. Available online: https://eprints.grf.unizg.hr/2249/1/Doktorski%20rad%20Bratic%20Diana.pdf (accessed on 15 January 2020).
- Kwak, Y.H.; Anbari, F.T. Benefits, obstacles, and future of six sigma approach. Technovation 2006, 26, 708–715. Available online: https://www.researchgate.net/publication/222518320_Benefits_obstacles_and_future_of_SixSigmaapproach (accessed on 14 March 2020). [CrossRef]
- Lazić, M. Six sigma—Methodology for quality improvement, Festival of quality 2011. In Proceedings of the National Conference on Quality, Faculty of Mechanical Engineering, Center for Quality, Kragujevac, Serbia, 19–21 May 2011; pp. 213–220, ISBN 978-86-86663-69-6. Available online: http://www.cqm.rs/2011/FQ2011/pdf/38/34.pdf (accessed on 12 March 2020).
- Gustafsson, V.; Davidsson, S. Streamlining the Invisible Value Chain Reduction of Losses within Administrative Processes: A Case Study. Bachelor’s Thesis, Linnaeus University, School of Engineering, Växjö, Sweden, 2011. Available online: http://www.diva-portal.org/smash/get/diva2:433853/FULLTEXT01.pdf (accessed on 14 February 2020).
- Lazibat, T.; Baković, T. Six Sigma System for Quality Management, Business Excellence, Zagreb, 2007; Volume 1, pp. 55–66. Available online: https://hrcak.srce.hr/38522 (accessed on 12 March 2020).
- Rajković, V. Lean Six Sigma Concept, Festival of quality 2012. In Proceedings of the National Conference on Quality, Faculty of Mechanical Engineering, Center for Quality, Kragujevac, Serbia, 07–09 June 2012; pp. 39–43, ISBN 978-86-86663-83-2. Available online: http://www.cqm.rs/2012/cd1/pdf/39/05.pdf (accessed on 10 March 2020).
- Anthony, P.; Behnoee, B.; Hassanpour, M.; Pamucar, D. Financial performance evaluation of seven Indian chemical companies. Decis. Mak. Appl. Manag. Eng. 2019, 2, 81–99. [Google Scholar] [CrossRef]
- Biswas, S.; Bandyopadhyay, G.; Guha, B.; Bhattacharjee, M. An ensemble approach for portfolio selection in a multi-criteria decision making framework. Decis. Mak. Appl. Manag. Eng. 2019, 2, 138–158. [Google Scholar] [CrossRef]
- Jankovic, A.; Popovic, M. Methods for assigning weights to decision makers in group AHP decision-making. Decis. Mak. Appl. Manag. Eng. 2019, 2, 147–165. [Google Scholar] [CrossRef]
- Russell, R.; Taylor, B. Operations Management—Creating Value along the Supply Chain; John Wiley & Sons, Inc.: Hoboken, NJ, USA, 2011; Available online: http://jtelen.free.fr/0MARINE%20bouquins/%5BRoberta_S._Russell,_Bernard_W._Taylor%5D_Operations(Bookos.org).pdf (accessed on 15 January 2020).
- Pyzdek, T.; Keller, P. The Six Sigma Handbook: A Complete Guide for Green Belts, Black Belts and Managers at all Levels, 3rd ed.; The McGraw-Hill Companies, Inc.: New York, NY, USA, 2009; ISBN 978-0-07-162337-7. [Google Scholar]
- The Council for Six Sigma Certification. Six Sigma—A Complete Step-by-Step Guide: A Complete Training & Reference Guide for White Belts, Yellow Belts, Green Belts, and Black Belts; The Council for Six Sigma Certification: Buffalo, WY, USA, 2018; ISBN 978-1732592650. Available online: https://www.sixsigmacouncil.org/wp-content/uploads/2018/08/Six-Sigma-A-Complete-Step-by-Step-Guide.pdf (accessed on 15 January 2020).
- Fung, P. Design for Six Sigma, Power Point Presentation. 2015. Available online: http://www.hksq.org/DFSS-STP-150124-Peter.pdf (accessed on 18 February 2020).
- Krishnan, R.; Prasath, A. Six Sigma Concept and DMAIC Implementation. IJBMR 2013, 3, 111–114. [Google Scholar]
- Sindha, N.; Suthar, K. Review on Implementation of Six Sigma DMAIC Methodology in Manufacturing Industries. IJSTE 2017, 3. Available online: http://www.ijste.org/articles/IJSTEV3I8064.pdf (accessed on 20 February 2020).
- Kaid, H.; Noman, M.; Nasr, E.; Alkahtani, M. Six Sigma DMAIC phases application in Y company: A case study. Int. J. Collab. Enterp. 2016, 5, 181–197. [Google Scholar] [CrossRef]
- Miski, A. Improving Customers Service at IKEA Using Six Sigma Methodology. Int. J. Sci. Eng. Res. 2014, 5, 1712–1720. Available online: https://www.ijser.org/researchpaper/Improving-Customers-Service-at-IKEA-Using-Six-Sigma-Methodology.pdf (accessed on 16 February 2020).
- Griffin, A.; Hauser, J. The Voice of the Customer. Mark. Sci. 1993, 12, 1–27. [Google Scholar] [CrossRef]
- Ezeonwumelu, E.P.; Ozuomba, S.; Kalu, C. Development of Swim Lane Workflow Process Map for Enterprise Workflow Management Information System (Wfmis): A Case Study of Comsystem Computer and Telecommunication Ltd (Cctl) Eket. Eur. J. Eng. Technol. 2015, 3. Available online: https://pdfs.semanticscholar.org/49fa/9f7f3585c2bf7223b6d334256b4d868eac0a.pdf (accessed on 20 January 2020).
- DaimlerChrysler Corporation, Ford Motor Company, and General Motors Corporation. Statistical Process Control (SPC) Reference Manual. 2005. Available online: https://www.academia.edu/7829906/AIAG_Statistical_Process_Control_SPC_2nd_Edition (accessed on 20 January 2020).
- Sharma, K.D.; Srivastava, S. Failure Mode and Effect Analysis (FMEA) Implementation: A Literature Review. J. Adv. Res. Aeronaut. Space Sci. 2018, 5, 1–17. Available online: https://www.researchgate.net/publication/333209894_Failure_Mode_and_Effect_Analysis_FMEA_Implementation_A_Literature_Review (accessed on 18 February 2020).
- Liu, H.; Deng, X.; Jiang, W. Risk Evaluation in Failure Mode and Effects Analysis Using Fuzzy Measure and FuzzyIntegral. Symmetry 2017, 9, 162. [Google Scholar] [CrossRef]
- Dobrosavljević, A.; Urošević, S. Analysis of Business Process Management Defining and Structuring Activities in Micro, Small and Medium—Sized Enterprises. Oper. Res. Eng. Sci. Appl. 2019, 2, 40–54. [Google Scholar] [CrossRef]
- Badi, I.; Shetwan, A.; Hemeda, A. A Grey-Based Assessment Model to Evaluate Health-Care Waste Treatment Alternatives in Libya. Oper. Res. Eng. Sci. Appl. 2019, 2, 92–106. [Google Scholar] [CrossRef]
- Petrovic, G.; Mihajlovic, J.; Cojbasic, Z.; Madic, M.; Marinkovic, D. Comparison of three fuzzy MCDM methods for solving the supplier selection problem. Facta Univ. Ser. Mech. Eng. 2019, 17, 455–469. [Google Scholar] [CrossRef]
- Sunny Diyaley, S.; Chakraborty, S. Optimization of multi-pass face milling parameters using metaheuristic algorithms. Facta Univ. Ser. Mech. Eng. 2019, 17, 365–383. [Google Scholar]


| Project Phase | Candidate Six Sigma Tools |
|---|---|
| Define | Project charter; VOC tools (surveys, focus groups, letters, comment cards); Process map; QFD; SIPOC; Benchmarking; Project planning and management tools; Pareto analysis |
| Measure | Measurement system analysis; Process behavior charts (SPC); Exploratory data analysis; Descriptive statistics; Data mining; Run charts; Pareto analysis |
| Analysis | Cause-and-effect diagrams; Tree diagrams; Brainstorming; Process behavior charts (SPC); Process maps; Design of experiments; Enumerative statistics (hypothesis tests); Inferential statistics (Xs and Ys); Simulations |
| Improve | Force field diagrams; FMEA; 7M tools; Project planning and management tools; Prototype and pilot studies; Simulations |
| Control | SPC; FMEA; ISO 900x; Change budgets, bid models, cost estimating models; Reporting system |
| Process Input (X) | Total | |
|---|---|---|
| nonexistence of a technical book | 9 | 90 |
| too many external requirements | 9 | 90 |
| oversized exploitation | 9 | 90 |
| type of vehicle | 9 | 90 |
| distance travelled in km | 9 | 90 |
| inadequate procedures for maintenance | 9 | 90 |
| vehicle age | 9 | 90 |
| irresponsibility of driver toward vehicle | 9 | 90 |
| model vehicle | 9 | 90 |
| failing to write in the book of registered defects | 3 | 30 |
| lack of procedure for upgrading vehicle park | 3 | 30 |
| undefined vehicle class | 3 | 30 |
| lack of loco reports | 1 | 10 |
| failing to follow legally binding procedure | 1 | 10 |
| Process Inputs | Potential Failure Mode | Potential Effect(s) of Failure | Severity | Potential Cause(s)/Mechanisms of Failure | Occurrence | Current Process Controls Detection |
|---|---|---|---|---|---|---|
| Data on maintenance costs | Unreliable information | Difficulties in spare parts planning | 10 | Lack of technical booklet | 10 | There is none |
| Fuel consumption | Incorrect information on consumption | Increased fuel costs | 10 | Non-existence of device for control of reported consumption (e.g., sonde) | 9 | Travel order |
| Operating time of machine | Lack of adequate information | Increased costs of fuel, lubricants and parts | 10 | Machines lack mechanical counter (mileage) or it is incorrigible | 9 | Travel order |
| Vehicle | Inadequate number of people per vehicle | Increased costs | 9 | Lack of rulebook for usage of official company cars | 9 | Dispatcher |
| Vehicle | Inadequate number of people per vehicle | Decreased vehicle availability | 7 | Lack of rulebook for usage of official company cars | 5 | Dispatcher |
| Vehicle | Bad vehicle condition (due to multi years of exploitation) | Increased maintenance costs | 9 | Lack of rulebook for renovation of vehicle fleet | 8 | There is none |
| Driver | Driver irresponsibility relating to vehicle | Increased maintenance costs | 5 | Lack of control at writing in travel order | 4 | Technical rectitude officer |
| Detection | R P N | Recommended Action (s) | Responsible Person | Responsibility | Target Completion Date | S E V | O C C | D E T | R P N |
|---|---|---|---|---|---|---|---|---|---|
| 10 | 1000 | Create technical booklet for each vehicle | Office worker in transport service | Design and make a form of technical booklet | Implemented | 10 | 2 | 1 | 20 |
| 9 | 810 | Install sondes for big consumers | Management, transport service chief, specialized firm for sondes installation | Upon proposal by transport service chief, management makes decision, expert from Firm installs sondes | In agreement with management of the company | 10 | 1 | 1 | 10 |
| 9 | 810 | Installation/repair of mechanical counter | Transport service | Repair and installation of mechanical counter | In agreement with management of the company | 10 | 1 | 1 | 10 |
| 2 | 162 | Make rulebook for usage by official company | Management | Management appoints board for making Rulebook | In agreement with management of the company | 9 | 3 | 2 | 54 |
| 2 | 70 | Make rulebook for usage by official company | Management | Management appoints board for making Rulebook | In agreement with management of the company | 7 | 2 | 2 | 28 |
| 10 | 720 | Make a rulebook on transport fleet renewal | Management, transport service | Management makes decision upon suggestion by transport service | In agreement with management of the company | 9 | 2 | 1 | 18 |
| 9 | 180 | Dispatcher issues new order upon delivery of old order and its control | Dispatcher | Control of old order | In agreement with management of the company | 5 | 1 | 1 | 5 |
| No. | Critical Xs | Problem Caused by This Critical X | Action Plan to Eliminate/Reduce the Problem |
|---|---|---|---|
| 1 | Untimely filling in travel order | Incorrect fuel consumption | Dispatcher issues new order upon delivery and control of old order |
| 2 | Inadequate and untimely filling in local order | Increased fuel consumption; Reduction of vehicle availability (lack of fleet information) | Dispatcher compares travel order to daily evidence with inputs–outputs of gatekeeper |
| 3 | Technical booklet | Increased maintenance costs; Unreliable data on technical rectitude of vehicle; Not detailed plan of spare parts | Make technical booklet, make decision on way of filling in and usage of technical booklet |
| 4 | Nonexistence of procedures for repair by third party | Not defined who initiates procedure; Increased maintenance costs; long repair time | Create procedure for repair by third party |
| 5 | Nonexistence of procedures for regular maintenance | Untimely services (checks); increased maintenance costs (failure on parts); Unconscientious acting of driver | Create procedure for regular maintenance |
| 6 | Inefficient exploitation of vehicle fleet | Increased costs (bad distribution of travelers per vehicle); Decreased availability of vehicle | Rule book on cost-effective usage of vehicle park |
| 7 | Non-existence of motor hour counter | Not specified: operating time of machine, consumption of fuel, lubricant and parts | Install or repair motor hour counter; specify fuel consumption per motor-hour counter for each machine; create monthly reports on consumption of fuel, lubricants and parts for each vehicle |
| Uncontrolled costs of vehicle exploitation and maintenance | |||
| 8 | Sondes for big consumers | Unreliable data on fuel consumption | Installation of sondes for trucks, construction machines, buses |
| 9 | Lack of buses | Large costs for hiring out buses | Procurement of new bus |
| 10 | Nonuniformity of vehicles | Higher costs of maintenance; inconstant fuel consumption; Workman not trained for various vehicle types | To form a work team with task to make a suggestion, e.g., about the projection of the structure of a vehicle park |
| 11 | Nonexistence of rule book for renewal of vehicle park | Age vehicle; increased maintenance costs; Increased costs for engagement of third parties’ services | Write a rule book for renewal of the vehicle park |
| Improvement Effects | Response Person | Remark | Target Completion Data |
|---|---|---|---|
| Decrease of fuel consumption, increased control of drivers | Dispatcher, driver | In agreement with management | |
| Decrease number of unnecessary "outgoings", fuel costs decrease and maintenance, greater availability of vehicle | Dispatcher, porter, driver | In agreement with management | |
| Detailed data on consumption, repair history, equipment ascribed to vehicle, detailed plan of spare parts procurement, decreased maintenance costs | Administrative worker in transport service | Implemented: technical booklet designed | |
| Decreased maintenance costs, shorter time of repair, defined reliability, more settled business doing | Quality management representative | The procedure has to contain the following: Reason for sending vehicle repair by third party; Report signed by contractor; Broken (unrepaired) part returned | In agreement with management |
| Decreased maintenance costs, greater reliability of vehicle | Quality management representative | In agreement with management | |
| Better vehicle availability, decreased costs of maintenance and fuel | Management | Instructions for the rational use of a particular type of vehicle by number of passengers, mileage, the number of vehicles | In agreement with management |
| Reliable information on consumption of fuel and operating time of machine for each vehicle/machine Better control of exploitation costs | The drill crew manager | In agreement with management | |
| Reliable data on fuel consumption | Management | In agreement with management | |
| Decreased costs of hiring out bus, increased availability of bus for own needs | Management | In agreement with management | |
| Reduce maintenance costs; constant fuel consumption; reduced number of trainings for workmen | Commission on proposal of management | In agreement with management | |
| Recent and reliable vehicle park with reduced costs of maintenance | Commission on proposal of management | In agreement with management |
| PROCESS IDENTIFICATION | SPECIFICATION & MEASUREMENTS | ||
|---|---|---|---|
| What is Controlled? | Input or Output? | Spec. Limits/Requirements | Measurement Method |
| Travel order | Input | Accurately filled in travel order according to rule book on reasonable usage of vehicle park | By insight to travel order and check list by dispatcher |
| Travel order | Output | Accurate information in travel order on average consumption and/or operating time of working machine/vehicle | On insight in sound readings and vehicle motor hour counter |
| Local order | Input | Local order filled in in a timely manner | On insight into local order by dispatcher |
| Technical booklet | Input | Regular and accurate filling in of technical booklet | On insight into technical booklet |
| Request for repair by third parties | Input | Precise and justified reason for condition | Chief of transport service on insight into signature of workshop chief |
| Report by a third party who performs repair of vehicle (contractor) | Output | Accurately filled in report in accordance with performed repair | "Domestic" person compares report to actual conditions |
| SAMPLING STRATEGY | ACTION & DOCUMENTATION | ||
|---|---|---|---|
| Frequency | Who/What Measures | Where Recorded | Decision Rule/Corrective Action |
| On occasion of closing each Travel Order | Dispatcher | Book (dispatcher) | If travel order is not duly filled in, dispatcher sends it back for driver to correct/ament it and does not issue a new one without a duly filled in previous one. |
| On occasion of closing each Travel order | Dispatcher | Book (dispatcher) | If travel order is not duly filled in, dispatcher sends it back for driver to correct/ament it and does not issue a new one without a duly filled in previous one. |
| On occasion of closing each local order | Dispatcher | Book (dispatcher) | If local order is not filled in in a timely manner, dispatcher acts according to the Role book on usage of business vehicle. |
| After each intervention on the vehicle | Administrative worker in transport service | In technical booklet by signature | If technical booklet is filled in in an adequate and timely manner, the administrative worker in transport service writes his signature. Otherwise, he does not write his signature and acts in accordance with the rule book on the usage of business vehicles. |
| Before each intervention by third parties | Chief of transport service | In request for repair by third parties | Chief of transport service, after the workman, signs the same request and continues the procedure of repair by third parties. Otherwise, he does not sign it and returns the request to workshop chief. |
| Upon each intervention on vehicle by third parties | "Domestic" person delegated by transport service | In the report | "Domestic" person taker over broken part, then signs the report. |
© 2020 by the authors. Licensee MDPI, Basel, Switzerland. This article is an open access article distributed under the terms and conditions of the Creative Commons Attribution (CC BY) license (http://creativecommons.org/licenses/by/4.0/).
Share and Cite
Stanivuk, T.; Gvozdenović, T.; Žanić Mikuličić, J.; Lukovac, V. Application of Six Sigma Model on Efficient Use of Vehicle Fleet. Symmetry 2020, 12, 857. https://doi.org/10.3390/sym12050857
Stanivuk T, Gvozdenović T, Žanić Mikuličić J, Lukovac V. Application of Six Sigma Model on Efficient Use of Vehicle Fleet. Symmetry. 2020; 12(5):857. https://doi.org/10.3390/sym12050857
Chicago/Turabian StyleStanivuk, Tatjana, Tamara Gvozdenović, Jelena Žanić Mikuličić, and Vesko Lukovac. 2020. "Application of Six Sigma Model on Efficient Use of Vehicle Fleet" Symmetry 12, no. 5: 857. https://doi.org/10.3390/sym12050857
APA StyleStanivuk, T., Gvozdenović, T., Žanić Mikuličić, J., & Lukovac, V. (2020). Application of Six Sigma Model on Efficient Use of Vehicle Fleet. Symmetry, 12(5), 857. https://doi.org/10.3390/sym12050857