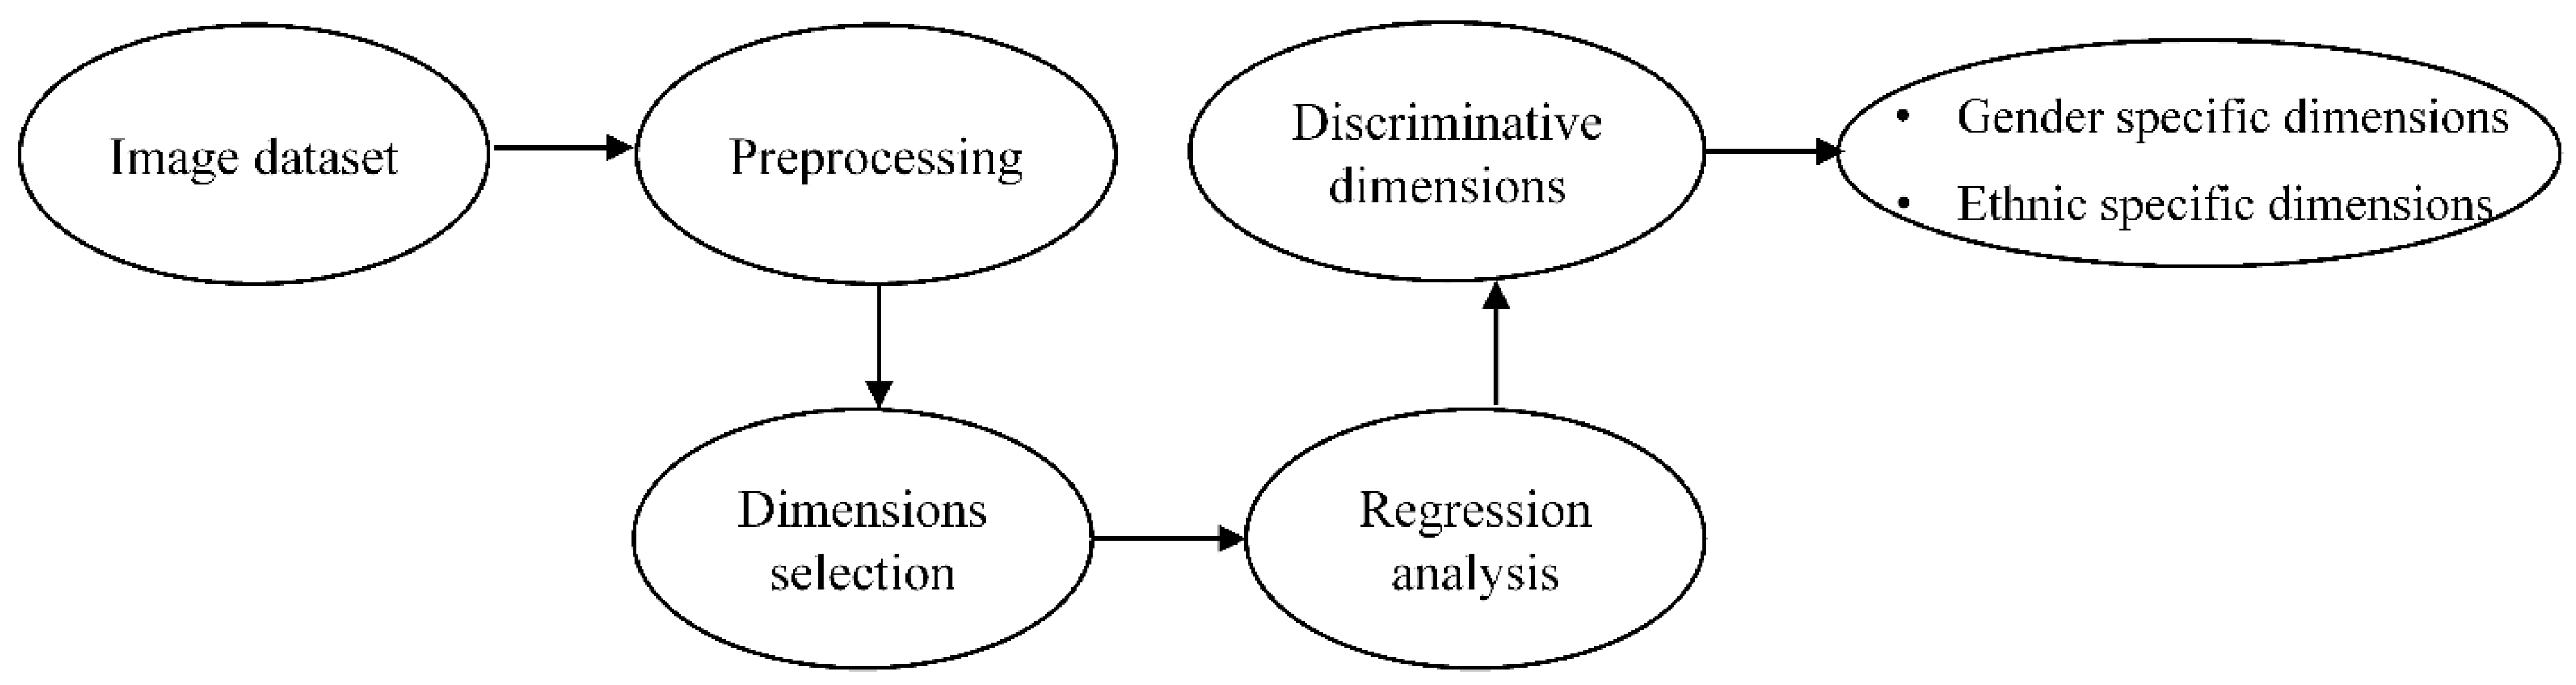
Figure 1.
Proposed methodology.
Figure 1.
Proposed methodology.
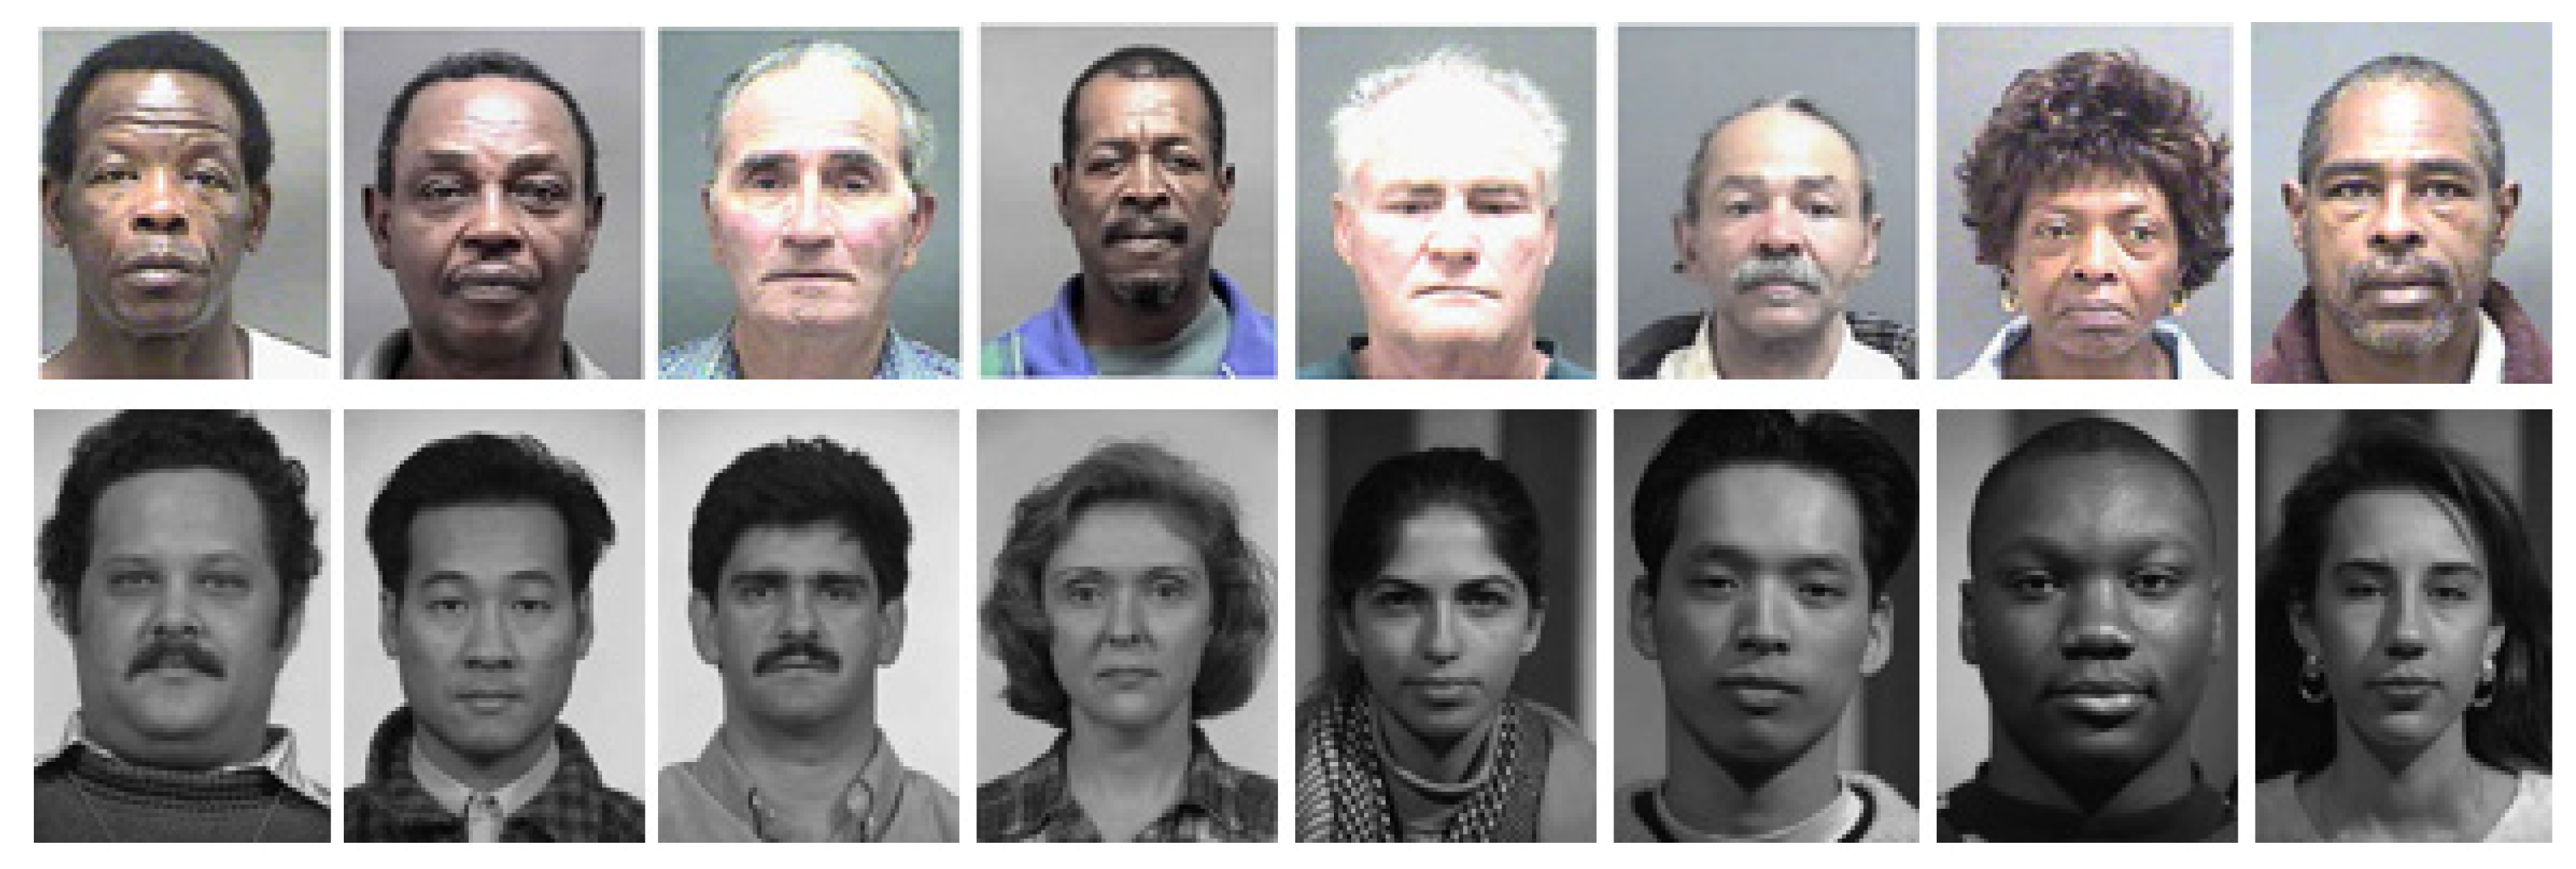
Figure 2.
Example face images from MORPH (top row) and FERET (bottom row).
Figure 2.
Example face images from MORPH (top row) and FERET (bottom row).
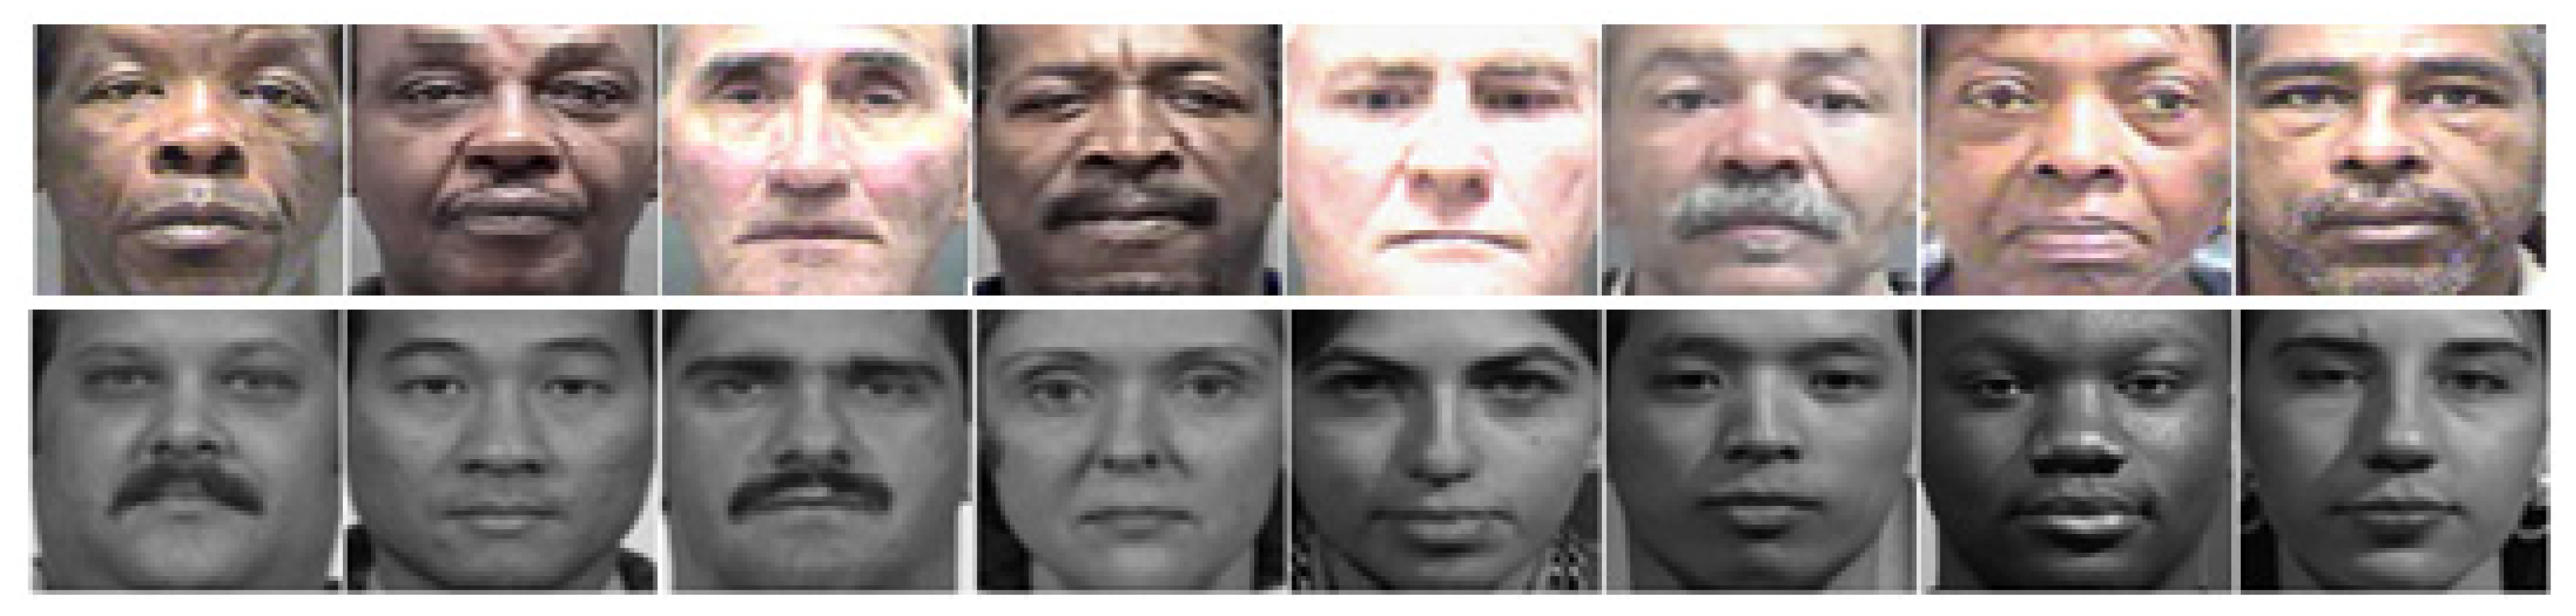
Figure 3.
Example preprocessed face images from MORPH (top row) and FERET (bottom row).
Figure 3.
Example preprocessed face images from MORPH (top row) and FERET (bottom row).
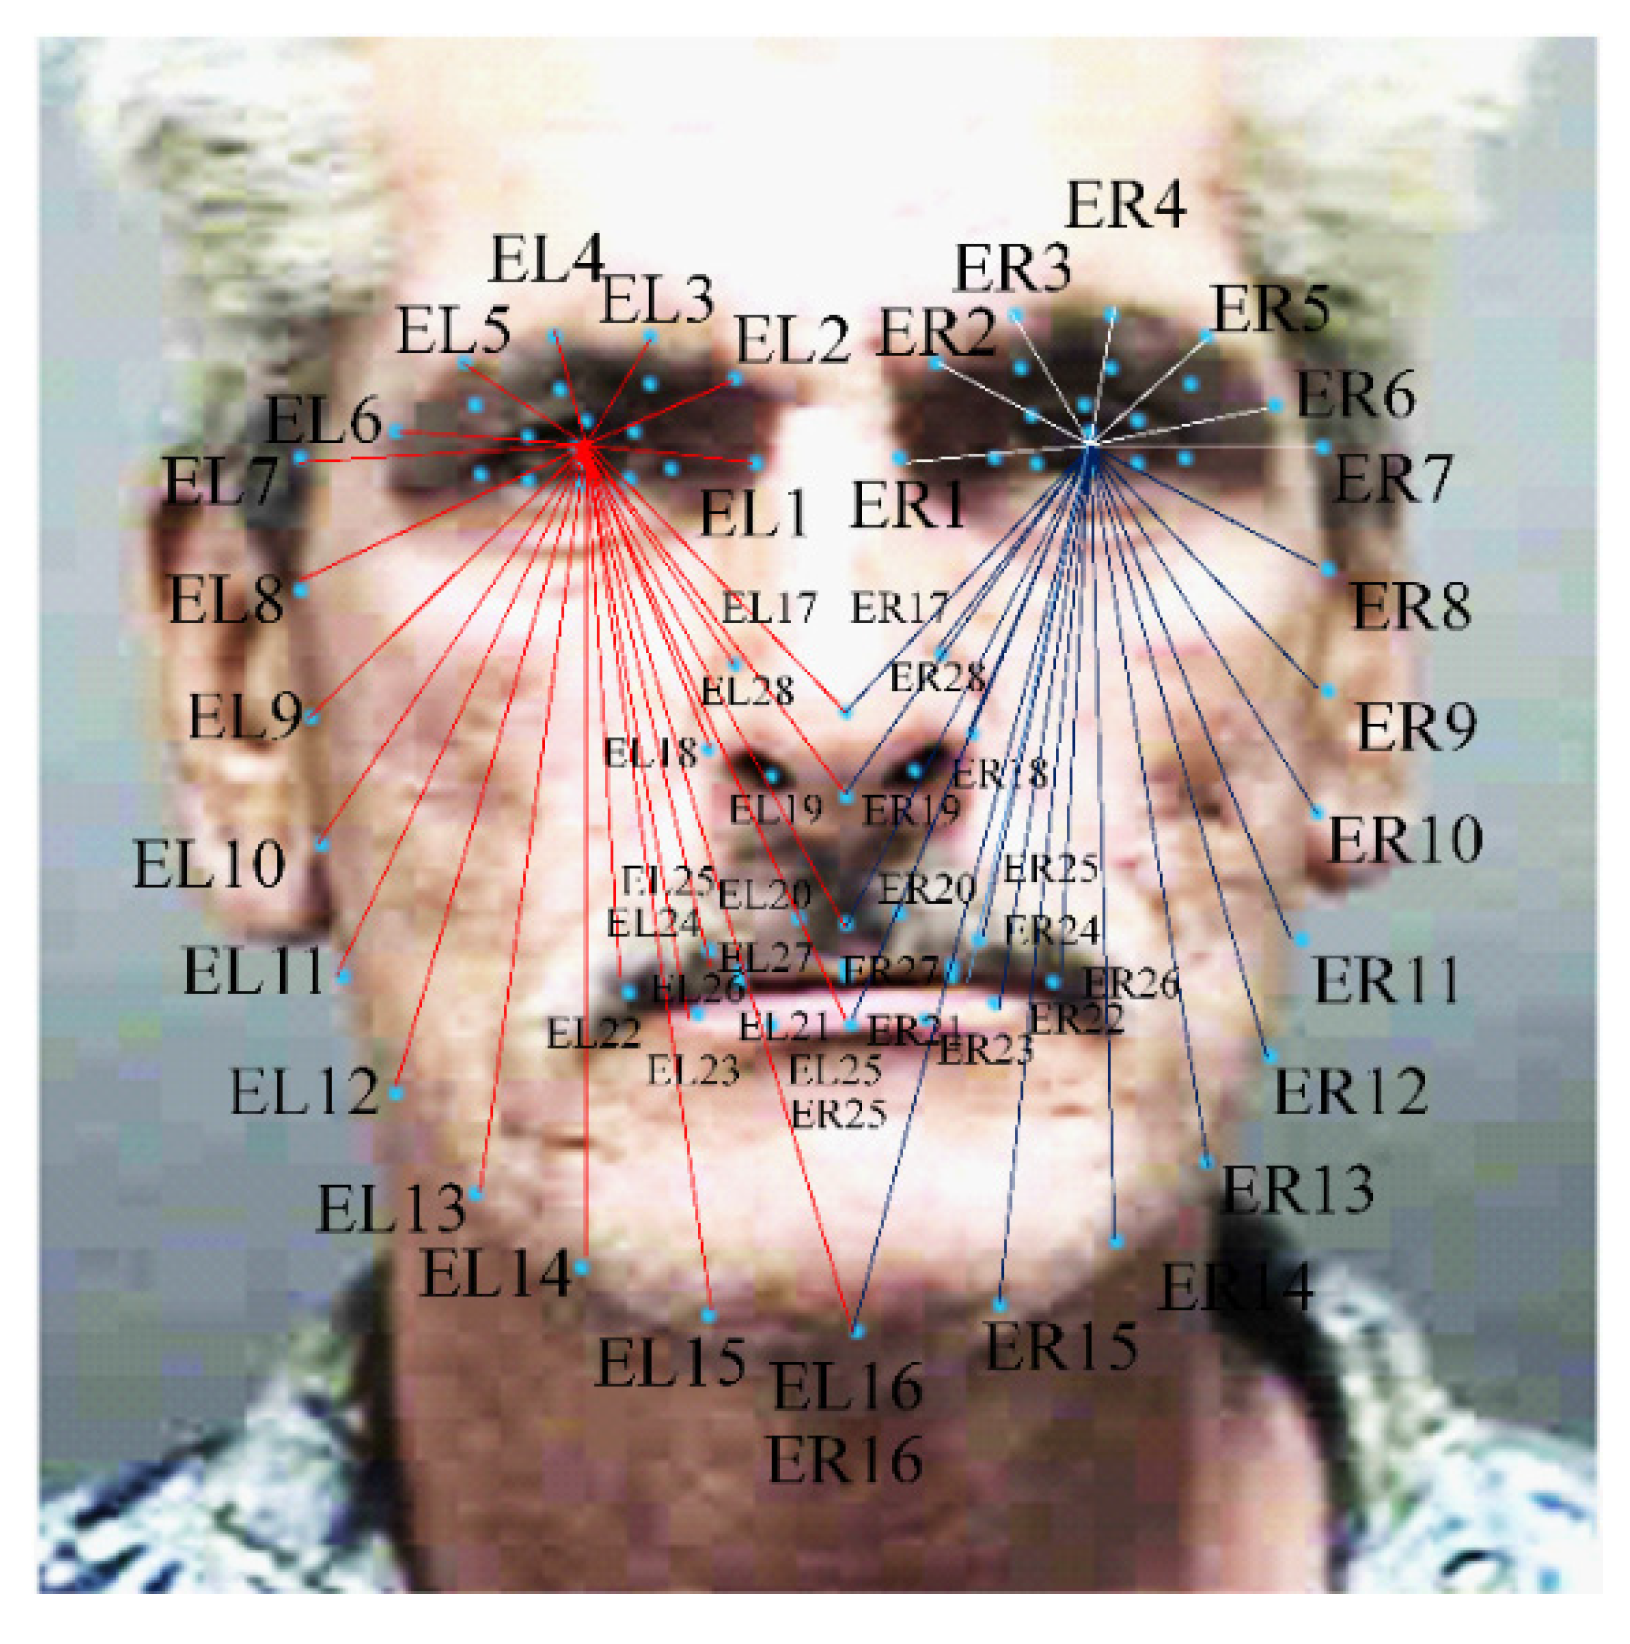
Figure 4.
Graphic representation of the selected bilateral facial dimensions.
Figure 4.
Graphic representation of the selected bilateral facial dimensions.
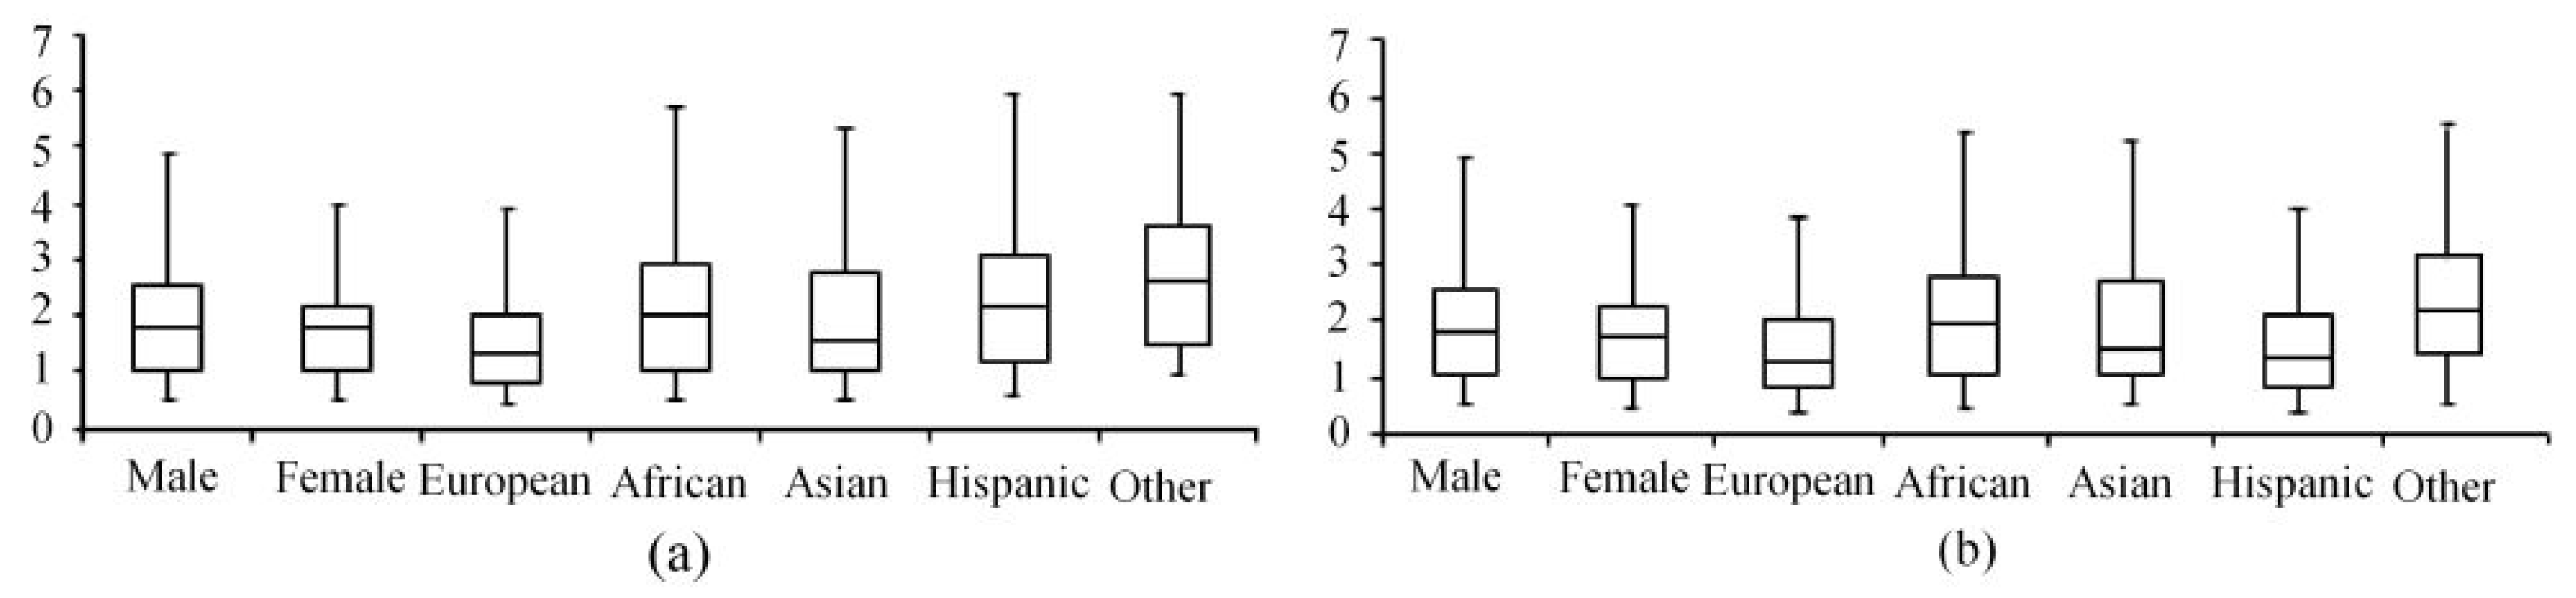
Figure 5.
Box plots showing the mean of asymmetric measurements using the selected method for the (a) MORPH, (b) FERET dataset.
Figure 5.
Box plots showing the mean of asymmetric measurements using the selected method for the (a) MORPH, (b) FERET dataset.
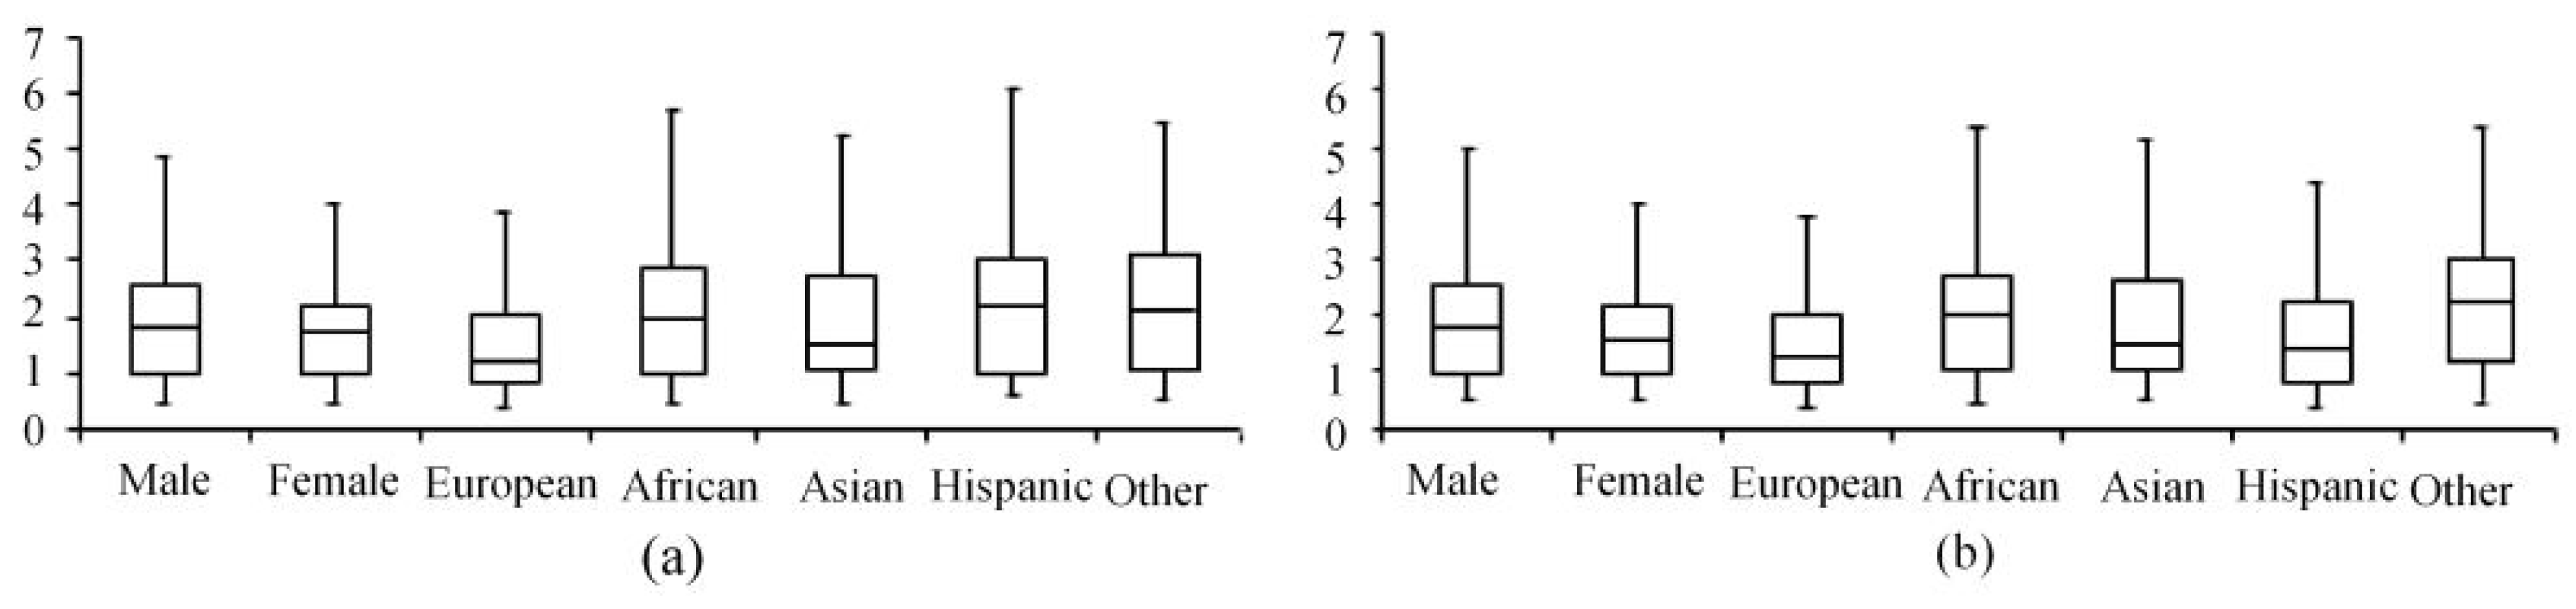
Figure 6.
Box plots showing the mean of asymmetric measurements using AAM with ImagJ for the (a) MORPH, (b) FERET dataset.
Figure 6.
Box plots showing the mean of asymmetric measurements using AAM with ImagJ for the (a) MORPH, (b) FERET dataset.
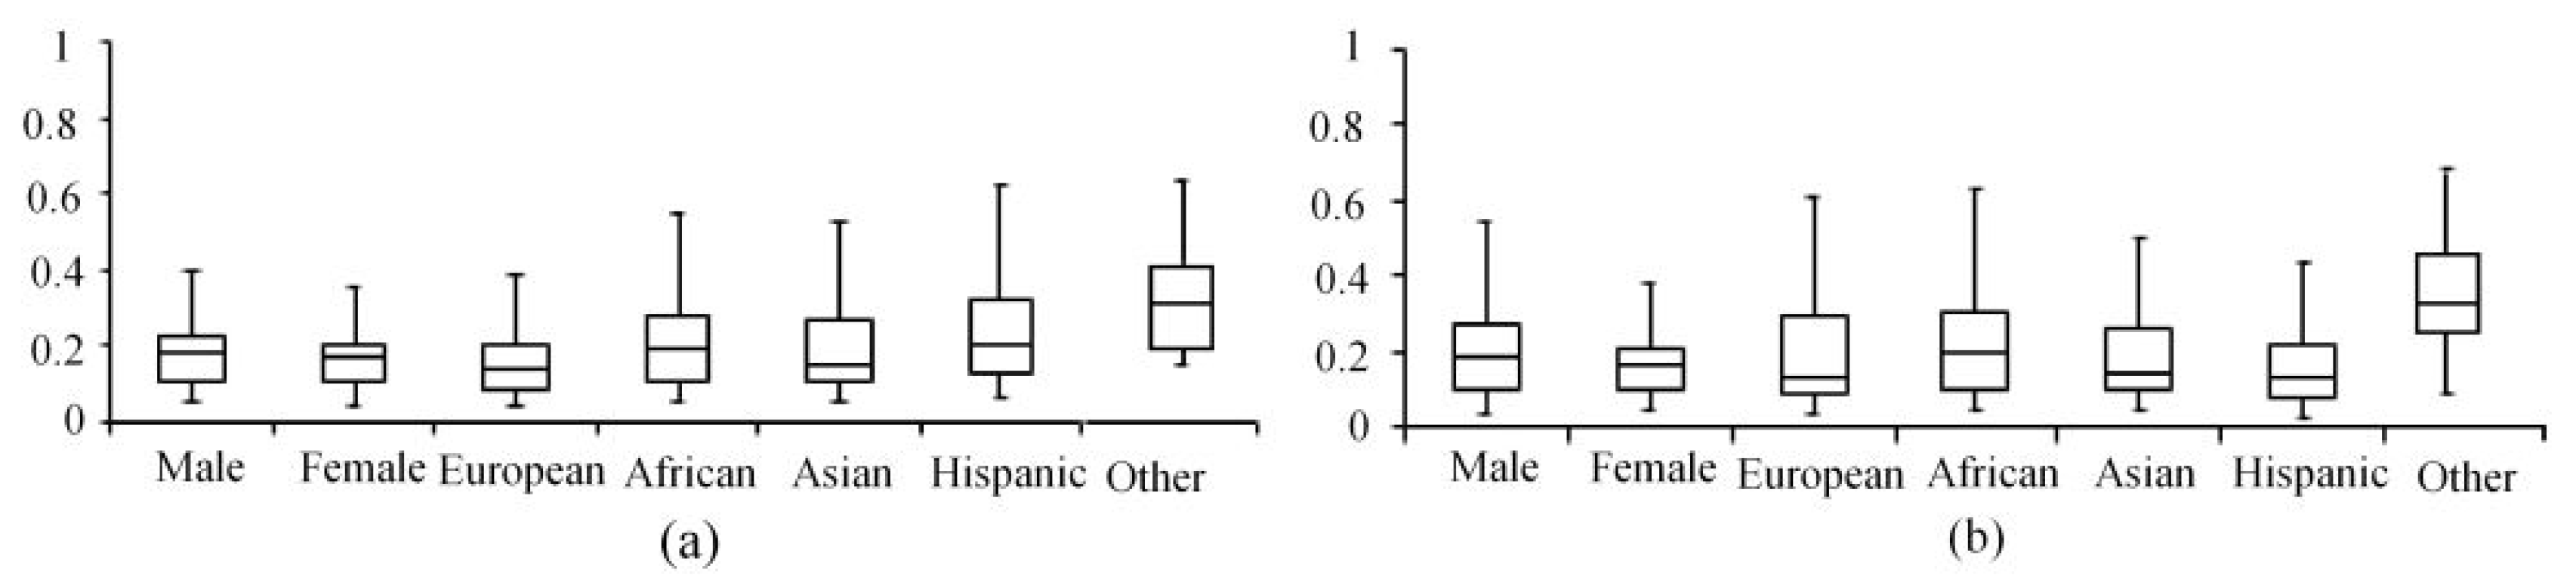
Figure 7.
Box plots showing the standard deviation of asymmetric measurements using the selected method for the (a) MORPH, (b) FERET dataset.
Figure 7.
Box plots showing the standard deviation of asymmetric measurements using the selected method for the (a) MORPH, (b) FERET dataset.
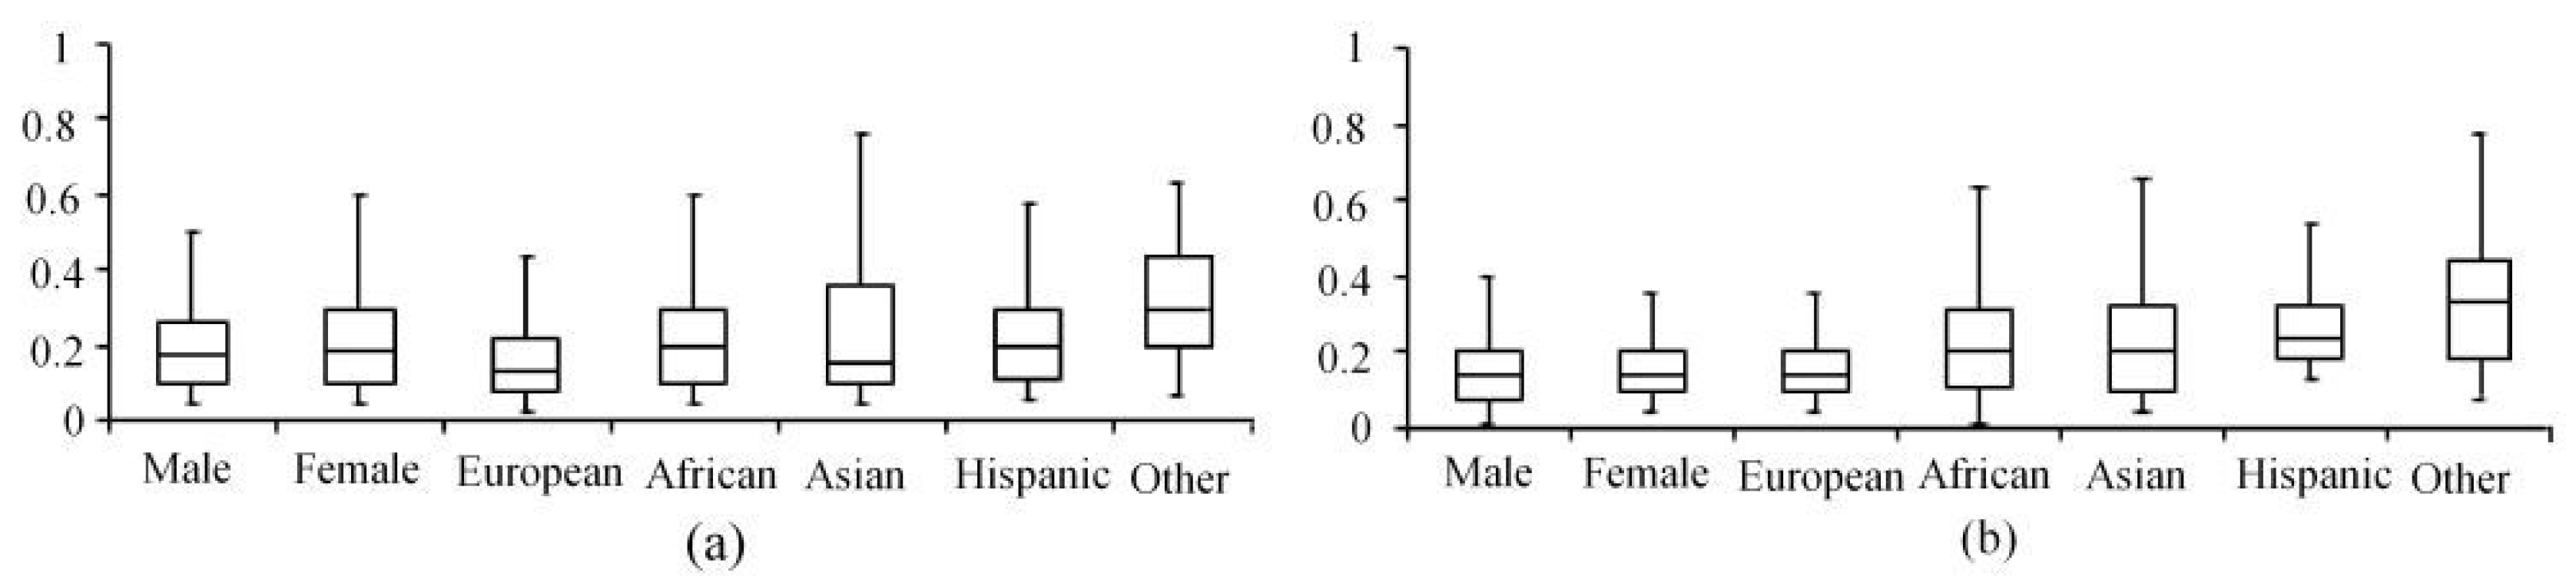
Figure 8.
Box plots showing the standard deviation of asymmetric measurements using AAM with ImagJ for the (a) MORPH, (b) FERET dataset.
Figure 8.
Box plots showing the standard deviation of asymmetric measurements using AAM with ImagJ for the (a) MORPH, (b) FERET dataset.
Figure 9.
Variation in mean values of asymmetric dimensions of male and female subjects from the (a) MORPH, (b) FERET dataset.
Figure 9.
Variation in mean values of asymmetric dimensions of male and female subjects from the (a) MORPH, (b) FERET dataset.
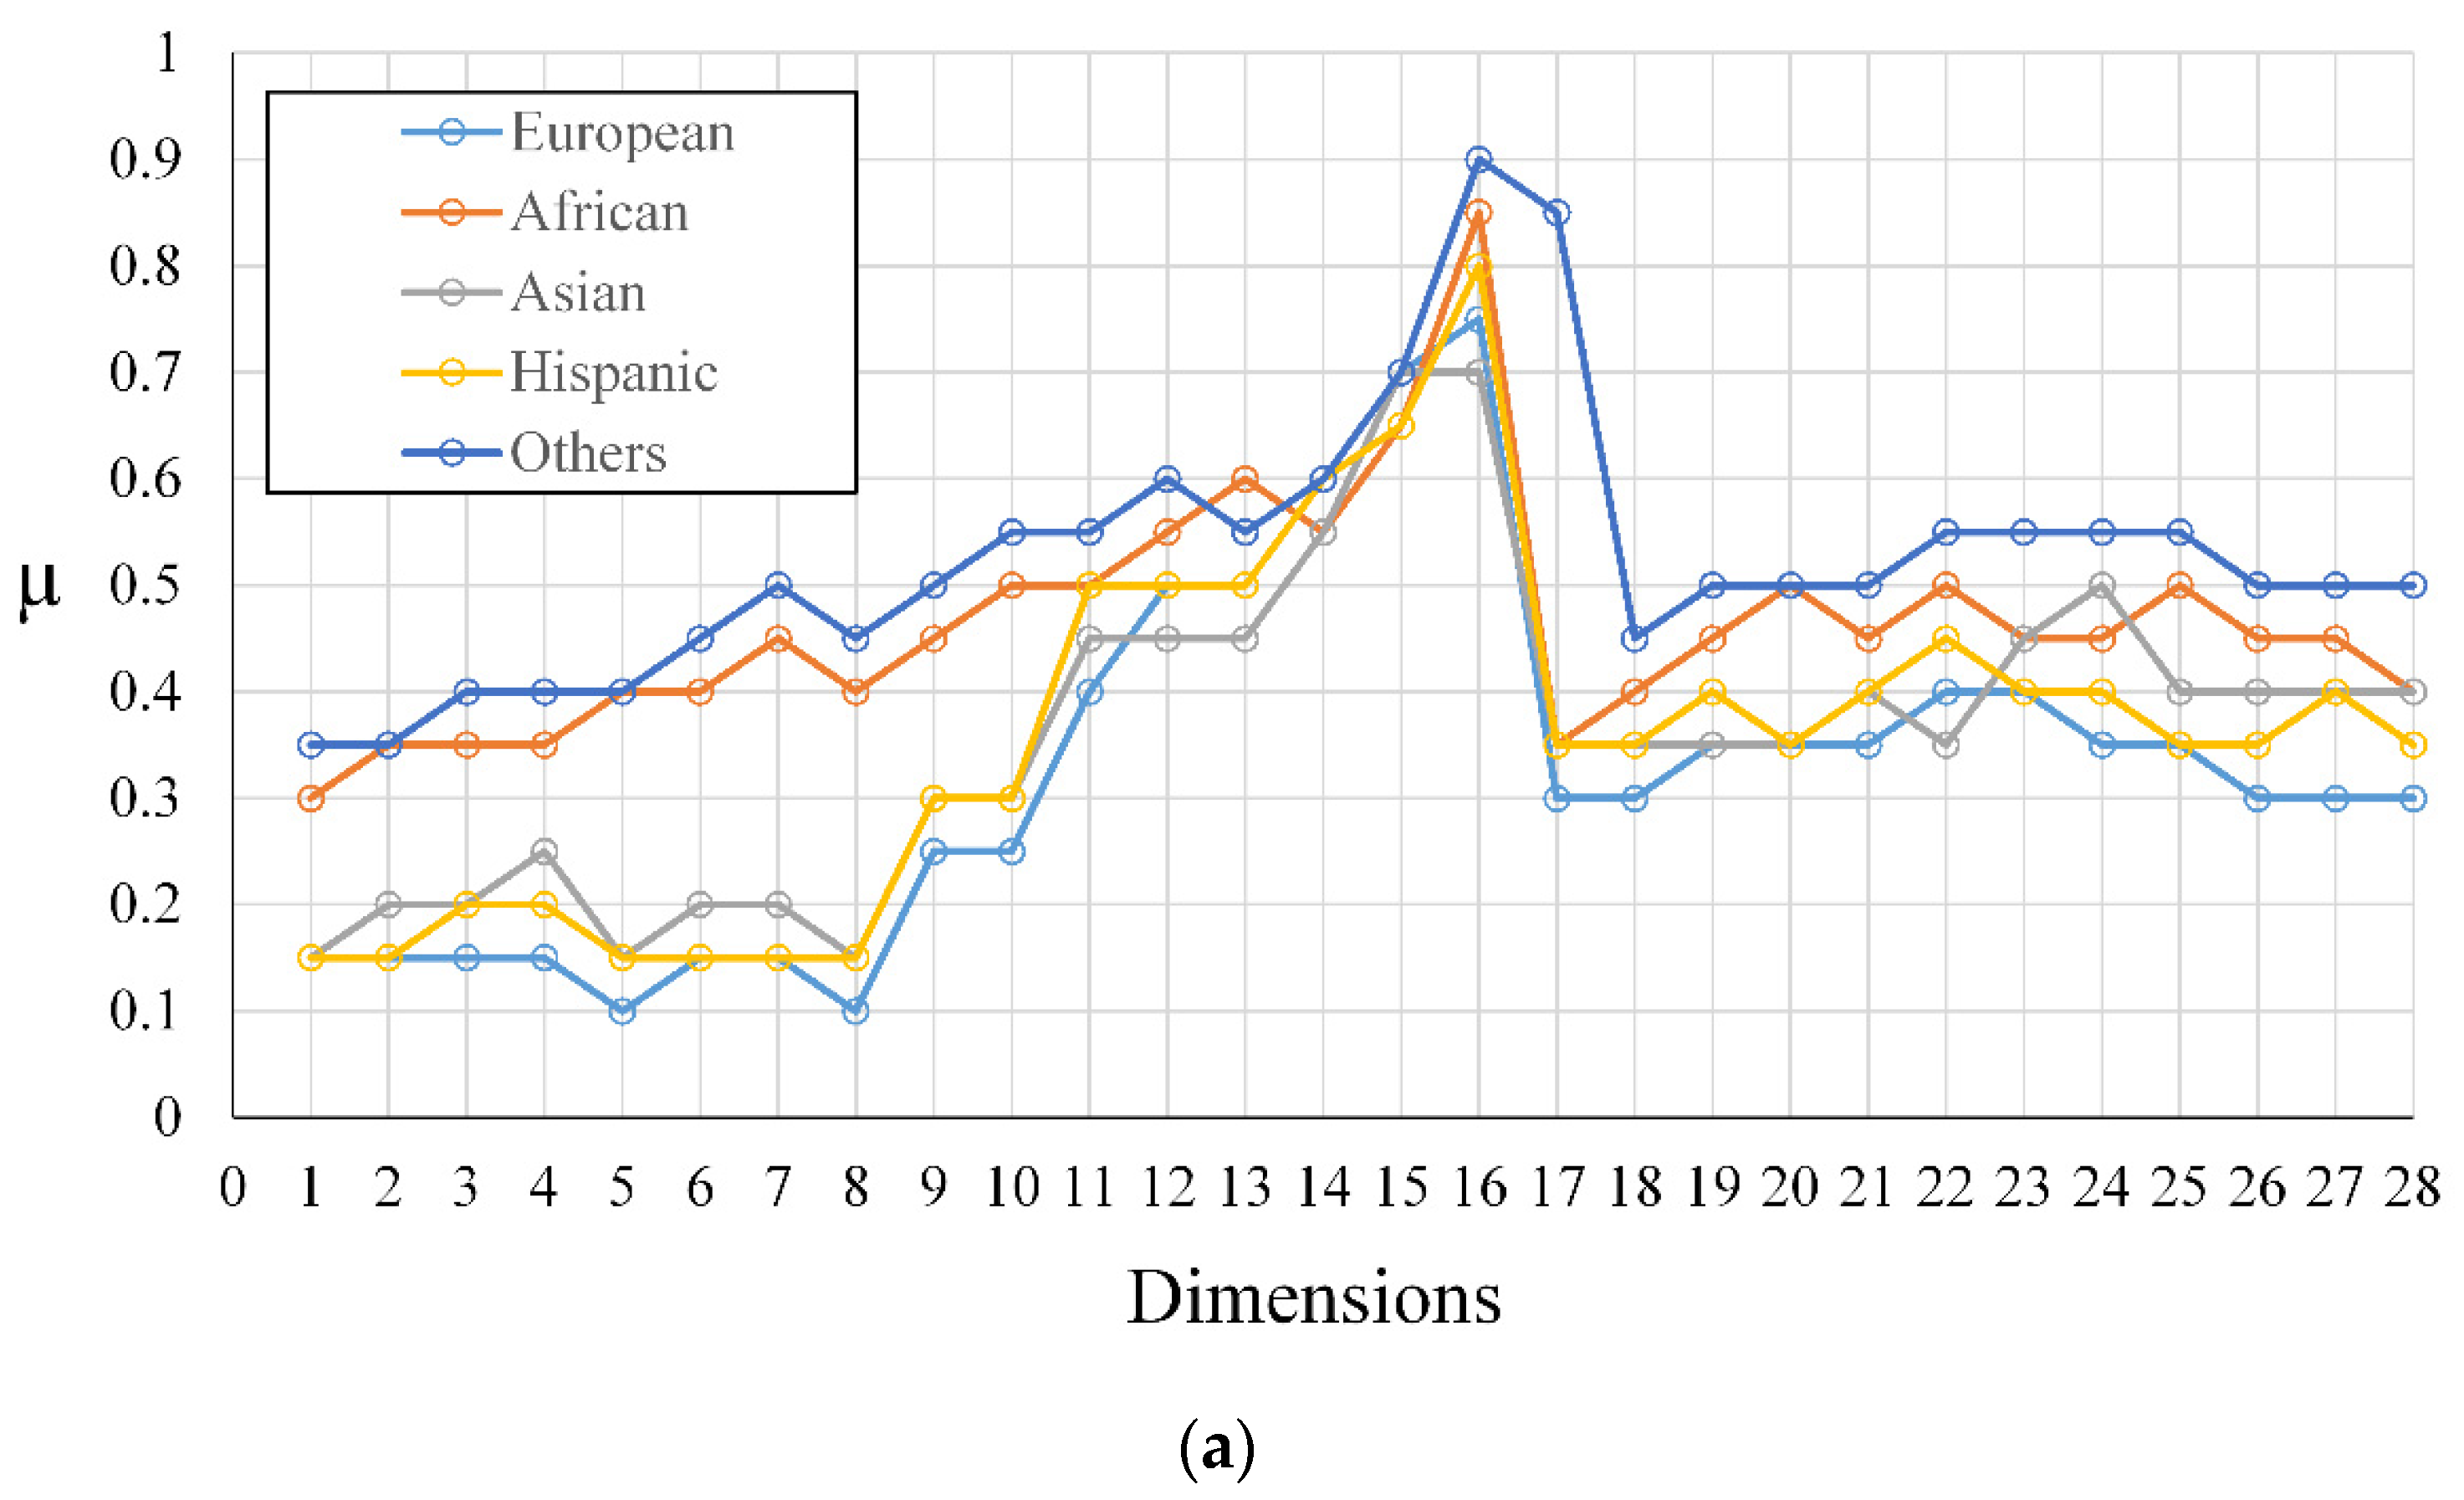
Figure 10.
Variation in mean values of asymmetric dimensions of subjects belonging to different ethnic groups from the (a) MORPH, (b) FERET dataset.
Figure 10.
Variation in mean values of asymmetric dimensions of subjects belonging to different ethnic groups from the (a) MORPH, (b) FERET dataset.
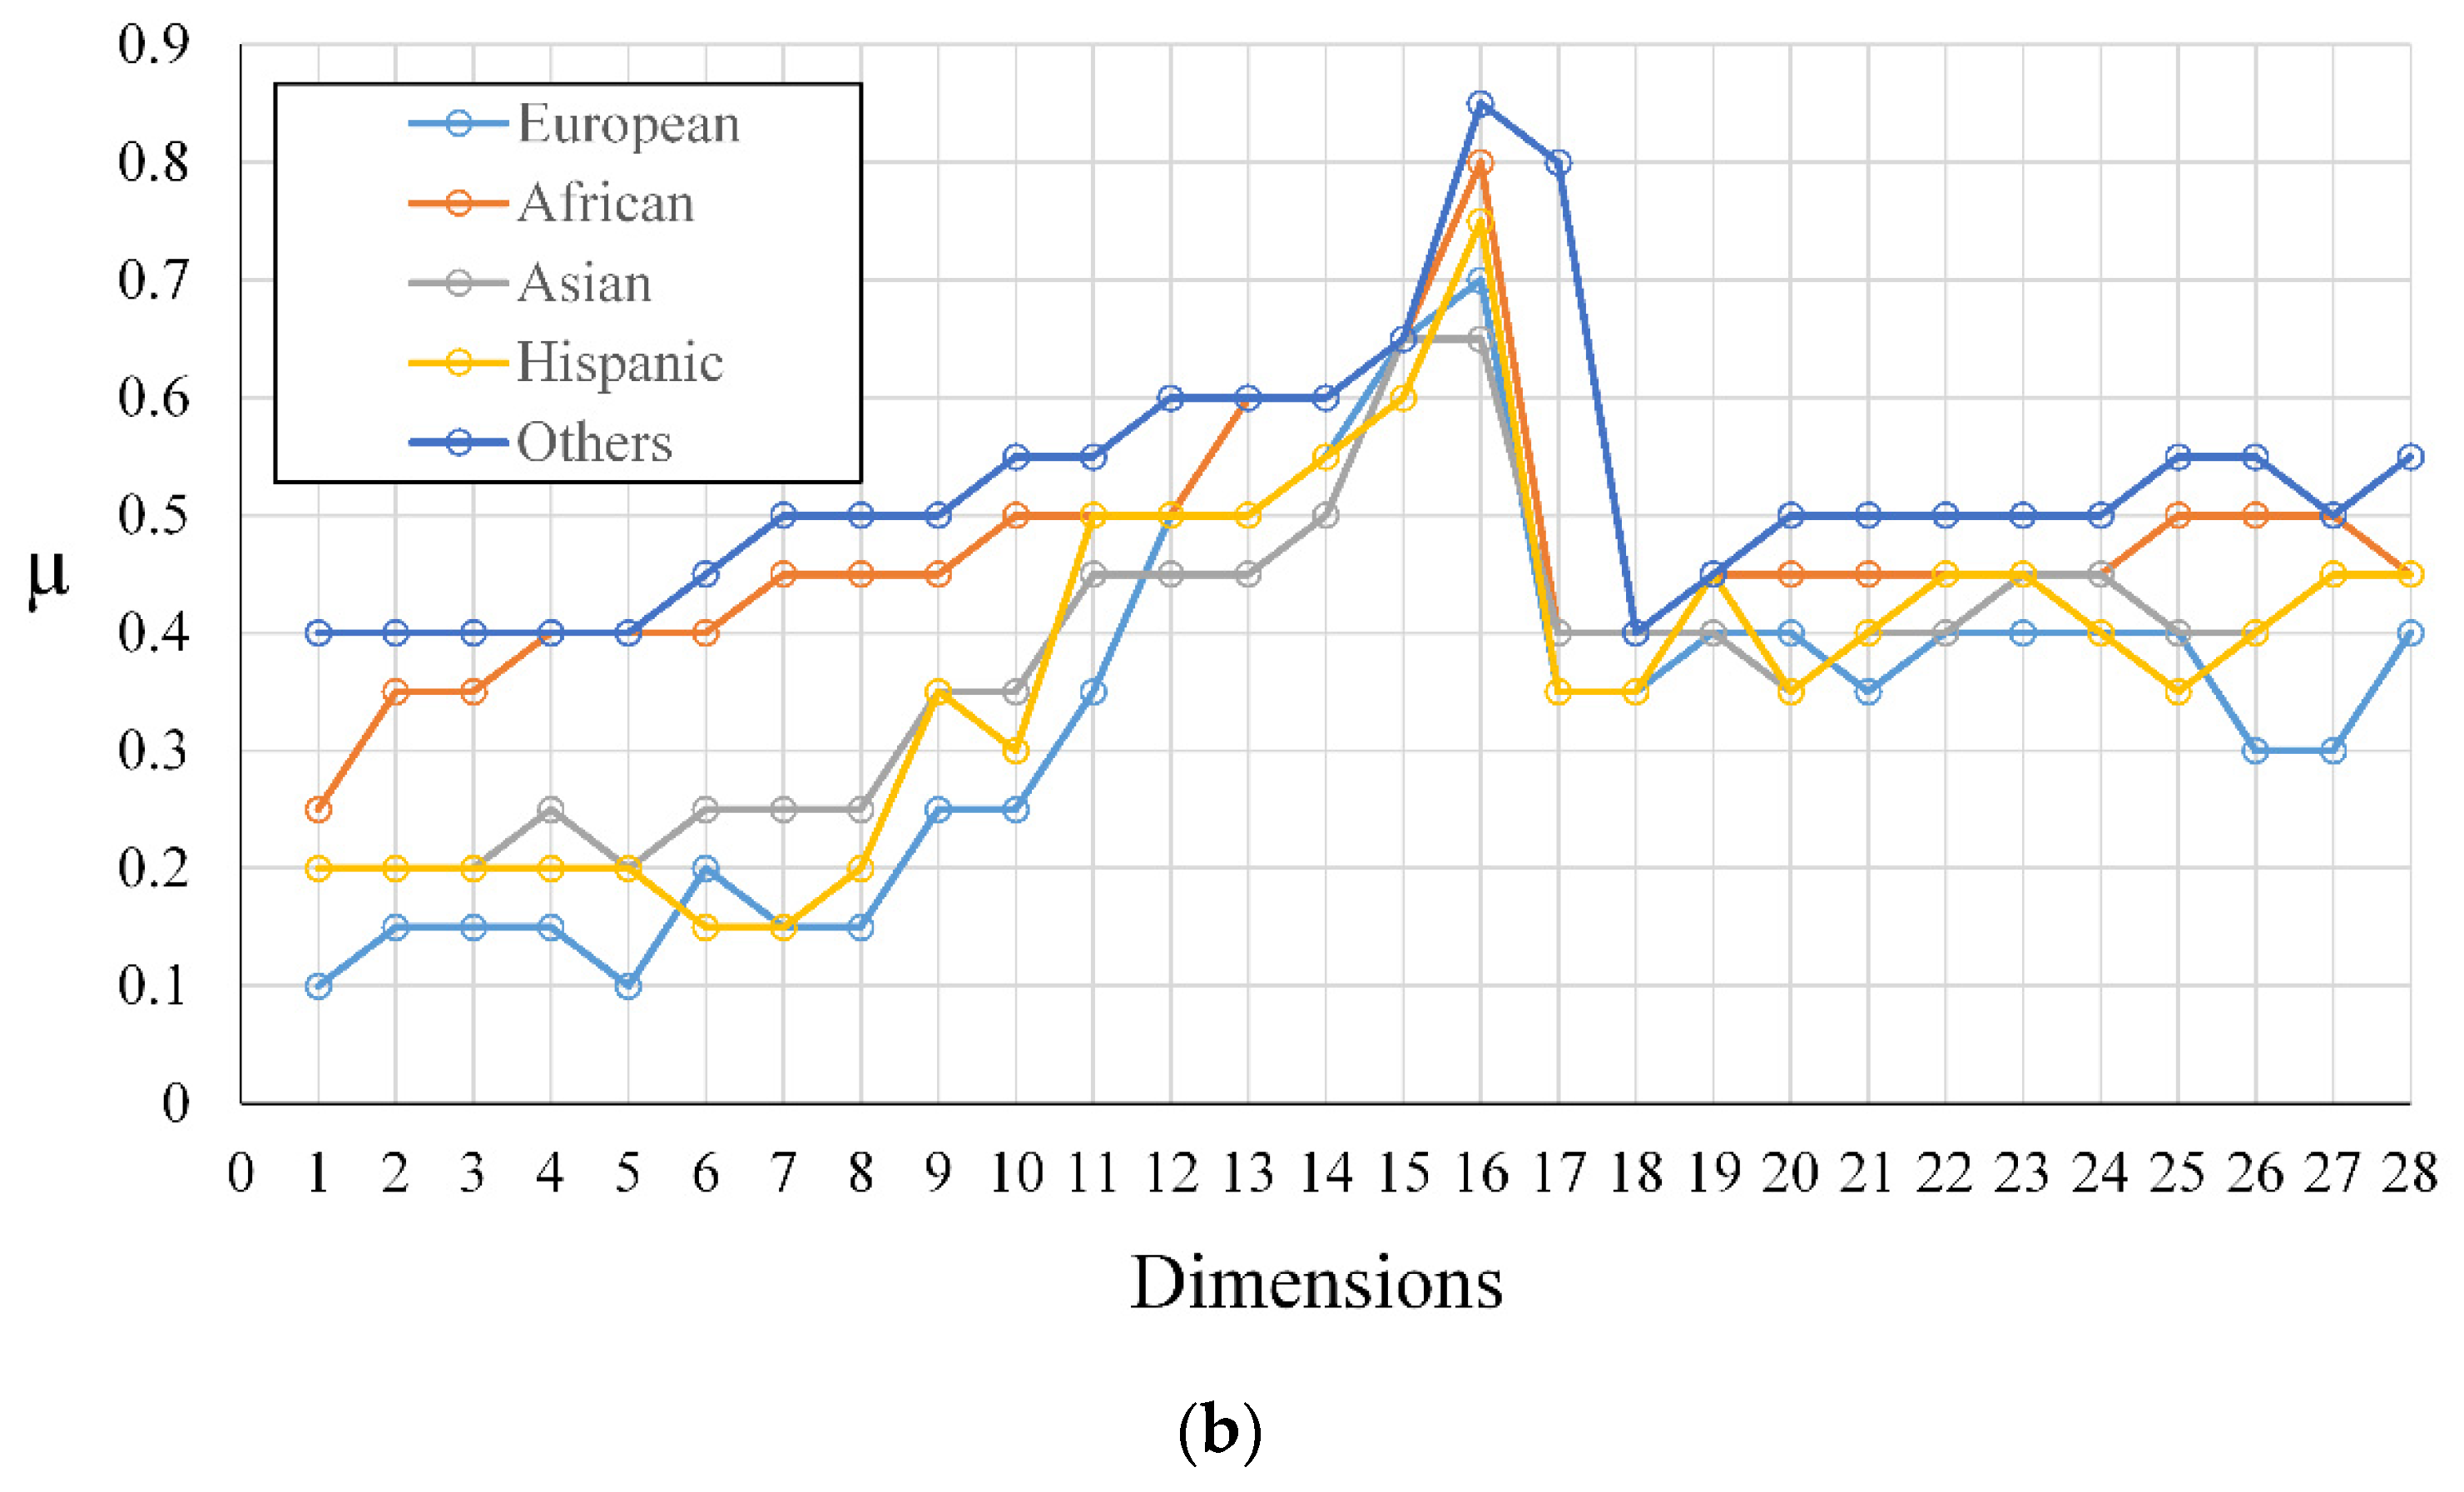
Figure 11.
Collinearity analysis for gender-adjusted asymmetric dimensions against base line dimensions for the (a) MORPH, and (b) FERET dataset.
Figure 11.
Collinearity analysis for gender-adjusted asymmetric dimensions against base line dimensions for the (a) MORPH, and (b) FERET dataset.
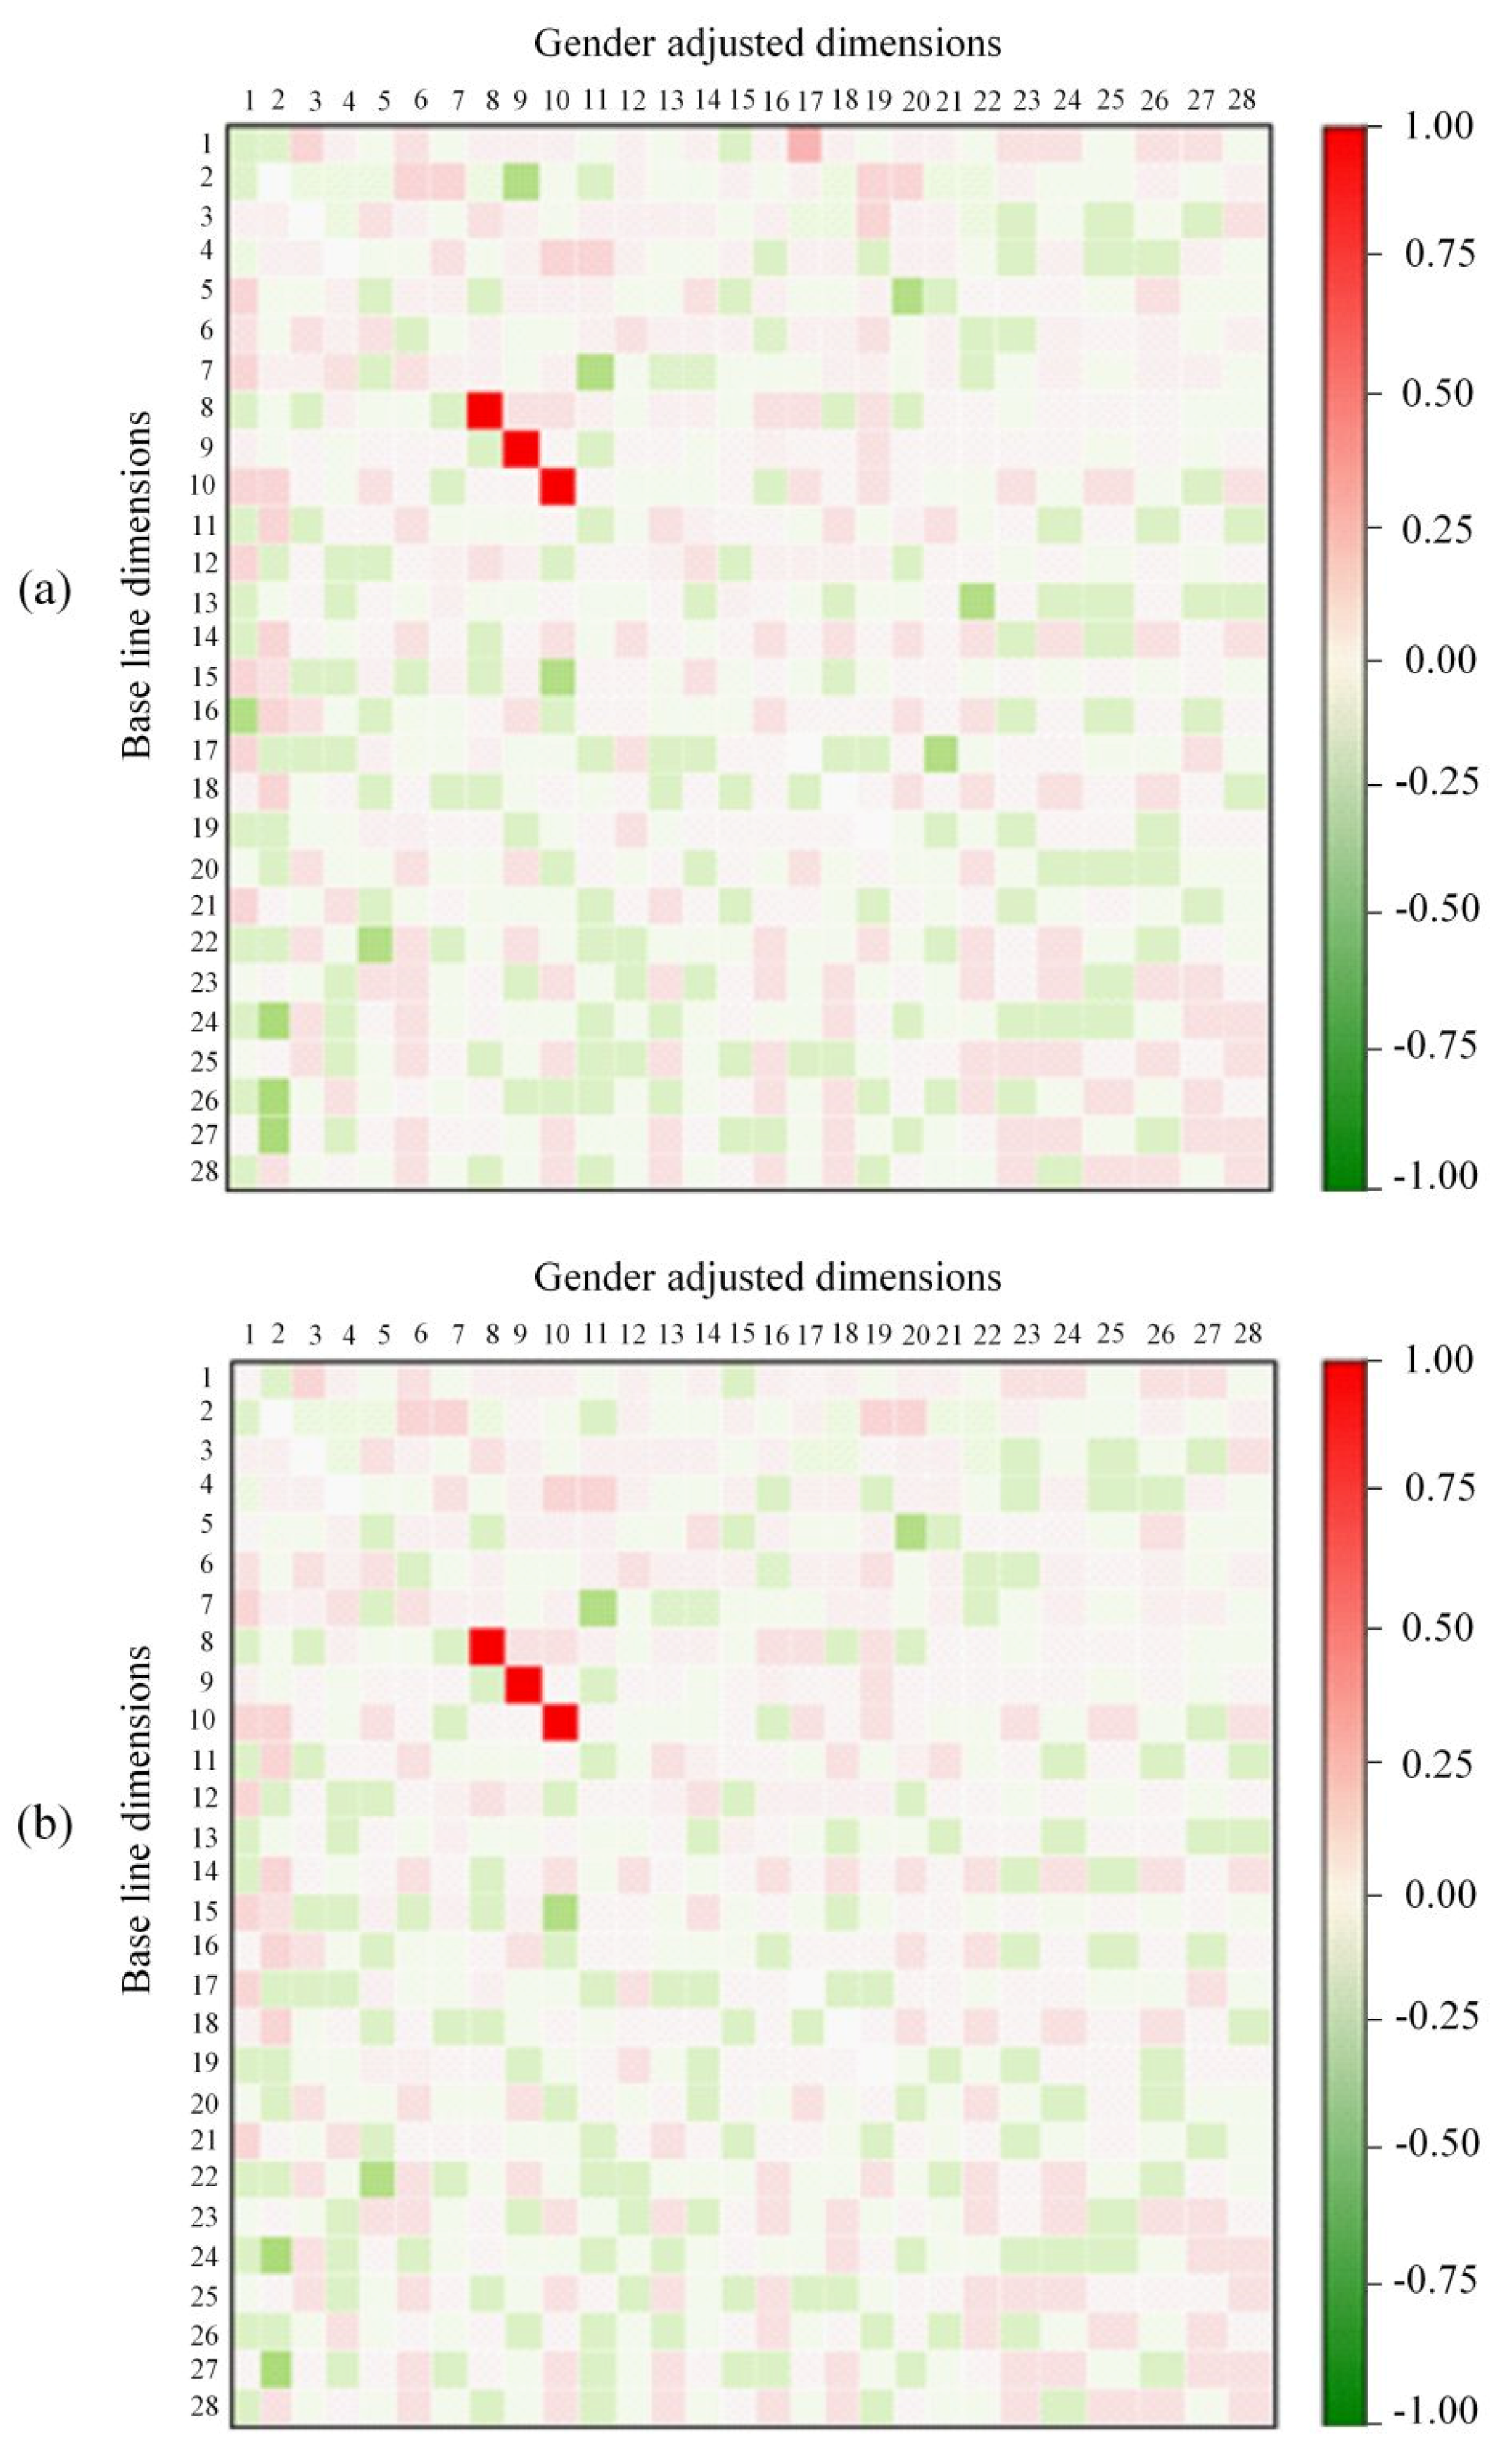
Figure 12.
Collinearity analysis for ethnicity adjusted asymmetric dimensions (African) against base-line dimensions for the (a) MORPH, and (b) FERET dataset.
Figure 12.
Collinearity analysis for ethnicity adjusted asymmetric dimensions (African) against base-line dimensions for the (a) MORPH, and (b) FERET dataset.
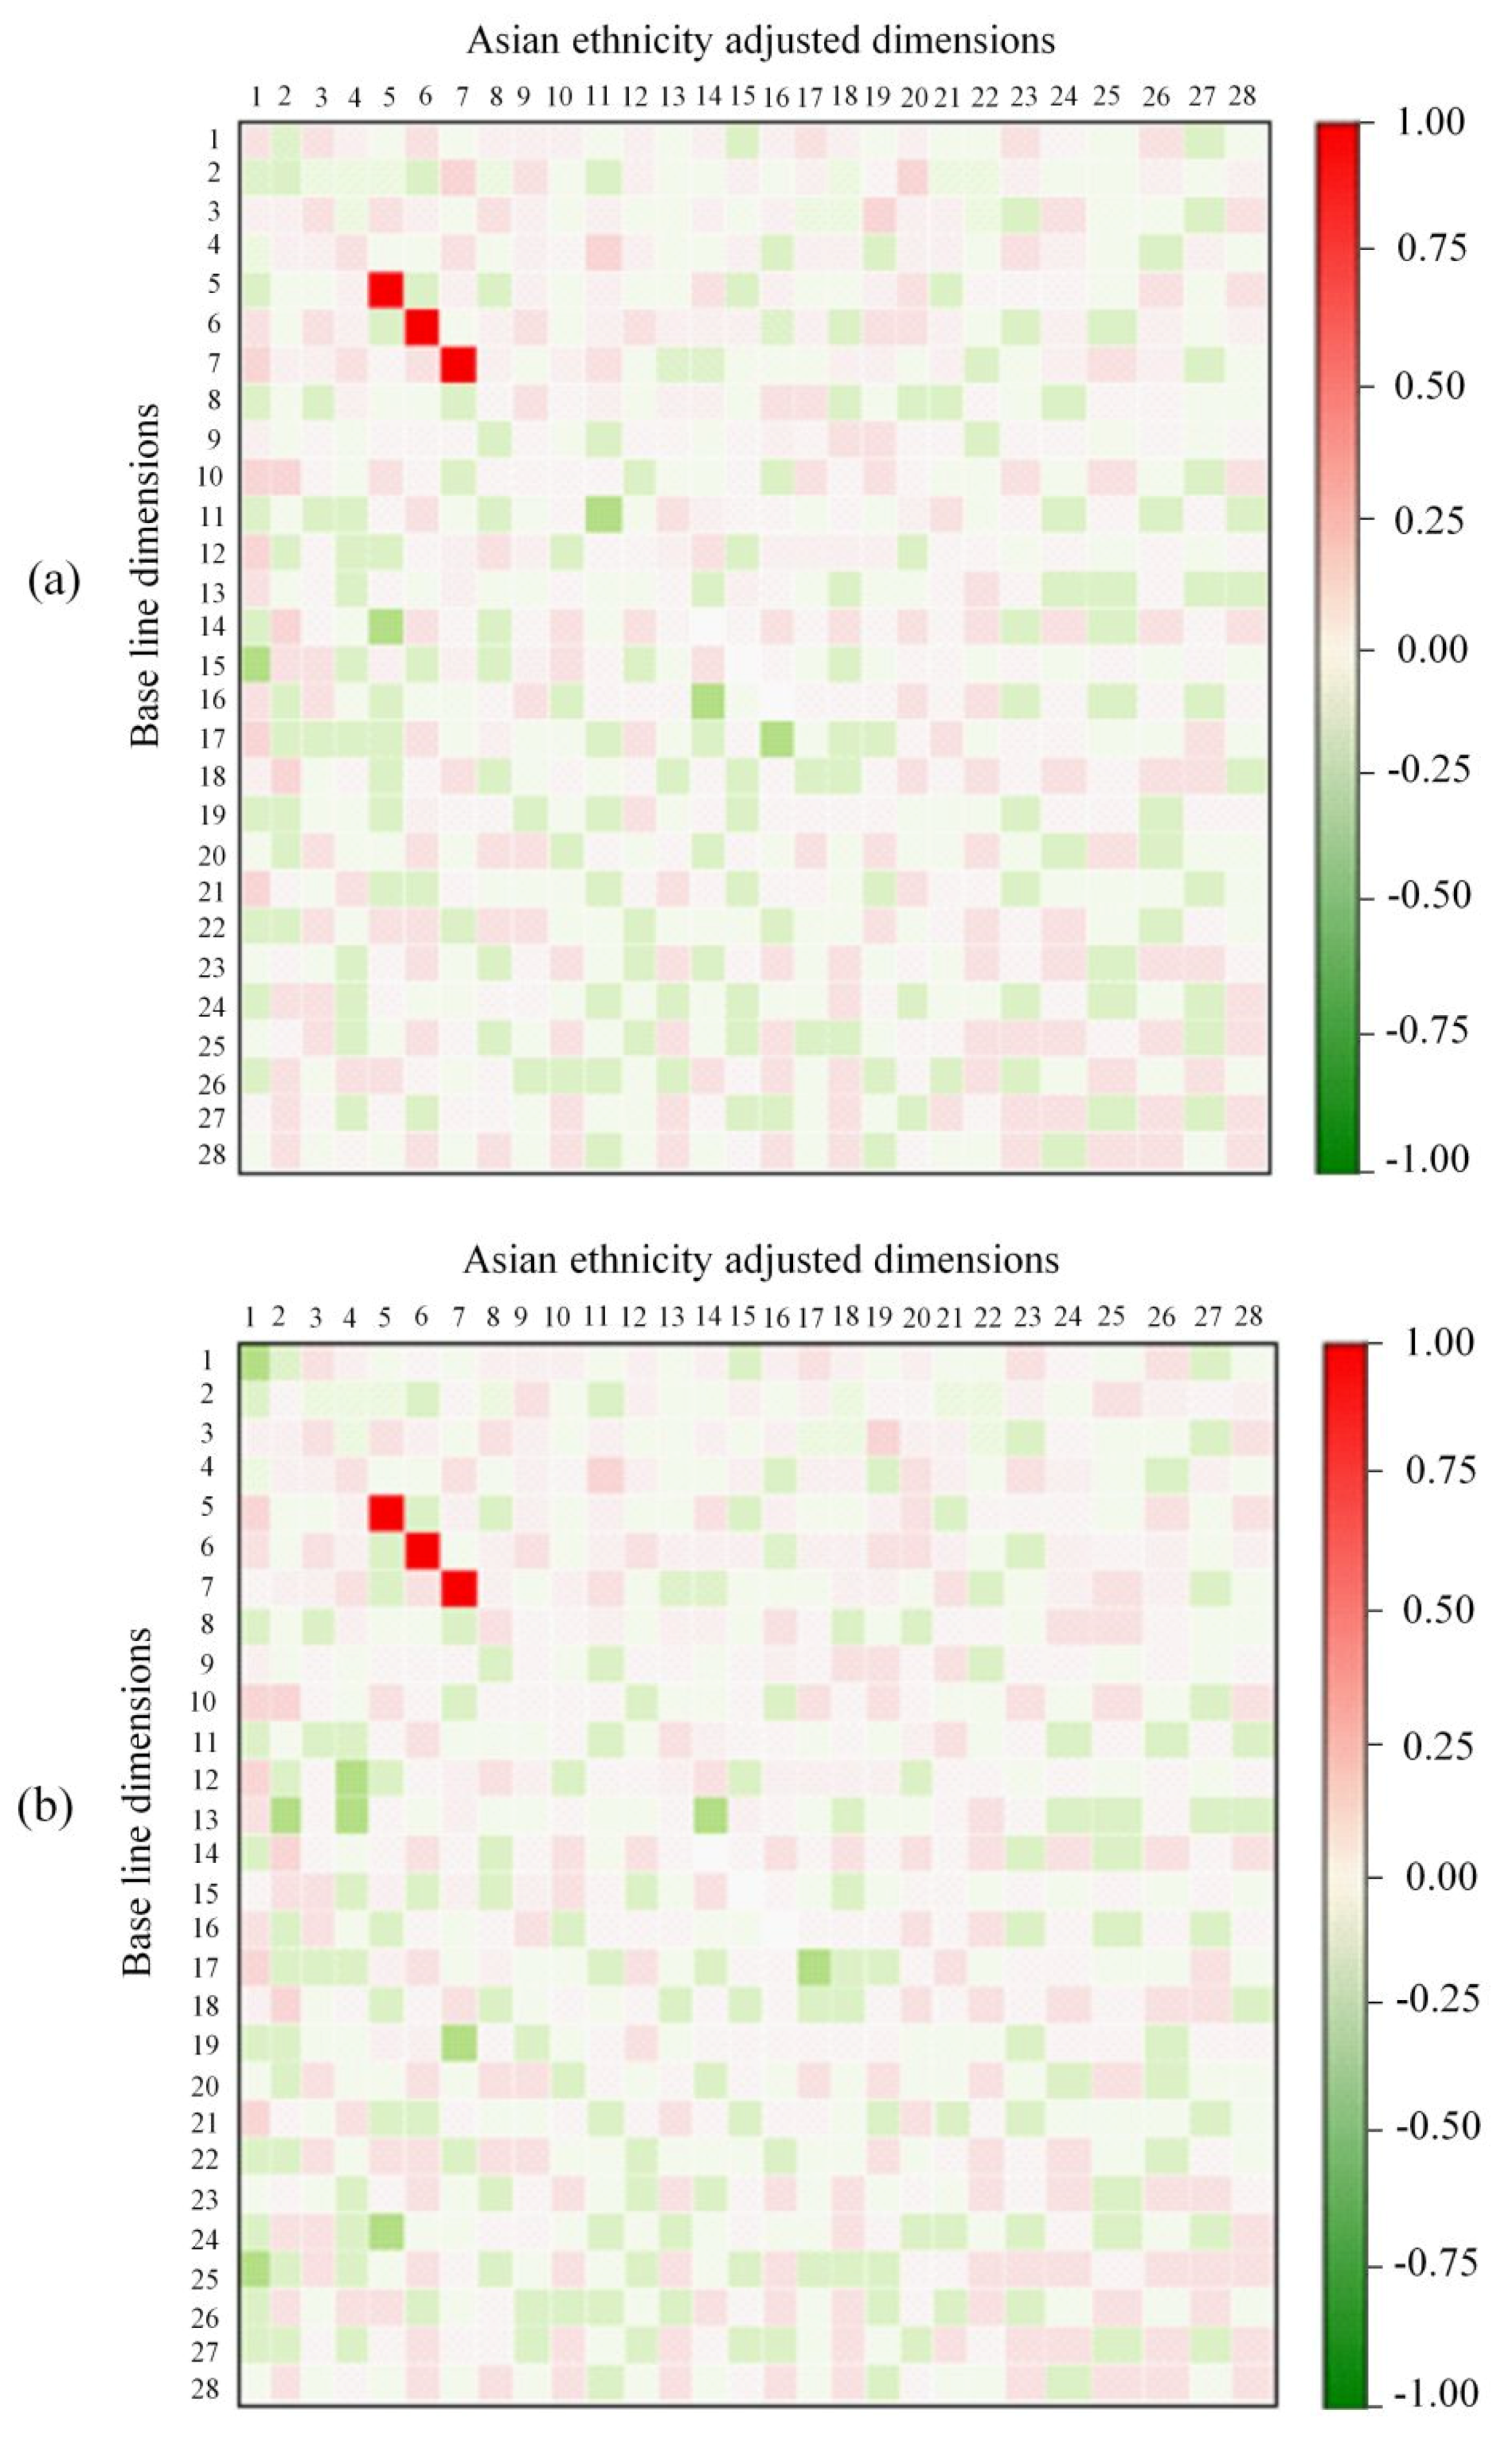
Figure 13.
Collinearity analysis for ethnicity adjusted asymmetric dimensions (Asian) against base-line dimensions for the (a) MORPH, and (b) FERET dataset.
Figure 13.
Collinearity analysis for ethnicity adjusted asymmetric dimensions (Asian) against base-line dimensions for the (a) MORPH, and (b) FERET dataset.
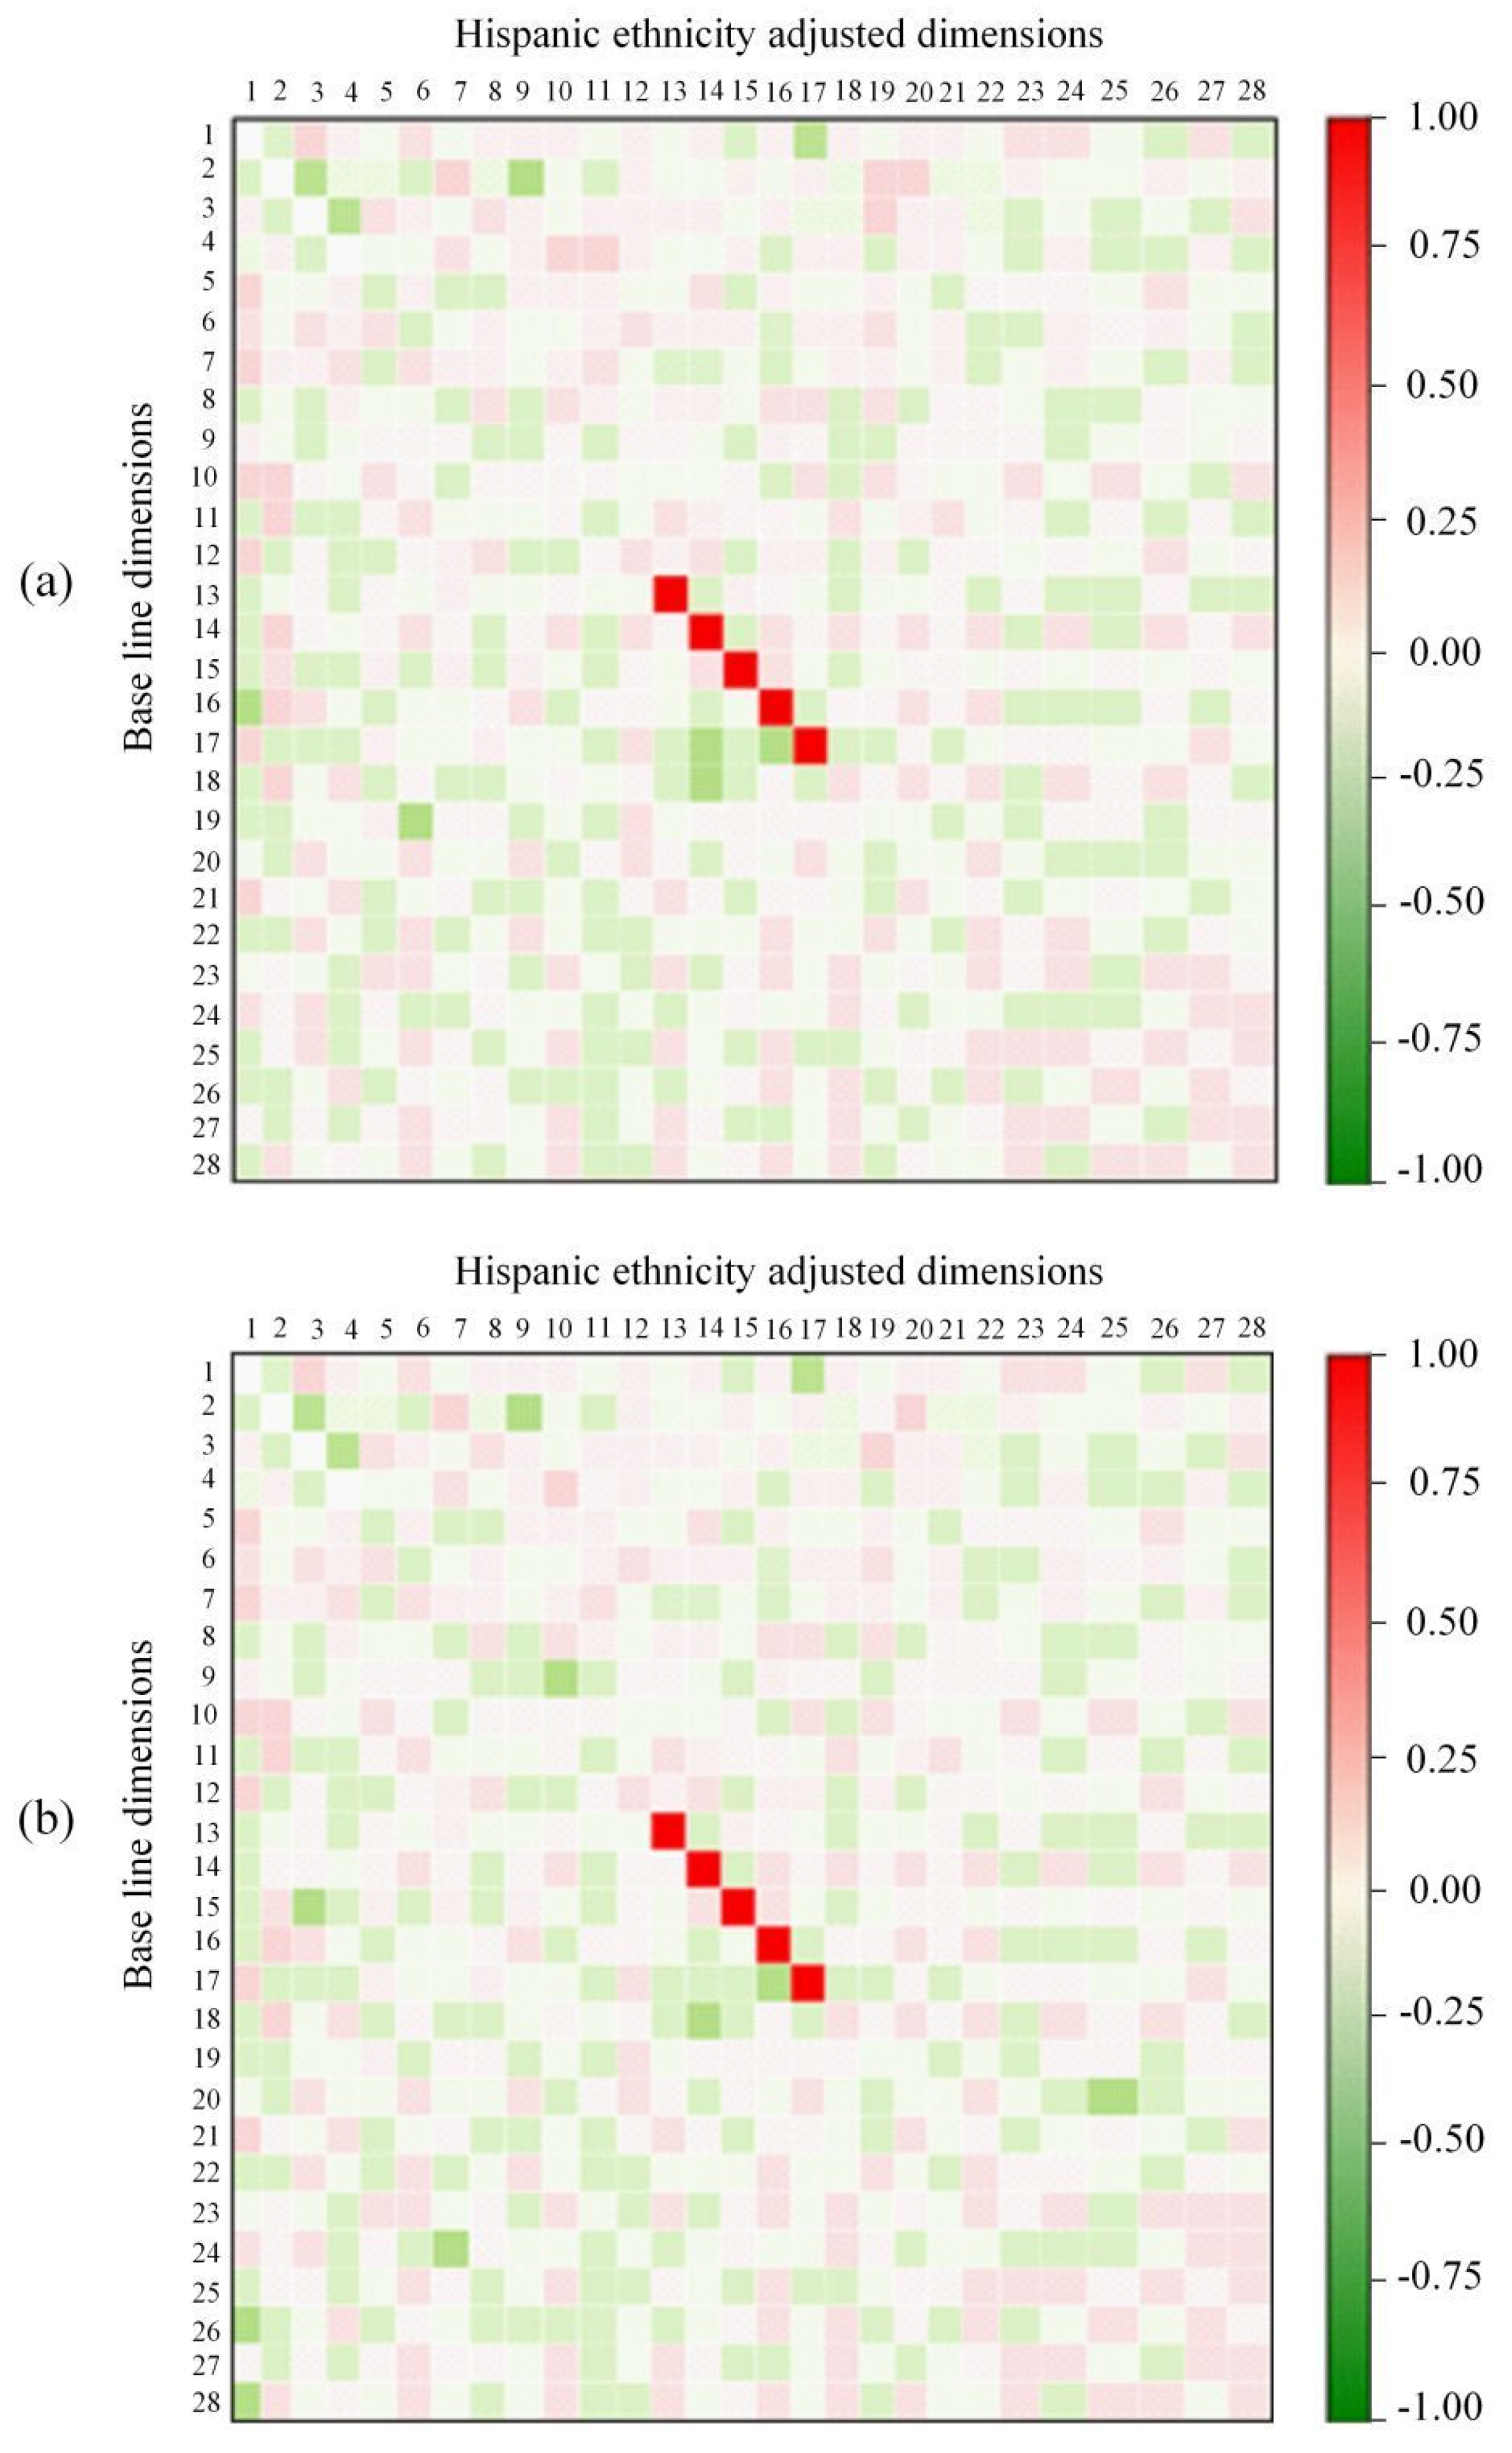
Figure 14.
Collinearity analysis for ethnicity adjusted asymmetric dimensions (Hispanic) against base-line dimensions for the (a) MORPH, and (b) FERET dataset.
Figure 14.
Collinearity analysis for ethnicity adjusted asymmetric dimensions (Hispanic) against base-line dimensions for the (a) MORPH, and (b) FERET dataset.
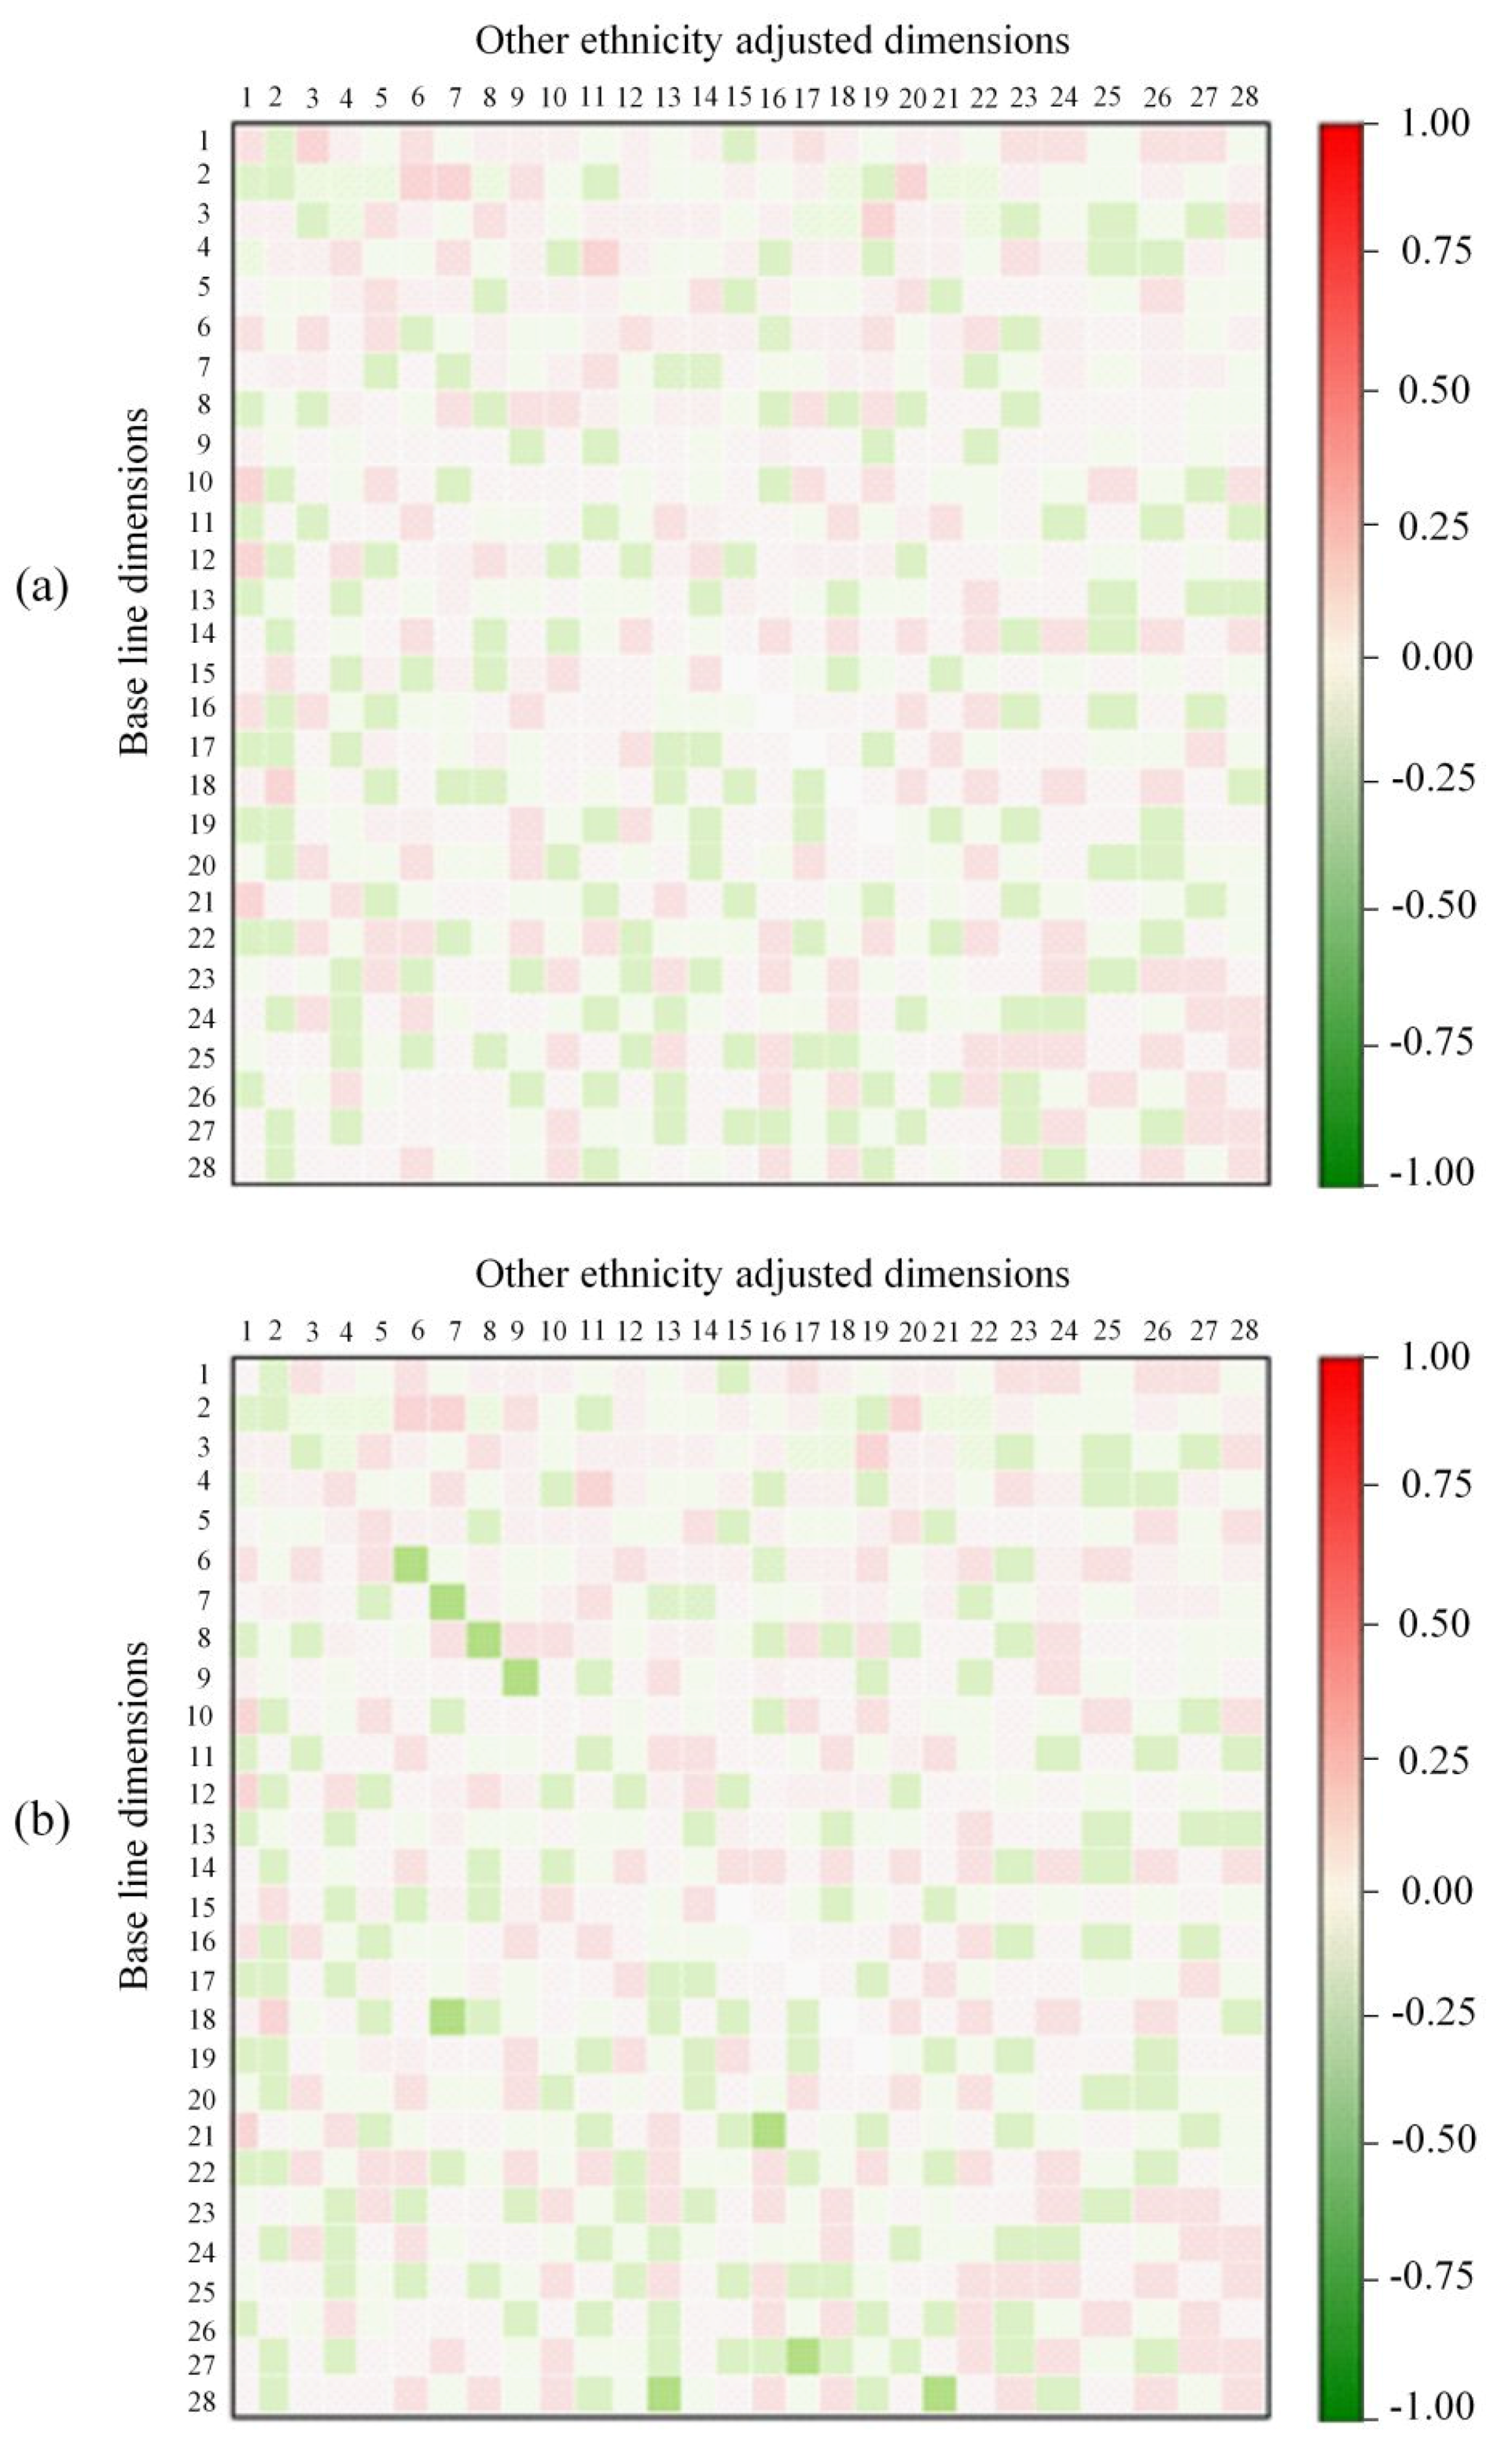
Figure 15.
Collinearity analysis for ethnicity adjusted asymmetric dimensions (Other ethnicities) against base-line dimensions for the (a) MORPH, and (b) FERET dataset.
Figure 15.
Collinearity analysis for ethnicity adjusted asymmetric dimensions (Other ethnicities) against base-line dimensions for the (a) MORPH, and (b) FERET dataset.
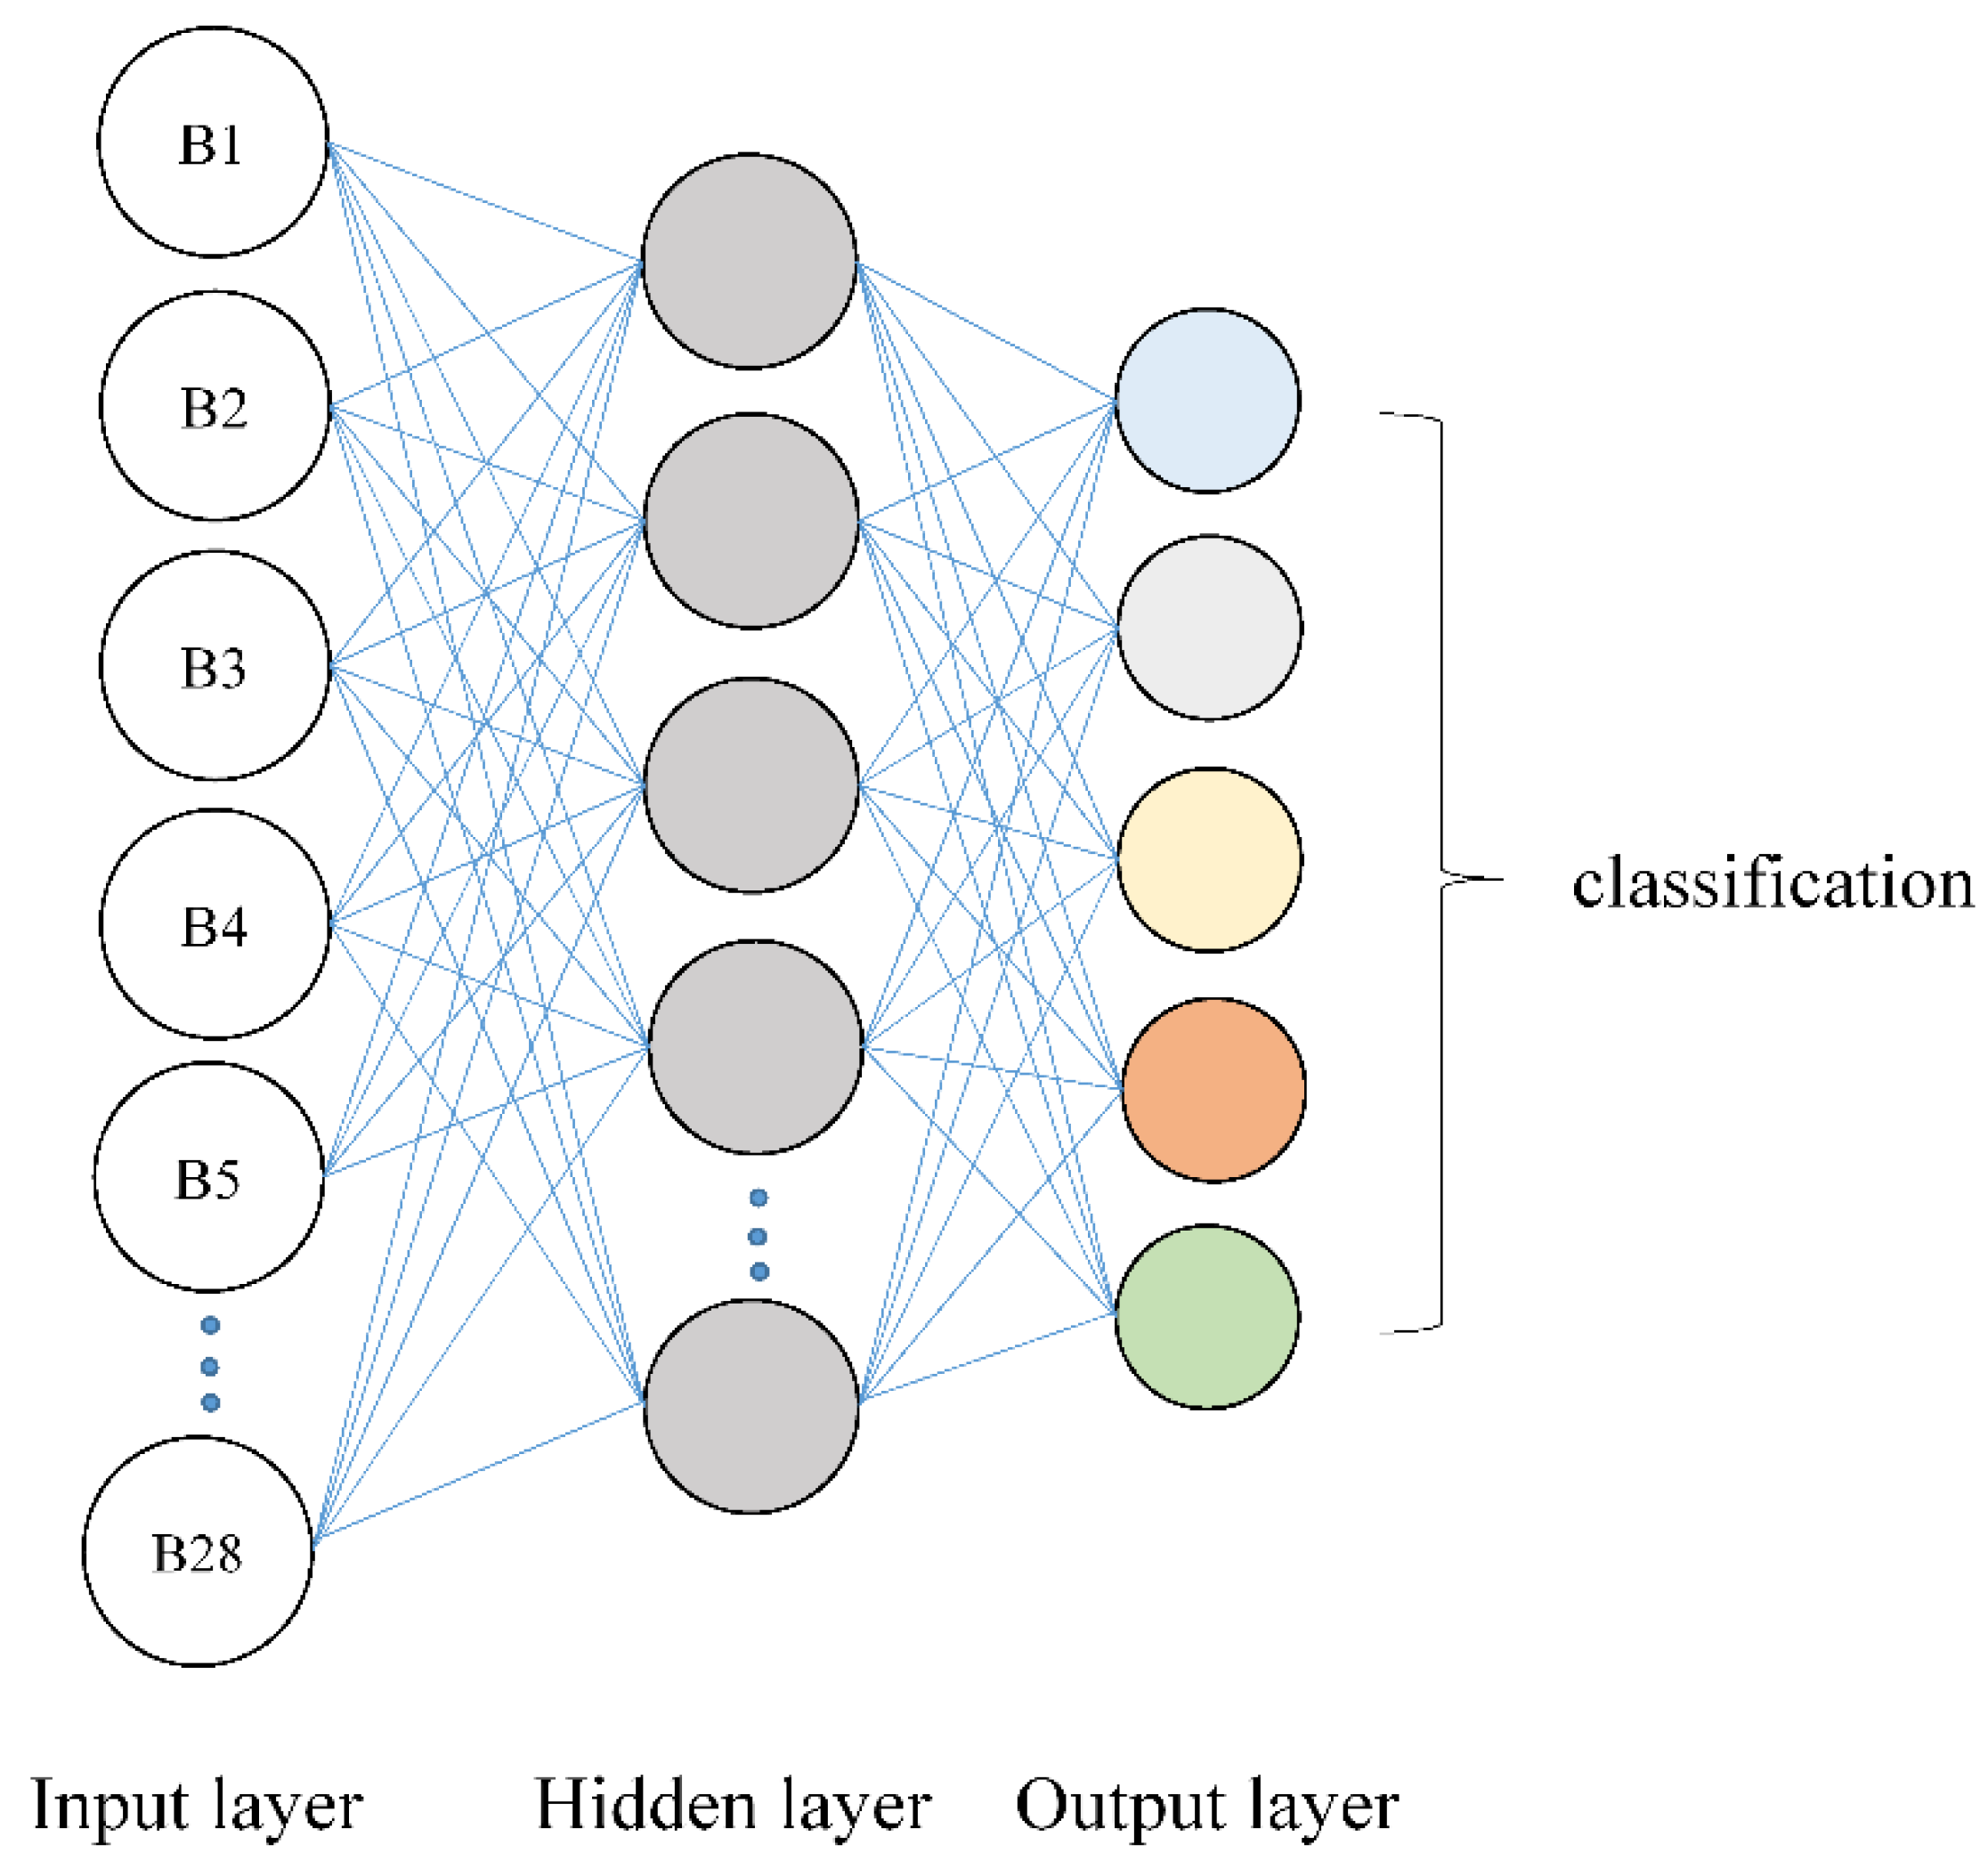
Figure 16.
Schematic of the neural network for classification task.
Figure 16.
Schematic of the neural network for classification task.
Table 1.
Distribution of subjects by gender and ethnicity from MORPH and FERET datasets.
Table 1.
Distribution of subjects by gender and ethnicity from MORPH and FERET datasets.
| Ethnicity | European | African | Asian | Hispanic | Other | Total |
|---|
| Male | MORPH | 1500 | 7000 | 30 | 300 | 8 | 8838 |
| FERET | 410 | 70 | 82 | 18 | 8 | 588 |
| Female | MORPH | 490 | 1100 | 5 | 20 | 5 | 1620 |
| FERET | 310 | 51 | 61 | 5 | 5 | 432 |
| Total | MORPH | 1990 | 8100 | 35 | 320 | 13 | 10,458 |
| FERET | 720 | 121 | 143 | 23 | 13 | 1020 |
Table 2.
Regression coefficients for facial asymmetric measurements across gender and ethnic groups from the MORPH dataset.
Table 2.
Regression coefficients for facial asymmetric measurements across gender and ethnic groups from the MORPH dataset.
| Asymmetric Dimension | Base Line Average (SE) | Gender | Ethnic Groups |
|---|
| Female (SE) | African (SE) | Asian (SE) | Hispanic (SE) | Other (SE) |
|---|
| Average Change from Base Line | Average Change from Base Line to Each Ethnic Group Value |
|---|
| D1 | 0.50 (0.9) | −1.25 (0.6) * | 1.75 (0.4) * | 2.25 (0.4) * | 3.75 (0.5) * | 2.00 (0.2) * |
| D2 | 0.25 (0.7) | 3.75 (0.5) * | 1.25 (0.6) * | −2.25 (0.6) * | 3.50 (0.4) * | 2.00 (0.4) * |
| D3 | 0.25 (0.8) | 3.50 (0.5) * | 2.00 (0.5) * | 2.00 (0.8) * | 4.00 (0.5) * | 2.00 (0.4) * |
| D4 | 0.25 (0.5) | 4.50 (0.6) * | 1.25 (0.3) * | 2.00 (0.8) * | 4.5 (0.7) * | 1.25 (0.2) * |
| D5 | 0.50 (1.0) | −2.00 (0.7) * | 2.00 (0.4) * | 0.25 (0.4) | 1.50 (0.6) * | 1.75 (0.5) ** |
| D6 | 0.50 (0.7) | −1.25 (0.5) * | 2.00 (0.2) * | 0.00 (0.1) | 2.00 (0.5) * | 1.25 (0.1) * |
| D7 | 0.75 (0.7) | 1.75 (0.3) * | 1.75 (0.5) * | 0.25 (0.1) | 2.00 (0.4) * | 3.75 (0.4) * |
| D8 | 0.75 (0.7) | 0.25 (0.5) | 1.25 (0.3) * | 2.25 (0.4) * | −1.00 (0.7) * | −0.75 (0.1) ** |
| D9 | 0.90 (0.6) | 0.00 (0.1) | 1.50 (0.4) * | 2.50 (0.7) ** | 2.50 (0.1) * | 1.00 (0.2) |
| D10 | 1.00 (0.7) | 0.00 (0.1) | 2.0 (0.5) ** | 2.00 (0.5) * | 2.00 (0.6) * | 3.50 (0.5) ** |
| D11 | 2.00 (0.8) | 1.25 (0.2) * | −1.25 (0.3) * | −2.50 (0.2) * | 1.25 (0.4) * | 3.25 (0.6) * |
| D12 | 2.50 (0.7) | −1.50 (0.4) ** | 1.00 (0.5) * | 2.00 (0.6) * | 2.00 (0.4) * | 2.00 (0.8) * |
| D13 | 4.00 (0.8) | 1.25 (0.5) * | 1.00 (0.2) * | 0.00 (0.4) * | 0.50 (0.1) | 2.00 (0.1) * |
| D14 | 4.25 (0.8) | 1.50 (0.4) * | 0.25 (0.5) | 4.25 (0.1) * | 0.00 (0.8) | 3.00 (0.1) * |
| D15 | 5.50 (0.7) | 1.25 (0.3) * | 0.00 (0.4) | 4.00 (0.4) * | 0.25 (0.4) | 4.25 (0.1) * |
| D16 | 4.50 (0.7) | −1.00 (0.2) | 0.00 (0.5) | 4.50 (0.2) * | 0.00 (0.3) | 3.75 (0.8) * |
| D17 | 2.25 (0.8) | −2.50 (0.4) * | 3.75 (0.1) * | 2.25 (0.8) * | 0.00 (0.4) | 4.75 (0.1) * |
| D18 | 2.50 (0.8) | −1.25 (0.4) * | 4.25 (0.4) * | 2.75 (0.7) * | −2.25 (0.2) * | 3.00 (0.9) * |
| D19 | 1.25 (0.6) | −1.25 (0.2) * | 3.75 (0.2) * | −2.00 (0.4) * | −2.25 (0.3) * | 3.25 (0.5) * |
| D20 | 1.00 (0.5) | 1.50 (0.3) * | 2.50 (0.4) * | 2.25 (0.7) * | −2.50 (0.5) * | −1.25 (0.2) * |
| D21 | 2.25 (0.4) | 1.50 (0.5) * | −2.50 (0.6) * | 2.00 (0.3) * | 2.00 (0.4) * | 1.55 (0.2) * |
| D22 | 2.00 (0.8) | −1.75 (0.4) * | 2.50 (1.0) * | −1.50 (0.2) | 1.75 (0.7) * | 1.25 (0.5) * |
| D23 | 2.50 (0.7) | 1.75 (0.1) * | 1.50 (2.0) * | −1.50 (0.6) | 2.00 (0.8) * | 2.00 (0.2) * |
| D24 | 1.00 (0.6) | 1.25 (0.2) * | −2.50 (0.1) * | 1.25 (0.4) * | 1.75 (0.5) * | 1.75 (0.3) * |
| D25 | 1.50 (0.5) | 1.50 (0.4) * | −2.00 (0.4) * | 2.20 (0.6) * | −1.50 (0.8) * | −1.25 (0.4) * |
| D26 | 2.00 (0.4) | −1.00 (0.4) * | 2.00 (0.5) * | −2.00 (0.7) * | −1.50 (0.6) * | 1.25 (0.7) * |
| D27 | 1.75 (0.4) | −1.00 (0.4) * | 2.00 (0.4) * | 1.50 (0.5) | 1.50 (0.7) * | 2.00 (0.8) |
| D28 | 1.25 (0.3) | 2.00 (0.6) * | −1.75 (0.4) * | 1.75 (0.7) * | −1.75 (0.4) * | −1.75 (0.8) |
Table 3.
Regression coefficients for facial asymmetric measurements for gender and ethnic groups from the FERET dataset.
Table 3.
Regression coefficients for facial asymmetric measurements for gender and ethnic groups from the FERET dataset.
| Asymmetric Dimension | Base Line Average (SE) | Gender | Ethnic Groups |
|---|
| Female (SE) | African (SE) | Asian (SE) | Hispanic (SE) | Other (SE) |
|---|
| Average Change from Base Line | Average Change from Base Line to Each Ethnic Group Value |
|---|
| D1 | 0.50 (0.7) | −1.25 (0.5) * | 1.50 (0.3) * | 2.00 (0.3) * | 4.50 (0.1) * | 2.00 (0.1) * |
| D2 | 0.50 (0.6) | −3.50 (0.6) * | 1.00 (0.5) * | −2.25 (0.6) * | 4.25 (0.3) * | 1.50 (0.5) * |
| D3 | 0.50 (0.6) | −4.00 (0.5) * | 2.25 (0.5) * | 2.00 (0.8) * | 3.50 (0.5) * | 2.25 (0.4) * |
| D4 | 1.00 (0.5) | −3.50 (0.6) * | 1.5 (0.5) * | 2.25 (0.8) * | 3.75 (0.7) * | 2.00 (0.2) * |
| D5 | 1.25 (1.0) | 1.00 (0.4) * | −1.50 (0.7) * | 0.00 (0.4) | 1.75 (056) * | 1.50 (0.5) ** |
| D6 | 1.00 (0.7) | −1.25 (0.5) * | −1.50 (0.2) * | 0.25 (0.2) | 2.00 (0.5) * | −2.00 (0.2) * |
| D7 | 1.75 (0.7) | −1.25 (0.4) * | 2.50 (0.5) * | 0.00 (0.2) | 2.25 (0.7) * | 3.50 (0.5) * |
| D8 | 1.25 (0.7) | 0.00 (0.4) | 1.50 (0.2) * | 2.25 (0.3) * | 1.50 (0.6) * | −1.50 (0.7) * |
| D9 | 1.00 (0.5) | 0.00 (0.3) | 1.50 (0.3) * | 2.00 (0.5) * | 1.75 (0.3) * | 2.00 (0.2) * |
| D10 | 1.25 (0.7) | 0.25 (0.2) | 2.0 (0.5) * | 2.25 (0.5) * | 1.50 (0.5) * | 3.25 (0.5) ** |
| D11 | 2.75 (0.8) | −1.25 (0.7) * | −1.25 (0.3) * | 1.50 (0.1) * | 1.50 (0.4) * | −3.25 (0.6) ** |
| D12 | 3.25 (0.7) | −1.75 (0.4) ** | 1.50 (0.5) * | −1.50 (0.5) * | 1.75 (0.5) * | −2.00 (0.6) * |
| D13 | 4.00 (0.8) | 2.00 (0.5) * | 1.50 (0.2) * | 2.50 (0.3) * | 0.50 (0.2) | 2.00 (0.1) * |
| D14 | 4.25 (0.8) | 2.00 (0.4) * | 0.50 (0.5) | 4.25 (0.2) * | 0.25 (0.1) | 2.75 (0.8) * |
| D15 | 6.00 (0.7) | 1.00 (0.3) * | 0.25 (0.2) | 3.75 (0.4) * | 0.25 (0.5) | 4.00 (0.6) * |
| D16 | 5.50 (0.5) | −2.00 (0.2) * | 0.00 (0.4) | 4.00 (0.2) * | 0.00 (0.3) | 3.50 (0.2) * |
| D17 | 2.75 (0.2) | −1.50 (0.5) * | 4.25 (0.1) * | 1.50 (0.7) * | 0.00 (0.4) | 4.00 (0.5) * |
| D18 | 2.00 (0.4) | −1.50 (0.5) * | 4.00 (0.4) * | −2.75 (0.6) * | 3.75 (0.5) * | 3.25 (0.8) * |
| D19 | 1.50 (0.6) | −1.50 (0.3) * | 3.50 (0.2) * | −1.25 (0.4) * | −2.50 (0.2) * | 4.00 (0.1) * |
| D20 | 1.25 (0.4) | 1.50 (0.3) ** | 2.25 (0.3) * | 2.50 (0.5) * | −2.50 (0.3) * | 1.25 (0.4) * |
| D21 | 2.00 (0.2) | −1.50 (0.5) * | −2.25 (0.5) * | 2.00 (0.4) * | 1.50 (0.4) * | 1.25 (0.2) * |
| D22 | 1.00 (0.4) | −1.75 (0.4) * | 2.00 (0.1) * | −1.25 (0.3) * | 2.00 (0.6) * | 1.50 (0.5) * |
| D23 | 2.25 (0.8) | 1.75 (0.2) * | 1.50 (0.3) * | −1.25 (0.6) | 2.00 (0.7) * | 2.25 (0.8) * |
| D24 | 1.25 (0..5) | 2.25 (0.2) * | −2.5 (0.2) * | 1.50 (0.3) * | 1.50 (0.4) * | −1.50 (0.7) * |
| D25 | 1.00 (0.5) | 1.25 (0.3) * | −2.00 (0.3) | 2.25 (0.6) * | 1.50 (0.7) * | −1.75 (0.4) * |
| D26 | 1.00 (0.4) | −1.50 (0.4) * | 1.75 (0.5) ** | −2.00 (0.8) * | 1.50 (0.6) * | 1.50 (0.5) * |
| D27 | 1.50 (0.2) | 1.50 (0.4) * | 1.50 (0.3) * | −1.25 (0.5) * | 1.50 (0.4) * | 1.25 (0.2) * |
| D28 | 2.00 (0.25) | 1.75 (0.6) * | 1.50 (0.2) * | 1.50 (0.7) * | 1.25(0.3) * | 1.50 (0.1) * |
Table 4.
Post-hoc Tukey test outcomes for the MORPH dataset showing the statistically significant differences between baseline and adjusted dimensions for gender and ethnic groups.
Table 4.
Post-hoc Tukey test outcomes for the MORPH dataset showing the statistically significant differences between baseline and adjusted dimensions for gender and ethnic groups.
| Base Line Asymmetric Dimensions | Gender | Ethnic Groups |
|---|
| Female | African | Asian | Hispanic | Other |
|---|
| Significance Level of Average Change from Base Line | Significance Level of Average Change from Base Line to Each Ethnic Group Value |
|---|
| D1 | * | * | * | * | * |
| D2 | * | * | * | * | * |
| D3 | * | * | * | * | * |
| D4 | * | * | * | * | * |
| D5 | * | * | ǂ | * | * |
| D6 | * | * | ǂ | * | * |
| D7 | * | * | ǂ | * | * |
| D8 | * | * | * | * | * |
| D9 | ǂ | * | * | * | * |
| D10 | ǂ | * | * | * | * |
| D11 | ǂ | * | * | * | ** |
| D12 | ** | * | * | * | ** |
| D13 | * | * | * | ǂ | * |
| D14 | * | ǂ | * | ǂ | * |
| D15 | * | ǂ | * | ǂ | ǂ |
| D16 | * | ǂ | * | ǂ | ǂ |
| D17 | * | * | * | ǂ | ǂ |
| D18 | * | * | * | * | ǂ |
| D19 | * | * | * | * | ǂ |
| D20 | ** | * | * | * | * |
| D21 | * | * | * | * | * |
| D22 | * | * | * | * | * |
| D23 | * | * | * | * | * |
| D24 | * | * | * | * | * |
| D25 | * | * | * | * | * |
| D26 | * | ** | * | * | * |
| D27 | * | * | * | * | * |
| D28 | * | * | * | * | * |
Table 5.
Post-hoc Tukey test outcomes for the FERET dataset showing the statistically significant differences between baseline and adjusted dimensions for gender and ethnic groups.
Table 5.
Post-hoc Tukey test outcomes for the FERET dataset showing the statistically significant differences between baseline and adjusted dimensions for gender and ethnic groups.
| Base Line Asymmetric Dimensions | Gender | Ethnic Groups |
|---|
| Female | African | Asian | Hispanic | Other |
|---|
| Significance Level of Average Change from Base Line | Significance Level of Average Change from Base Line to Each Ethnic Group Value |
|---|
| D1 | * | * | * | * | * |
| D2 | * | * | * | * | * |
| D3 | * | * | * | * | * |
| D4 | * | * | * | * | * |
| D5 | * | * | ǂ | * | ** |
| D6 | * | * | ǂ | * | * |
| D7 | * | * | ǂ | * | * |
| D8 | * | * | * | * | * |
| D9 | ǂ | * | * | * | * |
| D10 | ǂ | * | * | * | * |
| D11 | ǂ | * | * | * | ** |
| D12 | ** | * | * | * | ** |
| D13 | * | * | * | ǂ | * |
| D14 | * | ǂ | * | ǂ | * |
| D15 | * | ǂ | * | ǂ | ǂ |
| D16 | * | ǂ | * | ǂ | ǂ |
| D17 | * | * | * | ǂ | ǂ |
| D18 | * | * | * | * | ǂ |
| D19 | * | * | * | * | ǂ |
| D20 | ** | * | * | * | * |
| D21 | * | * | * | * | * |
| D22 | * | * | * | * | * |
| D23 | * | * | * | * | * |
| D24 | * | * | * | * | * |
| D25 | * | * | * | * | * |
| D26 | * | ** | * | * | * |
| D27 | * | * | * | * | * |
| D28 | * | * | * | * | * |
Table 6.
Accuracy for gender classification task.
Table 6.
Accuracy for gender classification task.
| Gender | Accuracy (%) |
|---|
| Neural Network | SVM [34] | kNN | Face++ [21] |
|---|
| MORPH | FERET | MORPH | FERET | MORPH | FERET | MORPH | FERET |
|---|
| Male | 83.97 | 82.50 | 80.00 | 79.26 | 78.84 | 78.00 | 78.00 | 77.26 |
| Female | 83.00 | 82.11 | 79.90 | 79.00 | 77.41 | 77.18 | 77.90 | 77.00 |
| Overall accuracy | 83.48 | 82.30 | 79.95 | 79.56 | 78.12 | 77.70 | 77.95 | 77.13 |
Table 7.
Accuracy for gender classification task.
Table 7.
Accuracy for gender classification task.
| Ethnicity | Accuracy (%) |
|---|
| Neural Network | SVM [34] | kNN | Face++ [21] |
|---|
| MORPH | FERET | MORPH | FERET | MORPH | FERET | MORPH | FERET |
|---|
| European | 80.50 | 80.01 | 78.00 | 77.40 | 77.10 | 76.21 | 76.00 | 74.95 |
| African | 82.00 | 80.65 | 79.53 | 78.50 | 78.21 | 77.00 | 78.00 | 76.46 |
| Asian | 81.23 | 80.30 | 79.05 | 78.23 | 78.50 | 77.00 | 76.90 | 76.33 |
| Hispanic | 80.75 | 79.64 | 78.50 | 77.72 | 77.11 | 76.15 | 75.66 | 75.01 |
| Other | 83.51 | 83.00 | 80.60 | 77.78 | 78.50 | 77.20 | 79.25 | 78.18 |
| Overall accuracy | 81.59 | 80.72 | 79.13 | 78.92 | 77.88 | 76.71 | 77.16 | 76.18 |


