Abstract
The implementation of an urban growth boundary (UGB) can effectively control urban sprawl and promote efficient land use, which is crucial for future urban development. However, most of existing studies overlook the reuse of existing idle and inefficient land within the city in the delineation of UGBs. With China’s urban construction shifting from incremental development to stock development, this study focuses on Wuhan and presents a set of technical approaches for delineating UGBs with a stock development orientation. First, a built-up area composite index (POI&ISA) is constructed based on point of interest (POI) kernel density analysis and impervious surface index extraction to evaluate constructive levels in 2010 and 2020 and identify the urban vitality zone. Then, we combine the current land use status and control policies to divide the urban spatial development potential into five categories: urban vitality land, urban non-vitality land, other vitality land, other non-vitality land, and restricted development land. Finally, the PLUS model is applied in the analysis of the driving forces of land use change in Wuhan, simulating the UGBs in three stages of incremental development (2020–2030), incremental and stock development (2030–2040), and stock development (2040–2050). Finally, the PLUS model simulation projects the UGB areas to be 436.436 km2, 474.617 km2, and 520.396 km2 for the years 2030, 2040, and 2050, respectively. The predicted timespan of urban development extends up to 30 years, serving as a reliable reference for Wuhan’s long-term and near-term planning.
1. Introduction
The rapid development of technology and globalization have led to an unprecedented growth in the global urbanization process. From 1985 to 2015, the global urban area increased from 362,700 km2 to 653,400 km2, nearly doubling. While this swift urbanization has presented significant economic and population development opportunities, it has also given rise to challenges such as excessive internal urban pressure and difficulties in urban expansion [1,2]. To address these challenges, organizations such as the United Nations Conference on Housing and Sustainable Urban Development have stressed the importance of unlocking urban potential and promoting sustainable urban development [3]. This is crucial to prevent chaotic urban expansion and marginalization.
China, as one of the most populous countries globally, has undergone rapid urbanization. However, the prevailing development paradigm prioritizing “quantity over quality” has led to a myriad of issues, including resource depletion, environmental degradation, and inefficient land utilization [4,5]. The trajectory of urbanization is gradually shifting from the “incremental era” to the “stock era”. This transition underscores that the conventional approach of solely advocating urban expansion and spatial development is no longer conducive to current urban progress. Instead, a more sustainable approach is needed. Stock development, which emphasizes the optimal utilization of existing urban resources over mere urban boundary expansion, involves comprehensive investment and transformation of cities to modernize urban functions, repurpose urban spaces, and rejuvenate urban development [6,7,8]. This change in the concept of urban development undoubtedly puts more emphasis on sustainability [9].
The urban growth boundary (UGB) is a crucial tool for managing urban expansion [10]. Its origins can be traced back to the Garden City theory proposed by British scholar Howard in his seminal work Garden Cities of To-Morrow in 1898 [11]. The theory aimed to curb urban sprawl by establishing a robust “green belt” between the central city and surrounding towns to segregate them and prevent indiscriminate urban sprawl. In the 1930s, the United States government began establishing new towns in rural areas with development potential to alleviate the “urban disease” in large cities. These new towns were surrounded by farmland and trees, forming a barrier that restricted the disorderly expansion of urban areas. They were called green belt towns. In1938, the British government enacted the Green Belt Act, marking the beginning of large-scale green belt construction in London. Subsequently, in 1976, the city of Salem, USA, defined the UGB as the delineation between urban and rural areas, beyond which urban development is restricted [12]. Over time, its definition has expanded to encompass various regulatory aspects, including local government oversight of expansion [13]. In China, since the incorporation of delineating UGBs in the “Urban Planning Formulation Means” in 2006, numerous scholars have undertaken related research, and many large cities have carried out the delineation of UGBs [14,15,16,17]. The UGB holds significant importance in steering prudent urban development, conserving the ecological environment, and augmenting urban quality [18,19].
In prior research, scholars have extensively explored UGBs and proposed various methods for their delineation, both domestically and internationally. These methods include dynamic simulation approaches, backward deduction methods, and comprehensive methodologies [10]. The dynamic simulation method is qualitative and treat the city as a complex dynamic system that evolves with societal changes and economic progress [20,21]. To employ this method, it is essential to consider a multitude of factors influencing urban development and constraints on urban expansion, such as population size, GDP, and land demand [22]. Ultimately, geographic simulation models yield simulated results for UGBs. However, this method is highly subjective and heavily reliant on researchers’ experience. The backward deduction method is quantitative and begins with policies and laws related to urban expansion and ecological preservation to demarcate areas restricted or prohibited for development [23,24,25]. This approach establishes clear rigid boundaries for future urban expansion or internal renewal. Nonetheless, it can only delineate rigid boundaries, lacking flexibility to respond to various changes with uncertainty. The comprehensive method integrates dynamic simulation and backward deduction methods, considering both future urban development needs and delineating rigid boundaries during urban expansion. It reflects the dynamic change in urban construction space more scientifically, and has been increasingly applied in the delineation practice of UGBs [26,27].
To accurately delineate UGBs, it is crucial to conduct dynamic simulation of future urban development. One commonly used method is the cellular automata (CA) model, which is a kind of discrete grid dynamical model that considers time, space, and state as discrete variables. It also takes into local spatial interactions and causal relationships over time, making it an effective tool for simulating the simulate the spatiotemporal evolution process of complex systems and is widely utilized for delineating UGBs [28]. Several expanded iterations of the CA model have been developed for delineating UGBs, including the conversion of land use and its effects at small regional extent (CLUE-S) [29,30], slope–land use–exclusion–urban–transportation–hillshade (SLEUTH) [31], artificial neural network cellular automata (ANN-CA) [32], and future land-use simulation (FLUS) [33]. Among these models, the CLUE-S model stands out for its ability to comprehensively consider both natural and human factors. By using iterative method, it can integrate spatial and non-spatial analyses to better simulate land use change scenarios at small scales [34]. The SLEUTH model can combine large-scale spatial databases and various resolution remote sensing data to simulate and predict changes in urban land use from micro to macro and from 10 years to 100 years on spatial and temporal scales [35]. ANN-CA is a simple model that does not require manual determination of model structure, conversion rules, and model parameters. Instead, it uses neural networks to replace conversion rules and automatically obtains model weight parameters through sample training of the neural network [36]. The FLUS model is a simulation and prediction model that can effectively deal with the complexity and uncertainty of mutual conversion between various land use types within the national territory under the influence of human–land relationships [37]. However, in the transition phase of most models, the competition and interaction among different land types are often neglected. The patch-generating land use simulation (PLUS) model, a derivative of the CA model, effectively tackles the complexity and uncertainty of urban growth by considering the combined impact of natural and human activities. This approach enhances simulation accuracy and enables the delineation of UGBs [38,39,40].
Although many cities in China have experienced land urbanization faster than population urbanization, the current delineation of UGB only takes the incremental expansion of cities into account. This delineation process often overlooks the reuse of existing idle and inefficient land within the city, resulting in a tendency to overestimate the determined scale of urban development. In the case of urbanization shifting from incremental development to stock development, it is necessary to coordinate the redevelopment within the city and the external expansion, delineate the UGBs at different stages scientifically, and ensure the orderly and efficient development of urban space.
This paper presents technical approaches to delineate UGBs in a manner that promotes intensive development and reduces the extensive use of land. This study focuses on Wuhan City, Hubei Province, China and aims to achieve three objectives: (1) identify urban vitality zone and non-vitality zones; (2) divide the urban spatial development potential; and (3) simulate future UGBs for different periods. The remainder of this paper is structured as follows: Section 2 provides a detailed description of the study area and data sources. Section 3 presents a set of technical approaches and main processes in detail for delineating UGBs, including the POI&ISA index, classification of urban spatial development potential, and PLUS model. Section 4 shows the delineation results of UGBs in 2030, 2040, and 2050. Finally, Section 5 summarizes the main contributions of this research.
2. Study Area and Data
2.1. Overview of the Study Area
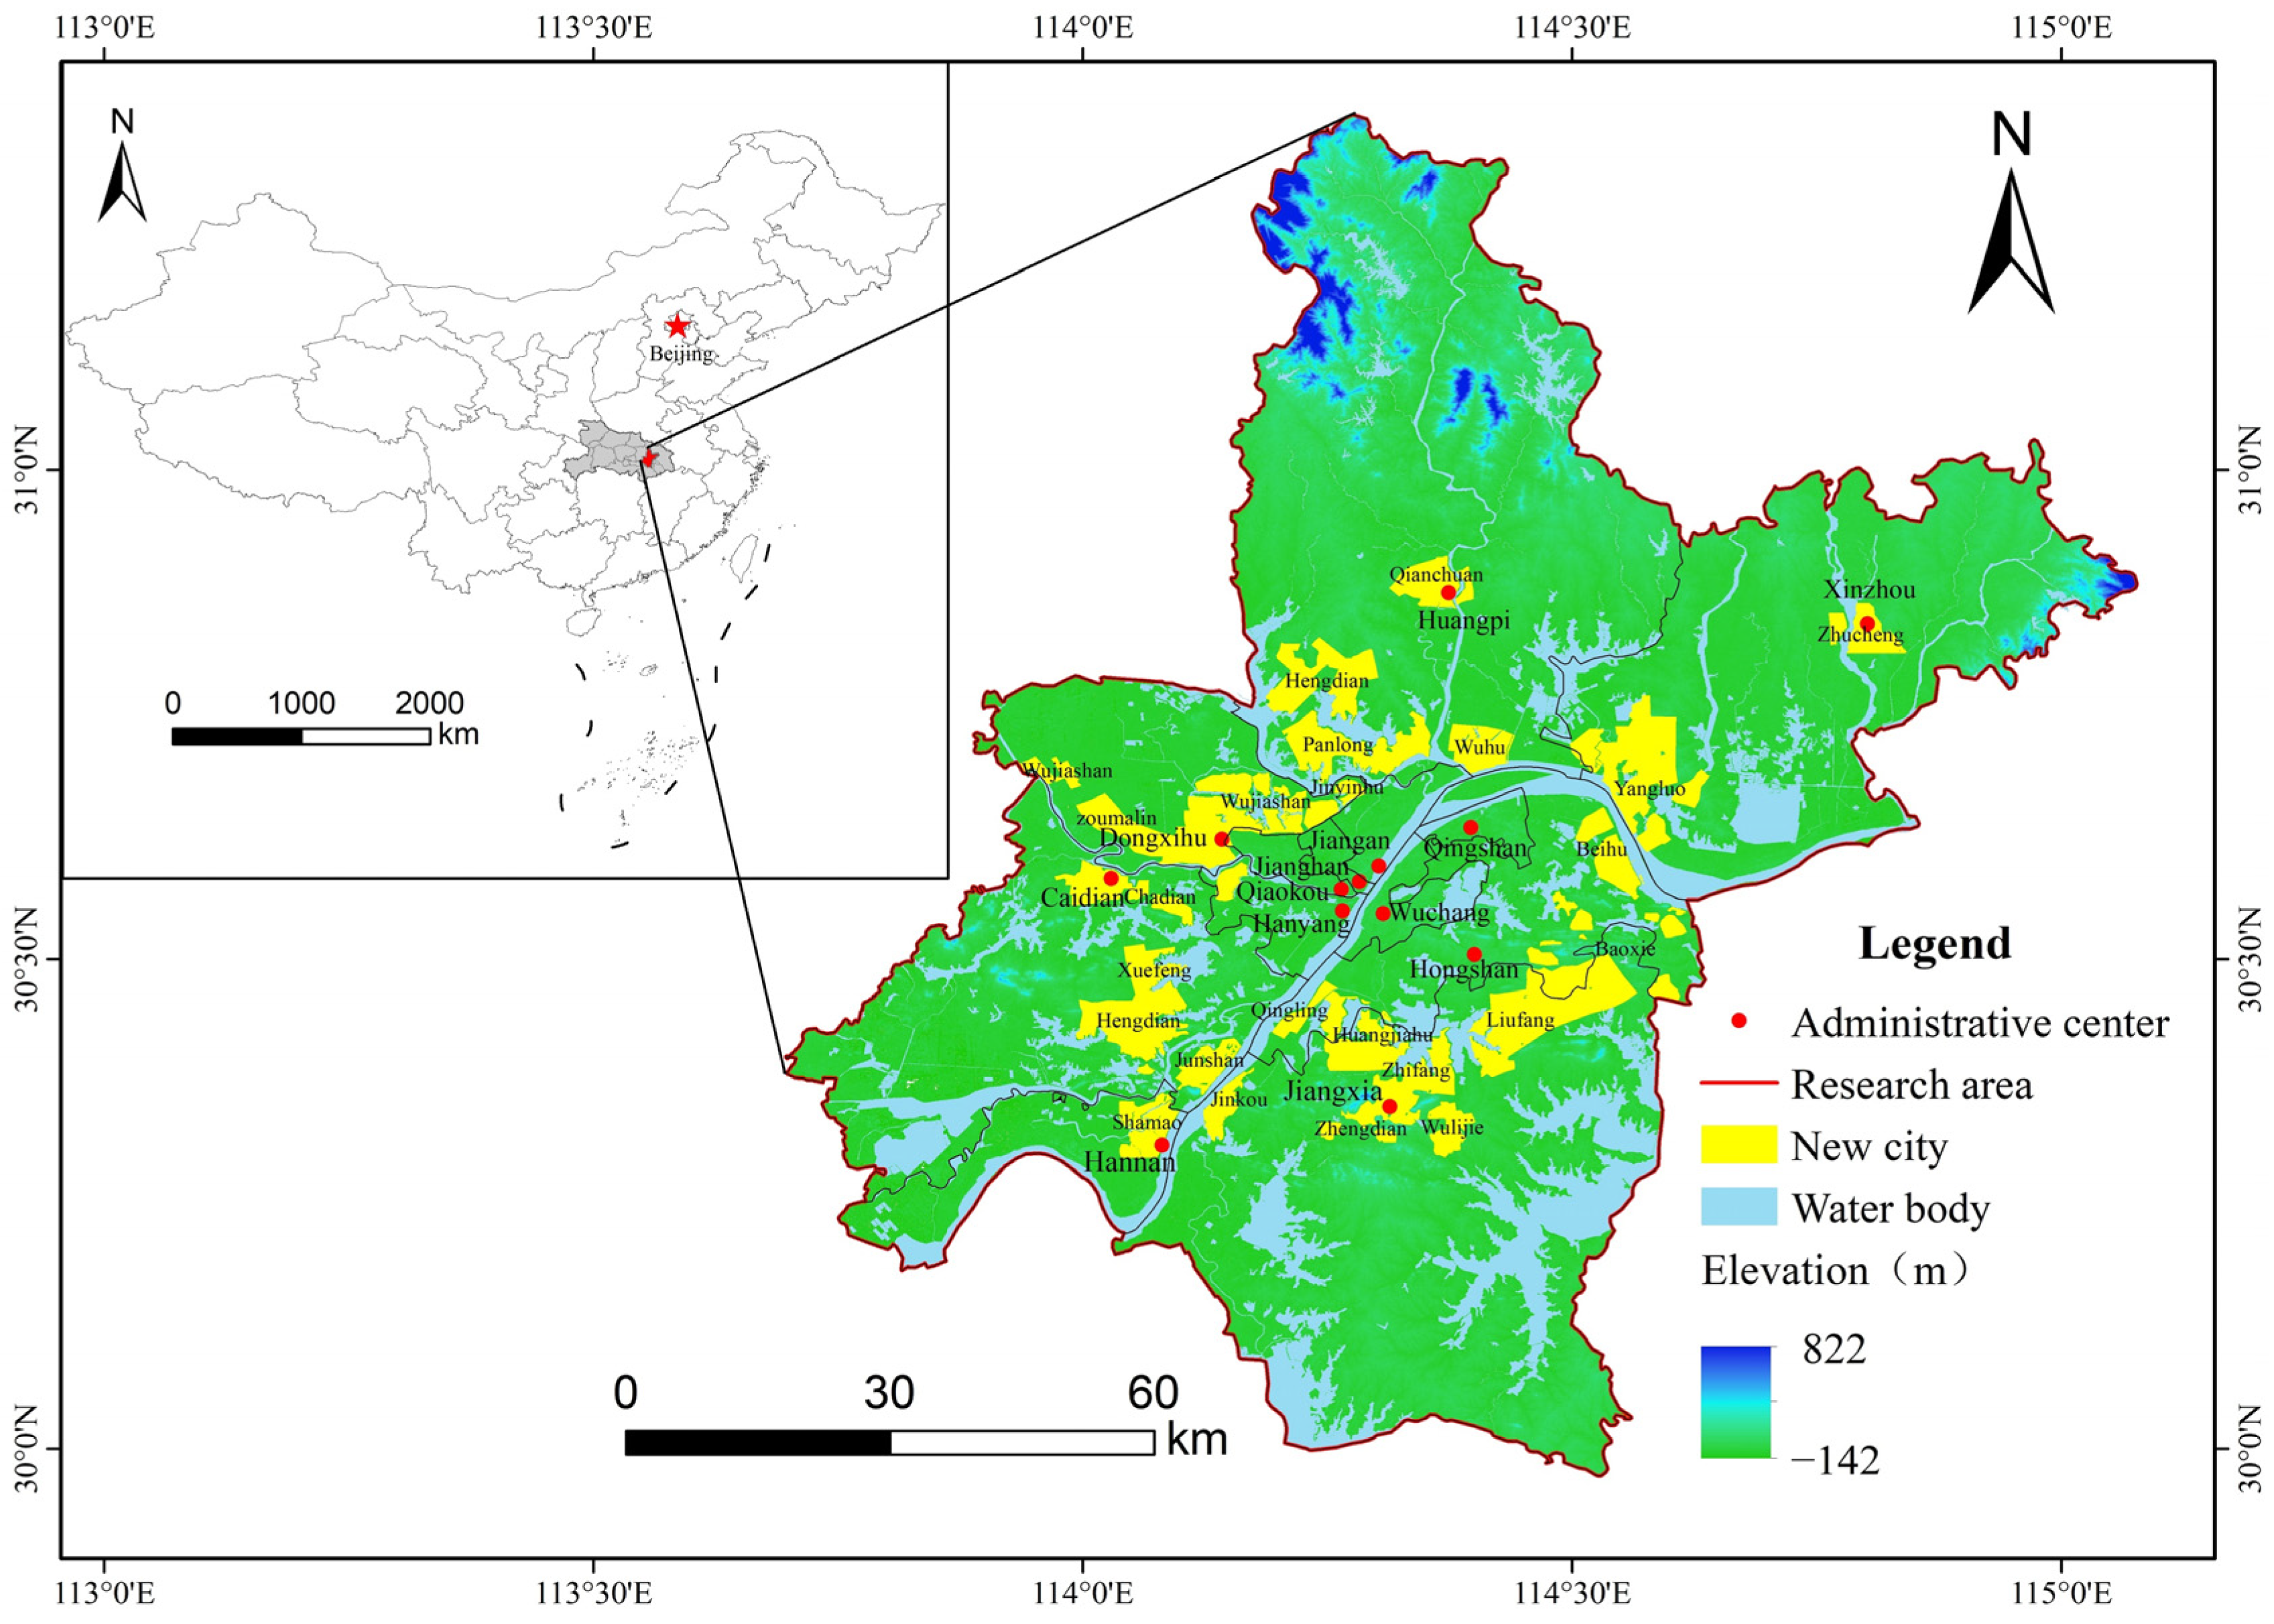
Wuhan is located in the eastern part of Hubei Province, in the central region of China (Figure 1). The terrain is mostly flat, with hills and low mountains situated in the north and south. The western and southern regions have higher elevations, while the eastern and northern regions are lower. Wuhan situated at the confluence of the Yangtze River and the Han River, and the urban area has numerous lakes. The city has a typical subtropical monsoon climate, with four distinct seasons, ample sunshine, abundant rainfall, and plentiful water and heat resources.

Figure 1.
Study area.
Since the late 1970s, the Wuhan government implemented a strategy to expand the city in all directions. This involved integrating neighboring towns and cities into the scope of administrative division, eventually forming 13 districts. It includes seven central urban districts—Hongshan District, Wuchang District, Jianghan District, Jiang’an District, Qingshan District, Qiaokou District, and Hanyang District—and six new urban districts: Jiang xia District, Xinzhou District, Hannan District, Caidian District, Dongxihu District, and Huangpi District. For a long time, the urban area of Wuhan has been expanding mainly within the boundaries of the seven central urban districts, along the banks of the Yangtze River and the Han River. However, in recent years, due to the rapid development of the economy and society and the acceleration of urbanization, not only has the traditional urban area of Wuhan continued to expand, but the urban scale of six new urban districts has also greatly increased. From 1988 to 2011, the urban built-up area of Wuhan increased rapidly [38].
Despite the rapid urban expansion in Wuhan, its internal land use efficiency is suboptimal, resulting in the wastage of different types of land. Additionally, the significance of the old urban areas is gradually diminishing. The Wuhan City Master Plan (2010–2020) emphasizes the importance of transforming old urban areas, enhancing their vitality, and promoting the intensive and economical use of land to achieve sustainable development and ensure the long-term growth of Wuhan. At the same time, the plan proposes to actively promote the development of new cities and build 24 new cities and new city clusters. Therefore, it is necessary to scientifically delineate the UGB of Wuhan and guide the sustainable use of land.
2.2. Data Sources
This study utilized data from four main sources: remotely sensed imagery data, land use and control line data, point of interest (POI) data, and additional impact factors data (Table 1). Remotely-sensed imagery data of Landsat 5 in 2010 and Landsat 8 in 2020 were used for Wuhan. Land use data from 2010 to 2020 were acquired from Chinese Academy of Sciences Resource and Environmental Science Data Platform. Land control line data included the ecological red line and basic farmland preservation area from relevant planning schemes such as Wuhan Land Use Master Plan and 1:2000 Ecological Control Line Plan. The POI data used in this study were acquired via the application programming interface provided by Baidu Maps. These data included businesses, restaurants, attractions, commercial services, and public services, which represented real geographic entities. Each data segment includes information such as name, address, category, and latitude and longitude coordinates.

Table 1.
Data classification and sources.
The additional impact factors data mainly involve traffic network data, digital elevation model (DEM), population density (PD), and gross domestic product (GDP). The Wuhan traffic network data were sourced from the Open Street Map platform and encompasses highways, primary roads, secondary roads, and railways. DEM, PD, and GDP are all from Chinese Academy of Sciences Resource and Environmental Science Data Platform.
To ensure consistency with the study area’s extent, two remote sensing images for each year collected were mosaiced using ENVI 5.3, and the other acquired data underwent clipping and masking using ArcGIS 10.8. Simultaneously, the spatial coordinates were set to WGS_1984_EASE-Grid_2.0_Global, with 4440 rows and 5106 columns, maintaining a uniform resolution of 30 × 30 m, as required.
3. Methods and Processes
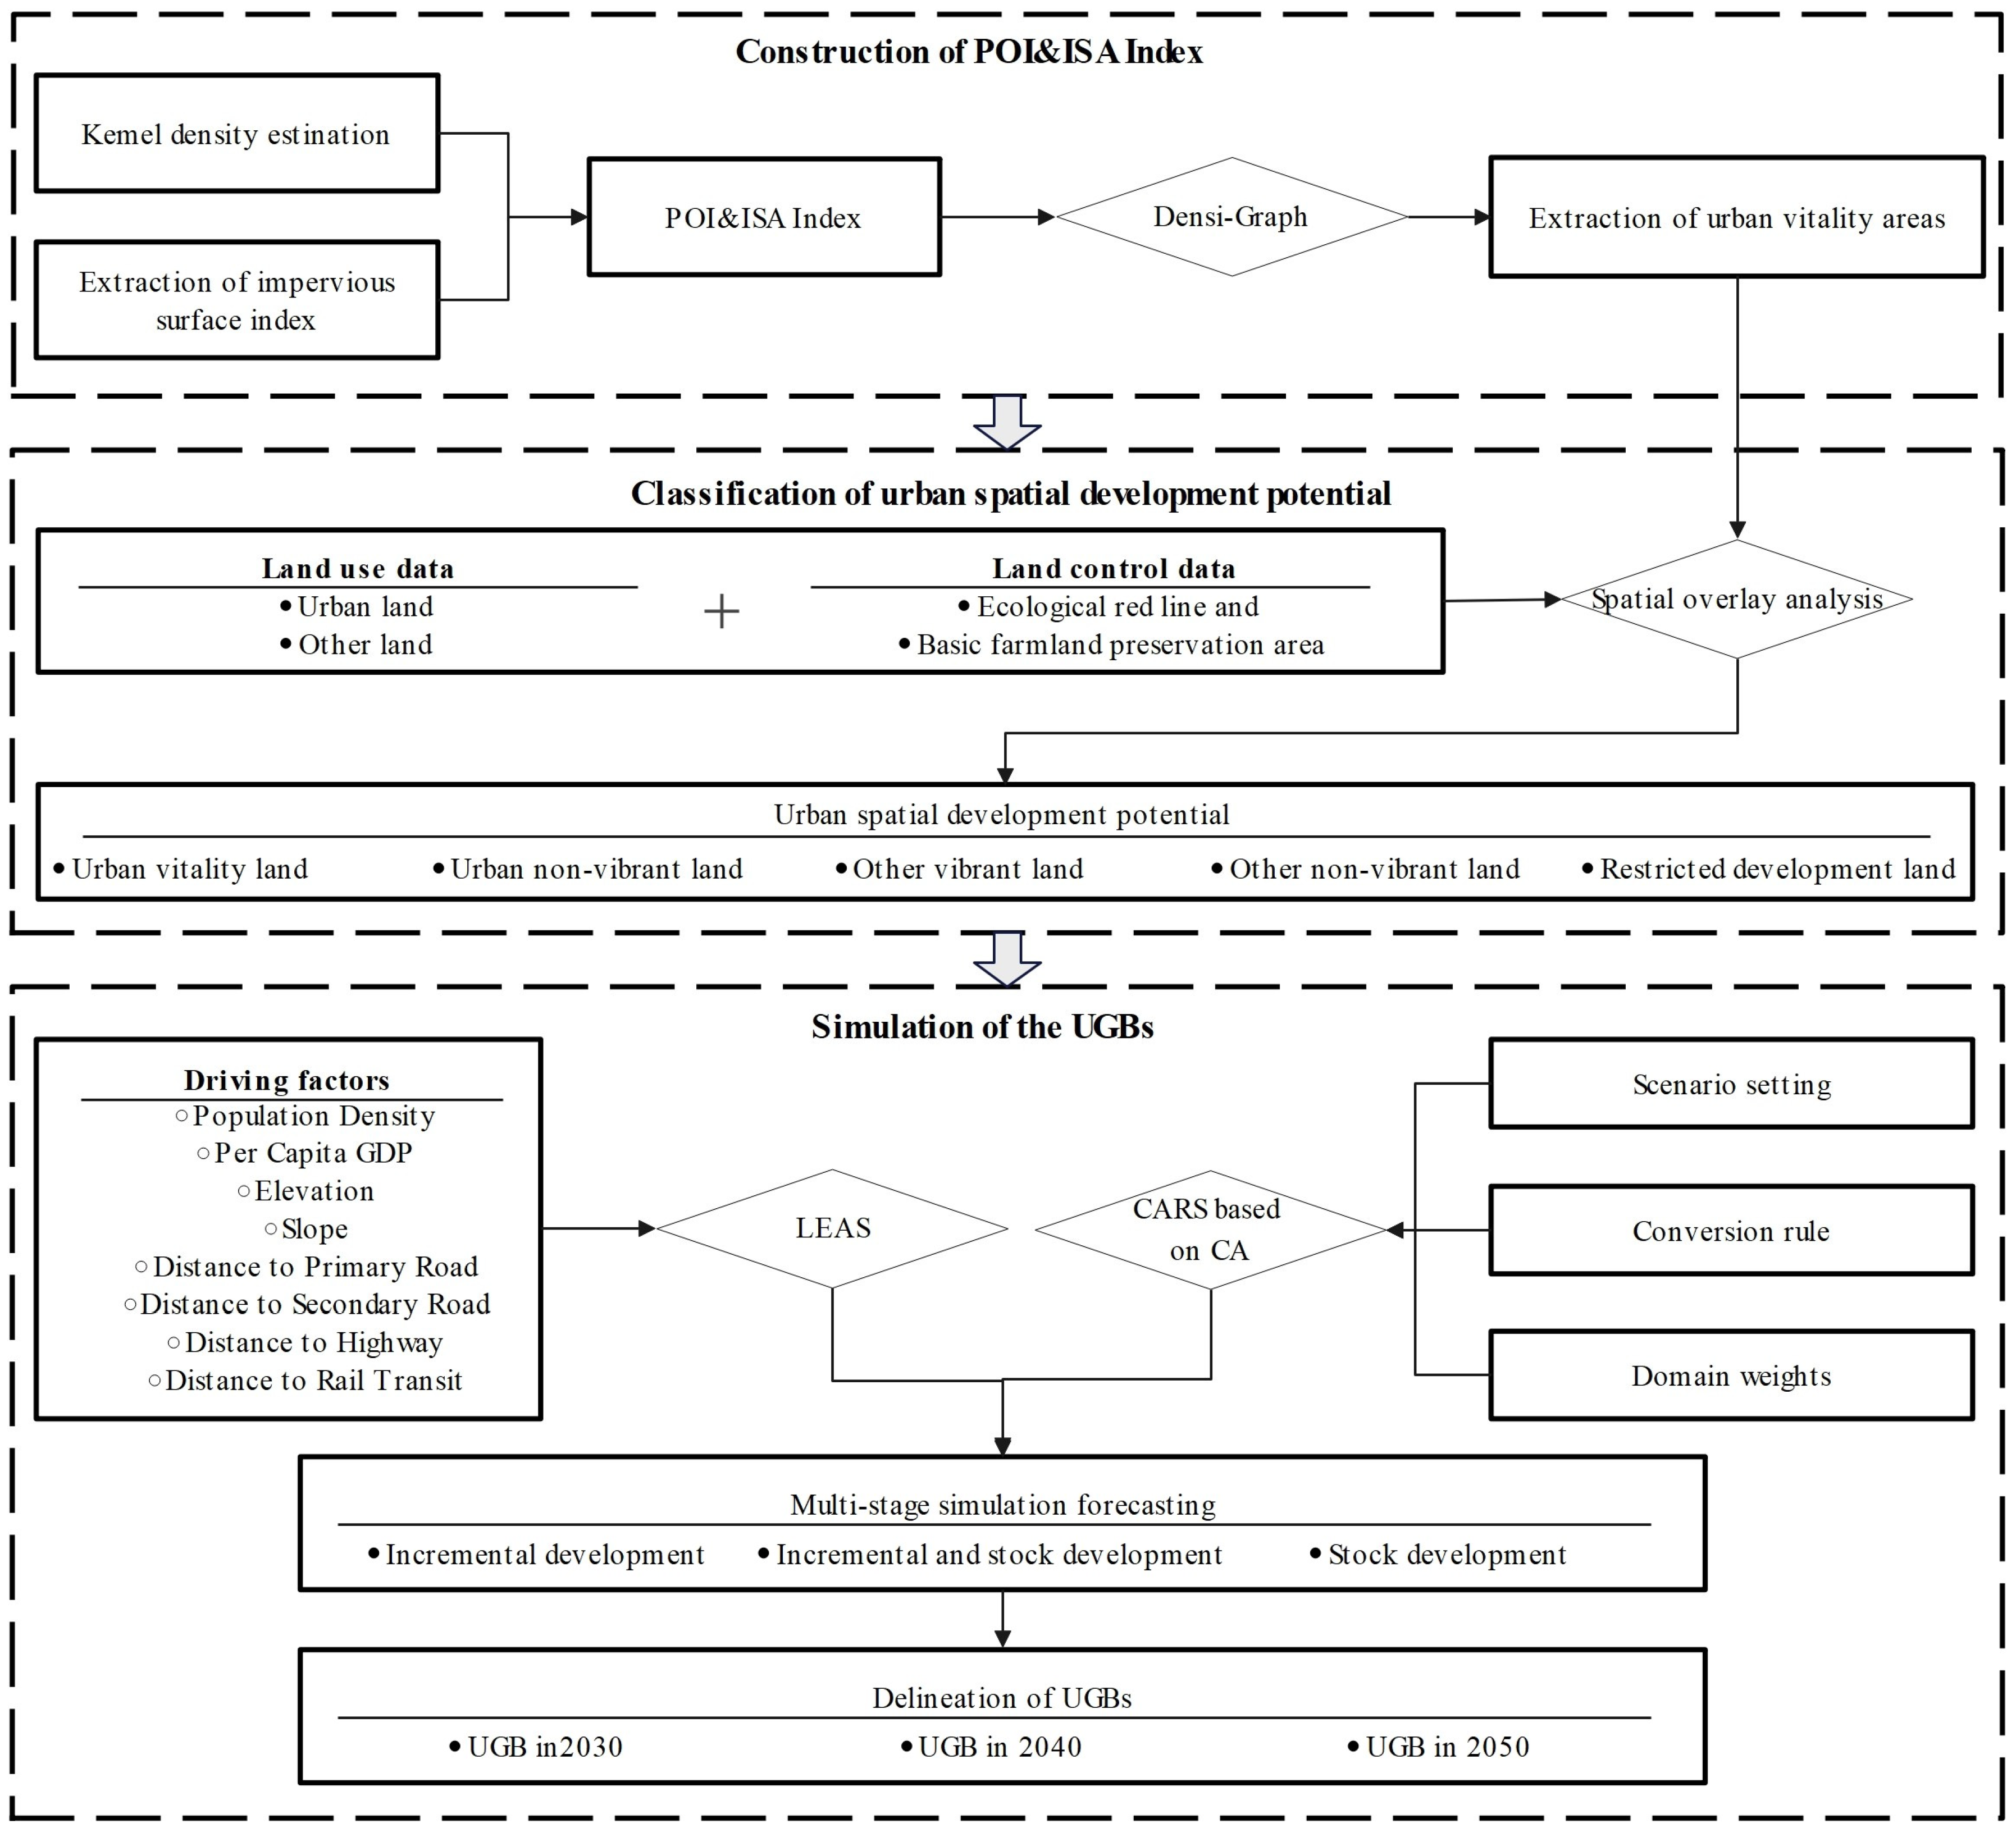
The research process is divided into three main steps: Firstly, we construct a POI&ISA index of the study area to identify urban vitality zones in both 2010 and 2020. Secondly, we divide the urban spatial development potential based on the current land use status and control policies. Finally, we apply the PLUS model to simulate the UGBs oriented towards stock development in different periods. The research framework is illustrated in Figure 2.
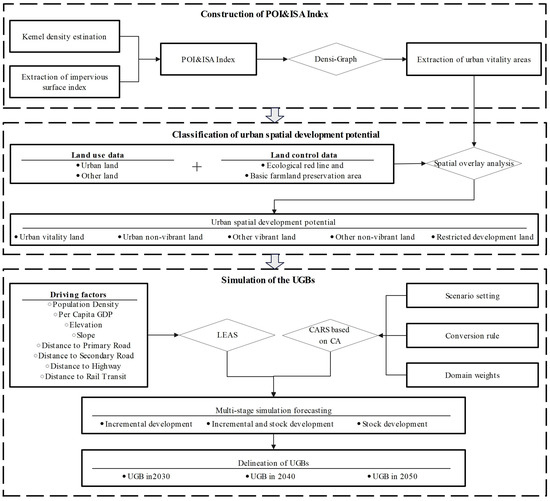
Figure 2.
Research processes.
3.1. POI&ISA Index
3.1.1. Kernel Density Estimation
The kernel density estimation is based on a regular circle with a specific bandwidth around any point of interest in the study area. The weights are determined by the distance from the center point, with closer distances receiving greater weight. The estimated density of each point is the weighted density of all the points in the area. The calculation formula is as follows:
where Qi is the kernel density of point i, D is the bandwidth, Ej is the weight of research object j, Lij is the Euclidean distance between point i and research object j, and m is the number of research object j within the bandwidth.
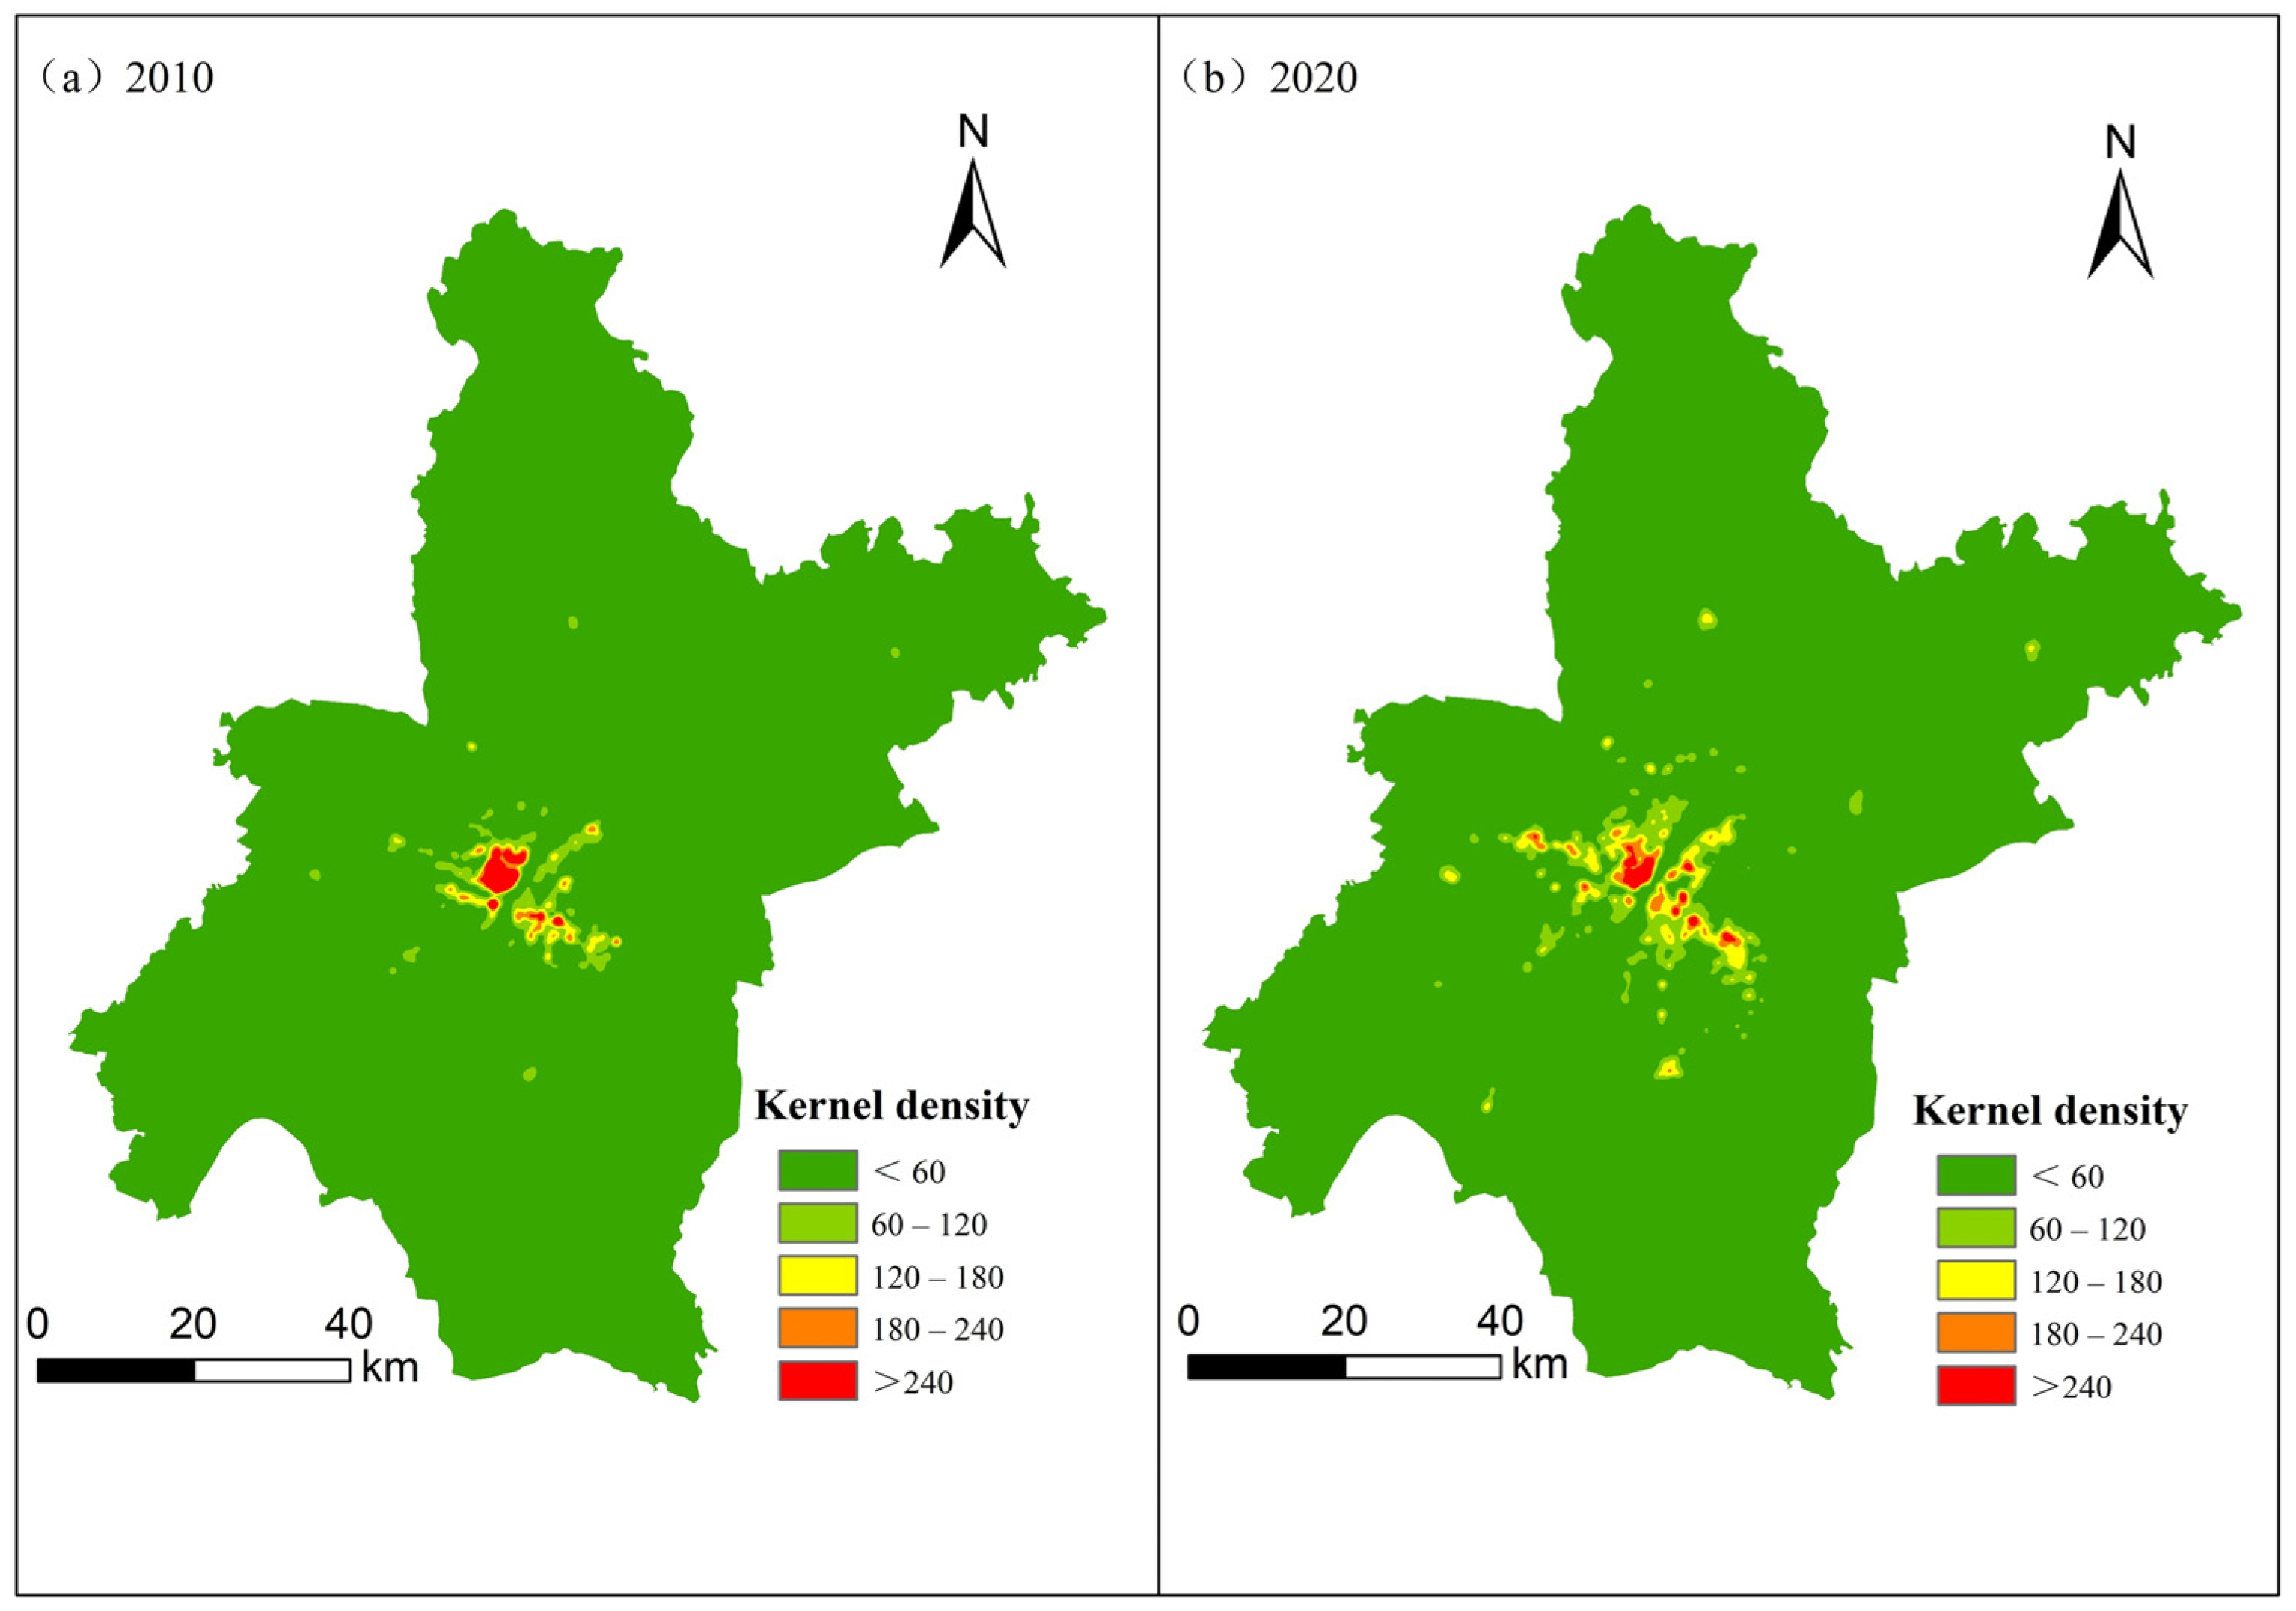
In general, the density of interest points in urban areas is higher than in rural areas. Therefore, this study conducts kernel density analysis on five major types of points of interest within the administrative districts of Wuhan, namely, transport facilities, public facilities, healthcare, education, and business services, during the two periods of 2010 and 2020. The kernel density analysis was performed using ArcGIS 10.8 software, with a bandwidth of 1000 m and a kernel size of 30 m, to meet the requirement of the impervious surface index pixel. The resulting kernel density distribution of POIs in Wuhan is depicted in Figure 3.
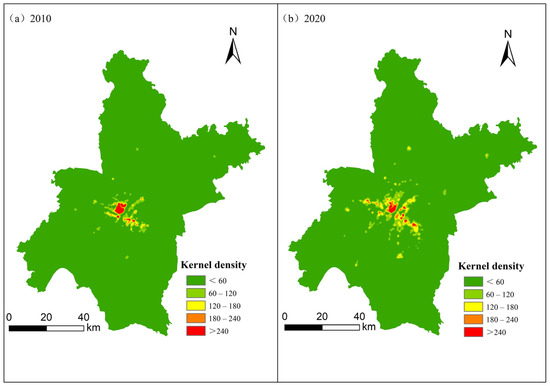
Figure 3.
Kernel density of POIs in Wuhan. (a) 2010, (b) 2020.
The figure illustrates the POI kernel density values in Wuhan City for the years 2010 and 2020. It is evident that the areas with high kernel density in Wuhan are primarily situated within the seven central urban districts, especially in the regions along the Yangtze and Han rivers. In contrast, the six new districts exhibit high kernel density only in the areas where the respective district governments are located and, in some parts, adjacent to the central urban districts. However, these areas are less concentrated and relatively smaller in scale.
A comparison of the results from the two years clearly indicates that over the decade, the high kernel density areas in Wuhan have expanded to some extent. The added high-density zones in the city center are mainly concentrated along the Han River and Yangtze River, while in the new urban areas, expansion is primarily around district administrative centers.
3.1.2. Extraction of Impervious Surface Index
This study adopts the V-I-S model proposed by Ridd [41], recognizing the varying spectral reflectance of features across different bands in remote sensing images. After performing radiometric calibration, atmospheric correction, and mosaic cropping on the remote sensing images, we identified four spectral feature combinations: high albedo, low albedo, bare soil, and vegetation. We then applied a linear spectral mixture decomposition model to extract the impervious surface index of Wuhan in 2010 and 2020 by summing up the abundance of the high albedo end-members and the low albedo end-members.
The linear spectral mixture decomposition model expresses the reflectance of a single image element in each spectral band as a linear combination of its unit component reflectances and their respective abundances. This is calculated using the following formula:
where Lb the spectral reflectance in band b; M is the number of end-elements; hi is the proportional weight of end-element i in the image element; Li,b is the reflectance of end-element i in the b-band; and ab is the value of the unmodelled residual error.
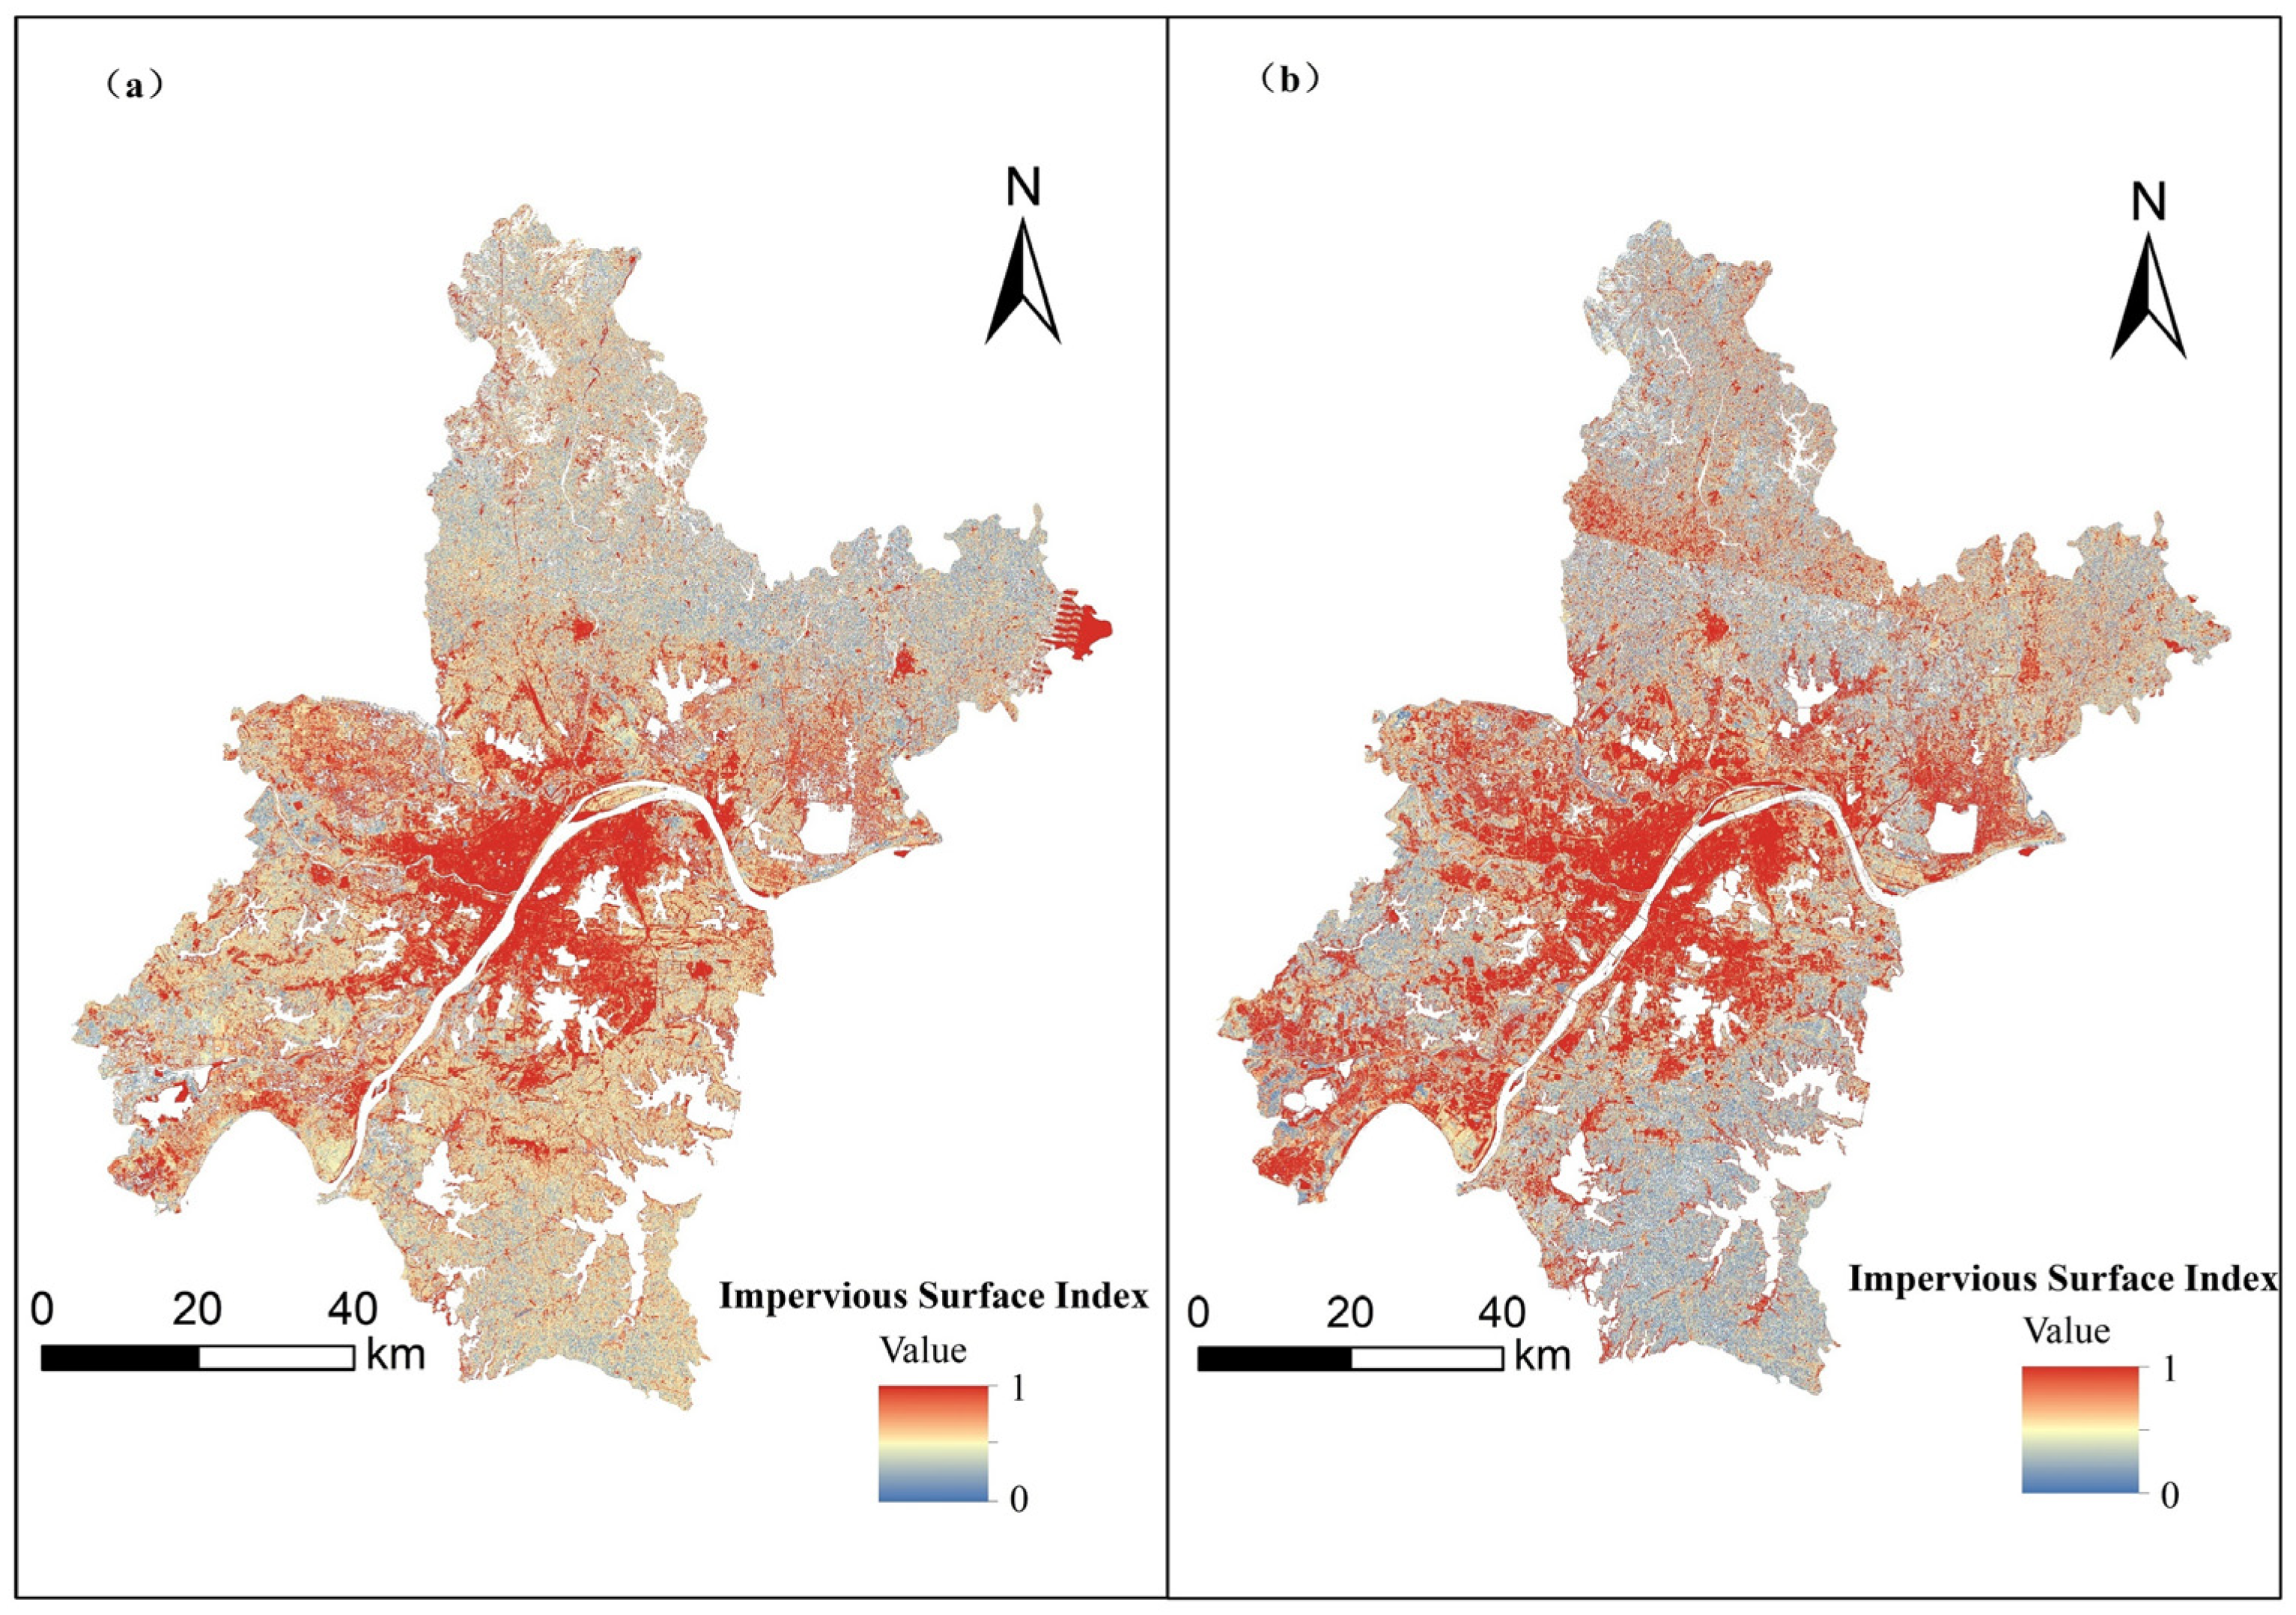
To ensure accurate extraction results of the impervious surface index, this study removes the water body through a mask before applying the linear spectral mixture decomposition model. The resulting impervious surface index of Wuhan in 2010 and 2020 is presented in the Figure 4.
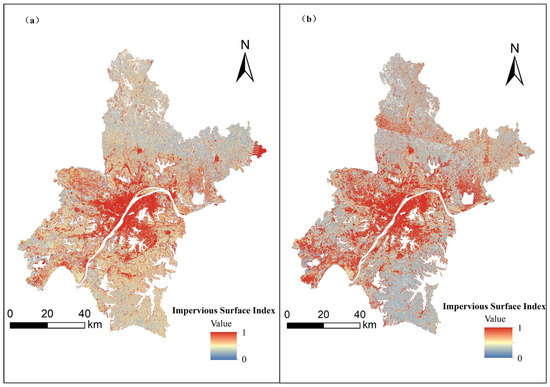
Figure 4.
Impervious surface index in Wuhan. (a) 2010, (b) 2020.
The impervious surface index ranges from 0 to 1, with higher values indicating a higher proportion of artificial surface and lower values indicating a lesser proportion, as illustrated in the figure. In terms of regional distribution, areas with high impervious surface index in Wuhan are mainly concentrated in the seven central urban districts. Furthermore, other areas with high impervious surface index are concentrated around the district offices of each new urban district, as well as some new cities and new city clusters.
A comparison of the impervious surface results between the two periods reveals that the extent of impervious areas in Wuhan has increased considerably over the decade, reflecting the rapid development of urban construction. The expansion trend is categorized into two forms. The first form is characterized by high impervious surface index areas in the central urban districts, which radiate in all directions. For example, impervious surfaces have expanded along the Han River towards and the Yangtze River. The second form is based on the sites of each new district government or other areas with high impervious surface index, expanding into suitable development areas. For instance, the area with high impervious surface index in Huangpi District has expanded in all directions.
3.1.3. POI&ISA Index Construction
It is important to note that using only POI kernel density or impervious surface index to extract urban vitality zones can lead to inaccurate results. For instance, some villages with complete public service facilities may have high POI kernel density values, but they do not necessarily belong to the category of urban vitality zones. Similarly, some mining and industrial areas may have high impervious surface indexes, but they do not meet the requirements of urban vitality zones and should not be classified as such. To minimize these shortcomings, this paper proposes using the POI kernel density and impervious surface index to construct the built-up area integrated index (POI&ISA index). This approach avoids the limitations of using only the POI kernel density and impervious surface index to extract urban vitality zones, while also reducing errors in the extraction process. To construct the POI&ISA index, this paper sets the weights to 0.5 and combines the two types of data using the geometric mean. This eliminates the influence of extreme values and differences in data magnitude. The formula for calculating the POI&ISA index is as follows:
POI&ISAi in the formula is POI&ISA index, POIi is the kernel density value at point i, and ISAi is the impervious surface index at point i.
In ArcGIS 10.8, the POI kernel density data and impervious surface index data were imported. The raster calculator tool was then used to obtain the POI&ISA index. The results are shown below (Figure 5).
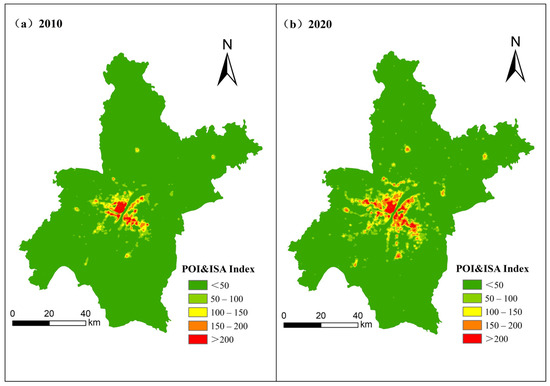
Figure 5.
POI&ISA index in Wuhan. (a) 2010, (b) 2020.
The figure illustrates that the seven central urban districts of Wuhan have high POI&ISA index in both 2010 and 2020, indicating their strong foundation for development. These districts are situated adjacent to the Yangtze and Han Rivers, providing them with prominent location advantages. With flat terrain, well-developed infrastructure, high road network density, and a relatively prosperous economy, these areas are conducive to both production and living, resulting in large populations, high densities of artificial surface, well-developed secondary and tertiary industries, and high urban vitality. Surrounding these high-value areas are sub-high-value zones distributed in gradients, which are crucial regions for Wuhan’s urban expansion. In the six new urban districts, regions with higher POI&ISA index are classified into two main categories. The first category includes areas where new urban district government offices are located, such as Xinzhou and Huangpi District. The second category are mainly some new cities such as Zhifang, Yangluo, and Wujiashan. Although these areas have relatively low levels of development compared to the central urban districts, they have great potential for future growth due to their location advantages and government support.
A comparison of the POI&ISA index of Wuhan between the two periods reveals that newly expanded areas with high POI&ISA index are primarily developed by spreading from the original high POI&ISA index areas. These areas have faster economic development, higher population density, and better infrastructure. The POI&ISA index of some new cities and new city clusters like Wujiashan, Caidian, Yangluo, Zhifang, Changfu, Zhuancheng, Qianchuan, and Beihu are increasing significantly, leading to an expansion of areas with high POI&ISA index.
3.1.4. Extraction of Urban Vitality Zones
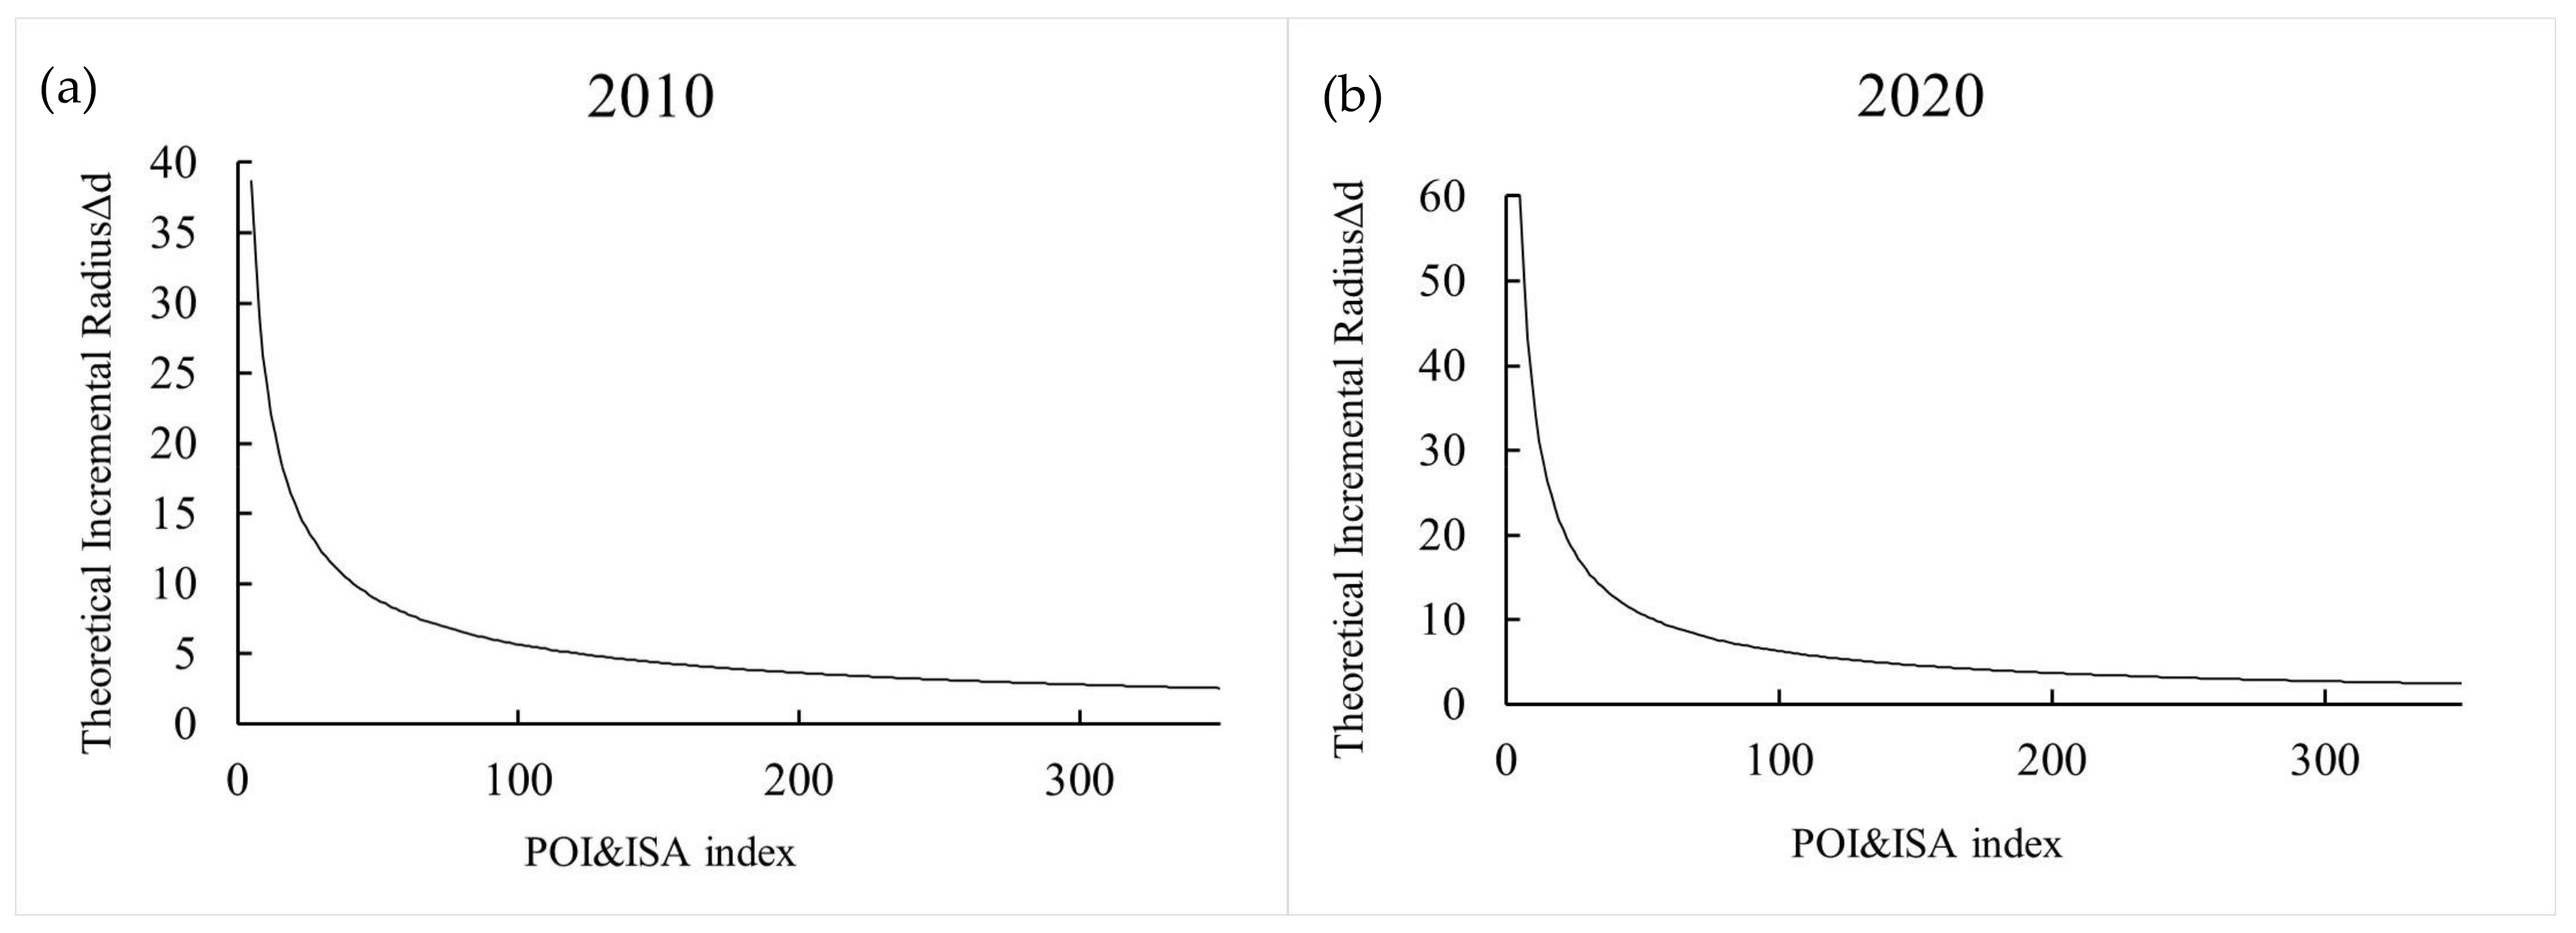
Urban vitality zones are identified based on the obtained POI&ISA index by determining a threshold value. This is achieved by selecting several different POI&ISA index using the ArcGIS10.8 reclassification tool. The generated zones are then equated into a regular circle and a Densi-Graph folded line graph is constructed by taking the corresponding radius increment Δd of the circle as the Y-axis according to the area formula of the circle. The critical point between the high and low POI&ISA index is considered as the point of sudden change of slope, which indicates the boundary of the urban vitality zones. The resulting Densi-Graph folding line is shown below (Figure 6).
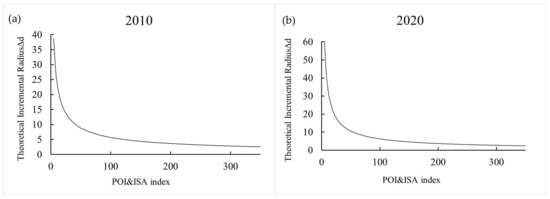
Figure 6.
Densi-Graph diagram of Wuhan. (a) 2010, (b) 2020.
The figure illustrates a sudden change in slope for the POI&ISA index in 2010 and 2020 at approximately 25. Therefore, the POI&ISA index of 25 are selected as the demarcation points between urban vitality and non-vitality zones for the two periods, as shown in Figure 7.
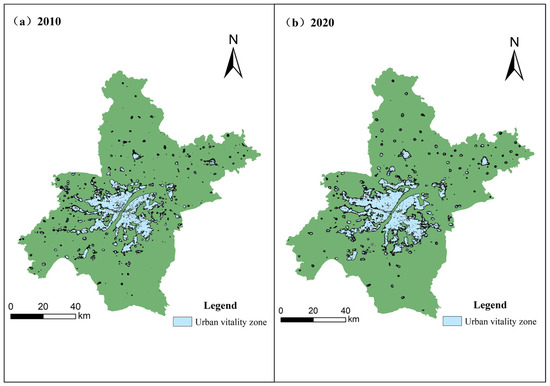
Figure 7.
Urban vitality zone extraction results in Wuhan. (a) 2010, (b) 2020.
The total area of urban vitality zones increased from 978.94 km2 in 2010 to 1171.076 km2 over the following ten years, representing a 19.62% cumulative increase, or 192.136 km2. Urban vitality zones are concentrated in seven central urban areas. In the six new urban districts, urban vitality zones are classified into three types: those distributed along rivers and lakes, those located in the streets where the district governments are situated, and discrete areas in each district that are more developed.
When comparing the results of urban vitality zones between the two periods, three main trends in the expansion of Wuhan’s urban vitality zone were identified. The first trend is the continuous improvement of the original urban vitality zones by filling in the central urban districts, allowing for their ongoing development. The second trend is the expansion of the urban vitality zones along the Yangtze River to Wujiashan, Caidian, and Yangluo, as well as Changfu, Zhifang, and Panlong. The third trend involves expanding the areas surrounding the district government offices in each new urban districts or the better-developed areas to include surrounding regions. For example, this could include the expansion of former areas such as Qianchuan in Huangpi District, Zhucheng in Xinzhou District, and Shamao in Hannan District.
3.2. Classification of Urban Spatial Development Potential
The extracted urban vitality zones should be combined with Wuhan’s land use data, ecological protection zones, basic farmland protection zones, and water body data. These combined data can then be used to identify five types of land: urban vitality land, urban non-vitality land, other vitality land, other non-vitality land, and restricted development land (Table 2). These types of land can be identified using tools such as “intersection inverse”, “merge”, and “reclassification” in ArcGIS 10.8. Figure 8 shows the results of identifying five types of land.
Table 2.
Identification of the five land types.
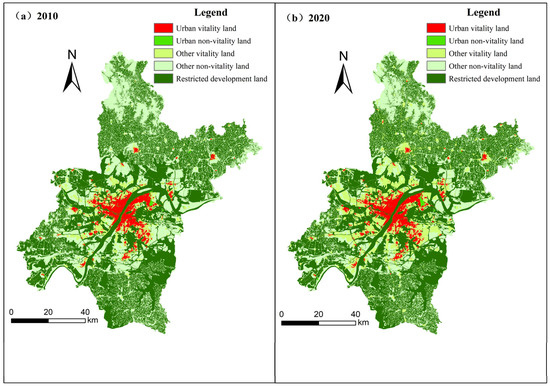
Figure 8.
Land types of urban spatial development potential in Wuhan. (a) 2010, (b) 2020.
The concentration of urban vitality land in Wuhan can be observed in Jiang’an, Hannan, Qiaokou, Hanyang, Qingshan, and Wuchang Districts, and the western and southern parts of Hongshan. The urban non-vitality land is primarily situated in the eastern part of Qingshan District. The other vitality land is mainly distributed in the periphery of urban vitality land, and other non-vitality land is generally in the periphery of other vitality land.
When comparing the land type classification results of urban spatial development potential in 2010 and 2020, Wuhan’s urban vitality land development trend can be divided into two scenarios. Firstly, the land within the urban vitality zones has gradually improved, increasing the internal vitality of these zones. Secondly, the increasing efficiency of land use in the surrounding areas gradually converts the non-vitality land into urban vitality land. The trend in Wuhan’s development of other vitality land is primarily to transform some of the non-vitality zones into vitality zones. The number of patches and the ratio to the total area of each land type in Wuhan are presented in Table 3.
Table 3.
Area and percentage of patches of various types of land in 2010 and 2020.
The table shows that Wuhan’s urban vitality land increased by 26.1252 km2 between 2010 and 2020, while urban non-vitality land decreased by 13.7655 km2. In addition, other vitality land increased by 576.9722 km2, and other non-vitality land decreased by 592.2513 km2. It is worth noting that the area of urban vitality land and other vitality land significantly increased. The most significant change is in the area of other vitality land, which has grown to 2.21 times its size in 2010. This reflects the effectiveness of the Wuhan government’s efforts to develop low-vitality areas.
3.3. PLUS Model
The PLUS model, developed by Liang Xun et al. [33], is based on the FLUS model. It comprises two primary components: the land expansion analysis strategy (LEAS) and the multi-class random patch seeding model (CARS) based CA.
3.3.1. LEAS
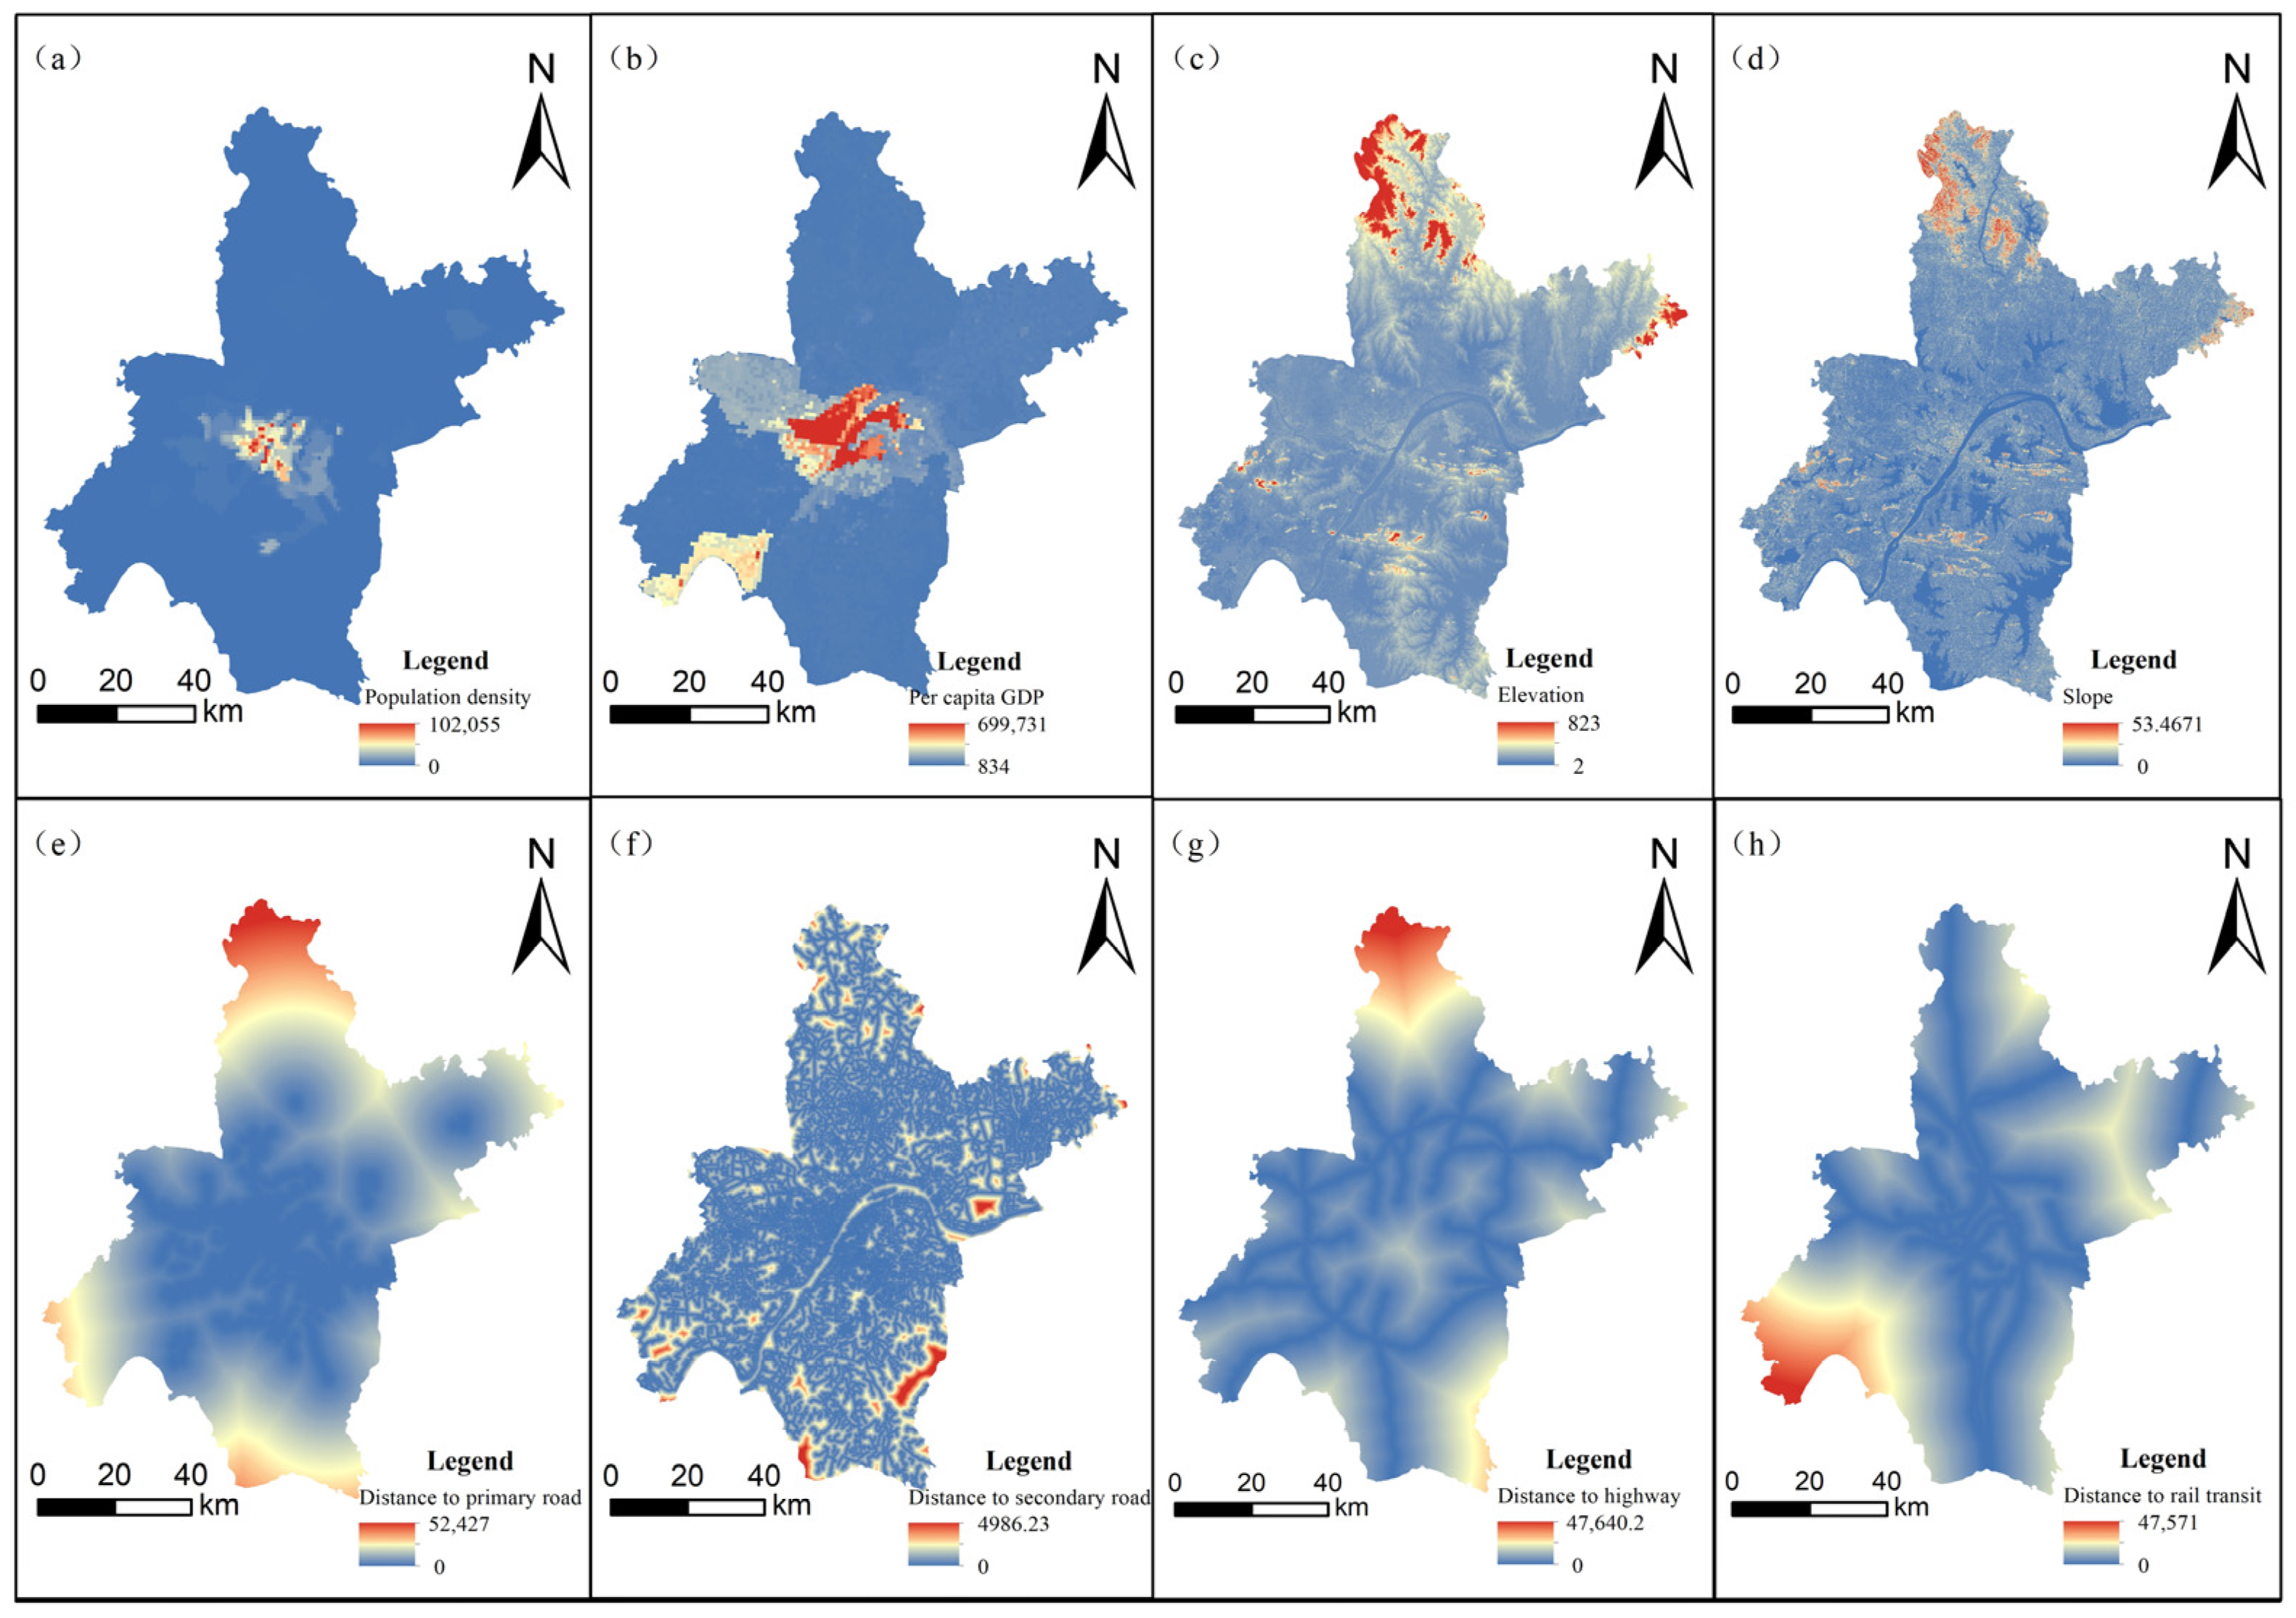
The driving factors in this paper are selected based on the principles of data accessibility, relevance, and accuracy. According to the study area’s natural geographic and socioeconomic profiles, eight indicators from socioeconomic, natural environment, and traffic network were selected as driving factors (Table 4). Figure 9 show the spatial distribution of these driving factors.
Table 4.
Driving factors and their meanings and units.
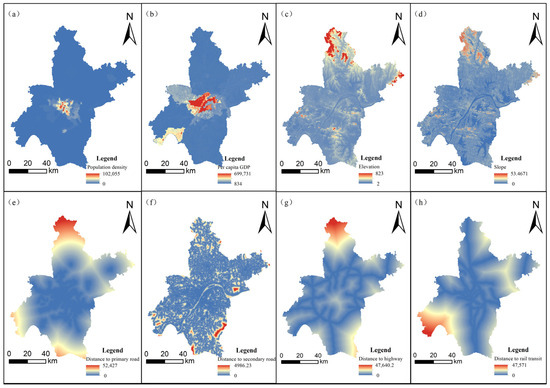
Figure 9.
Spatial distribution of driving factors. (a) PD, (b) per capita GDP, (c) elevation, (d) slope, (e) primary road, (f) secondary road, (g) highway, (h) rail transit.
3.3.2. Simulation Parameter Settings of CARS
In the PLUS model, a binary image with only 0 and 1 is required to specify the conversion of land types. Here, 0 indicates that the land use type cannot be converted to other land use types, while 1 indicates that it can be converted as required. This study aligns with the requirements of Wuhan’s Territorial Spatial Master Plan (2021–2035) and designates basic farmland, water bodies, and ecological reserves as non-convertible areas in the simulation of the future.
The conversion rule specifies whether a land type can be converted during the simulation process. To indicate whether a particular type of land can be converted, the land type conversion matrix assigns a value of 1, while a value of 0 indicates it cannot be converted. In this paper, we present a matrix (Table 5) that is based on the relevant literature and policy requirements.
Table 5.
Land type transfer matrix.
It specifies that urban vitality land can only be converted into other urban vitality land and not into any other type of land. Urban non-vitality land can be converted into urban vitality land and other vibrant sites, but not into other land types. Other vitality land can be converted into urban vitality land, urban non-vitality land, and other vitality land, but not into other types of land. Other non-vitality land can be converted into other land types except for restricted development land. Restricted development land cannot be converted to any other land type.
Domain weights have been set to determine the expansion intensity of a specific land type, ranging from 0 to 1. A higher value indicates easier expansion and lower chances of conversion to other land types. The weight is determined based on experience or expansion of each land type. This paper presents the results of various experiments conducted to determine the optimal domain weights in different contexts (Table 6).
Table 6.
Domain weights.
To analyze land use expansion, it was crucial to convert the 2010 and 2020 land use data of Wuhan into the “unsigned char” format required by the PLUS model. Then, we overlayed the land use data from both years to identify the changed raster cells. The resulting files were imported into the LEAS module of the PLUS model to determine the probability of various land types. The land type data and the driving factor file were used to assess the likelihood of different land types occurring. The parameters for the random forest regression were set as follows: a sampling rate of 0.01, meaning approximately 1% of the pixels are used for training, with 20 regression trees and a maximum of 8 features, not exceeding the number of driving factors. The running parameters were set to 6 to ensure the module ran efficiently. This process yielded the development probabilities for five land types (Figure 10).
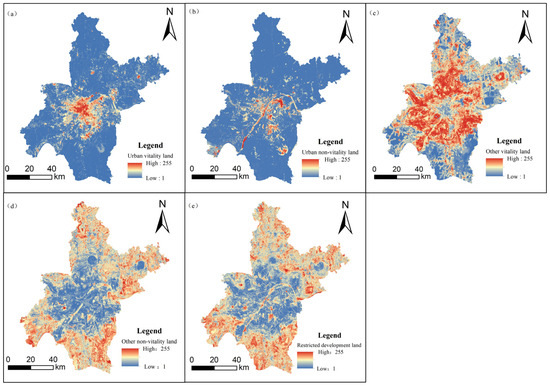
Figure 10.
Development probabilities of five land types. (a) Urban vitality land, (b) urban non-vitality land, (c) other vitality land, (d) other non-vitality land, (e) restricted development land.
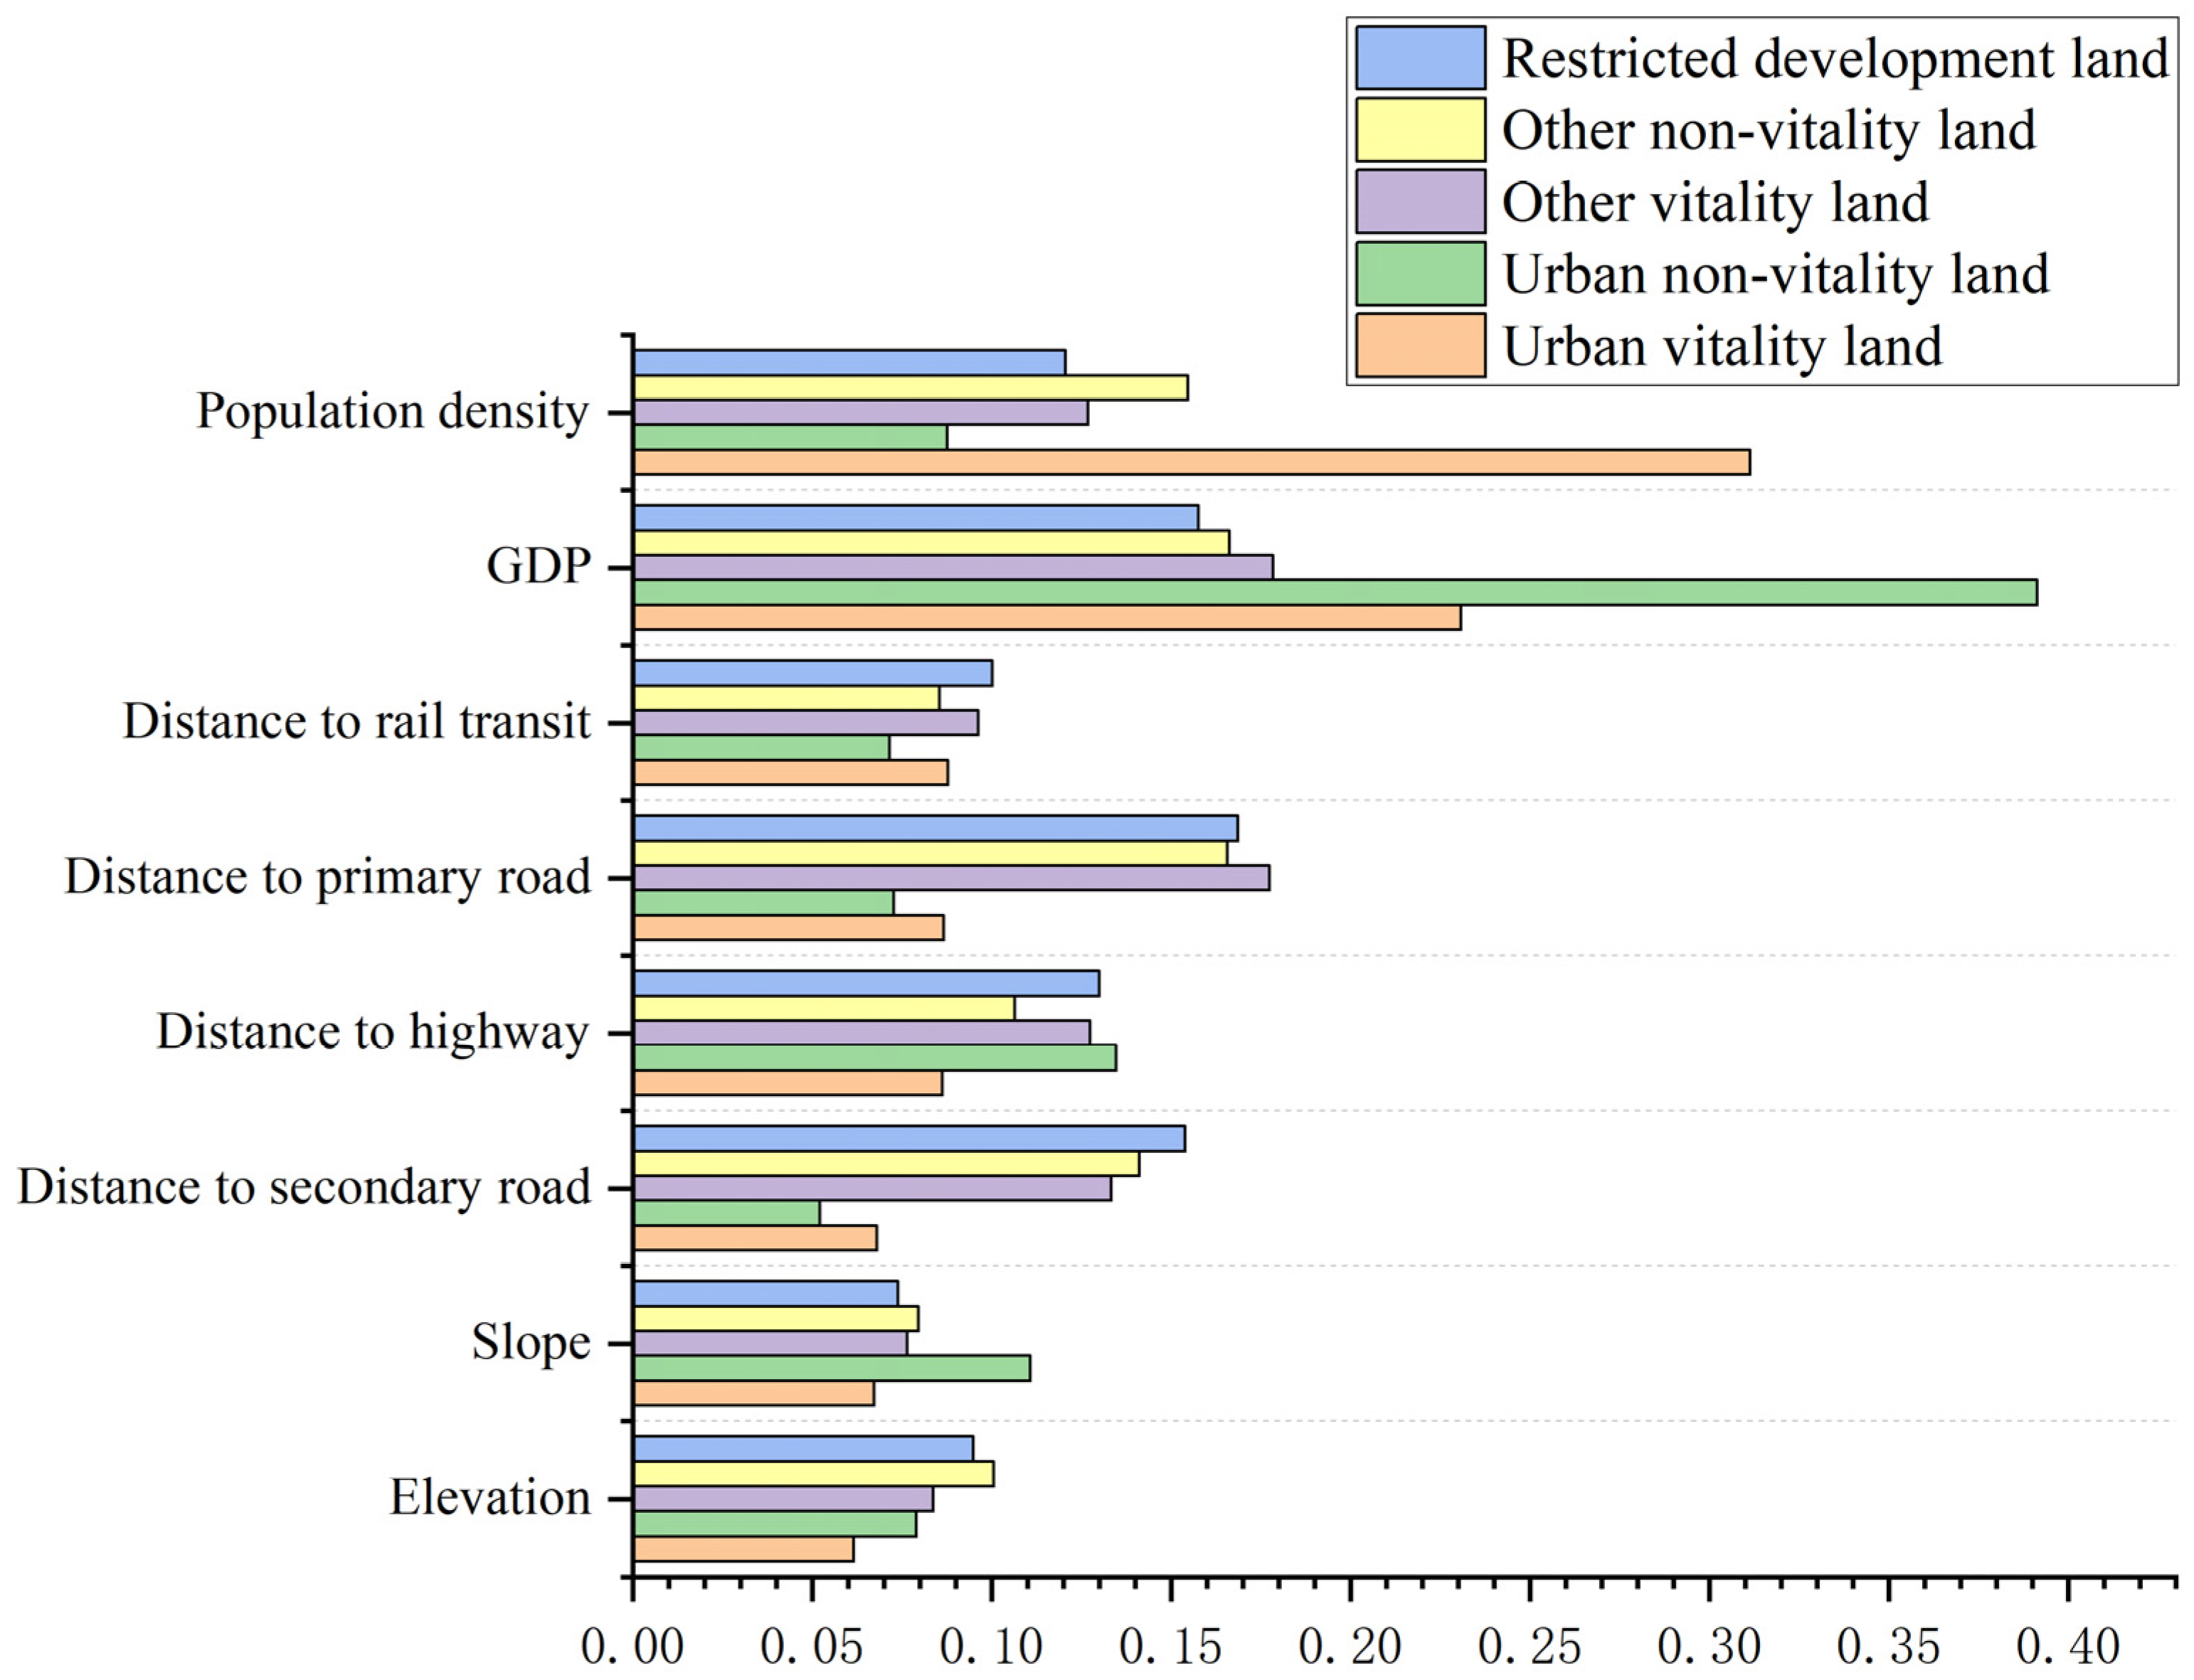
When calculating the development probability of each type of land, the PLUS model can also determine the contribution of each driving factor to different land types.
Figure 11 illustrates the factors that contribute to the expansion of urban vibrant land. PD, GDP, rail transit, and primary roads have the highest impact, while elevation and slope have the least impact. On the other hand, the expansion of urban non-vitality land is mainly influenced by GDP, highways, slope, and PD, while rail transit and secondary roads have minimal impact. Regarding the expansion of other vitality land, GDP rail transit and primary roads have the highest impact, while elevation and slope have the least impact. Similarly, for the expansion of other non-vitality land, GDP, primary roads, and secondary roads contribute the most, while rail transit and slope have minimal impact. In terms of restricted development land, primary roads and PD have the most significant impact, while elevation and slope have minimal impact.
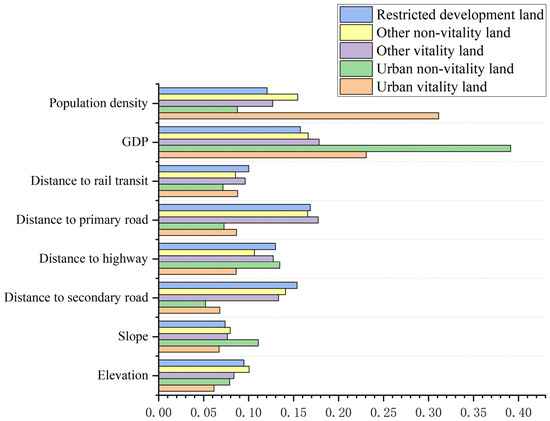
Figure 11.
Contribution of each driving factor to different land types.
4. Results and Analysis
4.1. Multi-Stage Simulation Forecasting
4.1.1. Modelling Projections of Urban Growth Boundaries in Three Phases
This study outlines the simulation of Wuhan’s future growth boundary, divided into three phases: incremental development (2020–2030), incremental and stock development (2030–2040), and stock development (2040–2050).
During the incremental development stage, the expansion strategy is based on incremental expansion, focusing on developing other vitality land to expand the urban boundary. This study assumes that the change rule of land types in this stage is consistent with the previous one, where restricted development land is prohibited from development. The table below shows the number of image elements for each type of land in 2030, obtained through Markov chain plate simulation of the PLUS model (Table 7).
Table 7.
Incremental development-phase land requirements.
During the incremental and stock development phase, the expansion strategy is to develop vitality land while upgrading non-vitality land in the city. This study assumes that the rule for changing land types in this stage remains consistent with the previous one, and that restricted development land is still prohibited from development. The table below shows the number of image elements for each type of land type in 2040, obtained through the PLUS model Markov chain plate simulation (Table 8).
Table 8.
Demand for land in both incremental and stock development phases.
During the stock development stage, there is relatively low demand for incremental development. Instead, the focus is on developing non-vitality land to enhance the expansion characteristics of urban vitality. This study assumes that the rule for changing land types in this stage remains consistent with the previous stage. The development of land for rigid edges is restricted. Using the PLUS model Markov chain plate simulation, the number of similar elements of different land types in 2050 was determined. The results are presented in the Table 9 below.
Table 9.
Demand for land at stock development stage.
4.1.2. Dynamic Analysis of Simulation Results
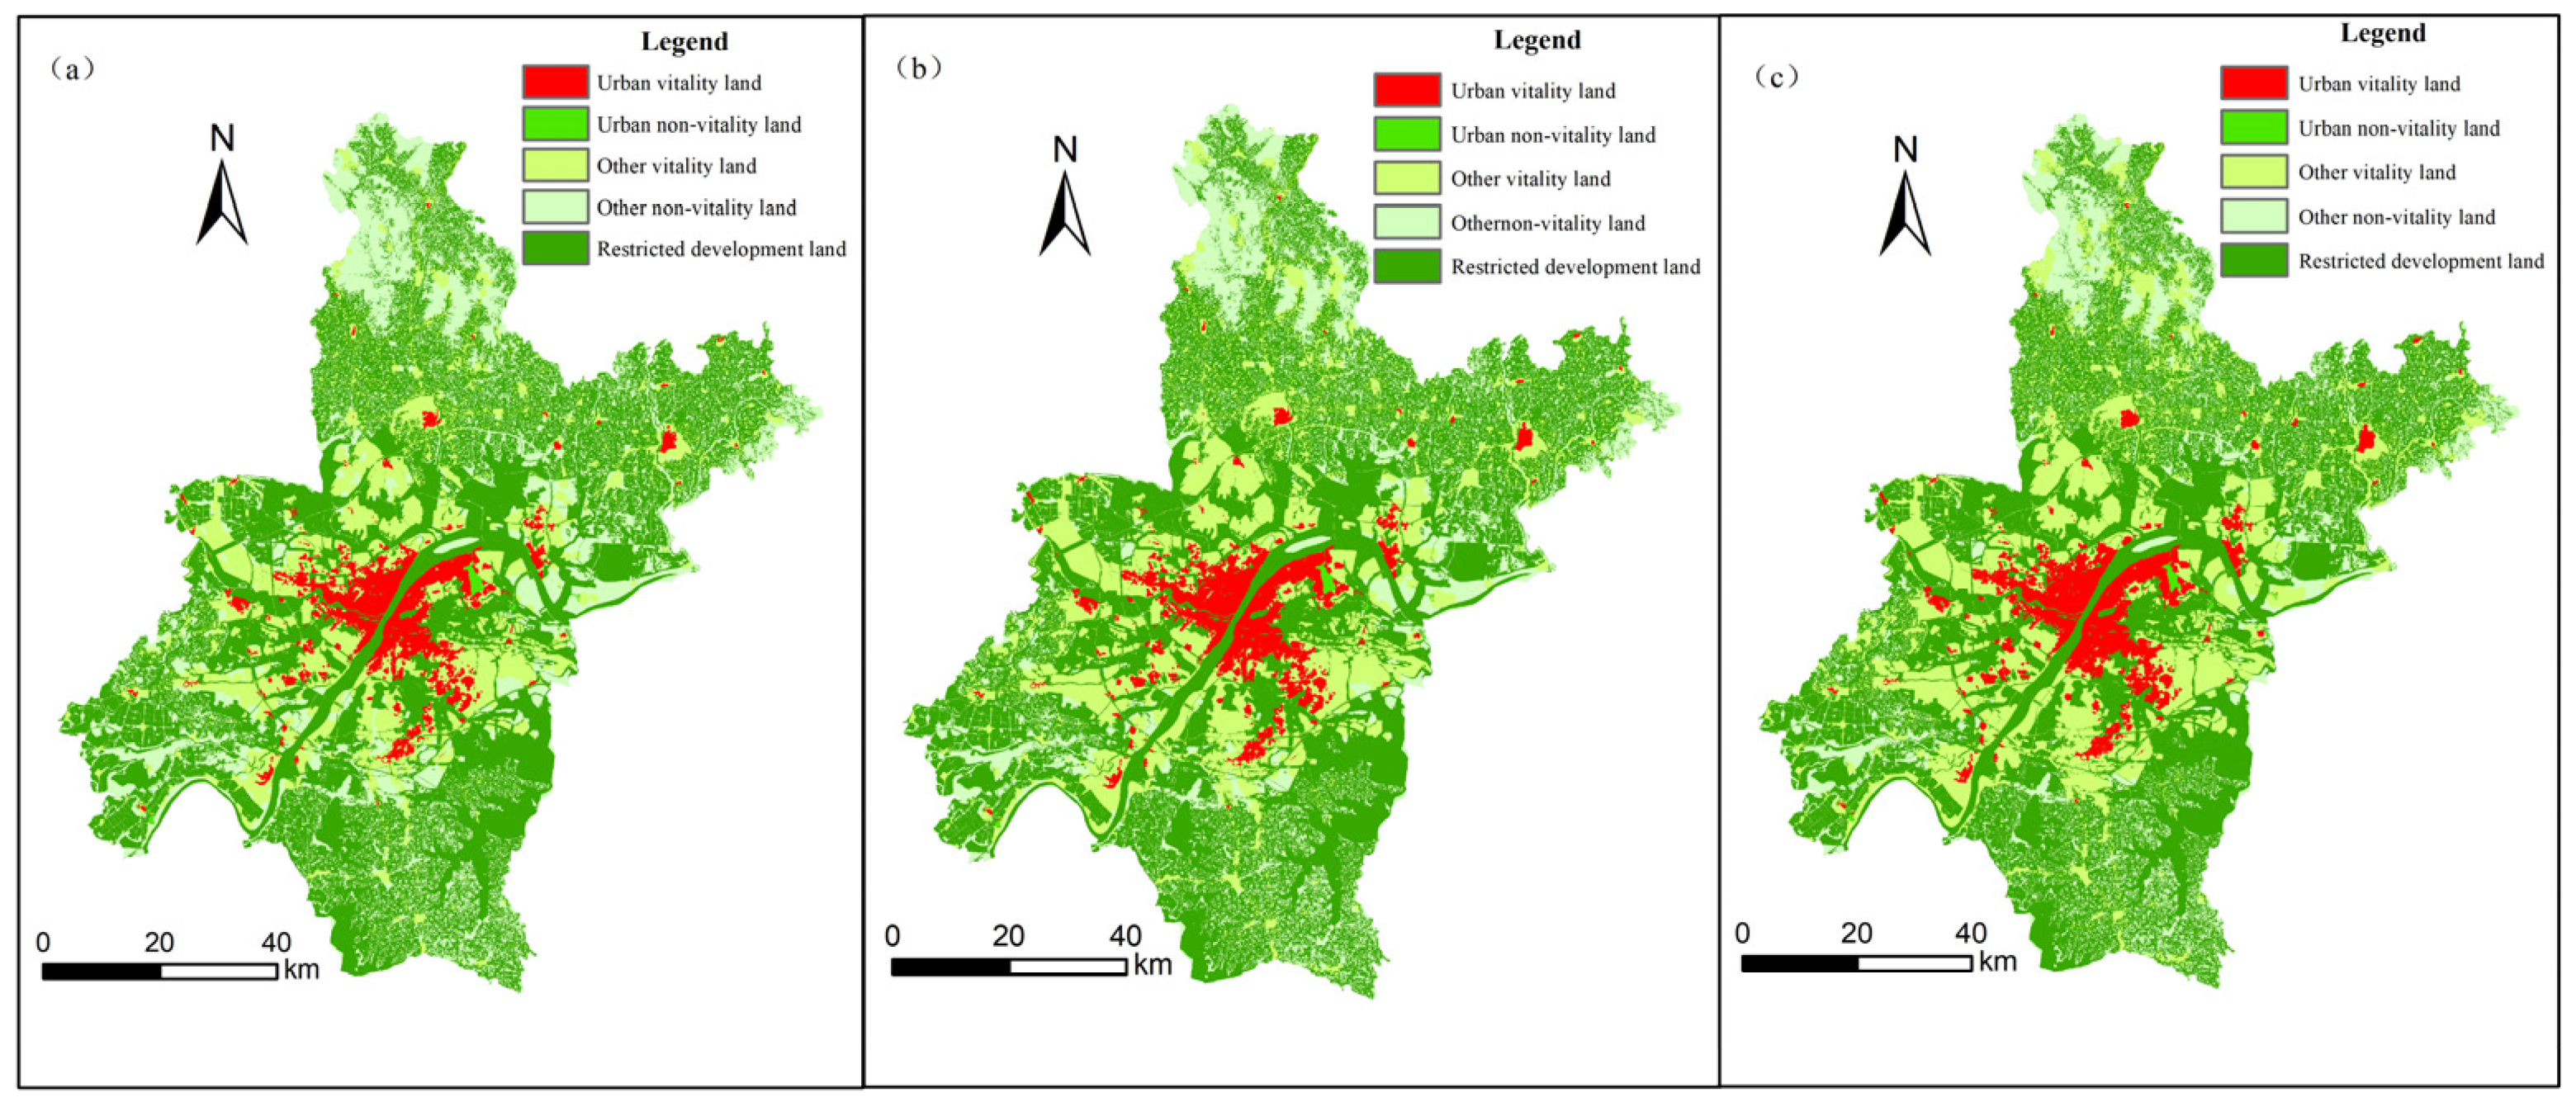
The probabilities for the development of each type of land use were determined using land use data from 2010 and 2020. These parameters were then used in the PLUS model to simulate land use in the three phases mentioned above (Figure 12). The simulation produced results for each phase, and the attribute table tool was used to calculate the area of each type of land use in different phases and create a table (Table 10).
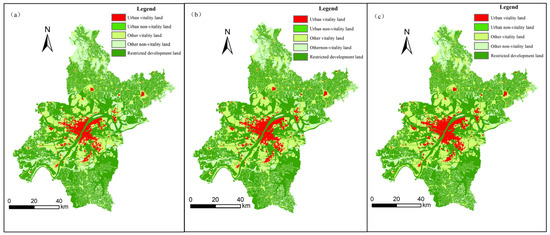
Figure 12.
Simulation results of land use in Wuhan at different stages. (a) Incremental development stage from 2020 to 2030, (b) incremental and stock development stage from 2030 to 2040, (c) stock development stage from 2040 to 2050.
Table 10.
Area of five land types at different stages.
After several comparative analyses, it was concluded that the simulation results align with the general law of urban development and can better predict future urban development. The provided figures and tables illustrate that from 2020 to 2050, the area of urban vitality land will continue to expand, while the area of non-vitality land will decrease. The area of restricted development land will remain unchanged due to its rigid boundaries, which cannot be overcome during the city’s future expansion. The following sections describe the specifics of each of the three phases.
During the incremental development stage, the area of each land type increased or decreased by varying amounts. Specifically, the area of urban vitality land increased by 31.9995 km2, while the area of urban non-vitality land decreased by 4.3317 km2. The area of other vitality land increased by 386.55 km2, while the area of other non-vitality land decreased by a larger amount, which was 414.2178 km2. It is important to note that these changes are in comparison to the year 2020. The simulation results indicate that urban vitality land is expanding through infill, primarily from surrounding urban vitality zones. Expansion from urban non-vitality land and other non-vitality land is minimal. The increase in other non-vitality land comes from within that category. The new increase in other vitality land is mainly distributed in the Wujiashan and Changfu areas.
During the phases of incremental and stock development, the area of each land type increased by 40.7916 km2 compared to 2030. The area of urban vitality land increased, while the area of urban non-vitality land decreased by 2.9574 km2. Additionally, the area of other vitality land increased by 307.7505 km2, and the area of other non-vitality land decreased by 345.5847 km2. The expansion of urban vitality land is primarily concentrated in its original base and the surrounding areas. Qiaokou and Hongshan District have experienced the most significant expansion.
During the stock development stage, the area of each site increases by 48.1007 km2 compared to 2040. The area of urban vitality land also increases by 48.1007 km2, while the area of urban non-vitality land decreases by 2.5299 km2. Additionally, the area of other vitality land increases by 242.7462 km2, and the area of other non-vitality land decreases by 288.324 km2. The analysis of the simulation results map reveals that urban vitality land is expanding in all directions and filling its interior.
4.2. Delineation of UGBs
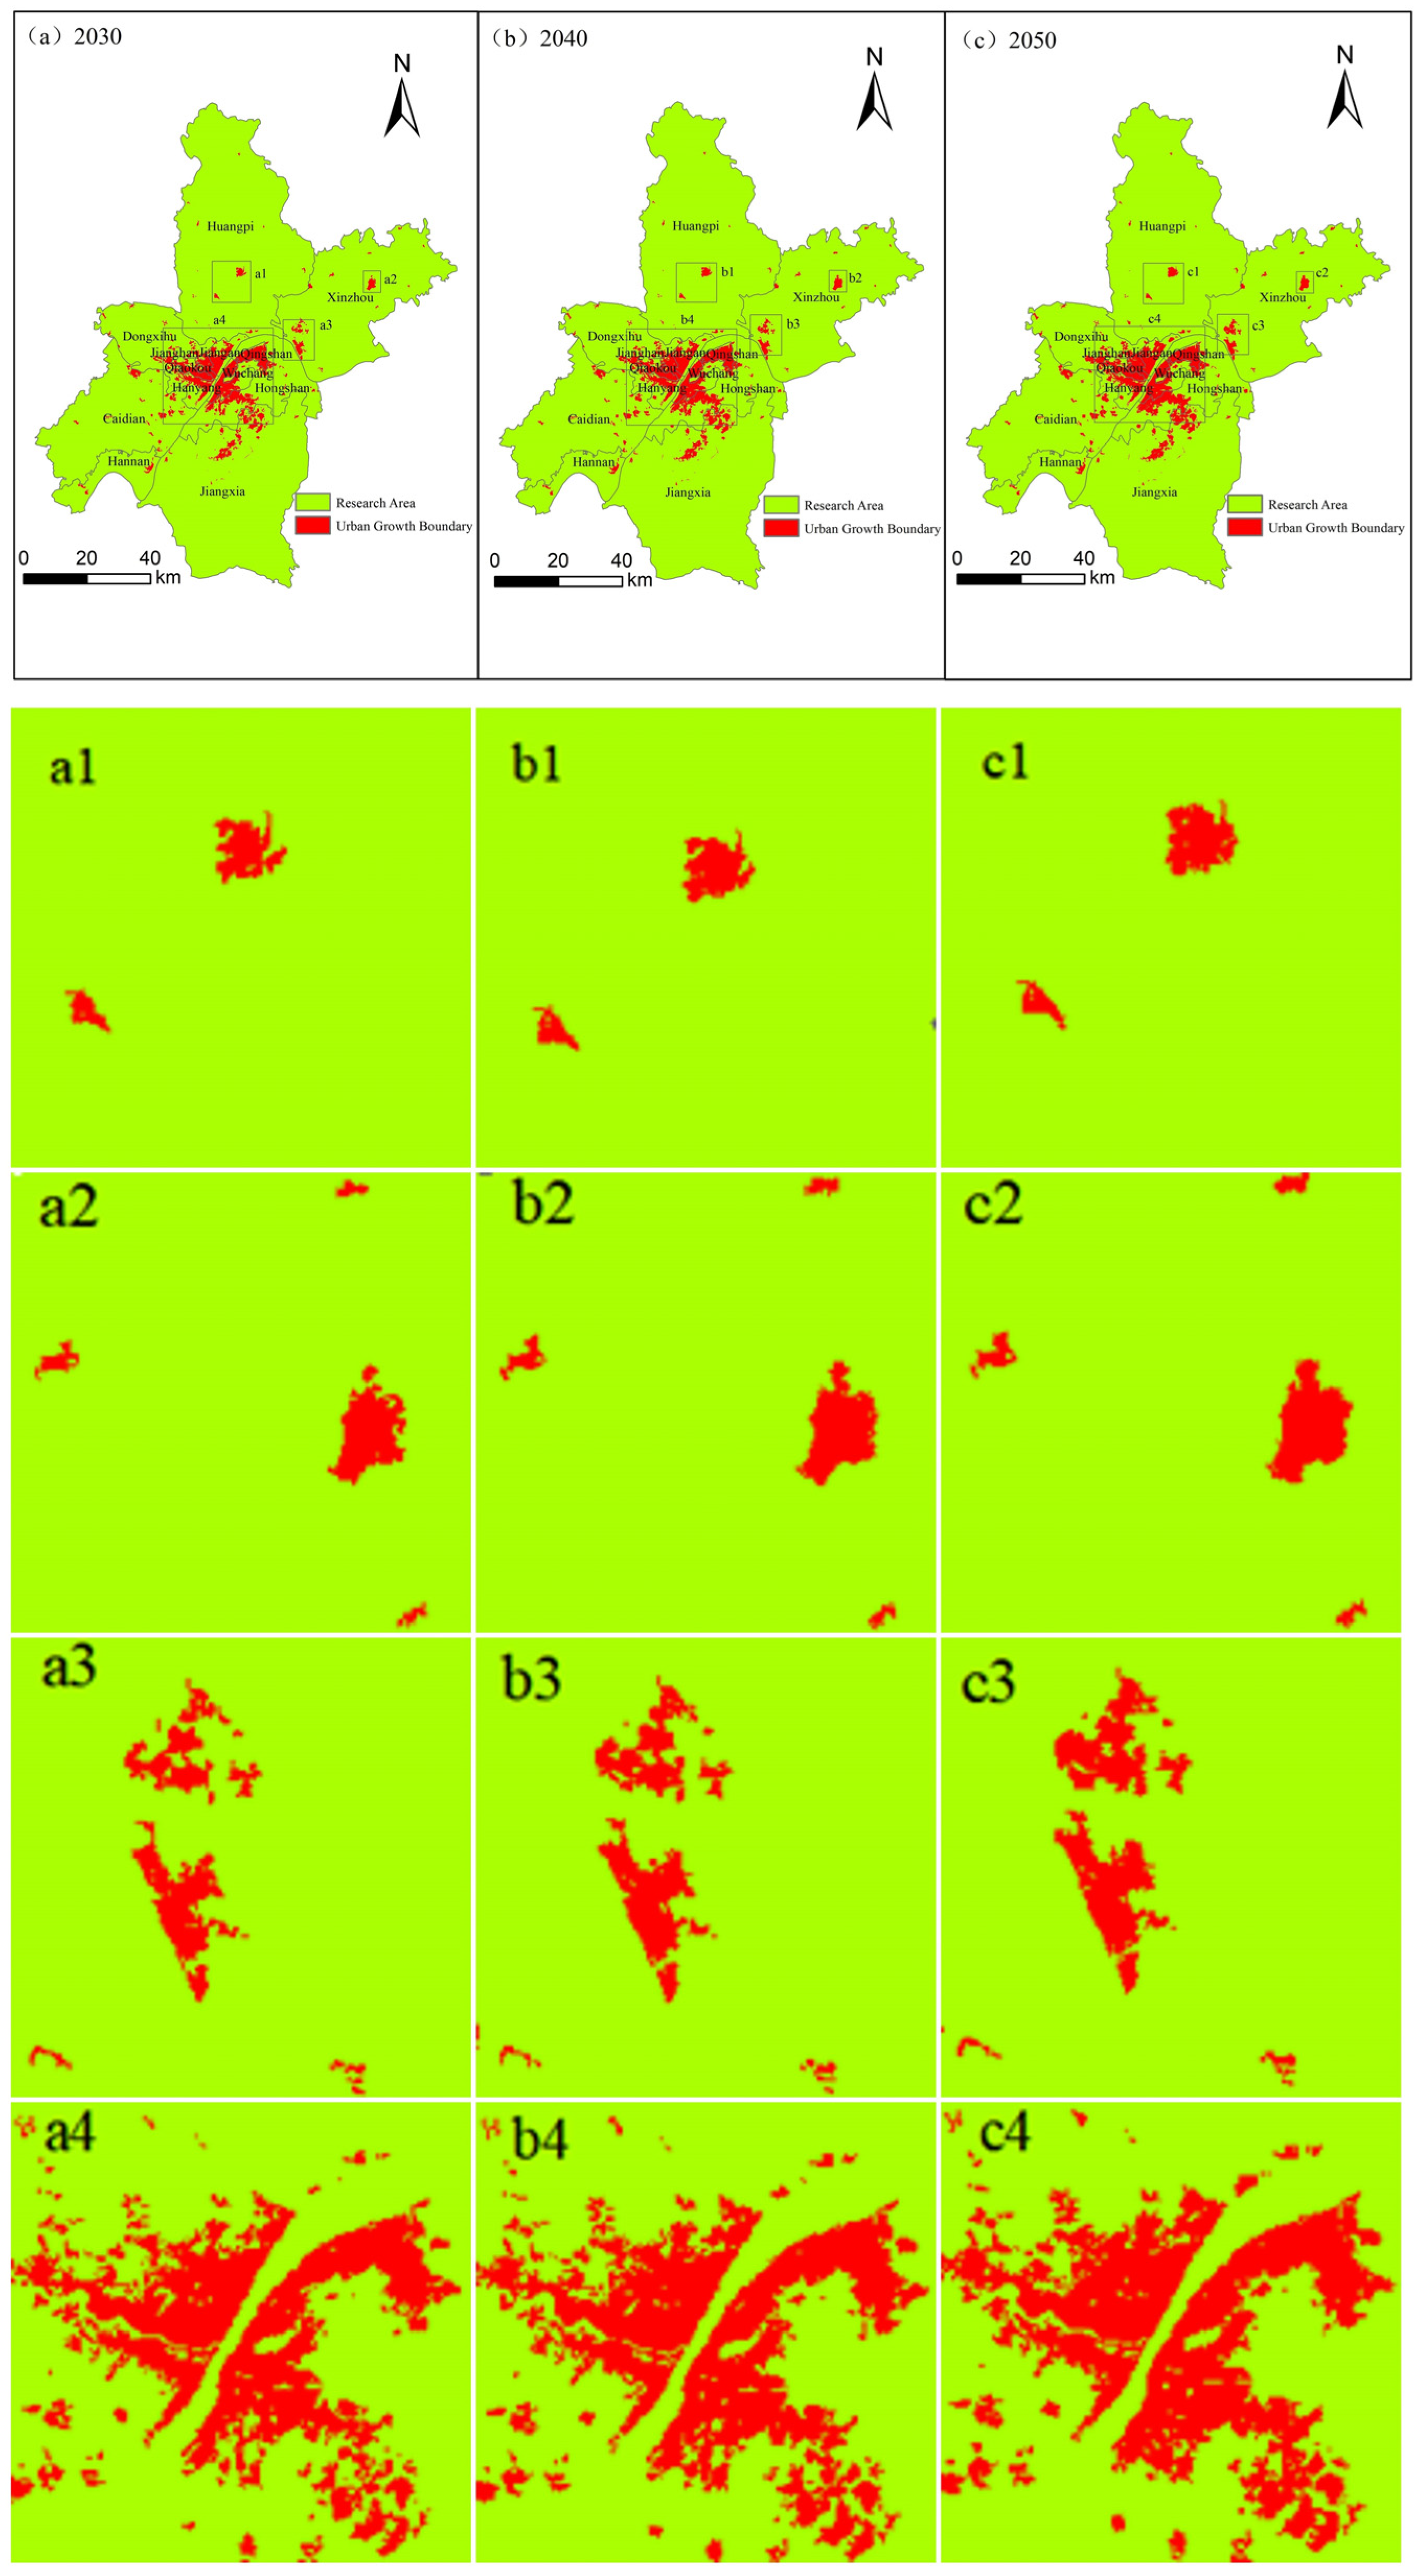
This study considers the urban vitality land and urban non-vitality land within the simulation results of each stage as the scope of the UGB. Based on the delineation of the UGB, this study concludes that the UGBs of Wuhan will expand to 436.463 km2, 474.617 km2, and 520.396 km2 in 2030, 2040, and 2050, respectively. As shown in Figure 13, a1, a2, a3, and a4 are the enlarged maps of several major urban built-up areas in 2030, while b1, b2, b3, and b4 as well as c1, c2, c3, and c4 correspond to 2040 and 2050, respectively.
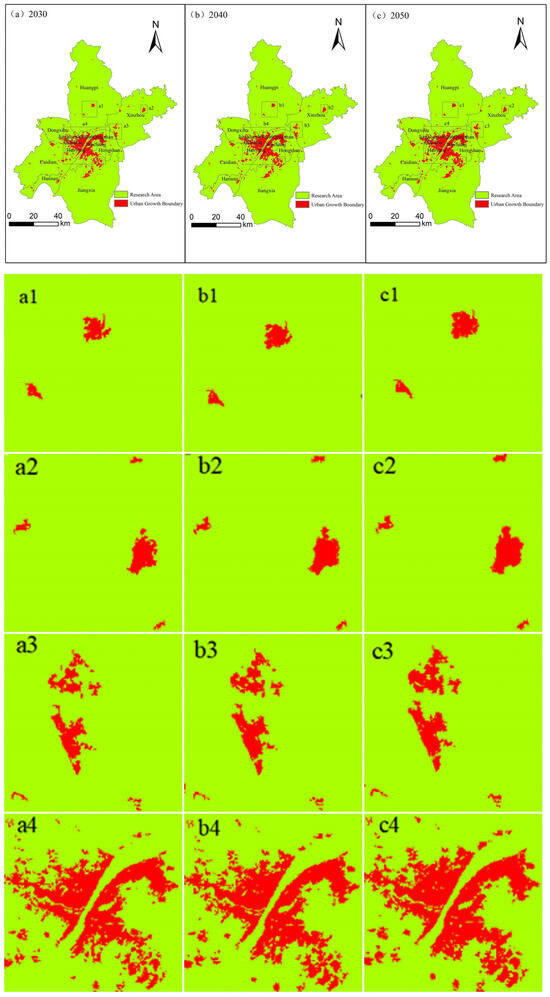
Figure 13.
UGBs of Wuhan at different stages. (a) UGB in 2030, (b) UGB in 2040, (c) UGB in 2050.
In terms of overall distribution, Wuhan’s UGB exhibits a pattern of “one center and multiple clusters”. The “one center” refers to the old urban area of Wuhan, main within the seven central districts. The “multiple clusters” mainly consist of the core areas of some new cities and new city clusters. In terms of spatial form, there are some gaps within the main patches of Wuhan’s UGB in 2030. However, by 2040 and 2050, the gaps that are not restricted for development are filled and each patch gradually expands outward and aggregates with each other. Overall, as Wuhan’s urban development shifts from incremental to stock development mode, the shape of its UGB is also optimized.
5. Conclusions and Discussion
This study presents a scientific and rational prediction of the future UGB in the study area of Wuhan. This study uses a built-up area composite index (POI&ISA index) constructed by superimposing POI kernel density and impervious surface index. This index can be applied to extract vitality zones in Wuhan and further classify urban spatial development potential into five categories based on current land use status: urban vitality land, urban non-vitality land, other vitality land, other non-vitality land, and restricted development land in 2010 and 2020. The LEAS is then used to identify the development potential of different land types and the contribution of various driving factors by extracting land type expansion. Then, the future demand for each type of land is predicted through Markov chain. Based on these analyses, different expansion strategies oriented towards stock development are set to obtain the simulation results of the UGBs of Wuhan for the periods of 2030, 2040, and 2050. The UGB delineation process proposed in this paper considers the excavation of inefficient and idle land in different stages of the future, which is undoubtedly more in line with the future trend of urban spatial development under the background of stock development and will guide smart growth of cities and efficient utilization of urban land. The delineation of UGBs in three periods for Wuhan can also provide certain references for controlling the increasingly imbalanced urban expansion of Wuhan.
Compared to previous studies, this study has three innovative contributions: (1) When evaluating urban vitality, a comprehensive evaluation is carried out by constructing a built-up area composite index (POI&ISA index). This method can provide a more integrated perspective to extract urban vitality zones and urban non-vitality zones more accurately, reducing the error generated by using only a single factor to extract urban vitality zones. It also provides a better data basis for subsequent land type classification and simulation. (2) This study predicts the urban expansion scenarios of Wuhan in three different periods in the future, spanning up to 30 years. As China’s urbanization enters the middle and later stages of development, urban development is gradually shifting from large-scale incremental construction to stock quality improvement. The results provide a reference for near-term urban development planning and can also aid in the city’s long-term planning. (3) The PLUS model is employed to simulate future UGBs expansion. This model is relatively new and has broad application prospects. It integrates the rule mining method based on land expansion analysis and the CA model based on multiple types of random patch seeds. This integration is effective in mining the driving factors of land expansion and predicting the patch-level evolution of the land use landscape.
Although this study has made significant research contributions, it still has some limitations. Firstly, the development process of the city is impacted by multiple factors and facets. However, the PLUS model selects driving factors from three categories: natural environment factors, socioeconomic factors, and traffic network factors, with a total of eight types of data. Thus, this study may have shortcomings in the selection of driving factors. Secondly, the parameter settings in the PLUS model will have a direct impact on the final simulation results. This study relies heavily on the existing results of other scholars and repeated experiments to improve parameter setting. While efforts have been made to minimize its impact on the simulation results, some subjectivity may present. In addition, this study sets three urban development scenarios for the periods of 2020–2030, 2030–2040, and 2040–2050, respectively, focusing on incremental development, balanced development between incremental and stock, and stock development. Although the gradual transition of urban development is considered, the proportion of incremental and stock development in actual urban development is often difficult to accurately determine, especially considering that different cities are at different stages of development. Therefore, the results of the UGB delineation in this study are mainly aimed at guiding the direction of urban development.
Author Contributions
Y.Z., X.X. and J.W. conceived and designed this study. Funding acquisition was led by Y.Z. and H.W.; J.L., H.W. and X.D. contributed to data acquisition. J.L. and X.D. contributed to methodology. J.L., L.X. and C.Y. were involved in drafting the initial manuscript. C.Y. contributed to visualization. Y.Z. and X.X. contributed to the final manuscript revision. All authors have read and agreed to the published version of the manuscript.
Funding
This study was supported by the Key Program of National Natural Science Foundation of China (42230107), and the Open Research Fund Program of Key Laboratory of Digital Mapping and Land Information Application, Ministry of Natural Resources (ZRZYBWD202201).
Data Availability Statement
The data presented in this study are available on request from the corresponding author.
Conflicts of Interest
The authors declare no conflicts of interest.
References
- Poudel, D.P.; Blackburn, S.; Manandhar, R.; Adhikari, B.; Ensor, J.; Shrestha, A.; Timsina, N.P. The Urban Political Ecology of ‘Haphazard Urbanisation’ and Disaster Risk Creation in the Kathmandu Valley, Nepal. Int. J. Disaster Risk Reduct. 2023, 96, 103924. [Google Scholar] [CrossRef]
- Almulhim, A.I.; Cobbinah, P.B. Can Rapid Urbanization Be Sustainable? The Case of Saudi Arabian Cities. Habitat Int. 2023, 139, 102884. [Google Scholar] [CrossRef]
- Buckley, R.M.; Simet, L. An Agenda for Habitat III: Urban Perestroika. Environ. Urban. 2016, 28, 64–76. [Google Scholar] [CrossRef]
- Wang, L.; Li, C.; Ying, Q.; Cheng, X.; Wang, X.; Li, X.; Hu, L.; Liang, L.; Yu, L.; Huang, H.; et al. China’s Urban Expansion from 1990 to 2010 Determined with Satellite Remote Sensing. Chin. Sci. Bull. 2012, 57, 2802–2812. [Google Scholar] [CrossRef]
- Bai, X.; Shi, P.; Liu, Y. Society: Realizing China’s Urban Dream. Nature 2014, 509, 158–160. [Google Scholar] [CrossRef]
- Cao, K.; Deng, Y.; Song, C. Exploring the Drivers of Urban Renewal through Comparative Modeling of Multiple Types in Shenzhen, China. Cities 2023, 137, 104294. [Google Scholar] [CrossRef]
- Cao, K.; Harris, R.; Liu, S.; Deng, Y. How Does Urban Renewal Affect Residential Segregation in Shenzhen, China? A Multi-Scale Study. Sustain. Cities Soc. 2024, 102, 105228. [Google Scholar] [CrossRef]
- Zhang, W.; Zhang, X.; Wu, G. The Network Governance of Urban Renewal: A Comparative Analysis of Two Cities in China. Land Use Policy 2021, 106, 105448. [Google Scholar] [CrossRef]
- Guo, R.; Ding, Y.; Shang, L.; Wang, D.; Cao, X.; Wang, S.; Bonatz, N.; Wang, L. Sustainability-Oriented Urban Renewal and Low-Impact Development Applications in China: Case Study of Yangpu District, Shanghai. J. Sustain. Water Built Environ. 2018, 4, 05017006. [Google Scholar] [CrossRef]
- He, F.; Yang, J.; Zhang, Y.; Sun, D.; Wang, L.; Xiao, X.; Xia, J. Offshore Island Connection Line: A New Perspective of Coastal Urban Development Boundary Simulation and Multi-Scenario Prediction. GISci. Remote Sens. 2022, 59, 801–821. [Google Scholar] [CrossRef]
- Howard, E. Garden Cities of To-Morrow; MIT Press: Cambridge, MA, USA, 1965; ISBN 978-0-262-58002-1. [Google Scholar]
- Wang, Y.; Gu, C.; Li, X. Research Progress on Urban Growth Boundaries in China and Abroad. Urban Plan. Int. 2014, 29, 1–11. [Google Scholar]
- Bengston, D.N.; Fletcher, J.O.; Nelson, K.C. Public Policies for Managing Urban Growth and Protecting Open Space: Policy Instruments and Lessons Learned in the United States. Landsc. Urban Plan. 2004, 69, 271–286. [Google Scholar] [CrossRef]
- Huang, D.; Huang, J.; Liu, T. Delimiting Urban Growth Boundaries Using the CLUE-S Model with Village Administrative Boundaries. Land Use Policy 2019, 82, 422–435. [Google Scholar] [CrossRef]
- Liu, X.; Wei, M.; Li, Z.; Zeng, J. Multi-Scenario Simulation of Urban Growth Boundaries with an ESP-FLUS Model: A Case Study of the Min Delta Region, China. Ecol. Indic. 2022, 135, 108538. [Google Scholar] [CrossRef]
- Zheng, X.; Lv, L. A WOE Method for Urban Growth Boundary Delineation and Its Applications to Land Use Planning. Int. J. Geogr. Inf. Sci. 2016, 30, 691–707. [Google Scholar] [CrossRef]
- Long, Y.; Han, H.; Mao, Q. Establishing Urban Growth Boundaries Using Constrained CA. Acta Geogr. Sin. 2009, 64, 999–1008. [Google Scholar]
- Wang, W.; Jiao, L.; Jia, Q.; Liu, J.; Mao, W.; Xu, Z.; Li, W. Land Use Optimization Modelling with Ecological Priority Perspective for Large-Scale Spatial Planning. Sustain. Cities Soc. 2021, 65, 102575. [Google Scholar] [CrossRef]
- Yao, Z.; Jiang, C.; Shan-shan, F. Effects of Urban Growth Boundaries on Urban Spatial Structural and Ecological Functional Optimization in the Jining Metropolitan Area, China. Land Use Policy 2022, 117, 106113. [Google Scholar] [CrossRef]
- Li, X.; Zhang, Y.; Liu, X.; Chen, Y. Assimilating Process Context Information of Cellular Automata into Change Detection for Monitoring Land Use Changes. Int. J. Geogr. Inf. Sci. 2012, 26, 1667–1687. [Google Scholar] [CrossRef]
- Xia, C.; Zhang, A.; Wang, H.; Zhang, B. Modeling Urban Growth in a Metropolitan Area Based on Bidirectional Flows, an Improved Gravitational Field Model, and Partitioned Cellular Automata. Int. J. Geogr. Inf. Sci. 2019, 33, 877–899. [Google Scholar] [CrossRef]
- Zheng, H.W.; Shen, G.Q.; Wang, H.; Hong, J. Simulating Land Use Change in Urban Renewal Areas: A Case Study in Hong Kong. Habitat Int. 2015, 46, 23–34. [Google Scholar] [CrossRef]
- Wang, H.; Peng, P.; Kong, X.; Zhang, T.; Yi, G. Evaluating the Suitability of Urban Expansion Based on the Logic Minimum Cumulative Resistance Model: A Case Study from Leshan, China. ISPRS Int. J. Geo-Inf. 2019, 8, 291. [Google Scholar] [CrossRef]
- Liu, X.; Wei, M.; Zeng, J. Simulating Urban Growth Scenarios Based on Ecological Security Pattern: A Case Study in Quanzhou, China. Int. J. Environ. Res. Public Health 2020, 17, 7282. [Google Scholar] [CrossRef]
- Longato, D.; Cortinovis, C.; Balzan, M.; Geneletti, D. A Method to Prioritize and Allocate Nature-Based Solutions in Urban Areas Based on Ecosystem Service Demand. Landsc. Urban Plan. 2023, 235, 104743. [Google Scholar] [CrossRef]
- Xu, L.; Huang, Q.; Ding, D.; Mei, M.; Qin, H. Modelling Urban Expansion Guided by Land Ecological Suitability: A Case Study of Changzhou City, China. Habitat Int. 2018, 75, 12–24. [Google Scholar] [CrossRef]
- Huang, X.; Wang, H.; Xiao, F. Simulating Urban Growth Affected by National and Regional Land Use Policies: Case Study from Wuhan, China. Land Use Policy 2022, 112, 105850. [Google Scholar] [CrossRef]
- Barredo, J.I.; Kasanko, M.; McCormick, N.; Lavalle, C. Modelling Dynamic Spatial Processes: Simulation of Urban Future Scenarios through Cellular Automata. Landsc. Urban Plan. 2003, 64, 145–160. [Google Scholar] [CrossRef]
- Huang, Q.; Song, W. A Land-Use Spatial Optimum Allocation Model Coupling a Multi-Agent System with the Shuffled Frog Leaping Algorithm. Comput. Environ. Urban Syst. 2019, 77, 101360. [Google Scholar] [CrossRef]
- Liu, G.; Jin, Q.; Li, J.; Li, L.; He, C.; Huang, Y.; Yao, Y. Policy Factors Impact Analysis Based on Remote Sensing Data and the CLUE-S Model in the Lijiang River Basin, China. Catena 2017, 158, 286–297. [Google Scholar] [CrossRef]
- Clarke, K.; Hoppen, S.; Gaydos, L. A self-modifying cellular automaton model of historical. Environ. Plan. B Plan. Des. 1997, 24, 247–261. [Google Scholar] [CrossRef]
- Tayyebi, A.; Pijanowski, B.C.; Tayyebi, A.H. An urban growth boundary model using neural networks, GIS and radial parameterization: An application to Tehran, Iran. Landsc. Urban Plan. 2011, 100, 35–44. [Google Scholar] [CrossRef]
- Liang, X.; Liu, X.; Li, X.; Chen, Y.; Tian, H.; Yao, Y. Delineating Multi-Scenario Urban Growth Boundaries with a CA-Based FLUS Model and Morphological Method. Landsc. Urban Plan. 2018, 177, 47–63. [Google Scholar] [CrossRef]
- Verburg, P.H.; de Koning, G.H.J.; Kok, K.; Veldkamp, A.; Bouma, J. A Spatial Explicit Allocation Procedure for Modelling the Pattern of Land Use Change Based upon Actual Land Use. Ecol. Model. 1999, 116, 45–61. [Google Scholar] [CrossRef]
- Vermeiren, K.; Van Rompaey, A.; Loopmans, M.; Serwajja, E.; Mukwaya, P. Urban growth of Kampala, Uganda: Pattern analysis and scenario development. Landsc. Urban Plan. 2012, 106, 199–206. [Google Scholar] [CrossRef]
- Xu, Q.; Wang, Q.; Liu, J.; Liang, H. Simulation of Land-Use Changes Using the Partitioned ANN-CA Model and Considering the Influence of Land-Use Change Frequency. ISPRS Int. J. Geoinf. 2021, 10, 346. [Google Scholar] [CrossRef]
- Liu, X.; Liang, X.; Li, X.; Xu, X.; Ou, J.; Chen, Y.; Li, S.; Wang, S.; Pei, F. A Future Land Use Simulation Model (FLUS) for Simulating Multiple Land Use Scenarios by Coupling Human and Natural Effects. Landsc. Urban Plan. 2017, 168, 94–116. [Google Scholar] [CrossRef]
- Liang, X.; Guan, Q.; Clarke, K.C.; Liu, S.; Wang, B.; Yao, Y. Understanding the Drivers of Sustainable Land Expansion Using a Patch-Generating Land Use Simulation (PLUS) Model: A Case Study in Wuhan, China. Comput. Environ. Urban Syst. 2021, 85, 101569. [Google Scholar] [CrossRef]
- Lai, Z.; Chen, C.; Chen, J.; Wu, Z.; Wang, F.; Li, S. Multi-Scenario Simulation of Land-Use Change and Delineation of Urban Growth Boundaries in County Area: A Case Study of Xinxing County, Guangdong Province. Land 2022, 11, 1598. [Google Scholar] [CrossRef]
- Xia, X.; Zhang, Y.; Shi, X.; Chen, J.; Rao, T. Simulation of Dynamic Urban Growth Boundary Combining Urban Vitality and Ecological Networks: A Case Study in Chengdu Metropolitan Area. Land 2022, 11, 179. [Google Scholar] [CrossRef]
- Ridd, M.K. Exploring a V-I-S (vegetation-impervious surface-soil) model for urban ecosystem analysis through remote sensing: Comparative anatomy for cities. Int. J. Remote Sens. 1995, 16, 2165–2185. [Google Scholar] [CrossRef]


Disclaimer/Publisher’s Note: The statements, opinions and data contained in all publications are solely those of the individual author(s) and contributor(s) and not of MDPI and/or the editor(s). MDPI and/or the editor(s) disclaim responsibility for any injury to people or property resulting from any ideas, methods, instructions or products referred to in the content. |
© 2024 by the authors. Licensee MDPI, Basel, Switzerland. This article is an open access article distributed under the terms and conditions of the Creative Commons Attribution (CC BY) license (https://creativecommons.org/licenses/by/4.0/).