Abstract
In modern conditions of climate change and increased anthropogenic pressure on aquatic ecosystems, the study of the diversity of organisms in the Arctic has become a top priority. Our study continues a series of studies on the biodiversity of Arctic rivers. Using innovative methods, such as ecological mapping, statistics, and bioindication, we identify environmental factors that influence phytoplankton diversity in the river basin under study. For the Anabar Arctic River, an increase in the diversity of phytoplankton was found to the north towards the mouth of the river, which is associated with an increase in turbidity from industrial discharges. A weak effect of organic pollution and toxic effects associated with existing settlements have been identified, but it has been established that natural processes of self-purification take place in the studied Arctic River. Among 210 species of phytoplankton, an increase in the diversity of chrysophytes in the northern direction was revealed, consistent with the intensification of severe Arctic climatic conditions. Since the study region is characterized by increased diamond mining, we recommend continuing to monitor phytoplankton, track changes in the Anabar River ecosystem, and expand such observations to other Arctic rivers.
1. Introduction
The study of the diversity of organisms in the Arctic is of high priority, as it can indicate the impact of changing climatic conditions [1]. It is important to assess the impact not only of climate warming, which is currently receiving considerable attention [2] but also the impact of low-temperature conditions on the diversity and functioning of aquatic ecosystems [3]. Phytoplankton is the most sensitive link, quickly responding to changes in habitat conditions, on the one hand, and on the other hand, retaining the imprint of impact in permafrost conditions [4]. The study of the Arctic rivers shows the dynamics of phytoplankton diversity along the river channel from south to north, which can be used to track the influence of Arctic conditions on its formation [5]. Phytoplankton does not exhaust the entire flora of the river but is a homogeneous community, thus suitable for analyzing the dynamics of impact, removing other influencing factors such as substrate and other conditions during sampling. The innovative methods can give positive results in assessing the thermal pollution effects on aquatic ecosystems [6]. The development of ecological mapping was to provide a new monitoring tool for thermal impact assessment [7,8].
Our study continues a series of studies on biodiversity in Arctic rivers. Data on algae Anabar is given in two publications [9,10] based on the collections of the late 60s and early 80s of the last century. The listed works are devoted mainly to algae of the middle reaches of the Anabar River in the area between the mouths of the Ehbelyah and Billyakh tributaries and, based on the materials of individual samples, algae from the lower and estuary sections of the river. A common shortcoming of these publications is that they discuss the algoflora of the river. Critical information concerning which habitat (plankton, benthos, periphyton) a particular species was found is missing. Available information about the hydrochemistry of the waters of the Anabar River is also scarce [10,11,12] and refers only to the section of the river’s middle course. Algae and physicochemical parameters of the waters of the upper course of the Anabar (Bolshaya Kuonamka River) remained unstudied before our studies. Our data on phytoplankton and hydrochemistry of the Anabar River was published before [13,14,15].
The Anabar River is of great ecological and economic importance for the region. It is the habitat of valuable commercial species of fish and waterfowl. A few mining enterprises operate on the territory of the basin of the middle reaches of the Anabar. On the banks of tributaries of the Anabar River, such as the Ehbelyah and Mayat Rivers, there are mining enterprises engaged in open-pit mining of diamond deposits. The production process is associated with the excavation and subsequent enrichment of the ore by washing it in water. At the same time, water for these purposes is withdrawn from the river. Part of the industrial effluents formed in this way return to the river ecosystem, which causes increased turbidity and decreased water transparency. We noted such a decrease in transparency and turbidity visually during sampling at the mouths of these two rivers. Below their confluence, the transparency of the Anabar River sharply decreases to 0.3 m along the Secchi disk.
In addition, in the process of ore mining, the inflow of water from underground horizons located 200 m below the surface of the earth increases. This water (underground brine) contains chemical components in concentrations that are atypical for the natural surface waters of the region. To prevent environmental problems brines are buried underground, which can also cause harm to aquatic ecosystems that cannot be determined now.
There are no settlements or industrial facilities in the upper reaches of the Anabar River (the Bolshaya Kuonamka River); however, large alluvial diamond deposits have been explored here, and their mining is planned to begin soon.
We hypothesize that by studying the biodiversity and indicator properties of phytoplankton species, it is possible to characterize their relationship with the anthropogenic impact of mining facilities in the permafrost zone of the harsh climate of the Arctic.
The purpose of this study was to compile the list of the Anabar River phytoplankton, characterize the diversity and species richness dynamic along the river, conduct an ecological analysis with bioindicators, and identify environmental factors that affect the diversity of this group of aquatic organisms in the studied river basin with the help of statistics and ecological mapping. We used the method of working with natural data previously used in other semi-desert regions [8] and mountainous regions [16] of Eurasia. The logic of the investigation included collecting phytoplankton samples and hydrochemistry data over the river basin in critically important points such as in the river channel from upper reaches to the mouth before and after major tributaries and in the mouth of the tributaries. Defining the species richness of each station community and abundance and biomass can show the biotic response to the environmental variables change across the river basin through bioindication. Statistics of the species-environment relationships and the data similarity can define the major influenced variables and then on the basin maps demonstrate the impact points and parts of the river basin that are responsible for it.
2. Materials and Methods
2.1. Description of Study Site
The study was carried out on a section of the Anabar River with a length of 897 km: from the mouth of the Darikhan River to the Anabar Bay (Figure 1). Anabar is a large river of the Arctic basin in the northeast of Siberia. The length of the river is 939 km; the catchment area is 100 thousand km2. The Anabar basin is entirely located beyond the Arctic Circle. The source of the river is located among the tundra swamps of the Anabar plateau. The river crosses several soil and vegetation zones: northern taiga, forest tundra, and tundra. Anabar has no delta and, flowing into the Laptev Sea, forms a typical estuary—Anabar Bay [11].
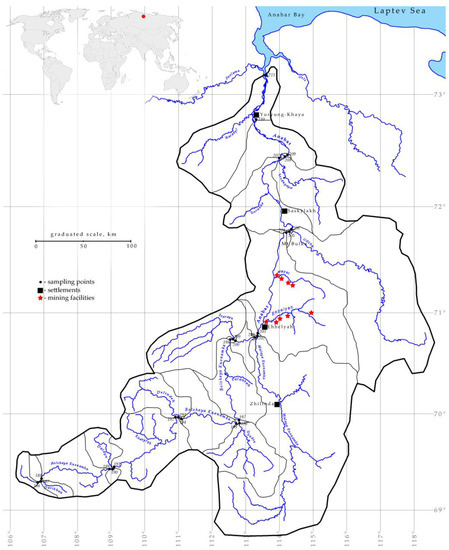
Figure 1.
Map of sampling sites in the Anabar River in 2008, Eastern Siberia, Russia (no. of sampling stations as in Table 1). The bold black line is the Anabar River basin contour, thin black lines are partial basins, red stars are the mining facilities, and black squares are the settlements.
The upper section of the Anabar River, 559 km long, is called Bolshaya Kuonamka, and downstream of the mouth of the Malaya Kuonamka tributary, it is called Anabar (Figure 1 and Figure 2). Hydrologically, the river is divided into three sections and the mouth. The upper section is 578 km long—from the headwaters to the mouth of the Ehbelyah River. The river here retains a mountainous character; the flow rate is from 0.2 m s−1 in the reaches to 3.0 m s−1 in the riffles. The bottom and banks of the river are mostly rocky. The bottom of the valley is marshy, and in the upper part of the site, there is a typical tundra landscape. The middle section is 96 km long—from the mouth of the Ehbelyah River to Mount Bulka. The river here is of a flat type, and the flow velocity varies from 0.3 m s−1 to 1.2 m s−1. The valley is narrow with steep sides, and the banks and the bottom are rocky. In the lower section, 210 km long—from Mount Bulka to the village of Yuryung-Khaya, the banks and the bottom of the river become sandy, and the valley expands sharply. The flow velocity in this area is 0.05–1.0 m s−1. In the estuary section (Anabar Bay), there is practically no current, and tidal phenomena are observed. The living conditions in the estuarine part differ significantly from other river sections; due to the tides, the so-called “backwater” phenomenon is observed here.
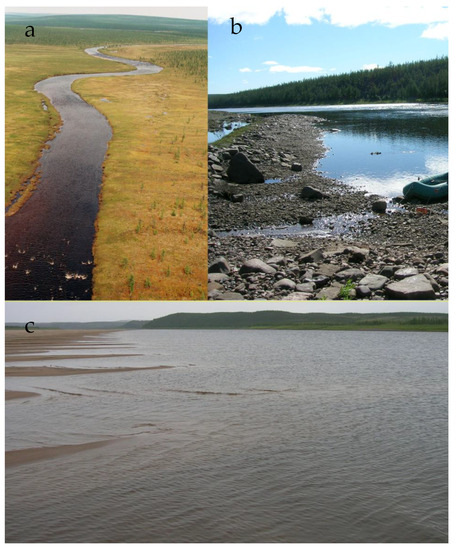
Figure 2.
View of sampling stations of the Anabar River in 2008. Bolshaya Kuonamka River near the Darikhan River mouth (a), Bolshaya Kuonamka River below the Dyuken River mouth (b), Anabar River below the Udzha River input (c), water with low transparency. Photo (a) by A. Klimovsky; (b) and (c) by V. Gabyshev.
2.2. Sampling and Laboratory Study
Field material was collected in June–July 2008 (Table 1). A total of 52 plankton algological samples (2 per sampling station, one—for qualitative and another—for quantitative analyses) and 26 water samples were collected and processed for hydrochemical analysis. Samples for studying the quantitative development of phytoplankton with a volume of 1.5 L were taken in the coastal zone or along the fairway from the surface water horizon (0–0.3 m). Samples were concentrated on Sartorius membrane filters (pore diameter 1.2 µm) by filtration under pressure.

Table 1.
Sampling stations and geographical coordinates in the Anabar River for the collection trips during 24 June 2008–12 July 2008, Eastern Siberia, Russia.
Chemical analysis of water samples was performed following standard methods [17]. To assess the quality of water by hydrochemical variables, the classification described in the reports by E.V. Shornikova [18] and D.Ya. Ratkovich [19] was used.
Sampling for the species composition of phytoplankton was conducted with Apshtein’s plankton net (SEFAR NITEX fabric, 15 µm mesh diameter). Algological analysis of phytoplankton was performed using a light microscope (Olympus BH-2, Olympus, Tokyo, Japan). The modern species names were adopted using algaebase.org [20].
In total, 15 environmental and 11 biological variables were obtained for each sampling station listed in Appendix A Table A1 and Table A2. Bioindicator analysis was performed according to [21] with species-specific ecological preferences of revealed taxa [22,23]. The WESI index [7,21] was calculated to assess the toxic pollution influence on the river ecosystem using the equation:
WESI = Rank Index S/Rank N-NO3
The index values vary from 0 to 5. If the index values are less than one, then the ecosystem is exposed to toxic pollution, which inhibits photosynthesis.
Statistical maps were constructed to distribute clustered variables over partial basins [8,16]. The network analysis in JASP (significant only) was done on the botnet package in R Statistica [24]. The BioDiversity Pro 2.0 program was used for similarity calculation [25]. A Redundancy Discriminant Analysis (RDA) plot was prepared with the CANOCO 4.5 program [26] based on phytoplankton data and hydrochemical variables to identify the major influenced factors.
3. Results
3.1. Water Chemistry
The content of dissolved oxygen in the waters of the Anabar River varies within narrow limits (6.00–8.20 mg L−1), averaging 7.47 mg L−1. No oxygen deficiency was found; Anabar is characterized by a favorable oxygen regime. The waters of the Anabar River have a neutral reaction; the pH varies from 6.50 to 7.50 at observation stations.
According to measurements in 1936 in the Anabar water, the Secchi disk is visible at a depth of 1.9–2.2 m [11]. According to our data, from the source to the confluence of the Ehbelyah River, the Anabar River retains transparency to the bottom, with a depth in the reaches of up to 2.5 m. Below the mouth of this tributary, a sharp break occurs, and the river transparency drops to 0.3 m. Our data and visual observation (Figure 2c) show that the decrease in water transparency is of an anthropogenic nature related to diamond mining.
The minimum values of total dissolved solids (TDS) are typical for the upper section of the river. An increase in mineralization was noted after the confluence of the Malaya Kuonamka River and downstream of the Anabar River since the basin of this tributary is in the zone of outcrops of limestone and other sedimentary rocks of the Lower Paleozoic [11].
The concentration of ammonium nitrogen increases from the upper reaches of the river (0.24–0.78 mg L−1) to the lower reaches (0.56–1.00 mg L−1). The content of nitrates is very low and increases from the upper reaches (0.06–0.32 mg L−1) to the lower reaches (up to 1.68 mg L−1). The concentration of nitrite nitrogen (0.00–0.02 mg L−1) and silicon (1.64–3.20 mg L−1) is low.
In the waters of the upper river, Anabar found a high concentration of iron (0.02–0.26 mg L−1). In the lower reaches, the iron content increases even more, reaching 0.10–1.08 mg L−1. The content of phosphates of mineral origin (0.0–0.06 mg L−1) and total phosphorus (0.0–0.14 mg L−1) is low.
Thus, the waters of the Anabar River are neutral, slightly saturated with salts, and with a favorable oxygen regime. The waters of the Anabar River are characterized by a low content of most biogenic and organic substances. A relatively high concentration was noted for two components—ammonium nitrogen and total iron. The distribution of organic and biogenic elements in different sections of the river is not uniform and increases in the section of the river in the area of industrial developments. Primary data on the concentration of the main chemical components in the waters of the studied river are given in Appendix A Table A1.
The priority pollutants are ammonium, nitrogen, and total iron. Since a high concentration of total iron is characteristic of northern water bodies [27], this watercourse is influenced by predominantly natural factors with a weakly pronounced anthropogenic impact. According to the complex of controlled chemical indicators, the waters of the upper reaches of the Anabar River are “clean” and correspond to I-II quality classes; the lower reaches are “slightly polluted” I-III quality classes.
The dynamics of indicators of water saturation with oxygen and carbon dioxide are shown in Figure 3, where both indicators gradually decrease from the upper reaches to the mouth of the river. Water saturation with dissolved salts (TDS) has a sharp maximum at station 203, then decreases and rises only towards the river mouth.
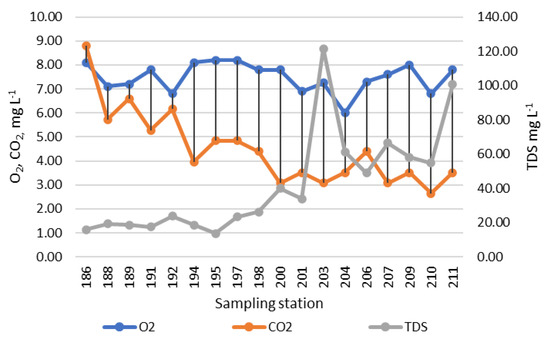
Figure 3.
Dynamic of chemical variables over sampling stations in the Anabar River course in 2008, Eastern Siberia, Russia (no. of sampling stations as in Table 1 here are placed from the upper part of the river to the mouth direction).
3.2. Biological Variables
In total, 210 species of algae from 7 phyla were identified in the Anabar River during the research period. The distribution of biological variables along the riverbed is uneven.
The distribution of species richness and abundance in phyla by stations of the Anabar River is shown in Appendix A Table A2.
Figure 4 shows that diatoms predominate in the communities, the middle course is also enriched with green algae and cyanobacteria, and in the lower third of the river, the proportion of Ochrophyta species increases both in terms of species richness and abundance (Figure 4b).
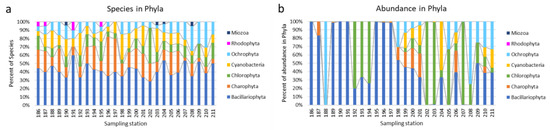
Figure 4.
The dynamic of species richness (a) and phytoplankton abundance (b) in phyla over sampling stations in the Anabar River in 2008, Eastern Siberia, Russia (no. of sampling stations as in Table 1).
Species richness generally increases downriver and has similar dynamics to phytoplankton abundance (Figure 5a). The dynamics of the saprobity index at the stations of the river has, on the contrary, a controversial synchrony with the WESI index, which reflects the suppression of photosynthetic activity (Figure 5b), especially on the stations 188–189, 194, 203, 204 and 207.
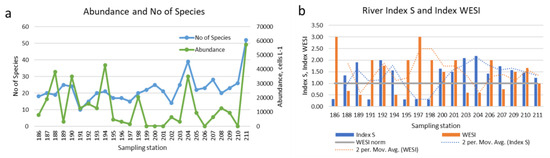
Figure 5.
Dynamic of phytoplankton species richness, total abundance (a), Index saprobity S and Index WESI (b) oversampling stations in the Anabar River in 2008, Eastern Siberia, Russia (no. of sampling stations as in Table 1).
The organic pollution index S and the phytoplankton structure index Shannon also change oppositely (Figure 6), which implies the influx of organic matter has a negative impact on the structure of communities. Moreover, both indicators divide the river into sections where the influx of organic matter occurs at stations located at the mouths of the tributaries. Thus, four variables turn out to be related: total abundance and species number were negatively correlated with index WESI (r = −0.32 and −0.38, respectively, significant) as well as total abundance and index Shannon (r = −0.24, not significant) and index S and index WESI (r = −0.77, not significant but visually recognized in Figure 6).
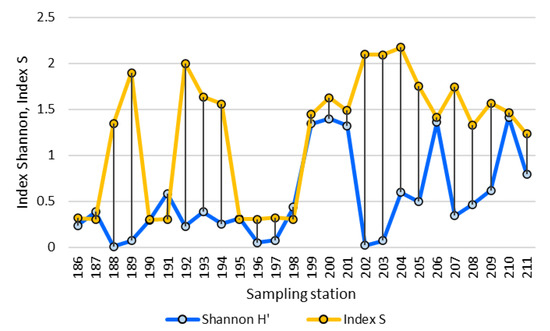
Figure 6.
Dynamic of major biological variables over sampling stations in the Anabar River basin in 2008, Eastern Siberia, Russia (no. of sampling stations as in Table 1).
3.3. Bioindicators
The distribution of groups of indicator species by stations of the Anabar River is shown in Figure 7 and Figure 8. Primary data on phytoplankton species’ ecological preferences can be found in Appendix A Table A3. The change in substrate confinement along the river shows an increase in the proportion of planktonic species starting from station 202 (Figure 7a). Indicators of temperature conditions in composition change, starting from station 193 downstream, with a trend toward an increase in the proportion of cold-loving and temperate species (Figure 7b). An increase in the share of indicators of stagnant and slow-flowing waters can be traced along the river from station 198 to the mouth (Figure 7c). An increase in the proportion of alkaliphilic species and a simultaneous decrease in pH-indifferents are noted starting from station 206 (Figure 7d).
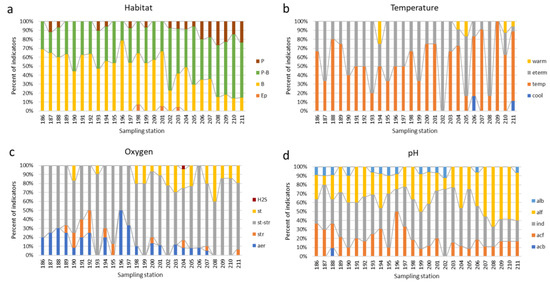
Figure 7.
Bioindication histograms for dynamic of species-indicators of the habitat preference (a), water temperature (b), oxygen (c), and water pH (d) oversampling stations in the Anabar River in 2008, Eastern Siberia, Russia (no. of sampling stations as in Table 1). Abbreviations of the ecological groups: Habitat (Ep—epiphyte, P—planktonic, P-B—plankto-benthic, B—benthic). Temperature preferences (cool—cool-water, temp—temperate, eterm—eurythermic, warm—warm-water). Oxygen and streaming (st—standing water, str—streaming water, st-str—low streaming water, aer—aerophiles, H2S, anoxia with sulfides). pH preferences groups (pH) according to Hustedt (1957) [28] (alb—alkalibiontes; alf—alkaliphiles, ind—indifferent; acf—acidophiles; acb—acidobiontes).
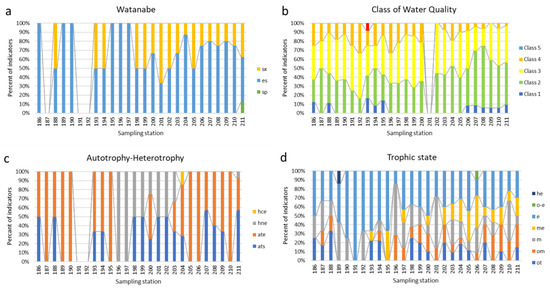
Figure 8.
Bioindication histograms for dynamic of species-indicators of the Watanabe saprobity (a), Class of water quality according to species-specific Index S (b), type of nutrition (c), and trophic state (d) over sampling stations in the Anabar River in 2008, Eastern Siberia, Russia (no. of sampling stations as in Table 1). Abbreviations of the ecological groups: Organic pollution indicators according to Watanabe et al., 1986 [29]: sx—saproxenes; es—eurysaprobes; sp—saprophiles. Class 1–5 of organic pollution indicators according to species-specific Index saprobity of Sládeček, 1986 [30]. Autotrophy-Heterotrophy, Nutrition type as nitrogen uptake metabolism (Van Dam et al., 1994) [31]: ats—nitrogen-autotrophic taxa, tolerating very small concentrations of organically bound nitrogen; ate—nitrogen-autotrophic taxa, tolerating elevated concentrations of organically bound nitrogen; hne—facultative nitrogen-heterotrophic taxa, needing periodically elevated concentrations of organically bound nitrogen; hce—obligate nitrogen-heterotrophic taxa, needing continuously elevated concentrations of organically bound nitrogen. Trophic state indicators (Van Dam et al., 1994) [31]: (ot—oligotraphentic; om—oligomesotraphentic; m—mesotraphentic; me—mesoeutraphentic; e—eutraphentic; he—hypereutraphentic; o-e—oligo- to eutraphentic (hypereutraphentic)).
The dynamics of indicators of organic pollution based on diatoms (Figure 8a) demonstrate a change in the composition of species that prefer an average amount of organic matter with pure water species, starting from station 198 and up to the mouth of the Anabar River. The decrease in organic input is also seen in Figure 8b, where the proportion of class 1 and 2 clean water indicators increases towards the mouth, starting at station 196. Algae feeding type is generally related to the availability of nitrate nitrogen and photosynthetic radiation, as well as to non-toxic habitat conditions.
Figure 8c shows the prevalence of autotrophs throughout the river, excluding the section from stations 196 to 204, where mixotrophs replace them, indicating the suppression of photosynthetic activity in this section of the Anabar River. The prevalence of eutrophy indicators is shown in Figure 8d in the area between stations 189 and 195, with a trend towards a decrease in this ecological group down the river and an increase in the proportion of mesotrophs, which indicates active self-purification processes in the Anabar River.
3.4. Ecological Mapping
To show areas of the basin that contribute to water quality and phytoplankton diversity, basin maps were compiled based on Figure 1 over four variables. Figure 9a is plotted for water transparency, where the muddy water inflow from the mines impacts below station 203 to the mouth of the Anabar River. Figure 9b shows the distribution of water quality classes on the EU [8] scale and system according to the color of the streams, which shows a decrease in water quality in the Malaya Kuonamka section and further along the Anabar River to station 207. There is also an influx of organic pollution in the section of the upper reaches of the Bolshaya Kuonamka River from station 188 to station 194.
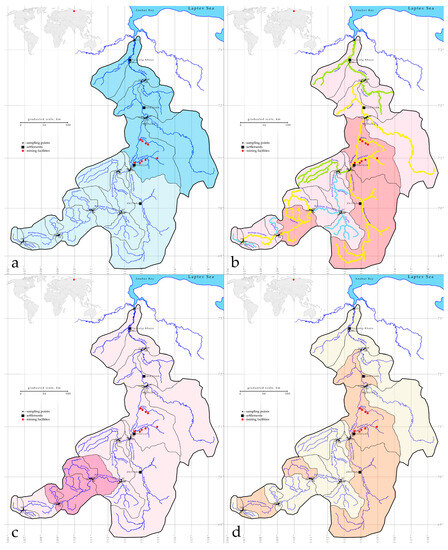
Figure 9.
Spatial maps of water transparency distribution on the partial basins, light color according to Figure 2, st. 186–201 and dark color st. 203–211 on the river course (a), Index S as the river course highlighting according to Class of water quality in EU colors and spatial distribution of the Index saprobity S with dark color above S = 2.0, and light color below S = 2.0 (b), eutrophic indicators prevailing on st. 189–195 with dark color and other stations with a light color (c), and Index WESI with dark color if it is below 1.0 and light color if it is above 1.0 (d) oversampling stations in the Anabar River basin in 2008, Eastern Siberia, Russia (no. of sampling stations as in Table 1).
At the same time, we tinted areas of the basin where the saprobity index does not exceed 2.0 and where its values are above 2.0, which made it possible to narrow the areas of influence of organic pollution to two between stations 191–192 and 202–207 with dark color and other stations with light color. An increase in the proportion of eutrophic indicators is shown in the section between stations 189 and 195 (Figure 9c), which was not observed in the remaining river sections. The Index WESI map with dark color below 1.0 is highlighted in three areas: on the upper reaches of the Bolshaya Kuonamka River to station 189, then on its tributary Delindeh (st. 193) and then along the entire length of the Malaya Kuonamka River from st. 202 and on the Anabar River to station 207 in the lower reaches. The rest of the basin is a light color because the Index WESI is above 1.0 on the sampling stations in the Anabar River basin.
3.5. Cluster Analysis
Cluster analysis of species saturation and abundance in phyla, representation of indicators of various groups, and water chemistry at observation stations are shown in Figure 10. Here, you can see two clusters separated at the level of 20% similarity and forming ecosystem variables of stations 199–201, 206 and 210 as the most similar in the first cluster and the rest that do not differ significantly in the second cluster. The first cluster contains stations from the lower reaches of the Bolshaya Kuonamka before its confluence with the Malaya Kuonamka, as well as the Anabar River after the confluence of the Udzha River and the lower mouth part of the Anabar River. These areas coincide with the map of Figure 9c, where the WESI index is increased, i.e., the waters do not have a toxic effect on phytoplankton.
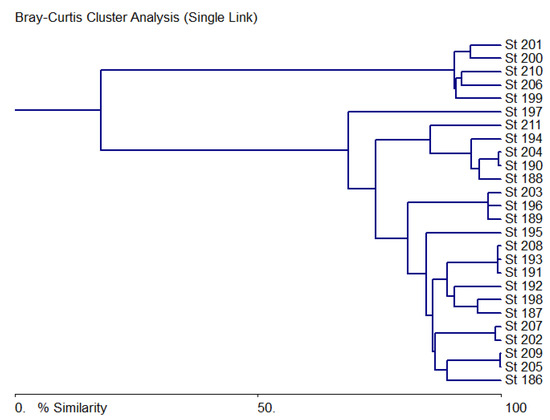
Figure 10.
Bray-Curtis similarity tree for biological and chemical data in the sampling stations of the Anabar River in 2008, Eastern Siberia, Russia (no. of sampling stations as in Table 1).
To clarify the division of basin sections according to similar indicators, we built a JASP network correlation plot for data on stations located only in the riverbed, marking the potentially impacting station 204 and the stations before and after with color (Figure 11). The stations were grouped up to the potentially affecting station 204 into cluster 1, and the rest, starting from station 204 and further to the mouth of the river, into cluster 2. It can be seen that station 204 does not form a separate cluster but begins a series of downstream stations on the Anabar River with similar parameters.
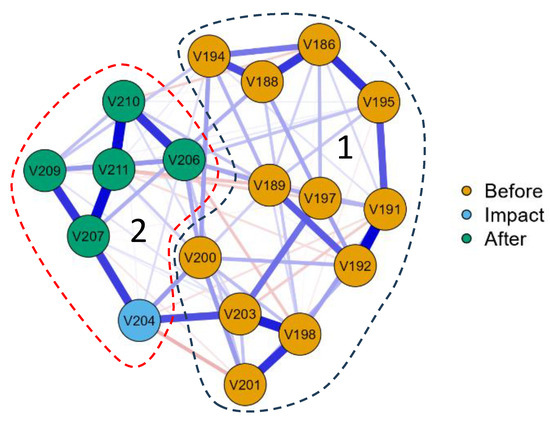
Figure 11.
JASP network plot for biological and chemical data in the sampling stations of the Anabar River water course in 2008, Eastern Siberia, Russia (no. of sampling stations as in Table 1). Station 204 is identified as a suspect due to the impact of pollution from mining facilities in the section of the river between stations 203 and 204. The remaining stations are designated before (186–203) and after (204–211). The line thickness is related to the correlation rate on the type of analysis “Huge” correlation > 0.5 (significant only). Blue lines are positive correlation, red lines are negative correlation. Dashed lines outlined clusters: 1 combine stations before impact; 2 outline stations of impact and after it.
3.6. Biological and Environmental Variables Relationships with RDA
Statistical comparison of relationships between biological and environmental indicators for stations on the Anabar River was carried out with the construction of an RDA plot (Figure 12). The plot shows the chemical factors, in terms of their impact on the biological parameters of phytoplankton, were generally divided into two sets. The first grouped nitrates, phosphates, ammonium, pH and TDS, the influence of which led to an increase in the saprobity index S, which is associated with anthropogenic pollution. The second set of variables included oxygen and carbon dioxide concentrations, water transparency, silicon, and the station’s elevation above sea level. An increase in these parameters is associated with a decrease in the saprobity index S and an increase in the WESI index, with more pure-water habitats in the upper section of the Anabar River basin. Separately, there are such variables as water temperature and the depth of the sampling station that are controversially related, but an increase in depth and a decrease in water temperature led to an increase in species richness and are related to the stability of the phytoplankton structure through the Shannon index.
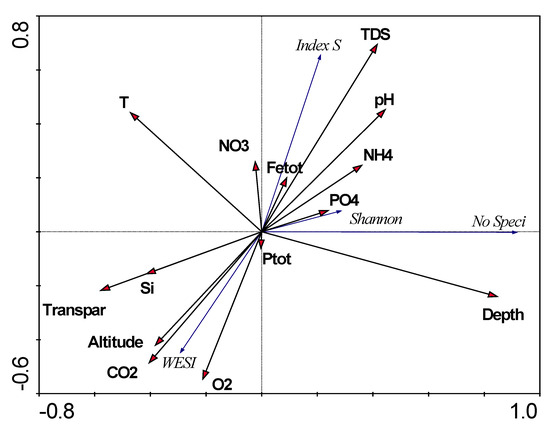
Figure 12.
RDA biplot of relationships of major biological variables and chemical data in the sampling stations of the Anabar River in 2008, Eastern Siberia, Russia.
4. Discussion
For the current analysis, samples were taken for the water chemistry and phytoplankton throughout the Anabar River and at the mouths of its main tributaries during the period of the most significant vegetation development of algal communities in the summer of 2008, when water heating and sun radiation were maximal in the Arctic. Since the river and its tributaries are watercourses of considerable width and volume, they allow the formation of phytoplankton communities, and, accordingly, its species composition and quantitative indicators can be used for environmental assessment of the water quality changes, as in other large rivers of the region [32] and beyond [33,34,35,36,37]. Chemical analyses showed that, after the Ehbelyakh River’s confluence, water’s transparency decreases simultaneously with an increase in TDS and pH of the water. We regard this phenomenon to be a result of the influence of mining and its wastewater, which is discharged into rivers without treatment despite the current regulations [38].
In regions with sharp climatic conditions, salinity changes and nutrient enrichment can reduce water quality [2,39]. As a result of the application of bioindication methods on the Anabar River, the influence of organic pollution was revealed. Earlier, we developed mapping methods for chemical and biological indicators on large rivers that help to identify both the intensity and sources of pollution [16,33,34].
Mapping the values of the saprobity index S showed the quality of water in terms of organic pollution in the whole river is quite high and is within the 1–3 quality class. Despite this, the maps show that organic pollution has sources where settlements are located and mining exploration areas in the upper reaches of the Anabar basin. According to our observations during the sampling process, it was clear that effluents from both enterprises and settlements are discharged into rivers without treatment facilities in the hope of not exceeding the standards for surface water due to the large mass of water in the rivers. However, subject to the expansion of production, the impact of wastewater on the rivers of the basin will increase. Since the expansion of diamond mining enterprises is planned in the near future, these indicators of nitrates, water transparency pH, and TDS must be monitored and included in the mandatory monitoring network.
Our next task was to identify the vulnerability of the Anabar River ecosystem. To do this, we considered the dynamics of species richness and quantitative indicators of phytoplankton along the river and its tributaries. Species indicators of various environmental variables were established, and their distributions along the riverbed were constructed. These studies have shown that the number of species in the community changes synchronously with the quantitative indicators of plankton. Moreover, both parameters increase from the upper reaches to the mouth of the river. There were also points of a surge in values, coinciding with the highest pH and TDS values and a drop in water transparency. Thus, it was found that the enrichment of waters with dissolved salts from tributaries with mining enterprises and nitrates from settlements associated with mining leads to an increase in the species composition and abundance of phytoplankton.
The distribution of indicator species showed a decrease in the flow of the river as the altitude of the sampling stations fell, an increase in the abundance of chrysophyte mixotrophs towards the river mouth, a decrease in the number of warm-water species, and an increase in alkaliphiles. It is essential to see the indicators of organic pollution and the number of eutrophic species significantly decreased in the second half of the river, starting from the confluence of the two major tributaries, Bolshaya and Malaya Kuonamka, and up to the mouth of the Anabar River. At the research moment, the Anabar River’s ecosystem carries out self-purifying of water despite the identified, albeit low, level of pollution.
Applying statistical methods, we identified the most similar stations in terms of indicators at the next stage. The method that established similarity showed two clusters of variables, the first of which includes the lower reaches of the Bolshaya Kuonamka before its confluence with the Malaya Kuonamka and the stations of the Anabar River after the confluence of the Udzhda River and then up to the river mouth. The WESI index, which indicates no suppression of photosynthesis, was increased at the stations of this cluster; that is, the waters do not have a toxic effect on phytoplankton, which coincides with our conclusion on the self-purification of the river on bioindicators. In other parts of the Anabar River basin, the influence of eutrophication processes, coinciding with mining exploration sites in the upper reaches of the river, was revealed using ecological mapping and maps of the WESI index, the lowest values of which show the suppression of photosynthetic activity and a decrease in the number of autotrophs at the confluence of tributaries with enterprises mining. Using network analysis, we tried to identify the significance of station 204 at the confluence of the most loaded tributary and the main channel of the Anabar River. This station, where the outflow of water from enterprises is the largest, does not form a separate cluster, but a group of stations influenced by mining effluents begins from it up to the mouth of the river.
The negative aspects of the impact of mining on the aquatic environment are widely discussed [40]. For watercourses affected by mining in Armenia, there is a depletion of the species composition of phytoplankton [41]. In the warm climate of India, the influence of mining production on the taxonomic composition of phytoplankton was revealed, and genera with increased abundance in the zone of influence of mining were identified -Euglena sp., Ulothrix sp., and Volvox sp. [42]. On the impact of emergency nutrient runoff into a reservoir due to the fault of a mining enterprise in the warm waters of the Gulf of Mexico, it was estimated from the response of phytoplankton, which consisted in the mass development of diatoms and cyanobacteria [43]. Our results show an increase in species richness but with the enrichment of the community with chrysophytes, which may be a special reaction of phytoplankton in the Arctic climate.
The quantitative determination of the accumulated environmental damage from economic activities, including the mining complex in Siberia and the Far East, entailing further selection or development of environmental measures to restore disturbed natural complexes, is an urgent task. Attempts are being made to solve this problem [44,45], but usually, there is not enough reasonable data for this. New research methods, such as satellite remote sensing, confirm the phenomenon of devegetation in gold mining areas in the Kolyma River basin closest to our study area [45]. At the same time, our experience in ecological mapping using statistical instruments [33] and remote sensing [34] confirmed the positive results of these methods’ implementations in monitoring. Moreover, the mapping results on the catchment basin surface can show the problematic places of impact and ecosystem variables that can be included in the monitoring network [8,16]. This method was implemented in current research.
RDA statistical analysis of the relationships between water chemistry variables and phytoplankton helped to form groups of indicators that affect different biological parameters. So, nitrates, phosphates, ammonium, pH, and TDS, the influence of which led to an increase in the saprobity index S, are in the opposite position with an increase in oxygen, carbon dioxide, water transparency, silicon, and altitude, which is associated with a decrease in the saprobity index S and an increase in the WESI index in pure water courses. At the same time, it was found that an increase in depth and a decrease in water temperature led to an increase in species richness and are associated with the stability of the phytoplankton structure.
The application of statistical methods to assess the change in water quality in rivers is known [46,47]; however, in our combination with bioindicators and environmental mapping, we obtained more accurate results in assessing the impact of mining facilities on the aquatic ecosystem of a large river in the Arctic. Combined impacts from industrial discharges and wastewater from settlements have also been identified.
The floristic features noted by us for the phytoplankton of the Anabar River are similar to those previously studied [48] and represent the prevalence of three main phyla—diatoms, greens, and cyanobacteria, with the maximum development of abundance during the period of maximum illumination and temperature in early August. At the same time, an increase in the number of chrysophytes species and their abundance in the Anabar River to the north was revealed, which can be assessed as a response to a change in climatic conditions towards a more severe climate in the Arctic [49]. Previously, the change in algal communities in the climatic gradient was studied, and it turned out that water temperature is one of the most important indicators [50,51,52], a decrease in which suppresses their species richness and abundance. A detailed analysis of the dynamics of phytoplankton in the Anabar River revealed an increase in phytoplankton species richness under a mixed impact of natural and anthropogenic factors in the specific ecological factors of the Arctic but in the decreasing trend of water temperature [53,54], this property can be defined as reflecting a combined impact, where the impact of diamond mining and exploration can be tracked by monitoring the composition of phytoplankton. The method of working with natural data applied in this work has been previously used in other semi-desert regions [8] and mountainous regions [16]. It is an effective way from phytoplankton and hydrochemistry data through bioindication and data statistics to basin maps of the studied river.
5. Conclusions
The study of the reaction of phytoplankton communities in the Anabar River was carried out during the highest illumination and water temperature in July–August 2008 along 897 km of the river channel and its tributaries affected by mining enterprises. Two hundred ten (210) species were identified in phytoplankton communities, the diversity of which increased northward to the river mouth and was associated with an increase in turbidity from industrial discharges. With bioindication methods, a weak effect of organic pollution and a toxic effect associated with rare settlements were also revealed. The calculated indices, statistics and ecological maps have shown the river ecosystem is very sensitive to anthropogenic impact and changes significantly with the onset of discharges from industrial enterprises. However, it has been found that the large volume of the river’s waters promotes natural self-purification processes up to the mouth of the river in the north. As a response of plankton diversity to the climatic factors of the Arctic, an increase in the diversity of chrysophyte algae towards the north was established. It was consistent with the most severe climatic conditions of the continental part of Eurasia. Phytoplankton monitoring is recommended to track changes in the Anabar River ecosystem as diamond mining enterprises expand.
Author Contributions
Conceptualization, S.B. and V.G.; methodology, S.B. and V.G.; software, S.B.; validation, S.B. and V.G.; formal analysis, V.G. and O.G.; investigation, V.G. and O.G.; resources, V.G.; data curation, S.B. and V.G.; writing—original draft preparation, S.B. and V.G.; writing—review and editing, S.B., V.G. and O.G.; visualization, S.B.; supervision, V.G.; project administration, V.G.; funding acquisition, V.G. All authors have read and agreed to the published version of the manuscript.
Funding
The research was carried out within the state assignment of the Ministry of Science and Higher Education of the Russian Federation (theme No. FWRS-2021-0023, reg. No. АААА-А21-121012190038-0; theme No. FWRS-2021-0026, reg. No. АААА-А21-121012190036-6).
Institutional Review Board Statement
Not applicable.
Informed Consent Statement
Not applicable.
Data Availability Statement
The data presented in this study are available in Appendix A Section.
Acknowledgments
We thank A. Klimovsky for the photo of sampling stations.
Conflicts of Interest
The authors declare no conflict of interest.
Appendix A
Table A1.
Averaged data of environmental variables in the sampling stations of the Anabar River in the period from 24.06.2008 to 12.07.2008, Eastern Siberia, Russia (sampling stations as in Table 1).
Table A1.
Averaged data of environmental variables in the sampling stations of the Anabar River in the period from 24.06.2008 to 12.07.2008, Eastern Siberia, Russia (sampling stations as in Table 1).
| Sampling Station | 186 | 187 | 188 | 189 | 190 | 191 | 192 | 193 | 194 | 195 | 196 | 197 | 198 | 199 | 200 | 201 | 202 | 203 | 204 | 205 | 206 | 207 | 208 | 209 | 210 | 211 |
|---|---|---|---|---|---|---|---|---|---|---|---|---|---|---|---|---|---|---|---|---|---|---|---|---|---|---|
| NO2, mg L−1 | 0.01 | 0.03 | 0.00 | 0.01 | 0.00 | 0.02 | 0.00 | 0.00 | 0.00 | 0.01 | 0.00 | 0.00 | 0.01 | 0.00 | 0.00 | 0.01 | 0.00 | 0.00 | 0.00 | 0.00 | 0.01 | 0.01 | 0.01 | 0.01 | 0.00 | 0.00 |
| Temperature, °C | 9.70 | 12.20 | 11.70 | 13.80 | 10.30 | 11.00 | 11.20 | 8.90 | 9.00 | 11.00 | 11.70 | 11.50 | 11.20 | 10.60 | 10.80 | 11.20 | 14.80 | 12.60 | 10.40 | 11.70 | 11.60 | 11.20 | 11.00 | 10.90 | 10.00 | 8.00 |
| Transparency, m | 2.50 | 2.50 | 2.50 | 2.50 | 2.50 | 2.50 | 2.50 | 2.50 | 2.50 | 2.50 | 2.50 | 2.50 | 2.50 | 2.50 | 2.50 | 2.50 | 2.50 | 2.50 | 0.30 | 0.40 | 0.50 | 0.60 | 0.70 | 0.80 | 0.90 | 1.00 |
| Depth, m | 1.25 | 1.30 | 1.35 | 1.50 | 1.50 | 1.55 | 1.45 | 1.20 | 1.50 | 1.55 | 1.10 | 1.60 | 1.80 | 1.10 | 2.00 | 2.00 | 1.30 | 2.00 | 1.70 | 1.00 | 1.80 | 1.80 | 0.80 | 2.00 | 2.50 | 10.00 |
| pH | 8.21 | 8.26 | 8.27 | 8.29 | 8.29 | 8.34 | 8.05 | 8.46 | 8.42 | 8.45 | 8.50 | 8.45 | 8.44 | 8.64 | 8.48 | 8.45 | 8.67 | 8.70 | 8.55 | 8.44 | 8.46 | 8.60 | 8.40 | 8.54 | 8.53 | 8.63 |
| O2, mg L−1 | 8.10 | 6.40 | 7.10 | 7.20 | 7.20 | 7.80 | 6.80 | 7.70 | 8.10 | 8.20 | 8.10 | 8.20 | 7.80 | 8.10 | 7.80 | 6.90 | 6.85 | 7.25 | 6.00 | 6.50 | 7.30 | 7.60 | 7.70 | 8.00 | 6.80 | 7.80 |
| CO2, mg L−1 | 8.80 | 5.28 | 5.72 | 6.60 | 3.96 | 5.28 | 6.16 | 3.52 | 3.96 | 4.84 | 3.96 | 4.84 | 4.40 | 2.64 | 3.08 | 3.52 | 4.40 | 3.08 | 3.52 | 3.52 | 4.40 | 3.08 | 3.96 | 3.52 | 2.64 | 3.52 |
| TDS, mg L−1 | 15.98 | 18.59 | 19.32 | 18.68 | 15.65 | 17.52 | 23.70 | 15.47 | 18.55 | 13.77 | 26.75 | 23.39 | 26.25 | 56.28 | 39.89 | 34.02 | 147.87 | 121.47 | 61.31 | 41.24 | 48.95 | 66.45 | 43.12 | 58.11 | 54.75 | 100.55 |
| NH4, mg L−1 | 0.24 | 0.52 | 0.78 | 0.42 | 0.32 | 0.32 | 0.42 | 0.24 | 0.24 | 0.42 | 0.48 | 0.48 | 0.48 | 0.48 | 0.48 | 0.48 | 0.42 | 0.48 | 0.56 | 0.78 | 0.70 | 1.00 | 0.78 | 0.70 | 0.64 | 0.64 |
| NO3, mg L−1 | 0.30 | 0.14 | 0.16 | 0.10 | 0.06 | 0.08 | 2.16 | 0.06 | 0.06 | 0.10 | 0.20 | 0.26 | 0.16 | 0.25 | 1.62 | 1.85 | 0.32 | 0.30 | 0.27 | 1.79 | 1.68 | 0.32 | 1.06 | 1.56 | 1.50 | 0.30 |
| PO4, mg L−1 | 0.00 | 0.00 | 0.00 | 0.00 | 0.00 | 0.00 | 0.00 | 0.00 | 0.00 | 0.00 | 0.00 | 0.00 | 0.02 | 0.00 | 0.00 | 0.00 | 0.00 | 0.00 | 0.00 | 0.02 | 0.01 | 0.05 | 0.05 | 0.06 | 0.01 | 0.02 |
| Ptot, mg L−1 | 0.00 | 0.00 | 0.01 | 0.05 | 0.02 | 0.07 | 0.04 | 0.01 | 0.03 | 0.03 | 0.26 | 0.01 | 0.05 | 0.02 | 0.02 | 0.33 | 0.02 | 0.05 | 0.04 | 0.08 | 0.08 | 0.14 | 0.05 | 0.08 | 0.09 | 0.05 |
| Si, mg L−1 | 2.16 | 3.20 | 3.04 | 2.84 | 2.16 | 2.36 | 2.68 | 2.04 | 2.04 | 2.04 | 2.68 | 2.52 | 2.52 | 2.04 | 2.16 | 2.36 | 2.04 | 2.04 | 2.16 | 2.16 | 2.16 | 2.52 | 2.00 | 2.36 | 2.16 | 1.64 |
| Fe tot., mg L−1 | 0.10 | 0.26 | 0.26 | 0.20 | 0.08 | 0.08 | 0.16 | 0.02 | 0.08 | 0.16 | 0.16 | 0.16 | 0.10 | 0.10 | 0.10 | 0.26 | 0.10 | 0.10 | 0.26 | 0.80 | 0.72 | 0.94 | 1.08 | 0.80 | 0.46 | 0.10 |
| Altitude, m a.s.l. | 388.00 | 388.00 | 388.00 | 226.00 | 222.00 | 264.00 | 160.00 | 130.00 | 147.00 | 94.00 | 84.00 | 60.00 | 50.00 | 25.00 | 31.00 | 34.00 | 30.00 | 30.00 | 23.00 | 15.00 | 13.00 | 2.00 | 2.00 | 27.00 | 2.00 | 1.00 |
Table A2.
Averaged data of phytoplankton biological and bioindicator variables in the samples collected in the Anabar River in the period from 24.06.2008 to 12.07.2008, Eastern Siberia, Russia (sampling stations as in Table 1).
Table A2.
Averaged data of phytoplankton biological and bioindicator variables in the samples collected in the Anabar River in the period from 24.06.2008 to 12.07.2008, Eastern Siberia, Russia (sampling stations as in Table 1).
| Sampling Station | 186 | 187 | 188 | 189 | 190 | 191 | 192 | 193 | 194 | 195 | 196 | 197 | 198 | 199 | 200 | 201 | 202 | 203 | 204 | 205 | 206 | 207 | 208 | 209 | 210 | 211 |
|---|---|---|---|---|---|---|---|---|---|---|---|---|---|---|---|---|---|---|---|---|---|---|---|---|---|---|
| Total Abundance, cells L−1 | 7980 | 19,088 | 38,131 | 3241 | 34,968 | 15,884 | 15,903 | 19,088 | 42,893 | 7977 | 3220 | 1627 | 20,674 | 62 | 70 | 59 | 6383 | 3241 | 38,173 | 9573 | 65 | 6420 | 12,741 | 12,747 | 73 | 57,246 |
| No of Species | 18 | 20 | 19 | 25 | 24 | 10 | 15 | 20 | 21 | 17 | 17 | 15 | 20 | 22 | 25 | 21 | 14 | 25 | 39 | 22 | 23 | 28 | 20 | 23 | 26 | 52 |
| Index S | 0.32 | 0.30 | 1.34 | 1.90 | 0.30 | 0.30 | 2.00 | 1.63 | 1.56 | 0.30 | 0.31 | 0.32 | 0.30 | 1.44 | 1.63 | 1.49 | 2.10 | 2.09 | 2.17 | 1.75 | 1.41 | 1.75 | 1.33 | 1.57 | 1.46 | 1.23 |
| Index WESI | 3.00 | 2.00 | 0.67 | 0.50 | 2.00 | 2.00 | 1.75 | 0.50 | 0.50 | 2.00 | 2.00 | 3.00 | 2.00 | 1.00 | 1.50 | 2.00 | 0.60 | 0.60 | 0.60 | 1.50 | 2.00 | 0.75 | 1.67 | 1.50 | 1.67 | 1.00 |
| Index Shannon | 0.238 | 0.386 | 0.006 | 0.072 | 0.292 | 0.582 | 0.226 | 0.386 | 0.254 | 0.311 | 0.049 | 0.077 | 0.436 | 1.342 | 1.398 | 1.322 | 0.022 | 0.072 | 0.596 | 0.497 | 1.362 | 0.341 | 0.465 | 0.617 | 1.415 | 0.796 |
| Phyla Species | ||||||||||||||||||||||||||
| Bacillariophyta | 8 | 8 | 9 | 10 | 8 | 6 | 5 | 10 | 9 | 7 | 6 | 6 | 7 | 10 | 11 | 7 | 4 | 10 | 21 | 8 | 9 | 15 | 7 | 12 | 10 | 26 |
| Charophyta | 4 | 5 | 2 | 7 | 3 | 1 | 2 | 4 | 6 | 2 | 8 | 6 | 3 | 4 | 6 | 6 | 3 | 3 | 5 | 6 | 6 | 1 | 3 | 1 | 2 | 3 |
| Chlorophyta | 3 | 1 | 2 | 1 | 3 | 0 | 2 | 3 | 2 | 4 | 1 | 1 | 1 | 1 | 3 | 2 | 6 | 3 | 4 | 2 | 2 | 4 | 2 | 4 | 3 | 10 |
| Cyanobacteria | 1 | 3 | 4 | 3 | 5 | 1 | 4 | 2 | 1 | 2 | 1 | 2 | 6 | 4 | 3 | 5 | 0 | 7 | 4 | 3 | 3 | 2 | 1 | 0 | 3 | 5 |
| Ochrophyta | 1 | 2 | 2 | 4 | 4 | 1 | 2 | 1 | 3 | 1 | 1 | 0 | 3 | 3 | 2 | 1 | 1 | 1 | 4 | 3 | 3 | 6 | 6 | 6 | 8 | 8 |
| Rhodophyta | 1 | 1 | 0 | 0 | 0 | 1 | 0 | 0 | 0 | 1 | 0 | 0 | 0 | 0 | 0 | 0 | 0 | 0 | 0 | 0 | 0 | 0 | 0 | 0 | 0 | 0 |
| Miozoa | 0 | 0 | 0 | 0 | 1 | 0 | 0 | 0 | 0 | 0 | 0 | 0 | 0 | 0 | 0 | 0 | 0 | 1 | 1 | 0 | 0 | 0 | 1 | 0 | 0 | 0 |
| Phyla abundance, cells L−1 | ||||||||||||||||||||||||||
| Bacillariophyta | 7952 | 15,884 | 25 | 3199 | 34,924 | 15,872 | 3185 | 6369 | 11,129 | 7949 | 3189 | 1602 | 11,124 | 28 | 31 | 20 | 11 | 28 | 12,741 | 22 | 25 | 42 | 20 | 6375 | 28 | 22,278 |
| Charophyta | 11 | 3185 | 6 | 20 | 8 | 3 | 6 | 11 | 17 | 6 | 22 | 17 | 3179 | 11 | 17 | 17 | 8 | 8 | 14 | 17 | 17 | 3 | 8 | 3 | 6 | 8 |
| Chlorophyta | 8 | 3 | 6 | 3 | 8 | 0 | 12,696 | 12,699 | 31,736 | 11 | 3 | 3 | 3 | 3 | 8 | 6 | 6361 | 3179 | 3182 | 6347 | 6 | 6352 | 3176 | 3182 | 8 | 3199 |
| Cyanobacteria | 3 | 8 | 11 | 8 | 14 | 3 | 11 | 6 | 3 | 6 | 3 | 6 | 17 | 11 | 8 | 14 | 0 | 20 | 22,222 | 8 | 8 | 6 | 3 | 0 | 8 | 12,705 |
| Ochrophyta | 3 | 6 | 38,083 | 11 | 11 | 3 | 6 | 3 | 8 | 3 | 3 | 0 | 6352 | 8 | 6 | 3 | 3 | 3 | 11 | 3179 | 8 | 17 | 9531 | 3187 | 22 | 19,057 |
| Rhodophyta | 3 | 3 | 0 | 0 | 0 | 3 | 0 | 0 | 0 | 3 | 0 | 0 | 0 | 0 | 0 | 0 | 0 | 0 | 0 | 0 | 0 | 0 | 0 | 0 | 0 | 0 |
| Miozoa | 0 | 0 | 0 | 0 | 3 | 0 | 0 | 0 | 0 | 0 | 0 | 0 | 0 | 0 | 0 | 0 | 0 | 3 | 3 | 0 | 0 | 0 | 3 | 0 | 0 | 0 |
| Habitat | ||||||||||||||||||||||||||
| Ep | 0 | 0 | 0 | 0 | 0 | 0 | 0 | 0 | 0 | 0 | 0 | 0 | 1 | 0 | 0 | 1 | 0 | 1 | 0 | 0 | 0 | 0 | 0 | 0 | 0 | 0 |
| B | 11 | 11 | 9 | 12 | 8 | 5 | 7 | 9 | 10 | 8 | 11 | 7 | 8 | 8 | 12 | 11 | 3 | 9 | 17 | 5 | 7 | 10 | 3 | 4 | 3 | 7 |
| P-B | 5 | 4 | 5 | 7 | 10 | 3 | 4 | 8 | 7 | 7 | 3 | 5 | 5 | 6 | 9 | 6 | 9 | 12 | 15 | 11 | 9 | 13 | 11 | 13 | 15 | 29 |
| P | 0 | 2 | 1 | 0 | 0 | 0 | 0 | 2 | 1 | 0 | 0 | 1 | 0 | 1 | 0 | 0 | 1 | 2 | 3 | 1 | 4 | 5 | 5 | 5 | 3 | 11 |
| Temperature | ||||||||||||||||||||||||||
| cool | 0 | 0 | 0 | 0 | 0 | 0 | 0 | 0 | 0 | 0 | 0 | 0 | 0 | 0 | 0 | 0 | 0 | 0 | 0 | 0 | 1 | 0 | 0 | 0 | 0 | 2 |
| temp | 2 | 1 | 4 | 3 | 2 | 1 | 1 | 1 | 2 | 1 | 1 | 1 | 2 | 1 | 3 | 3 | 0 | 2 | 8 | 1 | 4 | 10 | 1 | 8 | 5 | 14 |
| eterm | 1 | 2 | 1 | 1 | 3 | 1 | 1 | 4 | 1 | 2 | 1 | 1 | 1 | 2 | 1 | 1 | 3 | 1 | 2 | 4 | 1 | 1 | 5 | 0 | 2 | 1 |
| warm | 0 | 0 | 0 | 0 | 0 | 0 | 0 | 0 | 1 | 0 | 0 | 0 | 0 | 0 | 0 | 0 | 0 | 0 | 1 | 1 | 0 | 0 | 0 | 0 | 1 | 1 |
| Oxygen | ||||||||||||||||||||||||||
| aer | 1 | 2 | 3 | 3 | 1 | 1 | 2 | 0 | 2 | 0 | 3 | 2 | 1 | 0 | 2 | 1 | 0 | 2 | 2 | 1 | 1 | 1 | 0 | 0 | 0 | 0 |
| str | 0 | 0 | 0 | 1 | 2 | 1 | 2 | 0 | 1 | 1 | 0 | 0 | 0 | 0 | 1 | 0 | 0 | 0 | 2 | 0 | 0 | 1 | 0 | 0 | 0 | 2 |
| st-str | 4 | 6 | 7 | 8 | 7 | 3 | 4 | 10 | 7 | 7 | 3 | 4 | 7 | 8 | 11 | 7 | 7 | 10 | 14 | 9 | 11 | 14 | 6 | 12 | 12 | 23 |
| st | 0 | 0 | 0 | 0 | 2 | 0 | 0 | 1 | 0 | 0 | 0 | 0 | 2 | 2 | 1 | 1 | 2 | 5 | 5 | 3 | 0 | 4 | 4 | 2 | 2 | 6 |
| H2S | 0 | 0 | 0 | 0 | 0 | 0 | 0 | 0 | 0 | 0 | 0 | 0 | 0 | 0 | 0 | 0 | 0 | 0 | 1 | 0 | 0 | 0 | 0 | 0 | 0 | 0 |
| Salinity | ||||||||||||||||||||||||||
| hb | 1 | 2 | 2 | 0 | 0 | 0 | 0 | 2 | 0 | 1 | 1 | 2 | 0 | 0 | 0 | 0 | 0 | 0 | 1 | 0 | 0 | 1 | 0 | 0 | 0 | 1 |
| i | 5 | 5 | 5 | 6 | 9 | 3 | 4 | 9 | 8 | 7 | 3 | 4 | 8 | 10 | 12 | 7 | 8 | 13 | 19 | 10 | 11 | 20 | 9 | 15 | 15 | 28 |
| hl | 0 | 0 | 0 | 1 | 2 | 0 | 0 | 0 | 0 | 1 | 0 | 0 | 1 | 1 | 1 | 1 | 0 | 1 | 1 | 1 | 1 | 1 | 0 | 0 | 1 | 4 |
| mh | 1 | 1 | 1 | 1 | 1 | 1 | 1 | 1 | 1 | 1 | 1 | 1 | 2 | 1 | 1 | 2 | 0 | 2 | 3 | 1 | 1 | 1 | 0 | 1 | 2 | 5 |
| eh | 0 | 0 | 0 | 0 | 0 | 0 | 0 | 0 | 0 | 0 | 0 | 0 | 0 | 0 | 0 | 0 | 0 | 0 | 1 | 0 | 0 | 0 | 0 | 0 | 0 | 0 |
| pH | ||||||||||||||||||||||||||
| acb | 0 | 0 | 1 | 0 | 0 | 0 | 0 | 0 | 0 | 0 | 0 | 0 | 0 | 0 | 0 | 0 | 0 | 0 | 0 | 0 | 0 | 0 | 0 | 0 | 0 | 0 |
| acf | 4 | 3 | 3 | 3 | 1 | 1 | 1 | 4 | 4 | 1 | 6 | 3 | 2 | 1 | 2 | 3 | 0 | 2 | 3 | 1 | 3 | 2 | 1 | 2 | 2 | 5 |
| ind | 3 | 5 | 3 | 7 | 5 | 2 | 3 | 7 | 3 | 6 | 3 | 4 | 5 | 5 | 8 | 8 | 6 | 8 | 11 | 8 | 6 | 6 | 2 | 3 | 3 | 7 |
| alf | 3 | 1 | 3 | 4 | 3 | 2 | 2 | 4 | 5 | 2 | 2 | 2 | 4 | 5 | 6 | 3 | 1 | 3 | 12 | 3 | 6 | 10 | 6 | 7 | 7 | 16 |
| alb | 1 | 1 | 1 | 0 | 1 | 0 | 0 | 1 | 1 | 1 | 1 | 0 | 0 | 1 | 1 | 1 | 1 | 0 | 0 | 0 | 1 | 0 | 0 | 0 | 0 | 2 |
| Watanabe | ||||||||||||||||||||||||||
| sp | 0 | 0 | 0 | 0 | 0 | 0 | 0 | 0 | 0 | 0 | 0 | 0 | 0 | 0 | 0 | 0 | 0 | 0 | 0 | 0 | 0 | 0 | 0 | 0 | 0 | 1 |
| es | 1 | 0 | 1 | 1 | 1 | 0 | 0 | 1 | 1 | 1 | 1 | 1 | 1 | 1 | 2 | 1 | 1 | 2 | 7 | 1 | 3 | 4 | 3 | 4 | 3 | 4 |
| sx | 0 | 0 | 1 | 0 | 0 | 0 | 0 | 1 | 1 | 0 | 0 | 0 | 1 | 1 | 1 | 2 | 1 | 1 | 1 | 1 | 1 | 1 | 1 | 1 | 1 | 3 |
| Class of Water Quality | ||||||||||||||||||||||||||
| Class 1 | 1 | 0 | 1 | 0 | 0 | 0 | 0 | 2 | 1 | 1 | 0 | 0 | 0 | 0 | 0 | 0 | 0 | 0 | 0 | 0 | 1 | 2 | 1 | 1 | 1 | 3 |
| Class 2 | 2 | 5 | 3 | 4 | 3 | 1 | 1 | 3 | 5 | 2 | 2 | 3 | 3 | 2 | 5 | 0 | 4 | 6 | 11 | 4 | 5 | 14 | 11 | 9 | 8 | 15 |
| Class 3 | 3 | 3 | 4 | 5 | 4 | 2 | 3 | 4 | 3 | 3 | 2 | 4 | 4 | 4 | 6 | 0 | 5 | 7 | 6 | 5 | 5 | 6 | 3 | 7 | 7 | 13 |
| Class 4 | 2 | 2 | 1 | 2 | 1 | 1 | 2 | 2 | 3 | 1 | 2 | 2 | 1 | 1 | 3 | 0 | 0 | 1 | 4 | 1 | 1 | 1 | 1 | 0 | 1 | 1 |
| Class 5 | 0 | 0 | 0 | 0 | 0 | 0 | 0 | 1 | 0 | 0 | 0 | 0 | 0 | 0 | 0 | 0 | 0 | 0 | 0 | 0 | 0 | 0 | 0 | 0 | 0 | 0 |
| Autotrophy-Heterotrophy | ||||||||||||||||||||||||||
| ats | 1 | 0 | 1 | 0 | 0 | 0 | 0 | 1 | 1 | 0 | 0 | 0 | 1 | 1 | 1 | 1 | 1 | 1 | 2 | 0 | 0 | 4 | 2 | 2 | 0 | 8 |
| ate | 1 | 1 | 1 | 3 | 1 | 0 | 0 | 2 | 2 | 2 | 0 | 0 | 0 | 0 | 2 | 0 | 0 | 1 | 4 | 3 | 4 | 3 | 3 | 4 | 4 | 5 |
| hne | 0 | 0 | 0 | 0 | 0 | 0 | 0 | 0 | 0 | 0 | 1 | 1 | 1 | 1 | 1 | 1 | 1 | 1 | 0 | 0 | 0 | 0 | 0 | 0 | 0 | 1 |
| hce | 0 | 0 | 0 | 0 | 0 | 0 | 0 | 0 | 0 | 0 | 0 | 0 | 0 | 0 | 0 | 0 | 0 | 0 | 1 | 0 | 0 | 0 | 0 | 0 | 0 | 0 |
| Trophic state | ||||||||||||||||||||||||||
| ot | 1 | 1 | 2 | 0 | 0 | 0 | 0 | 2 | 2 | 0 | 0 | 0 | 2 | 1 | 1 | 0 | 1 | 1 | 3 | 1 | 0 | 2 | 0 | 1 | 0 | 3 |
| om | 0 | 1 | 1 | 0 | 0 | 0 | 0 | 0 | 1 | 0 | 2 | 1 | 1 | 1 | 2 | 1 | 1 | 1 | 1 | 0 | 1 | 2 | 2 | 3 | 2 | 5 |
| m | 1 | 2 | 1 | 3 | 1 | 0 | 1 | 0 | 1 | 0 | 4 | 2 | 2 | 1 | 1 | 4 | 0 | 3 | 3 | 1 | 3 | 1 | 1 | 0 | 4 | 2 |
| me | 0 | 0 | 0 | 0 | 0 | 0 | 0 | 1 | 0 | 1 | 0 | 1 | 0 | 0 | 1 | 0 | 1 | 2 | 4 | 3 | 4 | 1 | 1 | 2 | 1 | 4 |
| e | 2 | 2 | 2 | 3 | 3 | 1 | 2 | 6 | 5 | 2 | 1 | 3 | 3 | 2 | 5 | 2 | 2 | 4 | 5 | 4 | 2 | 4 | 3 | 4 | 2 | 6 |
| o-e | 0 | 0 | 0 | 0 | 0 | 0 | 0 | 0 | 0 | 0 | 0 | 0 | 0 | 0 | 0 | 0 | 0 | 0 | 0 | 0 | 1 | 0 | 0 | 0 | 0 | 0 |
| he | 0 | 0 | 0 | 1 | 0 | 0 | 0 | 0 | 0 | 0 | 0 | 0 | 0 | 0 | 0 | 0 | 0 | 0 | 0 | 0 | 0 | 0 | 0 | 0 | 0 | 0 |
Note: The ecological groups: Habitat (Ep—epiphyte, P—planktonic, P-B—plankto-benthic, B—benthic). Temperature preferences (cool—cool-water, temp—temperate, eterm—eurythermic, warm—warm-water). Oxygen and streaming (st—standing water, str—streaming water, st-str—low streaming water, aer—aerophiles, H2S, anoxia with sulfides). Salinity ecological groups according to Hustedt (1938–1939) [55] (hb—oligohalobes-halophobes, i—oligohalobes-indifferent, hl—halophiles; mh—mesohalobes, eh—euhalobes). pH preferences groups (pH) according to Hustedt (1957) [28] (alb—alkalibiontes; alf—alkaliphiles, ind—indifferent; acf—acidophiles; acb—acidobiontes). Organic pollution indicators according to Watanabe et al. (1986) [29]: sx—saproxenes; es—eurysaprobes; sp—saprophiles. Class 1–5 of organic pollution indicators according to species-specific Index saprobity of Sládeček, 1986 [30]. Nutrition type as nitrogen uptake metabolism (Van Dam et al., 1994) [31]: ats—nitrogen-autotrophic taxa, tolerating very small concentrations of organically bound nitrogen; ate—nitrogen-autotrophic taxa, tolerating elevated concentrations of organically bound nitrogen; hne—facultative nitrogen-heterotrophic taxa, needing periodically elevated concentrations of organically bound nitrogen; hce—obligate nitrogen-heterotrophic taxa, needing continuously elevated concentrations of organically bound nitrogen. Trophic state indicators (Van Dam et al., 1994) [31]: (ot—oligotraphentic; om—oligomesotraphentic; m—mesotraphentic; me—mesoeutraphentic; e—eutraphentic; he—hypereutraphentic; o-e—oligo- to eutraphentic (hypereutraphentic)).
Table A3.
Phytoplankton species ecological preferences in the samples collected in the Anabar River in the period from 24.06.2008 to 12.07.2008, Eastern Siberia, Russia.
Table A3.
Phytoplankton species ecological preferences in the samples collected in the Anabar River in the period from 24.06.2008 to 12.07.2008, Eastern Siberia, Russia.
| Phyla | Hab | T | OXY | HAL | pH | D | Index S | SAP | AUT-HET | TRO |
|---|---|---|---|---|---|---|---|---|---|---|
| Bacillariophyta | ||||||||||
| Achnanthidium affine (Grunow) Czarnecki | B | - | str | i | alf | es | 1.10 | o | ate | - |
| Achnanthidium minutissimum (Kützing) Czarnecki | P-B | eterm | st-str | i | ind | es | 0.95 | b | ate | e |
| Achnanthidium trinode Ralfs | B | - | - | - | alf | - | 1.00 | o | - | ot |
| Actinocyclus normanii (W.Gregory ex Greville) Hustedt | P | - | st-str | mh | alf | - | 2.30 | b | ate | e |
| Asterionella formosa Hassall | P | temp | st-str | i | alf | sx | 1.35 | b | ate | me |
| Asterionella ralfsii W.Smith | P-B | - | - | i | acf | - | 0.50 | x-o | - | ot |
| Aulacoseira distans (Ehrenberg) Simonsen | P-B | cool | str | i | acf | sp | 0.40 | o | ats | ot |
| Aulacoseira granulata (Ehrenberg) Simonsen | P-B | temp | st-str | i | alf | es | 2.00 | b | ate | e |
| Aulacoseira islandica (O.Müller) Simonsen | P-B | cool | st-str | i | ind | es | 2.00 | b | ate | o-e |
| Aulacoseira subarctica (O.Müller) E.Y.Haworth | P | temp | st-str | i | alf | - | 1.70 | b-o | ats | om |
| Belonastrum berolinense (Lemmermann) Round & Maidana | P-B | - | st-str | hl | alf | - | 2.20 | b | ate | he |
| Cymatopleura comperei C.Cocquyt & R.Jahn | - | - | - | - | - | - | - | - | - | - |
| Cymbella aspera (Ehrenberg) Cleve | B | - | st-str | i | neu | es | 0.30 | x | ats | e |
| Cymbella cistula (Ehrenberg) O.Kirchner | B | - | st-str | i | alf | sx | 1.20 | b | ats | e |
| Cymbella lanceolata C.Agardh | B | temp | st-str | i | alf | es | 2.50 | b-a | ate | e |
| Cymbopleura heteropleura (Ehrenberg) Z.X.Shi | - | - | - | - | - | - | - | - | - | - |
| Cymbopleura naviculiformis (Auerswald ex Heiberg) Krammer | B | temp | st-str | i | ind | - | - | - | - | - |
| Diatoma elongata (Lyngbye) C.Agardh | P-B | - | st-str | hl | alf | - | - | - | - | - |
| Diatoma tenuis C.Agardh | P-B | temp | st-str | hl | alf | - | 2.40 | b-a | - | om |
| Diatoma vulgaris Bory | P-B | temp | st-str | i | alf | - | 2.40 | b-a | - | - |
| Diatoma vulgaris var. linearis Grunow | B | - | str | i | alf | es | - | - | - | - |
| Didymosphenia geminata (Lyngbye) Mart. Schmidt | B | - | st-str | i | ind | - | 2.00 | b | - | - |
| Encyonema minutum (Hilse) D.G.Mann | B | temp | st-str | i | ind | sx | 1.50 | o-b | ats | - |
| Encyonema silesiacum (Bleisch) D.G.Mann | B | temp | st-str | i | ind | - | - | - | - | - |
| Encyonema ventricosum (C.Agardh) Grunow | B | - | st-str | i | ind | - | - | - | ate | - |
| Entomoneis paludosa (W.Smith) Reimer | P-B | - | - | mh | alf | - | - | - | - | - |
| Epithemia adnata (Kützing) Brébisson | B | temp | st-str | i | alb | - | 1.20 | o | - | - |
| Epithemia argus (Ehrenberg) Kützing | P-B | - | st-str | i | ind | sx | 1.20 | o | ats | me |
| Epithemia sorex Kützing | B | temp | st-str | i | alf | - | - | - | - | - |
| Epithemia turgida (Ehrenberg) Kützing | B | temp | st-str | i | alf | - | 1.10 | - | - | - |
| Eunotia arcus Ehrenberg | B | temp | st-str | i | acf | sx | 0.40 | x-o | ats | ot |
| Eunotia exigua (Brébisson ex Kützing) Rabenhorst | P-B,aer | temp | st-str | hb | acb | - | 1.00 | o | - | ot |
| Eunotia incisa W.Smith ex W.Gregory | P-B | temp | st-str | i | acf | - | - | o | ats | om |
| Eunotia lunaris (Ehrenberg) Grunow | B | - | - | - | - | - | - | - | - | - |
| Eunotia polydentula Hustedt | B | - | - | hb | acf | - | - | - | - | - |
| Eunotia septentrionalis Østrup | P-B | - | str | hb | acf | - | 1.00 | o | - | ot |
| Eunotia tenella (Grunow) Hustedt | B | temp | st-str | hb | acf | - | - | - | - | - |
| Eunotia vanheurckii R.M.Patrick | B | temp | st-str | i | acf | - | 0.50 | x-o | ats | ot |
| Eunotia veneris (Kützing) De Toni | - | - | - | - | - | - | - | - | - | - |
| Fragilaria capucina Desmazières | P-B | temp | st-str | i | ind | - | - | - | - | - |
| Fragilaria intermedia (Grunow) Grunow | - | - | - | - | - | - | - | - | - | - |
| Fragilaria radians (Kützing) D.M.Williams & Round | P-B | warm | st-str | i | alf | - | - | - | - | - |
| Gomphonema longiceps Ehrenberg var. montanum (Schumann) Cleve f. suecicum Grunow | - | - | - | - | - | - | - | - | - | - |
| Gomphonema acuminatum Ehrenberg | B | temp | st-str | i | ind | - | 0.80 | x-b | - | - |
| Gomphonema brebissonii Kützing | B | - | st | i | ind | - | - | - | - | m |
| Gomphonema constrictum Ehrenberg | - | - | - | - | - | - | - | - | - | - |
| Gomphonema coronatum Ehrenberg | B | - | st | i | ind | - | - | - | - | - |
| Gomphonema montanum (Schumann) Grunow | B | - | str | i | ind | - | - | - | ate | - |
| Gomphonema pumilum (Grunow) E.Reichardt & Lange-Bertalot | B | temp | - | i | alf | - | - | - | - | - |
| Hannaea arcus (Ehrenberg) R.M.Patrick | B | temp | str | i | alf | - | - | - | - | - |
| Hannaea linearis (Holmboe) Álvarez-Blanco & S.Blanco | P | - | - | i | alf | - | 1.00 | o | - | ot |
| Hantzschia elongata (Hantzsch) Grunow | B | - | aer | i | acf | - | - | - | - | - |
| Iconella tenera (W.Gregory) Ruck & Nakov | P-B | temp | st | i | alf | - | 0.20 | x | ats | ot |
| Meridion circulare (Greville) C.Agardh | P-B | temp | st-str | i | ind | - | - | - | - | - |
| Navicula radiosa Kützing | B | temp | st-str | i | ind | sx | - | - | - | - |
| Nitzschia acicularis (Kützing) W.Smith | P-B | temp | st | i | alf | es | 1.40 | o-b | ats | om |
| Nitzschia linearis W.Smith | B | temp | st-str | i | alf | - | - | - | - | - |
| Nitzschia recta Hantzsch ex Rabenhorst | B | temp | st-str | i | alf | - | 1.00 | o | - | - |
| Nitzschia sigma (Kützing) W.Smith | B | temp | st-str | mh | alf | - | - | - | - | - |
| Nitzschia tubicola Grunow | B | temp | - | mh | ind | es | 2.80 | a-o | hce | e |
| Pinnularia divergens W.Smith | B | - | st | hb | ind | - | - | - | - | - |
| Pinnularia microstauron var. ambigua F.Meister | B | - | st-str | hb | ind | - | 0.80 | x-b | ate | me |
| Pinnularia stauroptera (Grunow) Rabenhorst | - | - | - | - | - | - | - | - | - | - |
| Planothidium dispar (Cleve) Witkowski, Lange-Bertalot & Metzeltin | B | - | - | eh | alf | - | - | - | - | - |
| Pseudostaurosira parasitica (W.Smith) E.Morales | P-B | temp | st-str | i | alf | - | 1.00 | o | ate | ot |
| Rhopalodia gibba (Ehrenberg) O.Müller | P-B | temp | st-str | i | alf | es | 1.40 | x-o | ate | om |
| Stauroneis anceps Ehrenberg | P-B | temp | st-str | i | ind | sx | 1.30 | o | ats | om |
| Stauroneis phoenicenteron (Nitzsch) Ehrenberg | P-B | temp | st-str | i | ind | - | - | - | - | - |
| Stephanocyclus meneghinianus (Kützing) Kulikovskiy, Genkal & Kociolek | - | - | - | - | - | - | - | - | - | - |
| Stephanodiscus niagarae Ehrenberg | P-B | temp | st | i | alf | - | - | - | hne | - |
| Tabellaria fenestrata (Lyngbye) Kützing | P-B | - | st-str | i | ind | - | 1.90 | o-a | - | - |
| Tabellaria flocculosa (Roth) Kützing | P-B | eterm | st-str | i | acf | - | 0.30 | a | - | - |
| Tabularia tabulata (C.Agardh) Snoeijs | B | - | - | mh | alf | - | - | - | - | - |
| Thalassiosira baltica (Grunow) Ostenfeld | P-B | cool | - | mh | - | - | - | - | - | - |
| Ulnaria acus (Kützing) Aboal | P-B | warm | st-str | i | alf | es | 1.85 | o-a | ate | me |
| Ulnaria amphirhynchus (Ehrenberg) Compère & Bukhtiyarova | P-B | - | - | i | alf | es | 2.00 | b | hne | om |
| Ulnaria ulna (Nitzsch) Compère | P-B | temp | st-str | i | alf | es | 2.40 | b-a | ate | e |
| Urosolenia longiseta (O.Zacharias) Edlund & Stoermer | P | - | str | i | acf | - | 0.90 | x-b | ats | me |
| Charophyta | ||||||||||
| Closterium acerosum Ehrenberg ex Ralfs | P-B | - | st-str | i | ind | - | 2.60 | a-o | - | e |
| Closterium decorum Brébisson | - | - | - | - | - | - | - | - | - | - |
| Closterium dianae var. arcuatum (Brebisson ex Ralfs) Rabenhorst | B | - | - | - | acf | - | 0.80 | x-b | - | m |
| Closterium leibleinii Kützing ex Ralfs | P-B | - | st-str | - | ind | - | 2.60 | a-o | - | e |
| Closterium littorale F.Gay | P-B | - | - | - | ind | - | 2.40 | b-a | - | e |
| Closterium macilentum Brébisson | P-B | - | st-str | i | ind | - | - | - | - | me |
| Closterium moniliferum Ehrenberg ex Ralfs | P-B | - | st-str | i | ind | - | 2.10 | b | - | me |
| Closterium parvulum Nägeli | P-B | - | - | i | ind | - | 2.00 | b | - | m |
| Closterium peracerosum F.Gay | - | - | - | - | - | - | - | - | - | - |
| Closterium rostratum Ehrenberg ex Ralfs | B | - | aer | - | ind | - | 0.70 | o-x | - | m |
| Closterium strigosum var. elegans (G.S.West) Willi Krieger | B | - | - | - | ind | - | - | - | - | e |
| Closterium subulatum (Kützing) Brébisson | B | - | - | - | ind | - | - | - | - | me |
| Closterium tumidum L.N.Johnson | B | - | aer | - | acf | - | - | - | - | om |
| Cosmarium asphaerosporum var. strigosum Nordstedt | B | - | - | - | acf | - | - | - | - | m |
| Cosmarium boeckii Wille | P-B | - | - | - | ind | - | - | - | - | m |
| Cosmarium formosulum Hoff | P-B | - | - | - | ind | - | 1.80 | o-a | - | me |
| Cosmarium novae-semliae Wille | B | - | - | - | acf | - | - | - | - | m |
| Cosmarium pygmaeum W.Archer | P-B | - | st-str | - | acf | - | - | - | - | om |
| Cosmarium speciosum P.Lundell | B,aer | - | aer | - | ind | - | - | - | - | m |
| Cosmarium staurastroides Eichler & Gutwinski | - | - | - | - | acf | - | - | - | - | ot |
| Cosmarium subcrenatum Hantzsch | B,aer | - | aer | - | acf | - | 1.10 | o | - | m |
| Cosmarium trachypleurum var. minus Raciborski | B | - | - | - | acf | - | - | - | - | m |
| Euastrum bidentatum Nägeli | P-B | - | - | hb | ind | - | 0.50 | x-o | - | - |
| Gonatozygon brebissonii var. minutum (West) West & G.S.West | B | - | - | - | acf | - | 1.10 | - | - | - |
| Heimansia pusilla (L.Hilse) Coesel | - | - | - | - | ind | - | - | - | - | - |
| Mougeotia sp. st. | B | - | - | - | - | - | 1.00 | o | - | - |
| Roya pseudoclosterium (J.Roy) West & G.S.West | B | - | - | - | acf | - | - | - | - | e |
| Spirogyra sp. st. | P-B | - | - | - | alf | - | - | - | - | - |
| Spondylosium planum (Wolle) West & G.S.West | P-B | - | - | i | ind | - | - | - | - | - |
| Staurastrum avicula var. lunatum (Ralfs) Coesel & Meesters | P-B | - | - | i | ind | - | - | - | - | e |
| Staurastrum basidentatum Borge | - | - | - | - | - | - | - | - | - | - |
| Staurastrum dispar Brébisson | B | - | - | - | ind | - | - | - | - | m |
| Staurastrum erasum Brébisson | B | - | - | - | acf | - | - | - | - | m |
| Staurastrum margaritaceum Meneghini ex Ralfs | B | - | - | - | acf | - | - | - | - | om |
| Staurastrum pachyrhynchum var. convergens Raciborski | - | - | - | - | acf | - | - | - | - | m |
| Staurastrum pilosum Brébisson | P-B | - | st-str | - | acf | - | - | - | - | ot |
| Staurastrum punctulatum Brébisson | P-B | - | st-str | i | ind | - | - | - | - | ot |
| Staurastrum vestitum var. splendidum Grönblad | - | - | - | - | - | - | - | - | - | - |
| Zygnema sp. st. | P-B | - | - | - | alb | - | 1.00 | x-b | - | - |
| Chlorophyta | ||||||||||
| Ankistrodesmus arcuatus Korshikov | P-B | - | st-str | i | - | - | 2.10 | b | - | - |
| Ankistrodesmus fusiformis Corda | P-B | - | st-str | i | - | - | 2.00 | b | - | e |
| Ankistrodesmus spiralis (W.B.Turner) Lemmermann | P | - | - | - | - | - | 2.10 | b | - | e |
| Bulbochaete sp. | B | - | - | - | - | - | 1.20 | o | - | e |
| Cladophora glomerata (Linnaeus) Kützing | P-B | - | st-str | i | alf | - | 1.90 | o-a | - | e |
| Closteriopsis longissima (Lemmermann) Lemmermann | P | - | st-str | i | - | - | 1.80 | o-a | - | e |
| Coenococcus planctonicus Korshikov | P | - | - | i | - | - | 1.50 | o-b | - | - |
| Klebsormidium subtile (Kützing) Mikhailyuk, Glaser, Holzinger & Karsten | - | - | - | - | - | - | - | - | - | - |
| Lagerheimia chodatii C.Bernard | P | - | - | - | - | - | - | - | - | - |
| Monoraphidium komarkovae Nygaard | P-B | - | st | - | - | - | 1.50 | o-b | - | - |
| Mucidosphaerium pulchellum (H.C.Wood) C.Bock, Proschold & Krienitz | P-B | - | st-str | i | ind | - | 1.80 | o-a | - | - |
| Neglectella solitaria (Wittrock) Stenclová & Kastovsky | P | - | st | i | ind | - | 0.80 | x-b | ats | - |
| Oedogonium sp. | B | - | - | - | alb | - | - | - | - | - |
| Oocystis lacustris Chodat | P-B | - | st-str | hl | - | - | - | - | - | - |
| Penium spirostriolatum J.Barker | B | - | - | - | acf | - | - | - | - | - |
| Radiococcus polycoccus (Korshikov) Kostikov, Darienko, Lukesová & L.Hoffmann | P | - | - | i | - | - | - | - | - | me |
| Siderocystopsis punctifera (Bolochonzew) Hegewald & Schnepf | P-B | - | st-str | i | - | - | - | - | - | - |
| Sphaerocystis planctonica (Korshikov) Bourrelly | P | - | - | i | - | - | 1.00 | o | - | e |
| Stigeoclonium fasciculare Kützing | B | - | str | - | - | - | - | - | - | - |
| Stigeoclonium setigerum Kützing | - | - | - | - | - | - | - | - | - | - |
| Stigeoclonium tenue (C.Agardh) Kützing | P-B | - | st-str | - | alf | - | 2.30 | b | - | - |
| Ulothrix tenerrima (Kützing) Kützing | P-B | - | st | i | - | - | 1.80 | o-a | - | - |
| Ulothrix zonata (F.Weber & Mohr) Kützing | P-B | - | st-str | i | ind | - | 1.80 | o-a | - | - |
| Cyanobacteria | ||||||||||
| Anabaena aequalis O.Borge | P-B | - | st | - | - | - | 1.50 | o-b | - | e |
| Anabaena contorta H.Bachmann | P | - | st-str | - | - | - | - | - | - | - |
| Anagnostidinema amphibium (C.Agardh ex Gomont) Strunecký, Bohunická, J.R.Johansen & J.Komárek | P-B,S | - | st-str,H2S | hl | alf | - | 2.60 | a-o | - | m |
| Aphanizomenon flos-aquae Ralfs ex Bornet & Flahault | P-B | - | - | hl | alb | - | 1.95 | o-a | - | m |
| Aphanocapsa grevillei (Berkeley) Rabenhorst | P | - | - | hb | - | - | 1.40 | o-b | - | e |
| Aphanothece clathrata West & G.S.West | - | - | - | - | - | - | - | - | - | - |
| Calothrix clavata G.S.West | B,S | - | st-str | - | - | - | - | - | - | - |
| Chamaesiphon carpaticus Starmach | B | - | - | - | - | - | 0.50 | x-o | - | - |
| Chamaesiphon rostafinskii Hansgirg | - | - | - | - | - | - | - | - | - | - |
| Chroococcopsis gigantea Geitler | - | - | - | - | - | - | - | - | - | - |
| Coelosphaerium dubium Grunow | P | - | - | - | - | - | - | - | - | e |
| Coelosphaerium kuetzingianum Nägeli | P | - | - | i | - | - | 1.60 | b-o | - | m |
| Hassallia manginii Frémy | - | - | - | - | - | - | - | - | - | - |
| Jaaginema woronichinii (Anisimova) Anagnostidis & Komárek | B,Ep | - | st | mh | - | - | - | - | - | - |
| Leptolyngbya tenuis (Gomont) Anagnostidis & Komárek | B,S | - | st-str | i | alf | - | 0.50 | x-o | - | - |
| Limnothrix planctonica (Wołoszyńska) Meffert | P | - | - | i | - | - | 1.00 | o | ats | ot |
| Merismopedia glauca (Ehrenberg) Kützing | P-B | - | - | i | ind | - | - | - | - | e |
| Nostoc minutum Desmazières ex Bornet & Flahault | S,Ep | - | - | - | - | - | 1.60 | b-o | - | m |
| Oscillatoria rupicola (Hansgirg) Hansgirg ex Forti | P-B,S | - | aer | - | - | - | 2.70 | a-o | - | me |
| Oscillatoria tenuis C.Agardh ex Gomont | P-B,S | - | st-str | hl | - | - | - | - | - | - |
| Phormidium ambiguum Gomont | B,S | eterm | st-str | i | ind | - | - | - | - | - |
| Phormidium bohneri Schmidle | B,S | - | - | - | - | - | - | - | - | - |
| Phormidium tambii (Woronichin) Anagnostidis & Komárek | - | - | - | - | - | - | - | - | - | - |
| Phormidium terebriforme (C.Agardh ex Gomont) Anagnostidis & Komárek | P-B,S | eterm | st-str | - | ind | - | 1.50 | o-b | - | ot |
| Planktolyngbya limnetica (Lemmermann) Komárková-Legnerová & Cronberg | P-B,S | - | st-str | hl | alf | - | 1.80 | o-a | - | me |
| Planktothrix agardhii (Gomont) Anagnostidis & Komárek | P-B | - | st | hl | - | - | - | - | - | - |
| Scytonema hoffmannii C.Agardh ex Bornet & Flahault | B,S | - | aer | - | - | - | - | - | - | - |
| Spirulina laxa G.M.Smith | P | - | st | - | alf | - | 3.60 | a-b | - | e |
| Spirulina major Kützing ex Gomont | P-B,S | warm | st | hl | - | - | - | - | - | - |
| Spirulina schroederi Koppe | - | - | - | - | - | - | - | - | - | - |
| Spirulina spirulinoides (Ghose) Geitler | - | - | - | - | - | - | - | - | - | - |
| Stigonema hormoides Bornet & Flahault | S,B | - | aer | - | - | - | 2.80 | a-o | - | - |
| Stigonema informe Kützing ex Bornet & Flahault | S,B | - | aer | - | - | - | 2.80 | a-o | - | - |
| Tolypothrix distorta Kützing ex Bornet & Flahault | B,S | - | - | - | - | - | 0.95 | x-b | - | ot |
| Tolypothrix tenuis Kützing ex Bornet & Flahault | B,S | - | st | i | - | - | 1.00 | x-b | - | ot |
| Miozoa | ||||||||||
| Peridinium bipes F.Stein | P | - | st-str | oh | - | - | 1.40 | o-b | - | - |
| Peridinium cinctum (O.F.Müller) Ehrenberg | P-B | - | st-str | i | - | - | 1.40 | o-b | - | - |
| Peridinium volzii Lemmermann | P | - | - | - | - | - | 0.30 | x | ats | om |
| Ochrophyta | ||||||||||
| Arachnochloris subsolitaria (Pascher) Bourrelly | - | - | - | - | - | - | - | - | - | - |
| Bumilleria angustata (Starmach) Matvienko & Dogadina | - | - | - | - | - | - | - | - | - | - |
| Bumilleria sicula Borzì | - | - | - | - | - | - | - | - | - | - |
| Characiopsis anabaenae Pascher | - | - | - | - | - | - | - | - | - | - |
| Characiopsis heeringiana Pascher | - | - | - | - | - | - | - | - | - | - |
| Chlorarkys reticulata Pascher | - | - | - | - | - | - | - | - | - | - |
| Dinobryon bavaricum Imhof | P-B | - | - | i | - | - | 1.20 | o | - | - |
| Dinobryon borgei Lemmermann | P | - | - | - | - | - | 1.10 | - | - | - |
| Dinobryon cylindricum O.E.Imhof | P-B | - | - | i | - | - | 1.20 | o | - | - |
| Dinobryon faculiferum Willén | P | - | - | - | - | - | 1.20 | o | - | - |
| Dinobryon sociale var. americanum (Brunnthaler) Bachmann | P | - | - | - | - | - | 1.30 | o | - | - |
| Dinobryon suecicum var. longispinum Lemmermann | P | - | - | - | - | - | 1.20 | o | - | - |
| Epipyxis pulchra D.K.Hilliard & B.C.Asmund | - | - | - | - | - | - | - | - | - | - |
| Gaumiella bellifontana Bourrelly | - | - | - | - | - | - | - | - | - | - |
| Gloeoskene turfosa Fott | - | - | - | - | - | - | - | - | - | - |
| Heterodendron pascheri Steinecke | - | - | - | - | - | - | - | - | - | - |
| Kephyrion colliferum de Graaf | B | - | - | - | - | - | 1.50 | o-b | - | - |
| Mallomonas horrida J.Schiller | - | - | - | - | - | - | - | - | - | - |
| Ophiocytium cochleare (Eichwald) A.Braun | P-B | - | - | oh | - | - | - | - | - | e |
| Pseudokephyrion pseudospirale Bourrelly | - | - | - | - | - | - | 1.50 | o-b | - | - |
| Pseudokephyrion undulatissimum Scherffel | B | - | - | oh | - | - | 1.10 | o | - | - |
| Synura uvella Ehrenberg | P-B | - | st | - | - | - | 1.10 | o | - | - |
| Tribonema affine (Kützing) G.S.West | B | - | - | hb | - | - | 0.80 | x-b | - | - |
| Tribonema ambiguum Skuja | - | - | - | - | - | - | - | - | - | - |
| Tribonema microchloron Ettl | - | - | - | - | - | - | - | - | - | - |
| Tribonema pyrenigerum Paseher | - | - | - | - | - | - | - | - | - | - |
| Tribonema regulare Pascher | B | - | - | - | - | - | 1.60 | b-o | - | - |
| Tribonema ulotrichoides Pascher | B | - | - | - | - | - | 1.30 | o | - | - |
| Tribonema utriculosum (Kützing) Hazen | B | - | - | - | - | - | - | - | - | - |
| Tribonema viride Pascher | P-B | - | - | i | - | - | 0.70 | o-x | - | - |
| Xanthonema quadratum (Pascher) P.C.Silva | - | - | - | - | - | - | - | - | - | - |
| Rhodophyta | ||||||||||
| Batrachospermum gelatinosum (Linnaeus) De Candolle | B | - | - | - | - | - | 0.90 | x-b | - | - |
Note: The ecological groups: Habitat (Ep—epiphyte, P—planktonic, P-B—plankto-benthic, B—benthic). Temperature preferences (cool—cool-water, temp—temperate, eterm—eurythermic, warm—warm-water). Oxygen and streaming (st—standing water, str—streaming water, st-str—low streaming water, aer—aerophiles, H2S, anoxia with sulfides). Salinity ecological groups according to Hustedt (1938–1939) [55] (hb—oligohalobes-halophobes, i—oligohalobes-indifferent, hl—halophiles; mh—mesohalobes, eh—euhalobes). pH preferences groups (pH) according to Hustedt (1957) [28] (alb—alkalibiontes; alf—alkaliphiles, ind—indifferent; acf—acidophiles; acb—acidobiontes). Organic pollution indicators according to Watanabe et al. (1986) [29]: sx—saproxenes; es—eurysaprobes; sp—saprophiles. Saprobity groups according to Sládeček [30]: a—alpha-mesosaprobiont; a-o—alpha-oligosaprobiont; b—beta-mesosaprobiont; b-a—beta-alpha-mesosaprobiont; a-b—alpha-beta-mesosaprobiont; b-o—beta-oligosaprobiont; o, oligosaprobiont; o-a, oligo-alpha-mesosaprobiont; o-b—oligo-betamazosaprobiont; o-x—oligo-xenosaprobiont; p-a, poly-alpha-mesosaprobiont; x-b, xeno-beta-mesosaprobiont; x-o, xeno-oligosaprobiont; x, xenosaprobiont. Class 1–5 of organic pollution indicators according to species-specific Index saprobity of Sládeček, 1986 [30]. Nutrition type as nitrogen uptake metabolism (Van Dam et al., 1994) [31]: ats—nitrogen-autotrophic taxa, tolerating very small concentrations of organically bound nitrogen; ate—nitrogen-autotrophic taxa, tolerating elevated concentrations of organically bound nitrogen; hne—facultative nitrogen-heterotrophic taxa, needing periodically elevated concentrations of organically bound nitrogen; hce—obligate nitrogen-heterotrophic taxa, needing continuously elevated concentrations of organically bound nitrogen. Trophic state indicators (Van Dam et al., 1994) [31]: (ot—oligotraphentic; om—oligomesotraphentic; m—mesotraphentic; me—mesoeutraphentic; e—eutraphentic; he—hypereutraphentic; o-e—oligo- to eutraphentic (hypereutraphentic)).
References
- Knights, D.; Piliouras, A.; Schwenk, J.; Hariharan, J.; Russoniello, C. Seasonal and morphological controls on nitrate retention in Arctic deltas. Geophys. Res. Lett. 2023, 50, e2022GL102201. [Google Scholar] [CrossRef]
- Jeppesen, E.; Brucet, S.; Naselli-Flores, L.; Papastergiadou, E.; Stefanidis, K.; Nõges, T.; Nõges, P.; Attayde, J.L.; Zohary, T.; Coppens, J.; et al. Ecological impacts of global warming and water abstraction on lakes and reservoirs due to changes in water level and related changes in salinity. Hydrobiologia 2015, 750, 201–227. [Google Scholar] [CrossRef]
- Lugg, A.; Copeland, C. Review of cold water pollution in the Murray–Darling Basin and the impacts on fish communities. Ecol. Manag. Restor. 2014, 15, 71–79. [Google Scholar] [CrossRef]
- Gabyshev, V.A.; Sidelev, S.I.; Chernova, E.N.; Vilnet, A.A.; Davydov, D.A.; Barinova, S.; Gabysheva, O.I.; Zhakovskaya, Z.A.; Voronov, I.V. Year-Round Presence of Microcystins and Toxin-Producing Microcystis in the Water Column and Ice Cover of a Eutrophic Lake Located in the Continuous Permafrost Zone (Yakutia, Russia). Toxins 2023, 15, 467. [Google Scholar] [CrossRef]
- Barinova, S.; Gabyshev, V.; Gabysheva, O. Climate impact of freshwater biodiversity: General patterns in extreme environments of North-Eastern Siberia (Russia). Br. J. Environ. Clim. Change 2014, 4, 423–443. [Google Scholar] [CrossRef]
- Dedić, A.; Gerhardt, A.; Kelly, M.G.; Stanić-Koštroman, S.; Šiljeg, M.; Kalamujić Stroil, B.; Kamberović, J.; Mateljak, Z.; Pešić, V.; Vučković, I.; et al. In-novative methods and approaches for WFD: Ideas to fill knowledge gaps in science and policy. Water Solut. 2020, 3, 30–42. [Google Scholar]
- Barinova, S. On the Classification of Water Quality from an Ecological Point of View. Int. J. Environ. Sci. Nat. Resour. 2017, 2, 1–8. [Google Scholar] [CrossRef]
- Barinova, S. Ecological Mapping in Application to Aquatic Ecosystems BioIndication: Problems and Methods. Int. J. Environ. Sci. Nat. Resour. 2017, 3, 1–7. [Google Scholar] [CrossRef]
- Komarenko, L.E.; Vasilyeva, I.I. Some Data on the Algae of the Anabar River in the Summer: Botanical Materials for Yakutia; Publishing House of the Yakut Branch of the Siberian Branch of the USSR Academy of Sciences: Yakutsk, Russia, 1975; pp. 78–86. (In Russian) [Google Scholar]
- Kirillov, A.F.; Khodulov, V.V.; Sobakina, I.G.; Sokolova, V.A.; Ushnitskaya, L.A.; Ivanov, E.V.; Solomonov, N.M. Biology of the Anabar River; Izdatelstvo YaNTs SB RAS: Yakutsk, Russia, 2007; 224p. (In Russian) [Google Scholar]
- Chistyakov, G.E.; Nogovitsyn, D.D.; Yakushev, M.V.; Konstantinov, A.F. Hydropower Resources of the Anabar River Basin; Nauka: Moscow, Russia, 1971; 122p. (In Russian) [Google Scholar]
- Yagnyshev, B.S.; Yagnysheva, T.A.; Zinchuk, M.N.; Legostaeva, Y.B. Ecology of Western Yakutia (Geochemistry of Geoecosystems: Status and Problems); Izdatelstvo YaNTs SB RAS: Yakutsk, Russia, 2005; 432p. (In Russian) [Google Scholar]
- Gabyshev, V.A.; Gabysheva, O.I. Water quality of the Anabar River indicated by phytoplankton structure and hydrochemical characteristics. Contemp. Probl. Ecol. 2010, 3, 395–400. [Google Scholar] [CrossRef]
- Gabyshev, V.A.; Gabysheva, O.I. Phytoplankton of the Largest Rivers of Yakutia and Adjacent Territories of Eastern Siberia; SibAk: Novosibirsk, Russia, 2018; 414p. (In Russian) [Google Scholar]
- Gabysheva, O.I.; Gabyshev, V.A. The Chemical Composition of the Waters of Large Rivers in the Northeast of Russia and the Components of Aquatic Biota (on the Example of Planktonic Mixotrophs) under Conditions of Seasonal Permafrost Degradation; Izdatelstvo SD RAS: Novosibirsk, Russia, 2023; 121p. (In Russian) [Google Scholar]
- Krupa, E.; Barinova, S.; Romanova, S. Ecological Mapping in Assessing the Impact of Environmental Factors on the Aquatic Ecosystem of the Arys River Basin, South Kazakhstan. Diversity 2019, 11, 239. [Google Scholar] [CrossRef]
- Semenov, A.D. Guidance on the Chemical Analysis of Surface Waters of Land; Gidrometeoizdat: Leningrad, Russia, 1977; 540p. (In Russian) [Google Scholar]
- Shornikova, E.A. Guidelines for Planning, Organizing and Monitoring Surface Watercourses; Hyphen: Surgut, Russia, 2007; 88p. (In Russian) [Google Scholar]
- Ratkovich, D.Y. Actual Problems of Water Supply; Nauka: Moscow, Russia, 2003; 352p. (In Russian) [Google Scholar]
- Guiry, M.D.; Guiry, G.M. AlgaeBase World-Wide Electronic Publication. National University of Ireland, Galway. Available online: http://www.algaebase.org (accessed on 24 June 2019).
- Barinova, S. Essential and practical bioindication methods and systems for the water quality assessment. Int. J. Environ. Sci. Nat. Resour. 2017, 2, 79–89. [Google Scholar] [CrossRef]
- European Commission, Directive 2000/60/EC of the European Parliament and of the Council of 23 October 2000 establishing a framework for Community action in the field of water policy. Off. J. Eur. Communities 2000, L327. Available online: https://www.eea.europa.eu/data-and-maps/indicators/freshwater-quality (accessed on 25 August 2023).
- Barinova, S.S.; Bilous, O.P.; Tsarenko, P.M. Algal Indication of Water Bodies in Ukraine: Methods and Prospects; Publishing House of Haifa University: Haifa, Israel; Kyiv, Ukraine, 2019; 367p. (In Russian) [Google Scholar]
- Love, J.; Selker, R.; Marsman, M.; Jamil, T.; Dropmann, D.; Verhagen, J.A.; Ly, A.; Gronau, F.Q.; Smira, M.; Epskamp, S.; et al. JASP: Graphical statistical software for common statistical designs. J. Stat. Softw. 2019, 88, 1–17. [Google Scholar] [CrossRef]
- McAleece, N.; Gage, J.D.G.; Lambshead, P.J.D.; Paterson, G.L.J. BioDiversity Professional Statistics Analysis Software; Jointly developed by the Scottish Association for Marine Science and the Natural History Museum London; Scottish Association for Marine Science: Oban, UK, 1997. [Google Scholar]
- Ter Braak, C.J.F.; Šmilauer, P. CANOCO Reference Manual and CanoDraw for Windows User’s Guide: Software for Canonical Community Ordination (Version 4.5); Microcomputer Power Press: Ithaca, NY, USA, 2002; 500p. [Google Scholar]
- Venglinsky, D.L.; Tyaptirgyanov, M.M.; Labutina, T.M.; Sokolova, V.A.; Ogai, R.I. Features of the Ecology of Hydrobionts of the Lower Lena; Izdatelstvo YaF SO AN SSSR: Yakutsk, Russia, 1987; 184p. (In Russian) [Google Scholar]
- Hustedt, F. Die Diatomeen flora des Flußsystems der Weser im Gebiet der Hansestadt Bremen. Abh. Naturwissenschaftlichen Ver. Brem. 1957, 34, 181–440. [Google Scholar]
- Watanabe, T.; Asai, K.; Houki, A. Numerical estimation of organic pollution of flowing water by using the epilithic diatom assemblage—Diatom Assemblage Index (DAIpo). Sci. Total Environ. 1986, 55, 209–218. [Google Scholar] [CrossRef]
- Sládeček, V. Diatoms as indicators of organic pollution. Acta Hydrochim. Hydrobiol. 1986, 14, 555–566. [Google Scholar] [CrossRef]
- Van Dam, H.; Mertens, A.; Sinkeldam, J. A coded checklist and ecological indicator values of freshwater diatoms from the Netherlands. Neth. J. Aquat. Ecol. 1994, 28, 117–133. [Google Scholar] [CrossRef]
- Barinova, S.S.; Gabyshev, V.A.; Ivanova, A.P.; Gabysheva, O.I. Bioindication of the water salinity dynamics by the microalgae communities in the Lena River Delta, Laptev Sea, Russian Arctic. Mar. Biol. J. 2021, 6, 15–28. [Google Scholar] [CrossRef]
- Novoselova, T.; Barinova, S.; Protasov, A. Phytoplankton Indicators in the Assessment of the Ecological Status of Two Reservoirs with Different Purposes in Southern Ukraine. Ecologies 2022, 3, 96–119. [Google Scholar] [CrossRef]
- Birk, S.; Bonne, W.; Borja, A.; Brucet, S.; Courrat, A.; Poikane, S.; Solimini, A.; van de Bund, W.; Zampoukas, N.; Hering, D. Three Hundred Ways to Assess Europe’s Surface Waters: An Almost Complete Overview of Biological Methods to Implement the Water Framework Directive. Ecol. Indic. 2012, 18, 31–41. [Google Scholar] [CrossRef]
- Hering, D.; Borja, A.; Jones, J.I.; Pont, D.; Boets, P.; Bouchez, A.; Bruce, K.; Drakare, S.; Hänfling, B.; Kahlert, M.; et al. Implementation options for DNA-based identification into ecological status assessment under the European Water Framework Directive. Water Res. 2018, 138, 192–205. [Google Scholar] [CrossRef] [PubMed]
- Tickner, D.; Opperman, J.J.; Abell, R.; Acreman, M.; Arthington, A.H.; Bunn, S.E.; Cooke, S.J.; Dalton, J.; Darwall, W.; Edwards, G.; et al. Bending the Curve of Global Freshwater Biodiversity Loss: An Emergency Recovery Plan. BioScience 2020, 70, 330–342. [Google Scholar] [CrossRef] [PubMed]
- Moore, J.W. Ecology of algae in a subarctic stream. Can. J. Bot. 2011, 55, 1838–1847. [Google Scholar] [CrossRef]
- Rostekhnadzor. On Approval of the Federal Norms and Rules in the Field of Industrial Safety “Safety Rules for Mining and Processing of Solid Minerals”; Ministry of Justice of Russia: Moscow, Russia, 2020; (In Russian). Available online: https://normativ.kontur.ru/document?moduleId=1&documentId=384179 (accessed on 1 January 2021).
- Burgmer, T.; Hillebrand, H.; Pfenninger, M. Effects of climate-driven temperature changes on the diversity of freshwater macroinvertebrates. Oecologia 2007, 151, 93–103. [Google Scholar] [CrossRef] [PubMed]
- Laker, M.C. Environmental Impacts of Gold Mining—With Special Reference to South Africa. Mining 2023, 3, 205–220. [Google Scholar] [CrossRef]
- Mamyan, A.; Gevorgyan, G. Comparative investigation of the river phytoplankton of the Debed River catchment basin’s mining and non-mining areas. Biol. J. Armen. 2017, 4, 50–55. [Google Scholar]
- Kamboj, V.; Kamboj, N.; Sharma, A.K.; Bisht, A. Phytoplankton communities as bio-indicators of water quality in a mining-affected area of the river Ganga, Haridwar, India. Energ. Ecol. Environ. 2022, 7, 425–438. [Google Scholar] [CrossRef]
- Beck, M.W.; Altieri, A.; Angelini, C.; Burke, M.C.; Chen, J.; Chin, D.W.; Gardiner, J.; Hu, C.; Hubbard, K.A.; Liu, Y.; et al. Initial estuarine response to inorganic nutrient inputs from a legacy mining facility adjacent to Tampa Bay, Florida. Mar. Pollut. Bull. 2022, 178, 113598. [Google Scholar] [CrossRef]
- Pochechun, V.A.; Konovalov, V.E.; Semyachkov, A.I. Basic Procedure to Estimate the Accumulated Environmental Damage Caused by Mining Facilities as Exemplified by the Kachkanar Tailing Dump in the Middle Urals. In Proceedings of the 6th International Conference on Construction, Architecture and Technosphere Safety. ICCATS 2022; Lecture Notes in Civil Engineering; Radionov, A.A., Ulrikh, D.V., Timofeeva, S.S., Alekhin, V.N., Gasiyarov, V.R., Eds.; Springer: Cham, Switzerland, 2022; Volume 308. [Google Scholar] [CrossRef]
- Shchur, L.A.; Bazhina, L.V.; Volkova, N.I.; Trofimova, M.A. Water Quality of Small Rivers in the Zone of Influence of Gold-Mining Facilities in Krasnoyarsk Region. Water Resour. 2003, 30, 72–80. [Google Scholar] [CrossRef]
- Shikhov, A.; Ilyushina, P.; Makarieva, O.; Zemlianskova, A.; Mozgina, M. Satellite-Based Mapping of Gold-Mining-Related Land-Cover Changes in the Magadan Region, Northeast Russia. Remote Sens. 2023, 15, 3564. [Google Scholar] [CrossRef]
- Atici, T. Diatoms of Seydisuyu Stream Basin (Turkey) and Assessment of Water Quality by Statistical and Biological Approaches. Sigma J. Eng. Nat. Sci. 2018, 36, 271–288. [Google Scholar]
- Gerhardt, A.; Janssens de Bisthoven, L.; Soares, A.M.V.M. Macroinvertebrate response to acid mine drainage: Community metrics and on-line behavioural toxicity bioassay. Environ. Pollut. 2004, 130, 263–274. [Google Scholar] [CrossRef] [PubMed]
- Poikane, S.; Herrero, F.S.; Kelly, M.G.; Borja, A.; Birk, S.; van de Bund, W. European aquatic ecological assessment methods: A critical review of their sensitivity to key pressures. Sci. Total Environ. 2020, 740, 140075. [Google Scholar] [CrossRef] [PubMed]
- Reynolds, C.S. The concept of ecological succession applied to seasonal periodicity of freshwater phytoplankton. Verh. Int. Ver. Limnol. 1988, 23, 683–691. [Google Scholar] [CrossRef]
- Gerhardt, A.; Janssens de Bisthoven, L.; Guhr, K.; Soares, A.M.V.M.; Pereira, M.J. Phytoassessment of Acid Mine Drainage: Combining Lemna gibba bioassay and Diatom community structure. Ecotoxicology 2008, 17, 7–58. [Google Scholar] [CrossRef]
- Gerhardt, A. Aquatic Behavioral Ecotoxicology—Prospects and Limitations. Hum. Ecol. Risk Assess. Int. J. 2007, 13, 481–491. [Google Scholar] [CrossRef]
- Kelly, M.; Boonham, N.; Juggins, S.; Kille, P.; Mann, D.; Pass, D.; Sapp, M.; Sato, S.; Glover, R.; Walsh, K. A DNA Based Diatom Metabarcoding Approach for Water Framework Directive Classification of Rivers; Science Report SC140024; Environment Agency: Bristol, UK, 2018; 151p. [Google Scholar]
- Barinova, S.; Gabyshev, V.; Genkal, S.; Gabysheva, O. Diatoms of Small Water Bodies as Bioindicators in the Assessment of Climatic and Anthropogenic Impacts on the Coast of Tiksi Bay, Russian Arctic. Water 2023, 15, 1533. [Google Scholar] [CrossRef]
- Hustedt, F. Systematische und Ökologische Untersuchungen über die Diatomeenflora von Java, Bali und Sumatra; Otto Koeltz Science: Königstein, Germany, 1980; pp. 131–177. [Google Scholar]
Disclaimer/Publisher’s Note: The statements, opinions and data contained in all publications are solely those of the individual author(s) and contributor(s) and not of MDPI and/or the editor(s). MDPI and/or the editor(s) disclaim responsibility for any injury to people or property resulting from any ideas, methods, instructions or products referred to in the content. |
© 2023 by the authors. Licensee MDPI, Basel, Switzerland. This article is an open access article distributed under the terms and conditions of the Creative Commons Attribution (CC BY) license (https://creativecommons.org/licenses/by/4.0/).