Abstract
Landscape ecological risk assessment can reflect the impact of landscape pattern on ecological processes and functions, and has become an important method for predicting and measuring the quality and dynamic evolution of the ecological environment. Studying the trend of landscape ecological risk evolution is important for optimizing the regional landscape pattern and maintaining the sustainable development of the ecological environment in ecologically fragile areas. Ningxia Hui Autonomous Region is a typical agro-pastoral region in northern China, which is facing prominent ecological and environmental problems such as soil erosion and land desertification. With the environmental problems becoming more and more serious, the ecological risk also poses increasing potential danger, which becomes one of the bottlenecks restricting regional economic development. This paper selects Ningxia Hui Autonomous Region as the study area. Based on land use data in 2000, 2005, 2010, and 2015, the landscape ecological risk assessment model is built from the perspective of landscape ecology, and combines the spatial statistical analysis method and the gravity shift model to explore the spatial–temporal evolution of the spatial distribution characteristics of landscape ecological risk. The results showed that: (1) During the study period, the area of farmland and grasslands has decreased, and the area of forest, water, and settlement has increased; (2) The transformation of land-use types is mainly distributed in the central northern plain and the south valley, where human activities are intensive. The transfer relationship among different land-use types is mainly between grasslands and farmland; (3) The hotspots and aggregation area of landscape ecological risk are mainly distributed along the city belt and irrigated agricultural areas along the Yellow River in the northern Ningxia Plain; (4) From 2000 to 2005, the landscape ecological risk level decreased, and from 2005 to 2015, the landscape ecological risk index continued to rise. We conclude that the natural environment of Ningxia determines the characteristics of the spatial distribution of landscape ecological risk, while the use and modification of land through human activities are the main driving factors of landscape ecological risk change. The results of landscape ecological risk assessment at different scales based on the landscape index will provide support for regional environmental management.
1. Introduction
Ecological risk refers to the uncertain impact of events or disasters on the ecosystem and its components, especially on non-human organisms, populations, and ecosystems [1]. Ecological risk assessment is the process of estimating the likelihood that a particular event will occur under a given set of circumstances [2,3], aiming to provide a quantitative basis for balancing and comparing risks associated with environmental problems and a systematic means of improving the estimation and understanding of those risks [4,5]. Ecological risk assessment can clearly define the main ecological factors and processes that restrict regional ecological sustainability. As a basis for understanding and controlling ecological risk [6], coping with the integrated management of social ecosystems has become a research hotspot in the fields of physical geography and macroecology [7,8]. Early research on ecological risk assessment mainly focused on the impact of pollutants such as environmental pollution on the ecosystem and its composition, and the assessment research was mainly carried out at a relatively micro level; with the development of remote sensing and geographic information system, remote sensing technology has become widely used in the field of ecosystem evaluation, including ecological risk assessment [9,10]. At present, ecological risk assessment focuses more on the macro level, mainly including the relative risk assessment method (RRM) [11,12,13], the hierarchical patch dynamic paradigm (HPDP) [14,15], “a procedure for ecological tiered assessment of risks” (PETAR) [16], and other ecological risk assessment models and methods.
In the process of rapid urbanization and land use/cover change, ecological risks come from complex natural processes and human activities, which greatly change the ecosystem structure and service functions [17]. How to measure the ecological risk effect caused by landscape pattern change is an urgent question to be answered. Landscape pattern is the process of the combination and arrangement of patches of different shapes and sizes in the spatial scope, and it is also the result of the interaction of the spatial heterogeneity of landscape elements and their ecological processes [18]. Ecological risk assessment is the basis for judging the adverse effects of human activities, natural disasters, and other disturbances on the function and structure of regional ecosystems, while landscape pattern is the result of many ecological impacts, including external disturbances, acting together at different spatial scales [19]. The study of landscape pattern change and its evolution pattern can reveal the structural characteristics and change patterns of regional ecosystems, which is widely applied in comprehensive regional ecological evaluations. It is widely used in the comprehensive assessment of regional ecology, providing new ideas and new perspectives for the study of regional ecological risk, and it has become an important method for the assessment of regional landscape ecological risk [20,21]. Compared with other ecological risk assessment methods that focus on the comprehensive overlapping of multiple risks, landscape ecological risk assessment places more emphasis on the impact of landscape pattern on ecological processes or functions. The emphasis on scale is an important feature that distinguishes landscape ecological risk assessment from other risk assessment methods. The study of ecological risk based on a multi-scale landscape pattern change perspective can capture the cumulative effects of various potential ecological types and landscapes [22], thus providing a more reliable basis for regional ecological conservation decisions [23].
The agro-pastoral region in northern China is a coupled area of traditional agriculture and animal husbandry which is extremely sensitive to changes and disturbances in the external environment; the regional ecosystem has outstanding vulnerability and sensitivity characteristics [24]. In recent years, with global climate change and regional economic development, regional ecological stability has declined, and regional ecological environment protection and social and economic development are facing severe challenges compared with other regions. The rapid and accurate identification and management of ecologically fragile ecological risk areas such as agro-pastoral region can be realized through landscape ecological risk assessment based on the perspective of land use change [25]. As the highest administrative level to implement the national planning regional development strategy in China, the provincial scale landscape ecological risk assessment study has an important guiding role in national spatial planning at the city and county level. At present, common objects of ecological risk assessment are those more concentrated in single typical ecological areas, such as lakes [26,27], watersheds [28,29,30], and coastal zones [31,32]. However, the smaller scope of assessment units leads to relevant studies often ignoring spatial heterogeneity, i.e., the heterogeneity and complexity of ecological and social spatial patterns in spatial distribution. The elements of the ecosystem are generally connected and interact with each other [33], so more attention should be paid to the integrity and the systematic nature of the ecosystem in relevant research. At present, landscape ecological risk assessment research pays less attention to composite ecosystems with ecosystem vulnerability, and there is a lack of ecological risk assessment and application research in large spatial scale areas. It is difficult for the research results to provide strong support for the adjustment of ecological spatial structure and ecological risk prevention and control at the provincial level.
Ningxia Hui Autonomous Region (hereinafter referred to as “Ningxia”) is located in the arid, semi-arid, and agro-pastoral region of western China. The ecological environment of Ningxia is sensitive and fragile, and economic and social development is highly dependent on resource development. Under the background of the Western development strategy, the quantity and intensity of resource development in Ningxia are increasing, which causes various potential ecological risks. It is urgent to carry out ecological risk assessment in Ningxia, which is rich in ecosystem types complex geomorphic features; the spatial heterogeneity of natural resource endowment conditions and socio-economic development level in Ningxia provide a case basis for assessing and analyzing the spatial differentiation of landscape ecological risks from the perspective of landscape ecology. This paper takes Ningxia as the study area, and takes the land use data of 2000, 2005, 2010, and 2015 as the data source. Based on the assessment model from the perspective of landscape ecology, this paper constructs a multi-functional ecological risk assessment model based on the landscape pattern index to assess the ecological risks in the study area, and uses geographic information system technique to analyze and visually express the dynamic changes of the spatial and temporal patterns of the ecological risk. The research results will provide a theoretical basis for the win-win management decision-making of regional development and ecological protection, provide data support for ecological risk control measures, and have important practical significance for the healthy and sustainable development of regional ecological environments. This study will also provide reference for ecological environmental protection, ecological risk prevention, and the sustainable development of ecosystems in other similar ecologically fragile areas in China.
2. Study Area
Ningxia is located in northwestern China (35°14′ N~39°23′ N, 104°17′ E~107°39′ E), in the middle and upper reaches of the Yellow River, bordering the Inner Mongolia Autonomous Region in the west, north and northeast, Shaanxi Province in the East, and Gansu in the southeast and southwest. The terrain in the study area is high in the south and low in the north. The terrain tilts from south to north, and the landform transits from fluvial landform to wind-erosion landform from south to north. Ningxia’s territory is long and narrow from north to south, with a distance of 450 km from north to south and 250 km from east to west (as shown in Figure 1). The total land area is about 66,400 square kilometers, accounting for about 0.54% of China’s total area. The Ningxia ecosystem is rich in variety and has many important ecological functions, such as windbreak and sand fixation, the maintenance of biological diversity, water and soil conservation, etc. It is the important part of the “Loess Plateau-Sichuan-Yunnan” ecological barrier and the northern sand control belt in China’s “Two-screen and three-belt” ecological security pattern, which ensures the ecological security of the upper and middle reaches of the Yellow River and north and northwest China. The ecological location of Ningxia is very important [34,35,36].
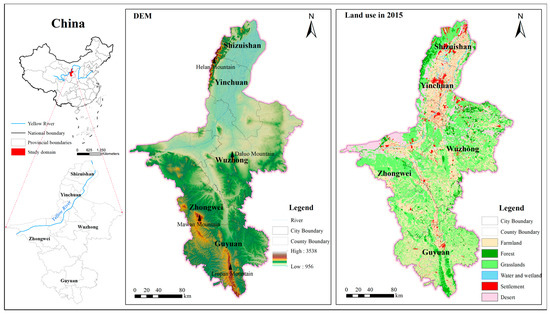
Figure 1.
Geographical location of the study area.
Ningxia is a typical agro-pastoral interlacing region in northern China. The main land use type in Ningxia region is grassland and farmland, of which grasslands are widely distributed in the central hilly area and the southern mountainous area of the study area, and farmland is mainly distributed along the Yellow River, Qingshui River, and Kushui River. It is located in the eastern monsoon region and the northwest arid and semi-arid region, and exists in the transitional zone between desert and grasslands, with an extremely fragile ecological background and poor ecosystem stability. Ningxia provides rare survival resources for the development of farming and nomadic economy in the surrounding areas, which makes the regional social and economic development dependent on the development of resources. On one hand, with the increasing intensity of resource development in Ningxia, various ecological risks such as land desertification and salinization, water and soil loss, and shrinking lake area have emerged, and the fragile ecological environment is a barrier to rapid economic development. On the other hand, with the implementation of regional projects such as returning farmland to forest or grasslands and ecological migration, large-scale human activities are disturbing the natural evolution of regional ecological environment under the influence of socio-economic environment and policy drive.
3. Materials and Methods
3.1. Materials
The land use data used in this paper came from the Resource and Environment Science and Data Center of the Institute of Geographic Sciences and Nature Resources Research (https://www.resdc.cn/ (accessed on 24 June 2021)). The data are generated by manual visual interpretation with Landsat TM/ETM remote sensing images of each period. The spatial resolution of the land use data is 30 × 30 m, and the classification system includes six primary classes and twenty-five secondary classes. It has been verified that the classification accuracy of the primary classes of the data reaches more than 94.3%, which meets the application requirements. This paper selects four periods of land use data in 2000, 2005, 2010, and 2015. According to the ecological environment in the study area and the main research contents of this paper, based on the administrative vector boundary of the study area, the land use data were clipped and reclassified into six types of land use: farmland, forest, grasslands, water and wetland, settlement, and desert.
3.2. Division of Ecological Risk Assessment Unit
The assessment unit is the smallest unit for regional ecological risk assessment, which can objectively reflect the spatial differentiation characteristics of the regional ecological environment. In order to enable the ecological risk index to represent the ecological risk status brought about by landscape changes in a certain area, and to better visualize the degree of ecological risk in a space, according to the basic requirements and principles of landscape ecology for a sample grid area (the area of the sample grid is 2~5 times of the average patch area), and based on the full consideration of the study area and the spatial heterogeneity of the landscape, 3528 ecological risk assessment units were divided into 4 km × 4 km square grid in ArcGIS 10.2 software (ESRI, Redlands, CA, USA) by using the Create Fishnet tool with the equidistant sampling method (as shown in Figure 2). In ArcGIS and Fragstats 4.2 software (McGarigal, K., USA) [37], the landscape ecological risk (LER) assessment model is used to calculate the ecological risk index of each assessment unit, and the ecological risk index was assigned to the central point of each assessment unit. Taking the point data as the interpolation sample data, Kriging spatial interpolation method was used to interpolate the ecological risk in ArcGIS [38,39].
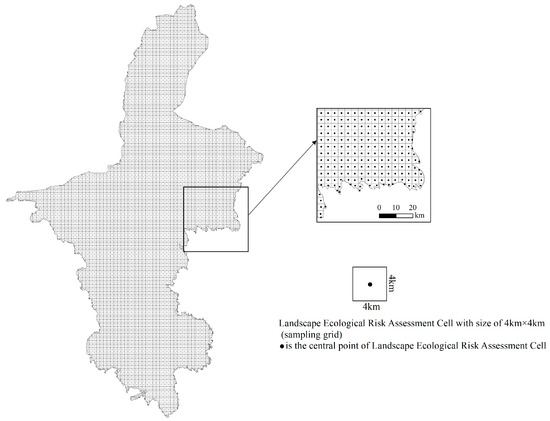
Figure 2.
Division of LER assessment units.
3.3. Methods
In order to study the temporal and spatial variation characteristics of landscape ecological risk in Ningxia, the workflow is as follows (Figure 3). Based on the land use data in 2000, 2005, 2010, and 2015, the land use transfer matrix was used to explore the land use change in Ningxia. A landscape ecological risk assessment model based on the landscape pattern index was constructed to assess the landscape ecological risk in Ningxia at grid scale, county scale, and regional scale. Then, the spatial and temporal distribution and change characteristics in Ningxia were analyzed by using the hotspot analysis method, the spatial autocorrelation method and the geographic gravity center model. Finally, combining the characteristics of land use change and the distribution of land use within each ecological risk level, the possible sources of landscape ecological risk in Ningxia were analyzed from the perspective of landscape ecology.
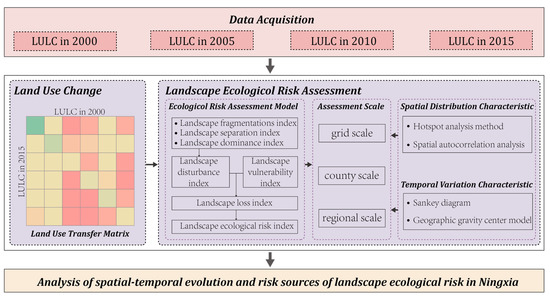
Figure 3.
The workflow of the research.
3.3.1. Land Use Transfer Matrix
The land use transfer matrix can quantitatively show the transformation between different system states at each time. In this paper, it is used to simulate the transfer direction of land use types and ecological risk levels. The calculation formula is as follows:
where is the area; is the area of land type or LER level i transformed into land type or LER level j; n is the number of land use types or LER level, and and represent the land use types or LER level before and after transformation, respectively.
3.3.2. Landscape Ecological Risk Assessment Model
According to the relevant literature [22,40,41,42], this study uses landscape disturbance and landscape vulnerability to build a landscape ecological risk assessment model to calculate the landscape ecological risk index of each assessment unit. The relationship between landscape structure and ecological risk can be established through the landscape ecological risk index, which can quantitatively reflect the correlation between landscape pattern and ecological risk. The spatial structure of the landscape can usually be transformed into spatialized ecological risk variables through resampling methods based on the landscape ecological risk index (LERI). The calculation formula is as follows:
where is the landscape loss index of landscape type ; is the area of landscape type in the LER assessment unit ; is the area of the landscape ecological assessment unit ; is the number of landscape types in the study area; and is the LER index value of the LER assessment unit . The higher the , the higher the ecological risk degree of the corresponding ecological risk assessment unit. The calculation formulas of each landscape index and points of ecological significance are shown in Table 1.

Table 1.
Calculation formula of each landscape index and corresponding ecological significance.
3.3.3. Hotspot Analysis
Hotspot analysis can identify the distribution pattern of coldspots and hotspots of ecological risk in the study area, and reveal the spatial differences of ecological risk in the landscape. Relevant studies show that the statistical method is superior to, and more scientific than, other hotspot mapping methods, as it can classify statistical significances and the connectivity of cold and hotspots. This tool can be used to identify the statistically significant spatial clusters of high (hotspots) and low (coldspots) ecological risk indices [7]. The z-value of each pixel can be calculated using the Getis-Ord Gi* tool in ArcGIS software. The higher (or lower) the z-score, the more intense the clustering. A z-score close to zero indicates no apparent spatial clustering [43,44]. The calculation formula is as follows:
where is the output statistical z-score, is the attribute value of element ; is the spatial weight between elements and , and are the mean value and standard deviation of the corresponding element, respectively, and is the number of elements.
3.3.4. Spatial Autocorrelation Analysis
Spatial autocorrelation analysis refers to the degree of similarity between the values of a spatial variable and those of its neighbors. The aggregation and differentiation characteristics of spatial units and adjacent units can be accurately grasped by using this method [45,46]. In this paper, spatial autocorrelation is used to characterize the correlation degree of ecological risk between ecological risk assessment units and adjacent assessment units. The univariate local Moran’s I and LISA values were calculated in GeoDa 1.18 software (Anselin et al., USA) [47] to reflect the spatial distribution of the landscape ecological risk index in the study area. According to the level of spatial autocorrelation significance of Moran’s I, the study area can be divided into four categories: high-high, low-low, high-low and low-high. The calculation formula is as follows:
where is the number of landscape ecological risk assessment units; and represent the LER value of spatial units and , respectively; represents the space weight matrix. represents the mean of the LER index. The value of I ranges is from −1 to 1. If it is greater than zero, it is a positive correlation, and if it is less than zero, it is a negative correlation. The greater the absolute value, the more obvious the correlation of landscape ecological risk spatial distribution. If the value of I is greater than zero, this indicates a positive correlation, whereas a value less than zero indicates a negative correlation. When the absolute value of I approaches zero, it indicates that the landscape ecological risk index is spatially randomly distributed.
3.3.5. Geographic Gravity Center Model
The geographic center of gravity model is a weighted average of the geometric barycentric coordinates of a group of spatial objects and some corresponding elements, that is, the mean value of the spatial elements, which is the statistical description of the spatial pattern of the elements. It’s used to describe the center of gravity and the change trajectory of the landscape ecological risk level. The calculation formula is as follows:
where is the value of the spatial element, here referring to the landscape ecological risk level; and are the abscissa and ordinate of the geometric center of grid point , respectively; and are the abscissa and ordinate of the gravity center of the landscape ecological risk level, respectively. The Standard Deviation Ellipse (SDE) can also be used to analyze the directional characteristics of the evolution of the landscape ecological risk level. The spatial range of the ellipse can represent the main area of the spatial distribution of the landscape ecological risk level, the center of the ellipse can represent the relative position of the landscape ecological risk level in the two-dimensional space, the direction angle can reflect the main trend direction of the distribution, and the long axis indicates the degree of dispersion of the landscape ecological risk level in the main trend direction. The formulas for calculating the main parameters of SDE can be found in the relevant literature [48] and will not be explained here.
4. Results and Analysis
4.1. Land Use Pattern Changes
It can be seen from Table 2 that from 2000 to 2015, the areas of forest, water, and settlement in the study area increased, and the areas of grasslands, farmland, and desert decreased. The area of settlement increased significantly during the study period. From 2000 to 2015, the area of settlement increased continuously from 0.1300 km2 to 0.2600 km2, an increase of 99.84%. The area of forest also increased significantly, from 3100 km2 in 2000 to 3600 km2 in 2015, an increase of 16.00%. The area of water increased slightly, with an increase of 5.17%. The area of farmland first decreased and then increased; from 2000 to 2005, the area of farmland decreased to at least 22,500 km2. Although the area of farmland increased later, it still decreased by 3.61% compared to the beginning of the study period. Contrary to the change trend of farmland area, the area of grasslands and desert increased first and then decreased. On the whole, the area of grasslands and desert decreased by 1.98% and 5.91%.
Table 2.
Area and proportion of land use in Ningxia from 2000 to 2015 (10 thousand km2, %).
The transfer direction of land use type is shown in Figure 4 and Table 3. The transformation of land use types is mainly distributed in the central Northern Plain and the South Valley, where human activities are intensive. The transformation is mainly between grasslands and farmland. In terms of the relationship between land use types transferred in and out, the reduced grasslands are mainly transformed into farmland (1431.67 km2), mainly distributed in the plain areas in Hongsibao District and Zhongning County in the central of Ningxia and the mountainous areas in Shapotou District, Haiyuan County, and Xiji County in the west of Ningxia. The reduced farmland was mainly converted into grasslands (1607.40 km2) and settlement (722.16 km2), of which the grasslands transferred from farmland are mainly distributed in Hongsibao District in the central of Ningxia and Yanchi County and Lingwu County bordering with the Inner Mongolia Autonomous Region in the east of Ningxia, and the settlement transferred from farmland is mainly concentrated in the Jinfeng District of Yinchuan City and Dawukou District of Shizuishan City in northern Ningxia. The reduced desert was mainly transformed into grasslands (433.56 km2) and farmland (371.75 km2), of which the grasslands were mainly distributed in Lingwu County and and Yanchi County of Wuzhong City in western Ningxia and Pingluo City of Shizuishan City in northern Ningxia; farmland was mainly distributed in Shapotou District and Hongsibao District in central Ningxia. Since the areas of settlement, forest land, and water are relatively small, the direction of their transfer out and in is not described in detail here. In 2015, the new settlement, forest, and water were all from grasslands and farmland, of which the new settlement was mainly distributed in the plain area in north central Ningxia, especially in Yinchuan City and Shizuishan City. The new forest was mainly distributed in Tongxin County in the border between southern Ningxia and Gansu Province. The new water was mainly distributed in the tributaries of Yellow River in northern Ningxia, located in Yinchuan City and Shizuishan City.
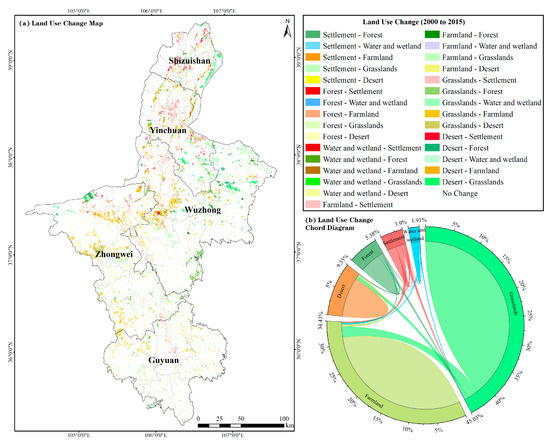
Figure 4.
Spatial distribution map and chord map of land use change in Ningxia from 2000 to 2015.
Table 3.
Land use transfer matrix in Ningxia from 2000 to 2015 (unit: km2).
4.2. Landscape Pattern Index
According to Formulas (3)~(7), the landscape pattern indices of each landscape type in Ningxia in 2000, 2005, 2010, and 2015 were calculated based on Fragstats, ArcGIS, and Excel 2016 (Microsoft, Redmond, WA, USA). The results are shown in Figure 5.
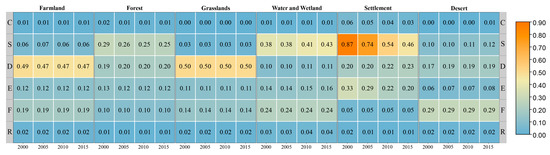
Figure 5.
Heat map of landscape pattern index of each landscape type in Ningxia from 2000 to 2015.
For grasslands, which are the main landscape type in the study area, the change trend of patch number and landscape area changed in opposite trends throughout the study period. Therefore, from 2000 to 2005, the degree of grasslands fragmentation and landscape separation decreased. From 2005 to 2015, with the continuous reduction of grasslands area and the increase of the number of grasslands patches, the degree of grasslands fragmentation and landscape separation index increased. The landscape disturbance index of grasslands also increased. During the study period, the patch number and landscape area of farmland decreased initially, followed by an increase. Compared with other ecological land such as forest, grasslands, and water, the formation and change of the farmland spatial pattern are more vulnerable to human activities. Therefore, the spatial distribution of the farmland landscape is more concentrated and the landscape disturbance index continues to decrease, that is, the degree of loss after disturbance gradually decreases.
The landscape area and patch number of forest, water and wetland, and settlement all increased. Since the growth of settlement tends to spread outward around central urban areas, even if the patch number of settlement increases in the process of urban expansion, the patch area of the central urban area is relatively concentrated. So, the landscape fragmentation index and landscape separation index of settlement are significantly less, and the landscape disturbance index is also reduced. Although the change of landscape area and patch number of water is the same as that of settlement, the increase of patch number is more significant than that of landscape area. Therefore, the landscape fragmentation index of water has deepened, the landscape separation index has intensified, and the landscape loss index has continued to grow. The forest land expanded rapidly from 2000 to 2010. The growth rate of landscape area was faster than the patch number, so the landscape fragmentation index and landscape separation index of forest land decreased in this period. Additionally, the change of landscape area of forest land nearly stopped from 2010 to 2015; in contrast, the patch number increased significantly. Therefore, the landscape fragmentation index and landscape separation index of the forest area rose slightly, and the landscape disturbance index also increased.
Since the landscape vulnerability index is obtained by using the expert scoring method, the landscape vulnerability index of various land use types is a constant. In the mathematical expression, the landscape loss degree is the product of the landscape disturbance index and landscape vulnerability index. So, the relative magnitude of the landscape loss index among various land use types is basically the same as the landscape vulnerability index, that is, the landscape loss index of desert is the largest, while the landscape loss index of settlement is the smallest, and its change trend is consistent with the landscape disturbance index.
4.3. Temporal and Spatial Variation of Landscape Ecological Risk
4.3.1. Spatial Distribution Characteristics of Landscape Ecological Risk
Based on the result of the landscape multifunctional index of each landscape type, the LERI of each landscape ecological risk assessment unit in the study area can be calculated using Formula (2). In ArcGIS 10.2 software, the Hot Spot Analysis tool (Getis-Ord Gi*) was used to calculate the hot maps of LERI at the grid scale. Figure 6 shows the detailed spatial distribution of hotspots and coldspots of LERI in the study area at the grid scale, in which hotspots represent the high-value and high-value gathering areas of LERI, and coldspots represent the low-value and low-value gathering areas of LERI. From the results, it can be seen that most of the areas (69.76%) in the study area in 2015 belonged to not significant areas, and a total of 7.75% of the areas belonged to highly significant hotspot areas, mainly in the Ningxia plain in northeastern Ningxia; 4.54% of the areas belonged to highly significant coldspot areas, mainly in the ridge area of Helan Mountain in the border between northwestern Ningxia and Inner Mongolia and a few areas in southern Ningxia. During the study period, the hot and cold areas of the LERI at the grid scale in the study area decreased significantly. The hotspot area mainly shrinks along the main stream of the Yellow River, while the coldspot area decrease is still distributed in the high-altitude areas in northern and southern Ningxia.
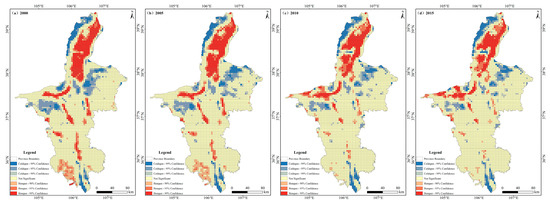
Figure 6.
Hotspot map of LERI in Ningxia from 2000 to 2015.
4.3.2. Spatial Autocorrelation of Ecological Risk
The assessment results of LER units in Ningxia were processed in GeoDa 1.18 using the univariate local Moran’s I tool to discern LER aggregation patterns in Ningxia. As shown in Figure 7, the global Moran’s I for 2000, 2005, 2010, and 2015 were 0.653252, 0.632229, 0.575585, and 0.551034. During the study period, the global Moran’s I of LERI are all greater than 0 and the number of points in quadrants 1 and 3 is significantly greater than that in quadrant 2 and 4. This indicates that the number of grids with “high-high” and “low-low” LER aggregation characteristics is higher than that of “low-high” and “high-low” grids, which means that the LERI is spatially positively correlated and there is a certain spatial aggregation. Furthermore, the aggregation characteristic of LERI at the grid scale in Ningxia gradually decreases from 2000 to 2015.
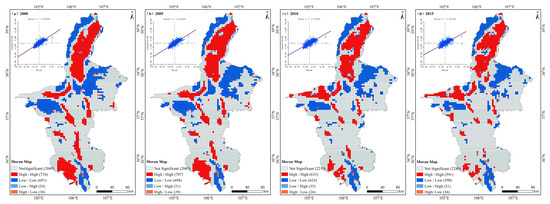
Figure 7.
Moran scatter plot map and LISA aggregation map of LER in Ningxia from 2000 to 2015.
It can also be seen from the LISA aggregation map that the analysis result of global Moran’s I is basically consistent with the hotspot analysis result. The “high-high” aggregation area is mainly distributed along the main stream of the Yellow River and its main tributaries in Yinchuan City and Shizuishan City in northern Ningxia, and the area covered by the Hulu River (a tributary of the Weihe River in Xiji County) in southern Ningxia, which is mostly the plain area topographically. The “low-low” aggregation area is mainly distributed in the Helan Mountain Range in the northwest of Ningxia and the border with Inner Mongolia Autonomous Region, and the ridge area of Liupan Mountain in Jingyuan County in southern Ningxia, which is the mountainous high-altitude area topographically.
On the whole, the number of positive correlation grids passing the significance test (p > 0.01) is decreasing. The spatial aggregation characteristics of LER in Ningxia are weakening, and the aggregation structure characteristics tend to be flat rather than three-dimensional.
4.3.3. Landscape Ecological Risk Level and Spatial Transfer
- (1)
- Assessment result of LERI
Figure 8 shows the assessment results of LER units in Ningxia from 2000 to 2015. It shows that the high value areas of LER on the grid scale are mainly concentrated in the northern part of Ningxia, mainly around the main stream of the Yellow River and its main tributary (Qingshui River) longitudinally, showing obvious linear distribution characteristics in space. The areas with low values of LERI do not have obvious spatial shape characteristics and are widely distributed in the central and southern parts of the study area.
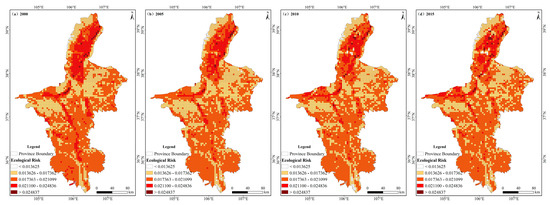
Figure 8.
The assessment results of LER units in Ningxia from 2000 to 2015.
The assessment results of LERI on the grid scale are interpolated by using the Kriging interpolation tool of ArcGIS 10.2 software, and the grid zoning statistical tool of ArcGIS 10.2 software is used to calculate the average value of LERI of each county, city, or district. As shown in Figure 9, the landscape ecological risk indices of cities and counties in the central and southeastern Ningxia region are relatively low, specifically including Dawukou District, Shapotou District, Zhongning County, Hongshibao District, Lingwu City, Yanchi County, Jinyuan County, Yuanzhou District, and Pengyang County; meanwhile, the landscape ecological risk indices of several cities and counties in the north are relatively high, including Yongning County, Jinfeng District, Xingqing District, Helan County, and Pingluo County.
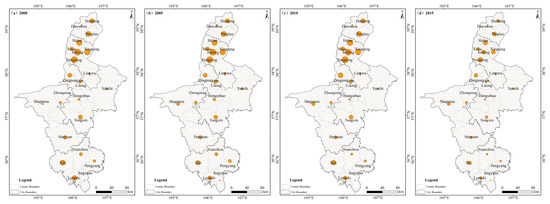
Figure 9.
LERI on the county scale in Ningxia from 2000 to 2015.
- (2)
- LER level transfer analysis
In ArcGIS 10.2 software, the interpolation result of LERI were classified according to the equal interval classification method using the reclassification tool, and were divided into the following five levels: lowest LER area (<0.0153394), lower LER area (0.0153394~0.0179685), medium LER area (0.0179685~0.0205975), higher LER area (0.0205975~0.0232265) and highest LER area (>0.0232265). The area and spatial distribution of each LER level in Ningxia from 2000 to 2015 are shown in Figure 10 and Table 4. The high LER level areas (higher and the highest) are the main areas of concern in this study, and are mainly distributed in northern Ningxia, with the highest LER level areas distributed in northwestern Ningxia, bordering Inner Mongolia.
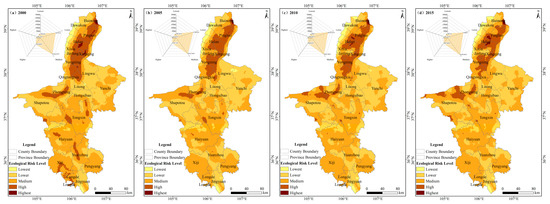
Figure 10.
LER level in Ningxia from 2000 to 2015.
Table 4.
Area and proportion of each landscape ecological risk level in Ningxia from 2000 to 2015 (unit:km2 %).
The study period can be divided into two phases according to the spatial distribution and area change of each LER level. From 2000 to 2005, the overall landscape ecological risk level of the study area markedly weakened, and the areas of higher and highest LER levels decreased significantly. In 2005 in particular, the area covered by the highest LER level only accounted for 0.9% of the total study area. The area covered by LER levels increased, and the area covered by higher landscape ecological risk levels in the southern part of the study area almost disappeared, while the area of lower LER levels increased, and the coverage area of higher LER levels in the south of the study area almost disappeared. From 2005 to 2015, the overall LER level in the study area rebounded, with the medium LER, higher LER, and highest LER areas maintaining increasing trends of change. On the whole, the areas of the highest and higher LER levels in the study area in 2015 had decreased compared to 2000. However, there is a trend of change, in that the areas of highest and higher LER levels in the study area have grown and will continue to increase in coming years.
A Sankey diagram is a kind of visual diagram to illustrate flow direction and the flow of elements. It can clarify quantitative information such as flow, flow direction, and the transfer relationship of different elements in a system. Its most obvious feature is that the sum of the branch widths of each element at the beginning and end is equal [49]. In this paper, a Sankey diagram is used to represent the characteristics and transfer direction of LER level at the grid scale in Ningxia from 2000 to 2015.
Figure 11 reflects the transfer characteristics of the LER level in the study area. In terms of the outflow direction, 62.24% and 0.17% of the areas in the highest LER level were converted to higher LER and medium LER levels, respectively. Totals of 11.45%, 42.65%, and 2.91% of the areas in the higher LER level were converted to the highest, medium, and lower LER levels, respectively, which meant that the higher LER level mainly converted to the medium LER level. Totals of 4.40% and 17.15 of the areas in the medium LER level were converted to the higher and lower landscape ecological index level, respectively, and 18.04% and 1.38% of the areas in the lower LER level were converted to the medium and lowest LER level, respectively. The outflow direction of the lowest LER level is relatively single, and only 10.15% of the areas were converted to the lower LER level. In terms of the inflow direction, more than half (53.12%) of the areas in the highest LER level in 2015 were converted from the higher LER level. A total of 3.49% of the areas in the higher LER level are converted from the highest LER level (3.17%) and the medium LER level (0.32%), and it can be said that the LER characteristics of the areas in the medium level are more stable. A total of 24.20% of the areas in the medium LER level are converted from the higher LER level (11.41%) and the lower LER level (12.78%). The added lower LER level areas are mainly converted from the medium LER level, accounting for 22.18%. A total of 26.85% of the area in the added lowest LER level was converted from the medium LER level.
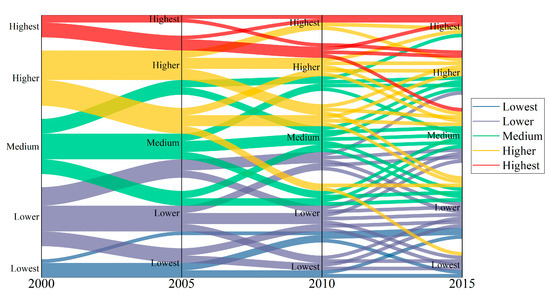
Figure 11.
Sankey diagram of LER level change in Ningxia from 2000 to 2015.
Overall, the landscape ecological risk level mainly shifted from the highest LER level to the higher LER level and from the higher LER level to the medium LER level from 2000 to 2005. Although some LER levels also convert to higher levels, the main transfer direction of each LER level is from “high” to “low” in the same level. From 2005 to 2015, the direction of LER level shift was from “low” to “high”. From the cross sections of 2015, it can be seen that the main sources of new additions to the highest LER level are the higher risk level and some medium LER level. Similarly, the new addition of the higher LER level originates from the medium LER level. The area change of the lower LER level and the lowest LER level is relatively stable, mainly transferring and flowing within their adjacent landscape ecological risk levels.
- (3)
- Shift of gravity center of LER level
In order to analyze the spatiotemporal changes of LER levels in Ningxia, the gravity center shift model was used to calculate the spatial location and spatial move of the gravity center of each landscape ecological risk level in each year, and the results are shown in Table 5 and Figure 12. For the lowest LER level, its gravity center shifted an average distance of 79.02 km, wherein the gravity center shifted 113.56 km to the south from 2000 to 2005, followed by a continuous shift of the gravity center northward from 2005 to 2010 and from 2010 to 2015, with a shift distance of 88.52 km and 34.97 km, respectively. For the lower LER level, its gravity center shifted an average distance of 13.50 km, wherein the gravity center shifted most significantly from 2000 to 2005, moving a total of 26.78 km to the south, and then the position of gravity center did not change significantly. For the medium LER level, the location of its gravity center continues to shift northward, with an average shift distance of 15.81 km. For the higher LER level, its gravity center shifted an average distance of 51.95 km, and the gravity center of the higher LER level shifted significantly, spatially, with the overall shift to the north and the trend to the west. The gravity center finally shifted from Haiyuan County in central and southern Ningxia to Qingtongxia County in northwest Ningxia. The gravity center of the highest LER level is concentrated in the northern Ningxia, and the average distance of the gravity center shift is 32.25 km.
Table 5.
Gravity center coordinates of different landscape ecological levels in Ningxia from 2000 to 2015 (Unit: km).
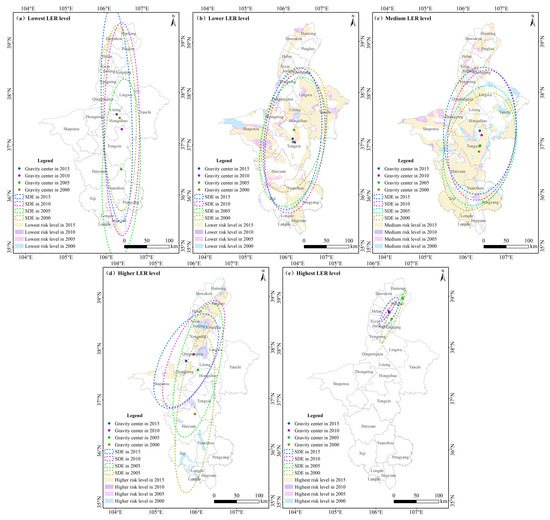
Figure 12.
Standard deviation ellipse and gravity center of different LER levels in Ningxia from 2000 to 2015.
On the whole, in addition to the highest LER level, the gravity center of other landscape ecological risk levels is located in central Ningxia. The gravity centers of the medium LER level and the higher LER level move from south to north, and the gravity centers of the lowest LER level and the lower LER level move south, then north. The gravity center of the highest LER level is located in northern Ningxia, and its moving direction is north then south.
4.4. Analysis of Landscape Ecological Risk Sources
Generally, the sources of regional LER mainly include the ecological background and the use and transformation of land as a result of human social development. The fragile ecological foundation determines that Ningxia has potential ecological risks, while the change of regional land use types under the influence of human production and life over a short period of time is a direct source of ecological risk. Land use is a comprehensive reflection of natural conditions and human activities. It can be used to analyze the source and spatiotemporal variation of LER.
Based on the proportion of ecosystem types in each LER level, the contribution of ecosystem types to LER was analyzed. As can be seen from Figure 13, during the change of LER level from low to high, the main ecosystem types in each landscape ecosystem risk level change from natural ecosystem to semi-natural ecosystem. Taking 2000 as an example, forest (48.76%) and grasslands (48.34%) were the main ecosystem types in the lowest LER level. In the lower landscape ecological risk level, grasslands (65.10%) were the main ecosystem type, while the proportion of forest decreased significantly. In the middle LER level, grasslands (42.96%) account for the same proportion as farmland (42.57%), that is, natural ecosystems and semi-natural ecosystems are dominant. Meanwhile, in the higher LER level and the highest LER level, the farmland of the semi-natural ecosystem is the main LER source of the corresponding LER level, accounting for 73.71% and 71.85%, respectively.
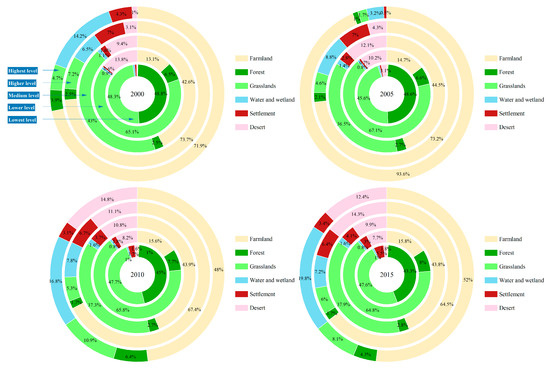
Figure 13.
Ring diagram of LER contribution of each land use type in Ningxia from 2000 to 2015.
From 2000 to 2015, the area proportion of forest and grasslands in each LER level remained basically unchanged each year, while farmland was still the main risk source of each LER level. For other ecosystem types, desert was mainly distributed in the lower and medium ecological landscape risk levels in 2000, and then the area proportion gradually expanded in the higher and highest LER levels, becoming one of the main sources of LER in Ningxia. In contrast to desert, the area proportion of settlement in the higher and highest LER levels decreased, and the area proportion in the medium LER level, lower LER level, and lowest LER level increased. As the second largest source of LER in the highest landscape ecological risk level, the area proportion of water in the highest LER level continues to grow.
5. Discussion
5.1. Spatial–Temporal Evolution Analysis
According to the LER grading results, the regions with the highest LER level are mainly concentrated in the urban belt and irrigated agricultural areas along the Yellow River in the north of Ningxia, which is surrounded by the Ulan Buh Desert, the Tengger Desert and the Mu Us Desert. There are obvious climate differences among northern, central, and southern Ningxia, including the temperate semi humid region in the south, the temperate semi-arid region in the middle, and the temperate arid region in the north. The climate characteristics of Ningxia being cold in the south and warm in the north, and wet in the south and dry in the north leads to great differences in hydrothermal conditions between the north and the south. Moreover, 83% of the groundwater in Ningxia is concentrated in the Yinchuan Plain in northern Ningxia, with only 17% in the central and southern mountainous areas, which account for 85% of the total area of Ningxia. Therefore, the natural geographical characteristics, climate and environmental characteristics, zonal differences in vegetation distribution, and uneven spatial distribution of water resources in Ningxia lead to various human activities mainly concentrated in northern Ningxia, resulting in high ecological risks in northern Ningxia compared with other regions.
According to the spatial distribution characteristics of land use type change, it can be found that the regions of ecosystem type change and the regions of high landscape ecological risk level are highly coincident. Since the region is the main flow area of the Yellow River, which brings abundant water resources to the semi-arid deserts, the geographical concentration of the population in the north is much higher than in other regions. People in this area have developed irrigated agriculture based on abundant water resources. According to the Ningxia water resources bulletin, the Ningxia statistical yearbook, and other relevant data, Ningxia’s agricultural irrigation water intake accounts for more than 90% of the annual water intake, and the water consumption per 10,000 yuan of GDP is much higher than the national average. Therefore, the unreasonable utilization structure of water resources and the inefficiency of water resource development pose serious threats to the ecological stability of northern Ningxia, which is also the main force causing ecological risks.
Since 2000, the urbanization process in Ningxia has been accelerating. In the process of outwardly expanding urban construction, adjacent farmland is affected by the development of land, and farmland areas have decreased. As the main landscape ecological risk source of high landscape ecological risk level, the decrease of farmland area has caused the overall decline of the landscape ecological risk level in Ningxia. In 2008, China put forward the concept of permanent basic farmland and proposed the implementation of the permanent protection of basic farmland. Therefore, areas of farmland continued to rise after 2005. Subsequently, due to the increasing intensity of land development and construction activities such as mineral resource development and urban construction in north Ningxia bordering with Inner Mongolia and Shaanxi, mineral resource development activities have intensified, which has had a prominent impact on the fragile ecological environment, resulting in the increase of soil water erosion and land desertification. Meanwhile, in the process of urban development and construction, Ningxia has continuously strengthened ecological protection and restoration, and carried out ecological restoration projects such as afforestation, returning farmland to forest, mountain closure and grazing prohibition, natural forest protection, and ecological migration. Therefore, the forest been effectively protected and the area has continued to grow. However, due to the small coverage of forest in the study area, the LER level of Ningxia increased as a whole under the background of grasslands degradation.
5.2. Innovation and Limitation
At present, research on landscape ecological risk assessment is mainly conducted on geographical units, such as a single ecosystem type or at municipal and county spatial scales, while there are fewer studies on landscape ecological risk assessment for composite ecosystems and provincial scales. Research on landscape ecological risk assessment within a single ecosystem type or small region does not allow for the full benefit of a landscape ecological risk model in a heterogeneous landscape. Compared with other studies, this paper comprehensively analyzes the transformation characteristics and change trends of ecosystem distribution in Ningxia on different spatial scales. Additionally, based on the calculation and grading of LERI, the flow direction and flow distribution of each LER level in the study area is visualized with a Sankey diagram, and the main sources of LER are analyzed based on the spatial and temporal changes of land use pattern. The results of this study will provide a decision basis for the ecological environmental protection, ecological risk prevention, and ecological spatial pattern optimization in Ningxia, which will help to promote the construction of ecological civilization and effectively contribute to the sustainable socio-economic development of Ningxia. At the same time, this study, based on the application of an ecological landscape risk assessment model in typical ecologically vulnerable areas in China, will play an important guiding role in regional rational development and ecological protection, and will provide a reference for the study of landscape ecological risk assessment in other ecologically vulnerable areas in northwest China.
However, this paper has some limitations. The analysis and diagnosis of LER sources based only upon the changes of land use in the study area may be subjective to a certain extent, and cannot reflect the mechanism of human activities on ecological risk changes. Future research may therefore require the selection of specific indicators based on the characteristics of regional environmental and industrial structures to analyze the driving factors of LER and to quantify the influence of human and natural factors on regional LER in combination with GeoDetector [50] and other models, so as to provide a framework for the prevention and management of regional landscape ecological risk. At the same time, as the regional ecological environment changes and the social economy develops, the relevant elements are in a state of dynamic change. In recent years, the FLUS model [51], PLUS model [52], and other models that can be used to explore the driving factors of land expansion and to predict the patch level evolution of land use have become more mature and widely used. Therefore, the dynamic modeling of regional landscape structure and landscape ecological risk through the modeling of future land use change scenarios to effectively prevent and avoid regional ecological risk is an important area of landscape ecological risk assessment.
6. Conclusions
Based on the four periods of land use data in 2000, 2005, 2010, and 2015, this paper constructs a LER model based on the landscape index to quantitatively assess and analyze the landscape ecological risk level of Ningxia from the grid scale, county scale, and regional scale. Based on the assessment results, the flow direction and temporal change characteristics of regional internal landscape ecological risk level are revealed. Finally, combined with the transfer characteristic of land use and the regional ecological foundation of Ningxia, the reasons for the temporal and spatial evolution of LER are explained. The results show that:
- (1)
- During the study period, the areas of forest and settlement continued to increase, while the areas of farmland and grasslands decreased as a whole. The transfer relationship among different land use types is mainly between grasslands and farmland, and the change areas of land use types are mainly concentrated in the Yellow River irrigation area in northern Ningxia. The landscape fragmentation index and landscape disturbance index of grasslands and water increased, while the landscape fragmentation index and the landscape disturbance index of farmland, forest land, and settlement decreased.
- (2)
- There is a significant spatial aggregation of LER. The hotspot area and the “high-high” aggregation area are mainly distributed along the main stream of the Yellow River in central and western Ningxia, and the plain area in northern Ningxia. The coldspot area and “low-low” aggregation area are mainly distributed in the mountainous areas in the north and south of Ningxia.
- (3)
- The high-value areas of LERI are mainly concentrated in northern Ningxia, including Yongning County, Jinfeng District, Xingqing District, Helan County, and Pingluo County. The low-value areas of LERI are mainly in central and southern Ningxia, including Dawukou District, Shapotou District, Zhongning County, Hongshibao District, Lingwu City, Yanchi County, Jinyuan County, Yuanzhou District, and Panyang County.
- (4)
- On the whole, the LER in the study area has increased. From 2000 to 2005, the transfer direction of LER level was from “high” to “low”. From 2005 to 2015, the transfer direction of landscape ecological risk level was from “low” to “high”. The area of natural ecosystem accounts for a large proportion of the relatively low LER level, and the area of artificial ecosystem and semi natural ecosystem accounts for a large proportion in the relatively high LER level. The LER in the study area mainly comes from farmland, water, and settlement.
Author Contributions
Conceptualization, H.L.; Data curation, H.L. and L.S.; Formal analysis, H.L. and L.S.; Funding acquisition, H.H.; Investigation, H.L. and L.S.; Methodology, H.L.; Project administration, H.H.; Resources, H.L., L.S. and T.Z.; Software, H.L.; Supervision, H.H. and L.S.; Validation, L.S.; Visualization, H.L. and L.S.; Writing—original draft, H.L., L.S. and T.Z.; Writing—review and editing, H.H. All authors have read and agreed to the published version of the manuscript.
Funding
This research was funded by National Natural Science Foundation of China, grant number 41871196.
Data Availability Statement
The data used to support the findings of this study are available from the corresponding author upon request.
Conflicts of Interest
The authors declare no conflict of interest.
References
- United States Environmental Protection Agency. Framework for Ecological Risk Assessment; United States Environmental Protection Agency: Washington, DC, USA, 1992.
- Maltby, L.; Blake, N.; Brock, T.C.M.; van den Brink, P.J. Insecticide species sensitivity distributions: The importance of test species selection and relevance to aquatic ecosystems. Environ. Toxicol. Chem. 2005, 24, 379–388. [Google Scholar] [CrossRef] [PubMed]
- Domene, X.; Ramirez, W.; Mattana, S.; Alcaniz, J.M.; Andrés, P. Ecological risk assessment of organic waste amendments using the species sensitivity distribution from a soil organisms test battery. Environ. Pollut. 2008, 155, 227–236. [Google Scholar] [CrossRef] [PubMed]
- Graham, R.L.; Hunsaker, C.T.; O’neill, R.V.; Jackson, B.L. Ecological Risk Assessment at The Regional Scale: Ecological Archives A005-001. Ecol. Appl. 1991, 1, 196–206. [Google Scholar] [CrossRef]
- Chen, S.; Chen, B.; Fath, B. Ecological risk assessment on the system scale: A review of state-of-the-art models and future perspectives. Ecol. Model. 2013, 250, 25–33. [Google Scholar] [CrossRef]
- Peng, J.; Dang, W.X.; Liu, Y.X.; Zong, M.L.; Hu, X.X. Review on landscape ecological assessment. Acta Geogr. Sin. 2015, 70, 664–677. [Google Scholar]
- Suter, G.; Norton, S.; Barnthouse, L. The evolution of frameworks for ecological risk assessment from the Red Book ancestor. Hum. Ecol. Risk Assess. 2003, 9, 1349–1360. [Google Scholar] [CrossRef]
- Yang, W.R.; Wang, R.S.; Huang, J.L.; Li, F.; Chen, Z. Ecological risk assessment and its research progress. Chin. J. Appl. Ecol. 2007, 18, 1869–1876. [Google Scholar]
- Sun, G.S.; Su, W.Z.; Wan, R.R. Research progress on ecological risk assessment. Chin. J. Ecol. 2009, 28, 335–341. [Google Scholar]
- Chen, H.; Liu, J.S.; Cao, Y.; Li, S.C.; Ouyang, H. Progress of ecological risk assessment. Acta Ecol. Sin. 2006, 26, 1558–1566. [Google Scholar]
- Landis, W.; Wiegers, J. Ten years of the relative risk model and regional scale ecological risk assessment. Hum. Ecol. Risk Assess. 2007, 13, 25–38. [Google Scholar] [CrossRef]
- Landis, W. The origin, development, application, lessons learned, and future regarding the Bayesian network relative risk model for ecological risk assessment. Integr. Environ. Assess. Manag. 2021, 17, 79–94. [Google Scholar] [CrossRef] [PubMed]
- Chen, Q.Y.; Liu, J.L.; Ho, K.C.; Yang, Z.F. Development of a relative risk model for evaluating ecological risk of water environment in the Haihe River Basin estuary area. Sci. Total Environ. 2012, 420, 79–89. [Google Scholar] [CrossRef] [PubMed]
- Landis, W. The frontiers in ecological risk assessment at expanding spatial and temporal scales. Hum. Ecol. Risk Assess. 2003, 9, 1415–1424. [Google Scholar] [CrossRef]
- Wu, J.; Loucks, O. From balance of nature to hierarchical patch dynamics: A paradigm shift in ecology. Q. Rev. Biol. 1995, 70, 439–466. [Google Scholar] [CrossRef]
- Moares, R.; Molander, S. A procedure for ecological tiered assessment of risks (PETAR). Hum. Ecol. Risk Assess. 2004, 10, 349–371. [Google Scholar] [CrossRef]
- Cao, Q.W.; Zhang, X.W.; Ma, H.K.; Wu, J.S. Review of landscape ecological risk and an assessment framework based on ecological services: ESRISK. Acta Geogr. Sin. 2018, 73, 843–855. [Google Scholar]
- Zhao, Y.; Luo, Z.J.; Li, Y.T.; Guo, J.Y.; Lai, X.H.; Song, J. Study of the spatial-temporal variation of landscape ecological risk in the upper reaches of the Ganjiang River Basin based on the “production-living-ecological space”. Acta Ecol. Sin. 2019, 39, 4676–4686. [Google Scholar]
- Xie, X.P.; Chen, Z.C.; Wang, F.; Bai, M.W.; Xu, W.Y. Ecological risk assessment of Taihu Lake basin based on landscape pattern. Chin. J. Appl. Ecol. 2017, 28, 3369–3377. [Google Scholar]
- Focks, A.; ter Horst, M.; van den Berg, E.; Baveco, H.; van den Brink, P.J. Integrating chemical fate and population-level effect models for pesticides at landscape scale: New options for risk assessment. Ecol. Model. 2014, 280, 102–116. [Google Scholar] [CrossRef]
- Zhang, W.Q.; Shan, B.Q.; Li, J.; Tang, W.Z.; Jin, X.; Zhang, H.; Ding, Y.K.; Wang, Y.Y.; Zhu, X.L. Characteristics, distribution and ecological risk assessment of phosphorus in surface sediments from different ecosystems in eastern China: A 31P-nuclear magnetic resonance study. Ecol. Eng. 2015, 75, 264–271. [Google Scholar] [CrossRef]
- Zeng, H.; Liu, G.J. Analysis of regional ecological risk based on landscape structure. China Environ. Sci. 1999, 19, 454–457. [Google Scholar]
- Johnston, G.A. Geographical information systems for cumulative impact assessment. Photogramm. Eng. Remote Sens. 1988, 34, 1909–1915. [Google Scholar]
- Li, W.L.; Shi, Y.Z.; Lu, D.M.; Liu, Q.; Wu, T.H. The spatio-temporal evolution of drought vulnerability in the ecotone between agriculture and animal husbandry in the north of China. Nat. Resour. J. 2018, 33, 1599–1612. [Google Scholar]
- Liu, M.Z.; Wang, Y.F.; Pei, H.W. Landscape ecological risk assessment in Bashang Area of Hebei Province based on Land Use change. Bull. Soil Water Conserv. 2020, 40, 303–312. [Google Scholar]
- Xie, H.; Wang, P.; Huang, H. Ecological risk assessment of land use change in the Poyang Lake eco-economic zone, China. Int. J. Environ. Res. Public Health 2013, 10, 328–346. [Google Scholar] [CrossRef] [PubMed]
- Xu, X.B.; Yang, G.S.; Tan, Y.; Zhuang, Q.L.; Li, H.P.; Wan, R.R.; Su, W.Z.; Zhang, J. Ecological risk assessment of ecosystem services in the Taihu Lake Basin of China from 1985 to 2020. Sci. Total Environ. 2016, 554, 7–16. [Google Scholar] [CrossRef]
- Yanes, A.; Botero, C.M.; Arrizabalaga, M.; Vásquez, J.G. Methodological proposal for ecological risk assessment of the coastal zone of Antioquia, Colombia. Ecol. Eng. 2019, 130, 242–251. [Google Scholar] [CrossRef]
- Xue, L.Q.; Zhu, B.L.; Wu, Y.P.; Wei, G.H.; Liao, S.M.; Yang, C.B.; Wang, J.; Zhang, H.; Ren, L.; Han, Q. Dynamic projection of ecological risk in the Manas River basin based on terrain gradients. Sci. Total Environ. 2019, 653, 283–293. [Google Scholar] [CrossRef]
- Zhang, X.M.; Du, H.M.; Wang, Y.; Chen, Y.; Ma, L.; Dong, T.X. Watershed landscape ecological risk assessment and landscape pattern optimization: Take Fujiang River Basin as an example. Hum. Ecol. Risk Assess. 2021, 27, 2254–2276. [Google Scholar] [CrossRef]
- Li, J.L.; Pu, R.L.; Gong, H.B.; Luo, X.; Ye, M.Y.; Feng, B.X. Evolution characteristics of landscape ecological risk patterns in coastal zones in Zhejiang Province, China. Sustainability 2017, 9, 584. [Google Scholar] [CrossRef]
- Yan, Y.C.; Ju, H.R.; Zhang, S.R.; Chen, G.K. The Construction of Ecological Security Patterns in Coastal Areas Based on Landscape Ecological Risk Assessment—A Case Study of Jiaodong Peninsula, China. Int. J. Environ. Res. Public Health 2021, 18, 12249. [Google Scholar] [CrossRef] [PubMed]
- Cheng, J.H.; You, Z. Scientific connotation and practical paths about the principle of ‘taking mountains, rivers, forests, farmlands, lakes and grasslands as a life community’. Chin. J. Popul. Resour. Environ. 2019, 29, 1–6. [Google Scholar]
- Li, R.; Han, R.; Yu, Q.R.; Qi, S.; Guo, L. Spatial heterogeneous of ecological vulnerability in arid and semi-arid area: A case of the Ningxia Hui autonomous region, China. Sustainability 2020, 12, 4401. [Google Scholar] [CrossRef]
- Guo, S.S.; Wang, Y.H.; Hou, H.P.; Wu, C.Y.; Yang, J.; He, W.; Xiang, L. Natural capital evolution and driving forces in energy-rich and ecologically fragile regions: A case study of Ningxia province, China. Sustainability 2020, 12, 562. [Google Scholar] [CrossRef]
- Xu, J.; Wang, S.; Xiao, Y.; Xie, G.D.; Wang, Y.Y.; Zhang, C.S.; Li, P.; Lei, G.C. Mapping the spatiotemporal heterogeneity of ecosystem service relationships and bundles in Ningxia, China. J. Clean. Prod. 2021, 294, 126216. [Google Scholar] [CrossRef]
- McGarigal, K. FRAGSTATS: Spatial Pattern Analysis Program for Quantifying Landscape Structure; US Department of Agriculture, Forest Service, Pacific Northwest Research Station: Portland, OR, USA, 1995. [Google Scholar]
- Liu, J.Y.; Kuang, W.H.; Zhang, Z.X.; Xu, X.L.; Qin, Y.W.; Ning, J.; Zhou, W.C.; Zhang, S.W.; Li, R.D.; Yan, C.Z.; et al. Spatiotemporal characteristics, patterns, and causes of land-use changes in China since the late 1980s. J. Geogr. Sci. 2014, 24, 195–210. [Google Scholar] [CrossRef]
- Wang, H.; Liu, X.M.; Zhao, C.Y.; Chang, Y.P.; Liu, Y.Y.; Zang, F. Spatial-temporal pattern analysis of landscape ecological risk assessment based on land use/land cover change in Baishuijiang National nature reserve in Gansu Province, China. Ecol. Indic. 2021, 124, 107454. [Google Scholar] [CrossRef]
- Zhang, W.; Chang, W.J.; Zhu, Z.C.; Hui, Z. Landscape ecological risk assessment of Chinese coastal cities based on land use change. Appl. Geogr. 2020, 117, 102174. [Google Scholar] [CrossRef]
- Liang, T.; Yang, F.; Huang, D.; Luo, Y.C.; Wu, Y.; Wen, C.H. Land-use transformation and ecological risk assessment in the Three Gorges Reservoir Region based on the “Production-Living-Ecological Space” perspective. Land 2022, 11, 1234. [Google Scholar] [CrossRef]
- Qu, Z.; Zhao, Y.H.; Luo, M.Y.; Han, L.; Yang, S.Y.; Zhang, L. The effect of the human footprint and climate change on landscape ecological risks: A case study of the Loess Plateau, China. Land 2022, 11, 271. [Google Scholar] [CrossRef]
- Li, G.; Fang, C.; Wang, S. Exploring spatiotemporal changes in ecosystem-service values and hotspots in China. Sci. Total Environ. 2016, 545, 609–620. [Google Scholar] [CrossRef] [PubMed]
- Orsi, F.; Ciolli, M.; Primmer, E.; Varumo, L.; Geneletti, D. Mapping hotspots and bundles of forest ecosystem services across the European Union. Land Use Policy 2020, 99, 104840. [Google Scholar] [CrossRef]
- Heyde, C. Patrick Alfred Pierce Moran 1917–1988. Hist. Rec. Aust. Sci. 1992, 9, 17–30. [Google Scholar] [CrossRef]
- Segurado, P.; Araujo, M.; Kunin, W. Consequences of spatial autocorrelation for niche-based models. J. Appl. Ecol. 2006, 43, 433–444. [Google Scholar] [CrossRef]
- Anselin, L.; Syabri, I.; Kho, Y. GeoDa: An Introduction to Spatial Data Analysis. Geogr. Anal 2006, 38, 5–22. [Google Scholar] [CrossRef]
- Zhao, L.; Zhao, Z. Projecting the Spatial Variation of Economic Based on the Specific Ellipses in China. Sci. Geol. Sin. 2014, 34, 979–986. [Google Scholar]
- Cuba, N. Research note: Sankey diagrams for visualizing land cover dynamics. Landsc. Urban Plan. 2015, 139, 163–167. [Google Scholar] [CrossRef]
- Wang, J.F.; Xu, C.D. Geodetector: Principle and prospective. Acta Geogr. Sin. 2017, 72, 116–134. [Google Scholar]
- Liu, X.P.; Liang, X.; Li, X.; Xu, X.C.; Ou, J.P.; Chen, Y.M.; Li, S.Y.; Wang, S.J.; Pei, F.S. A future land use simulation model (FLUS) for simulating multiple land use scenarios by coupling human and natural effects. Landsc. Urban Plan. 2017, 168, 94–116. [Google Scholar] [CrossRef]
- Liang, X.; Guan, Q.; Clarke, K.C.; Liu, S.S.; Wang, B.Y.; Yao, Y. Understanding the drivers of sustainable land expansion using a patch-generating simulation (PLUS)) model: A case study in Wuhan, China. Comput. Environ. Urban Syst. 2021, 85, 101569. [Google Scholar] [CrossRef]
Publisher’s Note: MDPI stays neutral with regard to jurisdictional claims in published maps and institutional affiliations. |
© 2022 by the authors. Licensee MDPI, Basel, Switzerland. This article is an open access article distributed under the terms and conditions of the Creative Commons Attribution (CC BY) license (https://creativecommons.org/licenses/by/4.0/).