Article

Decoupling Relationship and Optimization Path of Cropland Use Intensity and Carbon Emission in Henan Province
School of Economics and Management, Shihezi University, Shihezi 832000, China
*
Author to whom correspondence should be addressed.
Land 2026, 15(1), 133; https://doi.org/10.3390/land15010133
Submission received: 25 November 2025 / Revised: 25 December 2025 / Accepted: 7 January 2026 / Published: 9 January 2026

Abstract

This research focuses on Henan, a key agricultural region, analyzing data from 2000 to 2022 on cropland use and agricultural input–output. It employs the Tapio decoupling model to examine the evolution and decoupling of cropland use intensity (CLUI) and cropland use carbon emissions (CUCE) in the province. The study reveals that from 2000 to 2022, CLUI in Henan Province fluctuated in a “high-low-high” pattern over time, creating a spatial distribution with high-intensity areas in the east and lower-intensity areas at the provincial boundaries. CUCE showed a “U” shaped trend, peaking around 2015 and then gradually declining. Spatially, emissions were consistently higher in the south and lower in the north. The relationship between CLUI and CUCE transitioned from a strong negative decoupling from 2000 to 2010, to a strong decoupling from 2015 to 2020, and to a recessive decoupling from 2020 to 2022. Spatially, it evolves from a state of negative decoupling across the entire region in the early stage to nearly full coverage of strong decoupling regions in the later stage. Based on these insights, the study suggests planning strategies focusing on regional management and policy alignment, providing scientific guidance for sustainable cropland use and optimized territorial planning in Henan Province.

1. Introduction

In the context of global climate change, the issue of carbon emissions has become a focal point of widespread international concern. The 2025 edition of The State of Land and Water Resources for Food and Agriculture (SOLAW), the latest flagship report published by the Food and Agriculture Organization of the United Nations (FAO), explicitly indicates that global agricultural production of food, feed, and fiber will need to rise by roughly 50% by 2050 relative to 2012 levels. The achievement of this target is contingent upon the intelligent transformation of agriculture land utilization practices (data retrieved from https://doi.org/10.4060/cd7488zh). Agriculture, as a fundamental industry of the national economy, is not only a significant source of greenhouse gas emissions but also possesses immense potential for carbon sequestration, playing a crucial role in the carbon cycle [1]. Cropland, being a core element of agricultural production, has a close relationship between its use intensity and carbon emissions [2,3]. A deep exploration of the relationship between CLUI and CUCE is of great significance for promoting sustainable agricultural development, achieving carbon emission reduction targets, and maintaining ecological balance. Henan Province, located in the central part of China, is a crucial core area for national food production [4]. As of 2023, the cropland area in Henan Province has stabilized at over 110 million mu (approximately 7.3 million hectares), with its total grain output ranking among the top in the country for many consecutive years, playing an irreplaceable key role in ensuring national food security (data source: https://www.henan.gov.cn/2025/10-11/3234109.html, accessed on 8 November 2025). However, the high-intensity use of cropland has also brought a series of severe problems, such as the intensification of agricultural non-point source pollution, the decline of soil quality, and the increase of carbon emissions. These issues not only have a serious negative impact on the local ecological environment but also pose significant challenges to the sustainable development of agriculture [5]. The CUCE in Henan Province mainly originate from multiple stages of agricultural production, with the extensive use of fertilizers, pesticides, and plastic mulch being significant contributors. According to statistics, in 2023, the fertilizer application in Henan Province reached approximately 5.84 million tons, ranking first in the country, which accounts for about 11.6% of the national fertilizer usage. The consumption of pesticides and plastic mulch also ranks among the top in China (data source: National Bureau of Statistics official platform, https://www.stats.gov.cn/sj/ndsj/, accessed on 8 November 2025). As a major agricultural production province, the high usage of agricultural inputs in Henan not only indicates its leading position in carbon emissions from agricultural production stages but also makes it a key area for national agricultural carbon emission reduction efforts.
In related research, the relationship between land use and carbon emissions has become a consensus in the academic community. In terms of research on technical adaptability, recent studies have confirmed that technologies such as precision water and fertilizer management and crop rotation exert a significant driving effect on soil quality improvement and ecosystem optimization, and leguminous crop rotation can increase soil organic carbon by up to 18% [6]. At the spatial regulation level, international studies have generally emphasized the core role of regional heterogeneity. For example, the soil–plant–water coupling framework proposed by Maria analyzes the factors influencing its balance and dynamics as well as their intrinsic correlations with plant growth [7]. In addition, scholars have also identified the linkages between land use intensity and biodiversity [8,9]. In the study of land use intensity, Zhuang uses the assignment method to determine land use intensity, which basically involves assigning different intensity values to different land use types (for example, unused land is assigned a value of 1, forest land and grassland a value of 2, water areas a value of 3, cropland a value of 4, and construction land a value of 5) [10]. Some scholars believe that land use intensity reflects the degree of human activities’ development and use of land resources and is commonly used to measure the ecological impact of different land use types. They use indicators such as agricultural planting input intensity, pollution load of construction land, and forest canopy density to calculate land use intensity [11,12,13]. Xu et al. adopt the gross domestic product per unit area, population density, and net primary productivity (NPP) of surface vegetation to construct a land use intensity measurement method system [14]. Some scholars also use the input–output method to calculate land use intensity by constructing an actual output estimation model based on natural factors and input conditions [15,16]. Based on data such as land use in Jiangxi Province from 2000 to 2020, Huang et al. analyzed the spatio-temporal evolution and influencing factors of CUCE by using the spatial network structure of carbon emissions [17]. Some scholars have analyzed the impact of land use transformation from the perspective of biodiversity [8,9]. Martinez et al. have also focused on the relationship between land use and ecosystem services [18]. Wang et al. analyzed the dynamic decoupling relationship between land use patterns and carbon emissions in the Yellow River Delta by using carbon emission models and decoupling [19].
Existing research has made significant progress in measuring CLUI and its relationship with CUCE, but further refinement is needed in terms of perspective and precision. Specifically, the marginal contributions of this study are as follows: First, it expands the spatiotemporal scales and analytical perspectives of the research. By employing long-term time-series data at the prefectural-level city scale in Henan Province from 2000 to 2022, this study incorporates territorial spatial planning constraints into the coupling analysis framework of CLUI and CUCE, addressing the gap in existing research that rarely integrates territorial spatial planning to explore agricultural low-carbon transition. Second, it analyzes the relationship between CLUI and CUCE based on the Tapio decoupling model, refining the research scope. Finally, the spatially differentiated management and control strategies and low-carbon development paths proposed based on the spatiotemporal differentiation characteristics of Tapio decoupling provide a reference paradigm with both theoretical and practical value for the optimization of cultivated land use in other major agricultural provinces.
Based on this, this study selects Henan Province as the research area. Using land use and related data from 2000 to 2022, it analyzes the internal link between CLUI and CUCE to clarify their decoupling status and influencing factors. This approach aims to advance green, low-carbon, and sustainable agricultural development in Henan Province. Considering the regional characteristics of Henan Province, the expected research results of this study are as follows: 1. In regions highly suitable for agricultural production such as the Eastern Henan Plain, the CLUI is higher, and the CUCE level is also significantly higher than that in the Western Henan Mountainous and Hilly Areas; moreover, both show obvious agglomeration characteristics in space. 2. The decoupling relationship between CLUI and CUCE in Henan Province has stage-specific evolutionary characteristics. With the evolution of agricultural development stages and changes in policy orientation, the decoupling state between the two will undergo dynamic changes.
The subsequent content of this paper will be organized in the following logic: Section 2 is Overview of the Study Area and Data Methods, which elaborates on the natural and socio-economic backgrounds of cultivated land use in Henan Province, and introduces the core technical methods including CLUI calculation, spatial differentiation analysis, and multi-factor coupling evaluation; Section 3 is Result Analysis, which reveals the spatiotemporal evolution laws, regional difference characteristics of CLUI and CUCE in Henan Province, as well as the spatial territorial planning based on these; Section 4 is Discussion, which emphasizes the practical significance of the research results and optimization strategies, and proposes targeted paths by combining international experience and local characteristics; the final chapter is Research Conclusions.

2. Materials and Methods

2.1. Overview of the Study Area

Henan Province is located in the central and eastern part of China (110°21′–116°39′ E, 31°23′–36°22′ N), in the middle and lower reaches of the Yellow River, covering a total area of 167,000 square kilometers. As of 2024, the permanent population of Henan Province is 97.85 million, with 17 prefecture-level cities and one province-administered county-level administrative unit under its jurisdiction (Figure 1). Henan is a significant population and agricultural province in China. According to officially released data, in 2024, the added value of the primary industry in China accounted for 6.8% of GDP, while in Henan Province, it accounted for 8.6% of GDP, which is 1.8 percentage points higher than the national average, indicating a relatively higher proportion of the primary industry in the economic structure compared to the national average. In terms of cropland, Henan Province has a stable area of cropland exceeding 110 million mu (approximately 7.3 million hectares), accounting for about 6.2% of the total cropland area in China, thus playing a significant role in the national cropland pattern. The province’s grain output has remained stable at over 65 million tons for eight consecutive years, producing one-tenth of the nation’s grain and over one-quarter of its wheat. This not only secures the food supply for its own population of 100 million but also makes an important contribution to national food security (data source: Henan Statistical Yearbook). Cropland in Henan is widely distributed but exhibits significant regional variations. Topographically, the province has a higher elevation in the west and a lower elevation in the east, decreasing in a step-like manner from west to east. It is bordered by the Taihang Mountains in the north, the Funiu Mountains in the west, and the Tongbai Mountain-Dabie Mountain range in the south. To the east, it adjoins the North China Plain, while the Nanyang Basin lies in its southwest. Henan Province experiences a continental monsoon climate with distinct seasons, concurrent rainfall and heat, and features a transitional characteristic between north and south. Most of the province is located to the north of the Qinling-Huaihe Line, where the winter is cold and dry, and the summer is hot and rainy.
The topography of Henan Province encompasses various types, including plains, mountains, and hills, with complex and diverse soil types and significant spatial-temporal variations in water resource distribution. The soil texture is mostly light loam to medium loam, featuring deep soil layers, which is suitable for the cultivation of food crops such as wheat and corn. The per capita water resource quantity is approximately one-fifth of the national average, making Henan a water-scarce province. The southern region boasts abundant precipitation and substantial water resources, while the northern and eastern plain areas have less precipitation, which is seasonally concentrated in summer. As an important major grain-producing region in China, Henan has a typical dominant cropping system of winter wheat-summer maize double cropping per year. Driven by the demand for high and stable grain yields, the consumption of agricultural inputs in Henan Province had long been among the highest in the country prior to 2016. In 2015, the total chemical fertilizer consumption reached 7.1609 million tons, ranking first nationwide, and the pesticide consumption amounted to 129,000 tons, ranking second in the country. The application intensity of chemical fertilizers and pesticides per unit area was both higher than the national average. In terms of the optimized regulation and control of agricultural inputs, Henan Province launched actions for chemical fertilizer reduction and efficiency improvement around 2016. By 2022, the chemical fertilizer application rate had decreased by approximately 16%, and the pesticide application rate had dropped by about 27% compared with 2015.

2.2. Data and Methods

The data used in this study are all derived from public databases, and the specific data sources are listed in Table 1.
The agricultural data include information on fertilizers, pesticides, agricultural films, agricultural diesel, irrigation area, crop sown area, and grain output. Missing data were supplemented using linear interpolation.

2.3. Research Methods

2.3.1. Calculation of Carbon Emissions from Cropland Use

In research on the total calculation of CUCE, accurately identifying and defining the core categories of carbon sources is essential for ensuring the scientific validity of the calculation results. Based on the actual situation of agricultural production in Henan Province and the mainstream classification of agricultural carbon sources in existing research, this study selects six major core carbon sources that significantly impact regional CUCE. The total CUCE are calculated based on these six carbon sources, using the following calculation method [21]:
E t = i = 1 6 E i = i = 1 6 T i η i
In Formula (1), E t represents the total carbon emissions, E i represents the carbon emissions from each carbon source, T i represents the input amount of each carbon source, and η i represents the carbon emission coefficient of each carbon source. The data are presented in Table 2.

2.3.2. Calculation of CLUI

The cropland multiple cropping index, a key indicator for measuring CLUI, holds significant importance in agricultural production assessment and land resource management. It is defined as the ratio of the total annual cropped area (pa) to the cropland area (ca), usually expressed as a percentage. The cropland multiple cropping index directly reflects the degree of cropland utilization within a year. A higher index indicates more comprehensive utilization of cropland resources, enabling the production of more agricultural products within limited space, enhancing the effectiveness of agricultural production, and tapping into greater production potential of the land [27]. The formula for calculating cropland use intensity is [28]:
C L U I t =   p a c a × 100 %
In this Formula (2), the total cropped area for the year refers to the sum of the sown areas of various crops planted on the cropland within a year. The cropland area refers to the actual land area used for agricultural production. Since the cropland area data in the China Statistical Yearbook are updated slowly, the study utilizes the CLCD dataset to extract cropland area data.

2.3.3. Tapio Decoupling Model

The Tapio decoupling model is an elasticity analysis method used to examine the dynamic relationship between economic growth and environmental pressure. It was proposed by Finnish scholar Tapio while studying the relationship between European economic development and carbon emissions. This model introduces the decoupling elasticity coefficient, taking the ratio of the relative change rate of environmental pressure to that of economic growth as the core evaluation index. With 0, 0.8, and 1.2 as the critical values, the coupling relationship between economy and environment is divided into 3 categories, namely decoupling, coupling, and negative decoupling, totaling 8 decoupling states. Compared with traditional methods, the Tapio decoupling model has the advantages of insensitivity to the choice of base period, comprehensive evaluation dimensions, and wide application scope. It can effectively avoid calculation deviations and accurately depict the dynamic correlation characteristics between economic growth and environmental pressure. Initially applied to the decoupling analysis between carbon emissions from road traffic and economic growth, this model has gradually become a mainstream method in decoupling research in environmental fields such as carbon emissions and energy consumption. It is often combined with decomposition models to identify decoupling driving factors and serves as an important quantitative tool for evaluating regional sustainable development [29]. The Tapio model uses the elasticity coefficient as its core indicator, with the calculation formula as follows:
η =   Δ C U C E / C U C E Δ C L U I / C L U I =   C U C E t C U C E t 1 / C U C E t 1 C L U I t C L U I t 1 / C L U I t 1
In this Formula (3), CUCE represents the level of cropland use carbon emissions from cropland use, CLUI represents the intensity of cropland use, and t and t − 1 represent the current period and the base period, respectively. The elasticity coefficient reflects the ratio of the change rate of CUCE to the change rate of CLUI.
Based on the value of the elasticity coefficient η and the direction of variable change, Tapio categorizes the decoupling relationship into three major categories: negative decoupling, connection, and decoupling, with a total of eight states as detailed in Table 3 [30,31].
According to the decoupling status classification criteria in Table 3, strong decoupling is the most ideal development model. In this state, the increase in CLUI not only does not exacerbate environmental pressure but actually drives it down, representing the ultimate goal for sustainable cropland use. Weak decoupling, expansion connection, and recession decoupling are intermediate states between the ideal and risky, classified as transitional decoupling, and require policy intervention to guide them towards the ideal type. Expansion negative decoupling, strong negative decoupling, weak negative decoupling, and recession connection are states that carry dual risks of inefficient use and environmental deterioration, classified as risky decoupling, and require further intervention.

3. Results

3.1. Spatiotemporal Evolution of CLUI in Henan Province from 2000 to 2022

3.1.1. Temporal Characteristics of CLUI in Henan Province from 2000 to 2022

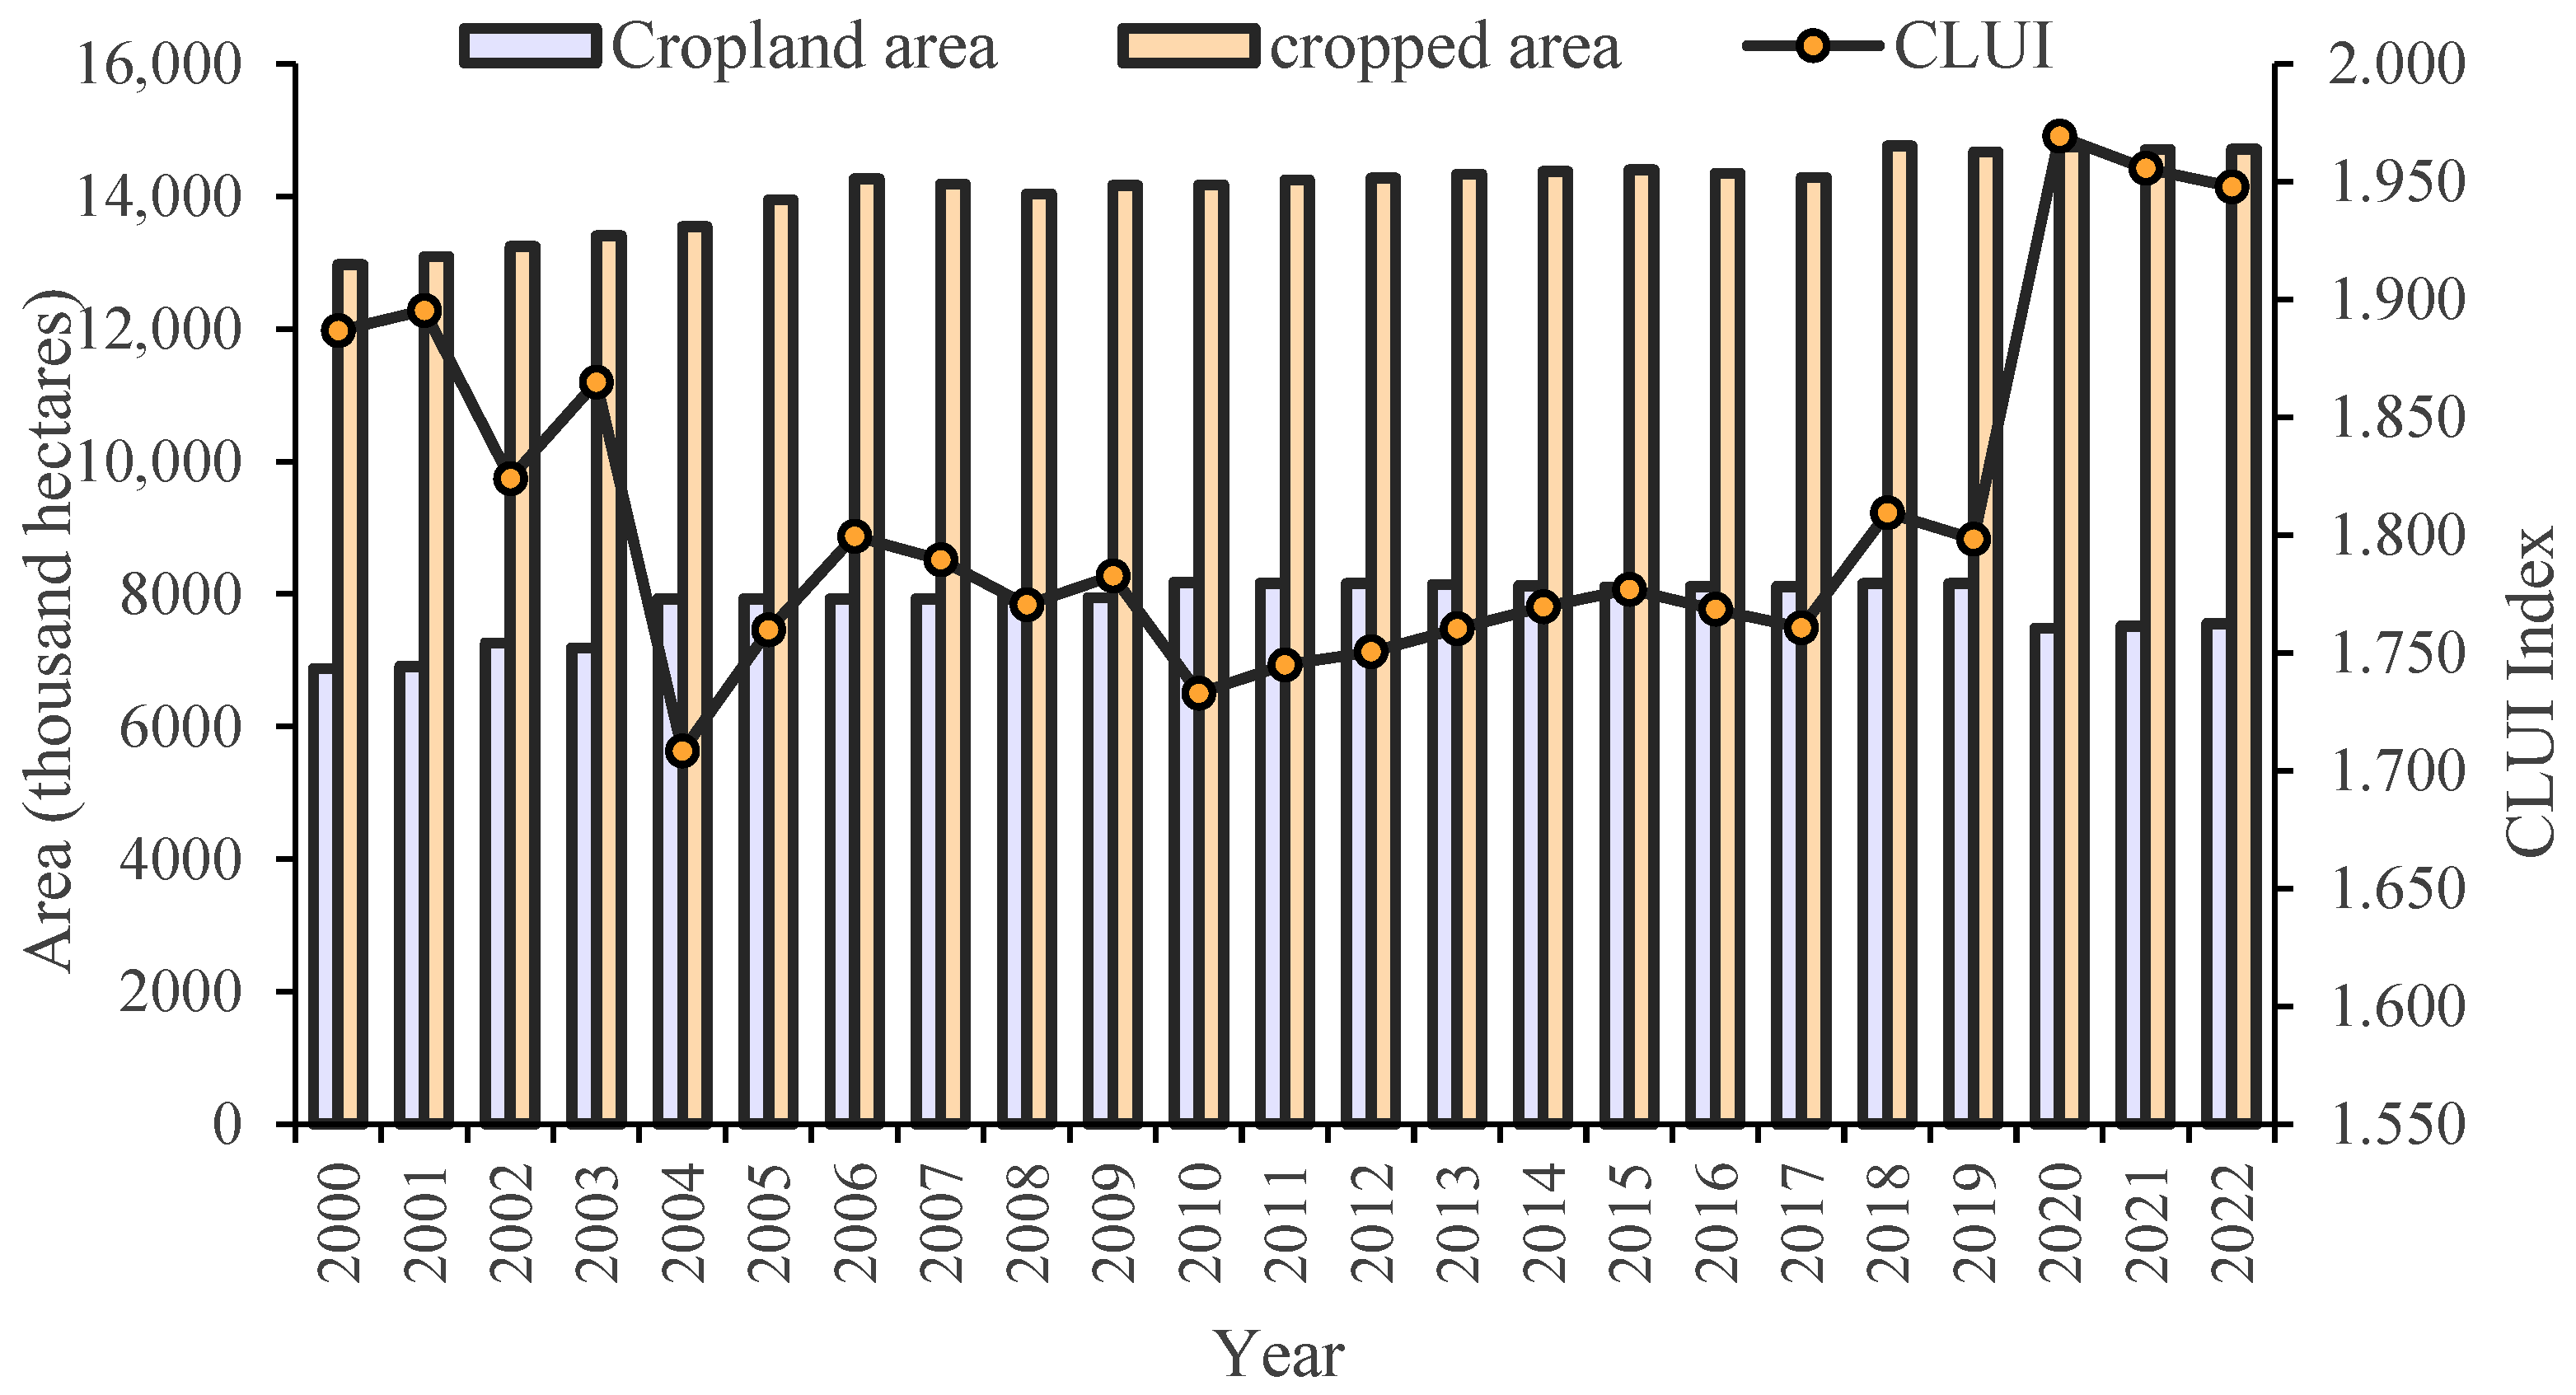
Figure 2 illustrates the changes in cropland resources and cropland use intensity in Henan Province from 2000 to 2022. From the perspective of cropland area, there was certain fluctuation in the cropland area of Henan Province from 2000 to 2003. From 2000 to 2009, the cropland area in Henan Province showed an upward trend. From 2010 to 2019, there were slight fluctuations, with the cropland area stabilizing at around 7900 to 8100 thousand hectares. After a decrease in 2019, there was a slight increase, and by 2022, the cropland area in Henan Province was 7552.92 thousand hectares. Compared to 6875.25 thousand hectares in 2000, it increased by 677.67 thousand hectares, an increase of 9.9%, with an average annual growth rate of 0.43%.
The cropland resources in Henan Province were relatively stable in the early years, but were significantly affected by various factors later, eventually showing an increase. This change reflects the efforts made by the government and relevant departments in protecting and managing cropland resources and ensuring that the red line of cropland is not breached. In terms of sown area, the sown area in Henan Province from 2000 to 2022 generally showed a fluctuating upward trend, but there were decreases in some years, indicating that while the province’s agricultural production capacity is continuously improving, it also faces some unstable factors. There were noticeable increases in 2005, 2006, and 2018, with growth rates of 3.01%, 2.26%, and 3.35%, respectively. However, there were negative growth rates in 2007, 2008, and 2019, which may have been influenced by natural disasters and public health events, leading to some cropland not being sown on time and farmers reducing the planting area of some crops.
The fluctuation in CLUI reflects the dynamic relationship between cropland area and sown area. Cultivated land area serves as the baseline of cultivated land use, while sown area reflects the actual scale of land development. Variations in the ratio between the two determine the fluctuations in cultivated land use intensity and also characterize the degree of intensive utilization of cultivated land resources. In terms of the trend in CLUI, the cropland use intensity index in Henan Province fluctuated between 1.7 and 1.9 from 2000 to 2022. From 2000 to 2004, it showed a fluctuating downward trend, reaching its lowest point of 1.708 in 2004. From 2004 to 2019, there were fluctuations but an overall upward trend, and after 2020, the CLUI in Henan Province increased significantly.

3.1.2. Spatial Evolution Characteristics of CLUI in Henan Province from 2000 to 2022

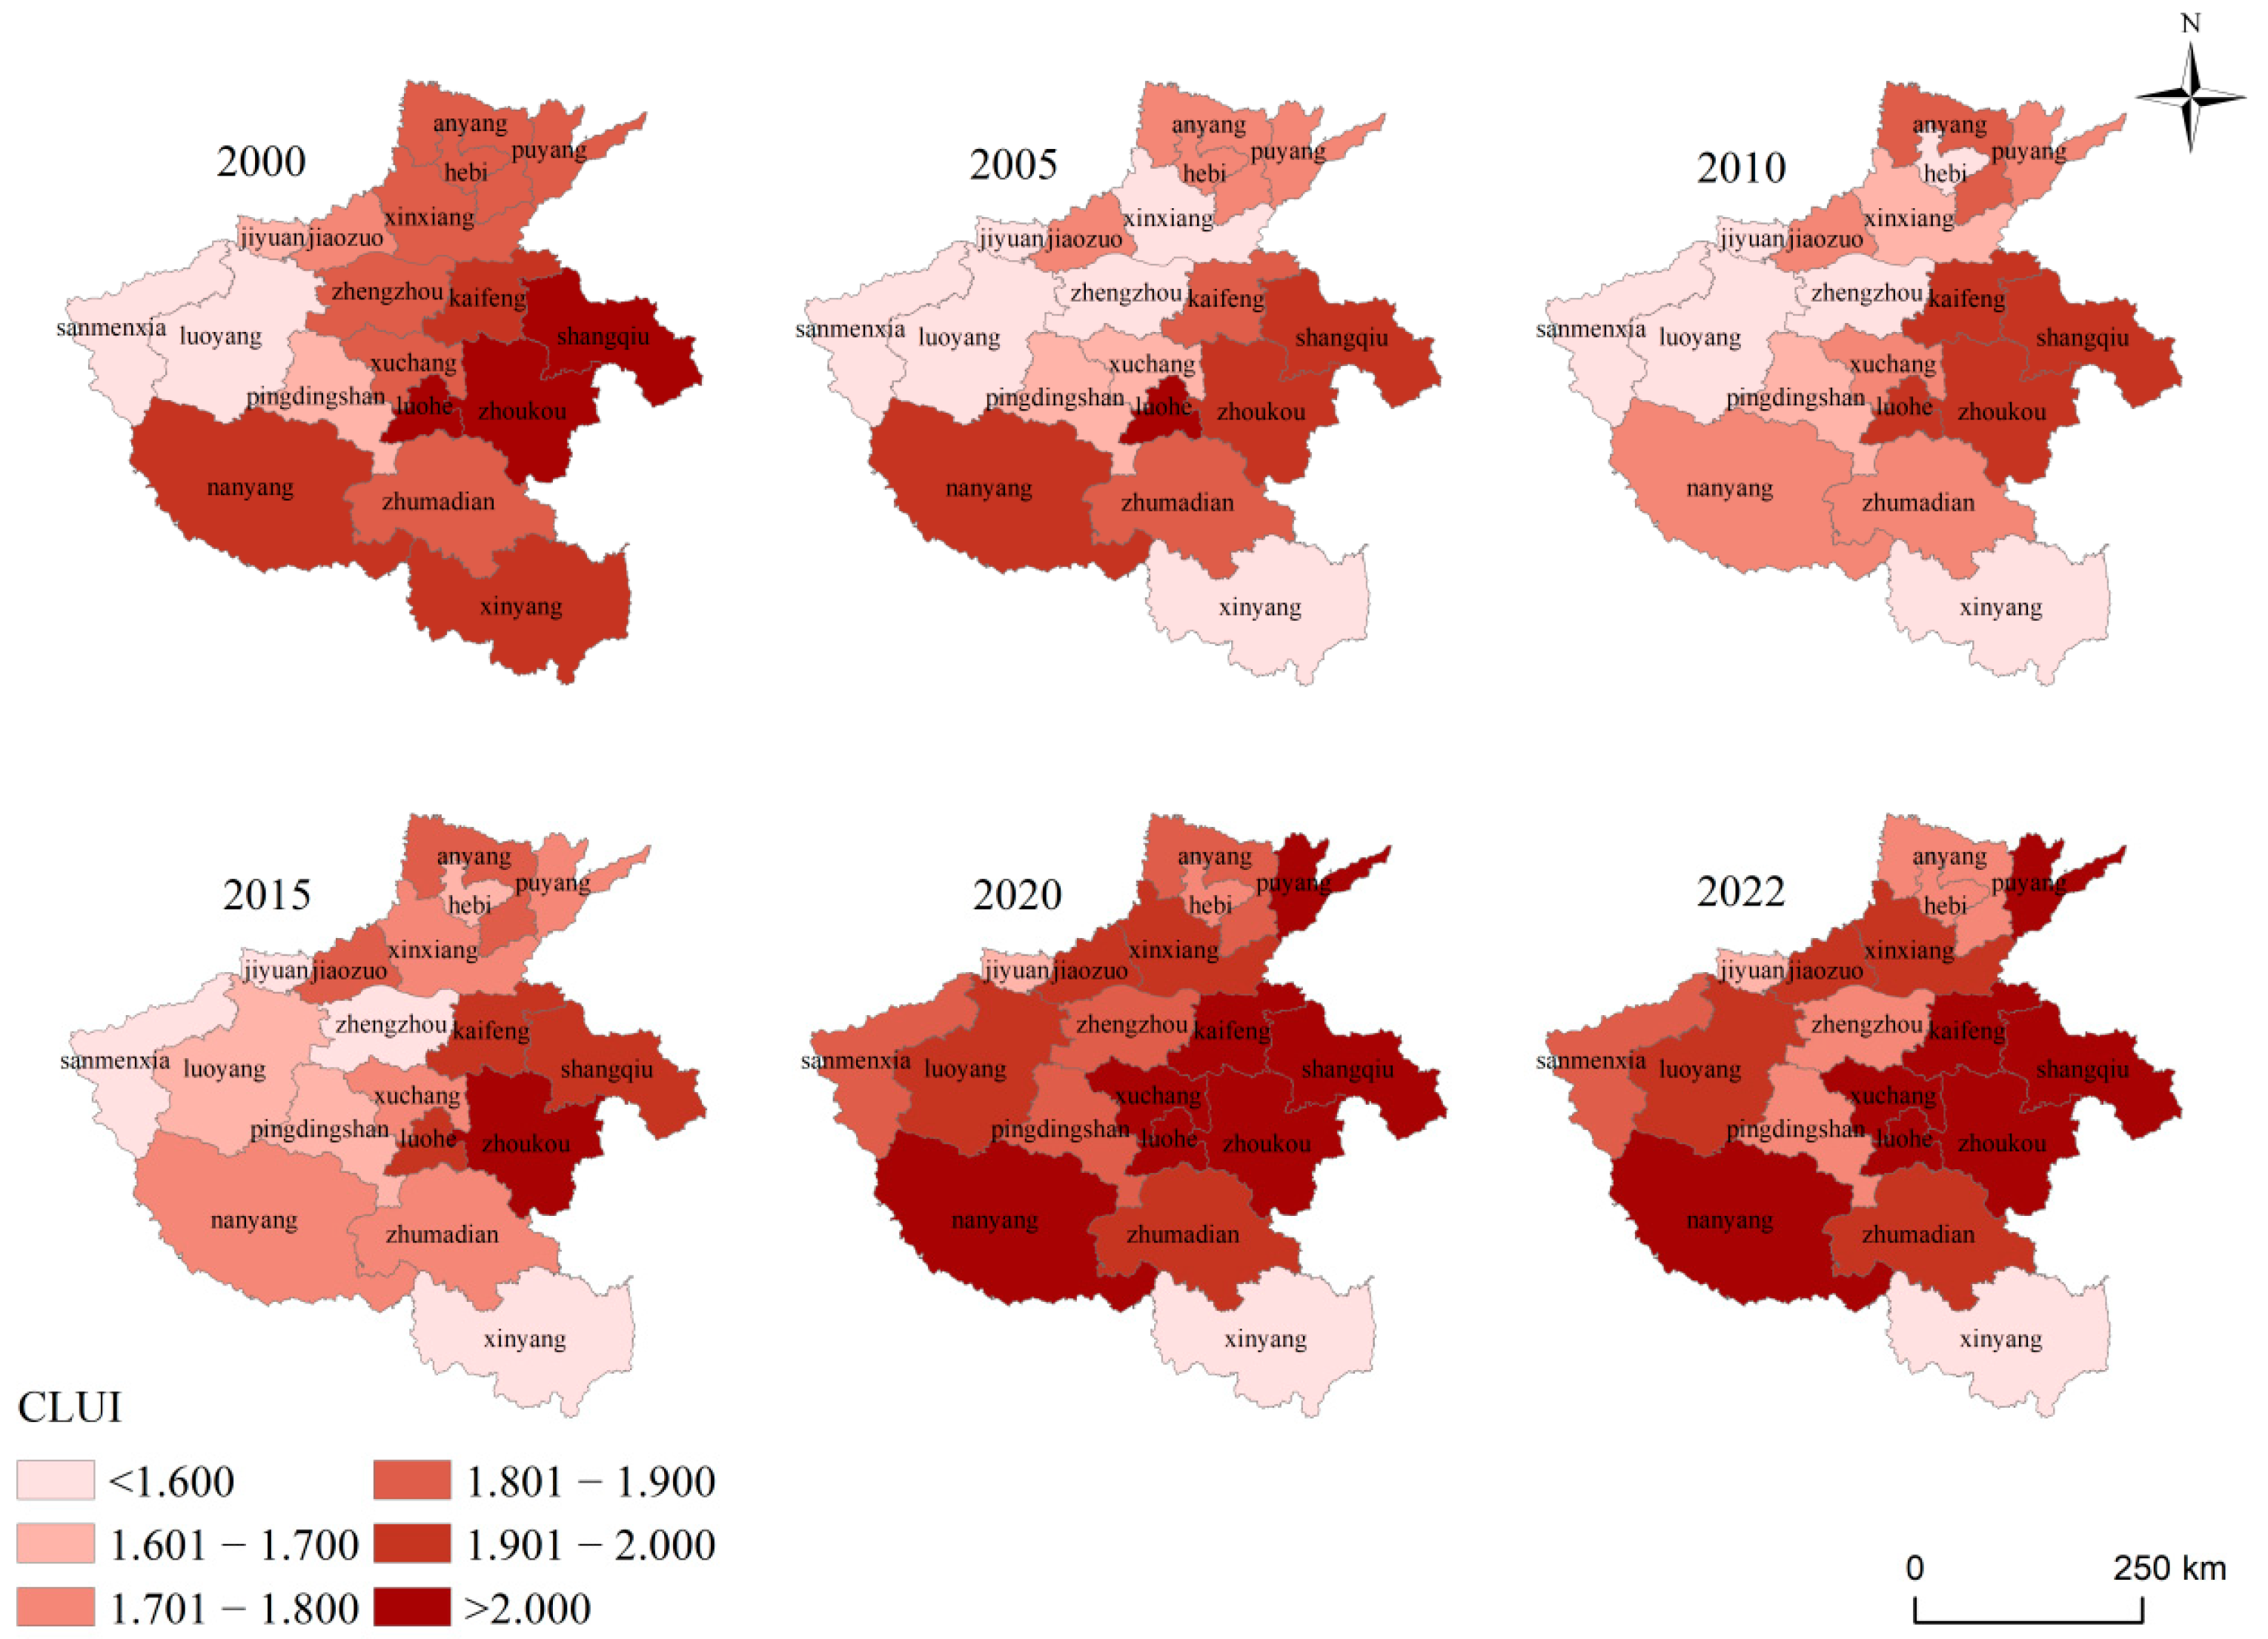
Based on the CLUI index of 18 regions in Henan Province from 2000 to 2022, the spatial evolution of CLUI in Henan Province from 2000 to 2022 was mapped using ArcGIS 10.8 software (Figure 3). To better align with the research focus and to enhance the clarity of spatial gradient patterns and clustering characteristics, the study adopted a manual classification approach, dividing the data into six intervals. The study period was divided into five multi-year intervals. This design was motivated by three main considerations. First, it helps to mitigate the interference of random fluctuations in identifying the decoupling relationship, thereby enabling a more accurate capture of the medium- and long-term coupled evolution between the two systems. Second, it aligns with the cyclical characteristics of cultivated land use patterns and agricultural policy implementation, ensuring consistency between the research period and policy practice cycles and enhancing the relevance of the driving mechanism analysis. Third, while ensuring a sufficient sample size, this approach allows for a balanced division of the study period, which provides reliable data support for analyzing regional disparities and dynamic evolutionary patterns.
Overall, the cropland use intensity in Henan Province presents a spatial pattern characterized by a “stable core area, gradient development in peripheral areas, and overall strengthening in the later period.” The high-value areas have long been centered around the eastern Henan Plain and exhibit a clumped aggregation pattern, while the low-value areas are distributed in a ring-like pattern along the provincial periphery.
In terms of stages, in 2000, the high-value areas of CLUI (>1.900) were concentrated in the eastern and central plains of Henan Province, where cropland resources are abundant and agricultural production conditions are superior, representing traditional agricultural core areas. Low-value areas (<1.700) are distributed in cities near administrative region boundaries, such as Sanmenxia, Luoyang, Jiyuan, and Xinyang. This pattern is primarily attributed to constraints from mountainous terrain, directly resulting in lower utilization intensity in these regions. From 2005 to 2015, the high-value areas contracted and concentrated in the eastern part of Henan Province. The intensity in Shangqiu and Zhoukou remained high but decreased in rank; Xinyang maintained a low intensity and remained stable, while Sanmenxia and Luoyang in western Henan continued to be low-value areas, and the intensity in Nanyang also decreased. In the later period (2020–2022), the high-value areas of CLUI in Henan Province expanded across the entire region. Eastern Henan cities—Shangqiu, Zhoukou, and Kaifeng—strengthened their CLUI and extended the trend to central, southern, and northern Henan. Significant increases occurred in Nanyang, Puyang, and Anyang, while Xinyang showed slower growth.
In summary, the CLUI in Henan Province from 2000 to 2022 experienced an overall evolution characterized by “high-low-high.” The eastern Henan plain, with its strong agricultural foundation and contiguous cropland, has consistently been a high-value stable area. The late increase in intensity in the central and western Henan regions may be related to agricultural structural adjustments and improved mechanization levels. The western and southern regions, possibly due to topographical factors, have long been low-value areas with slow intensity increases.
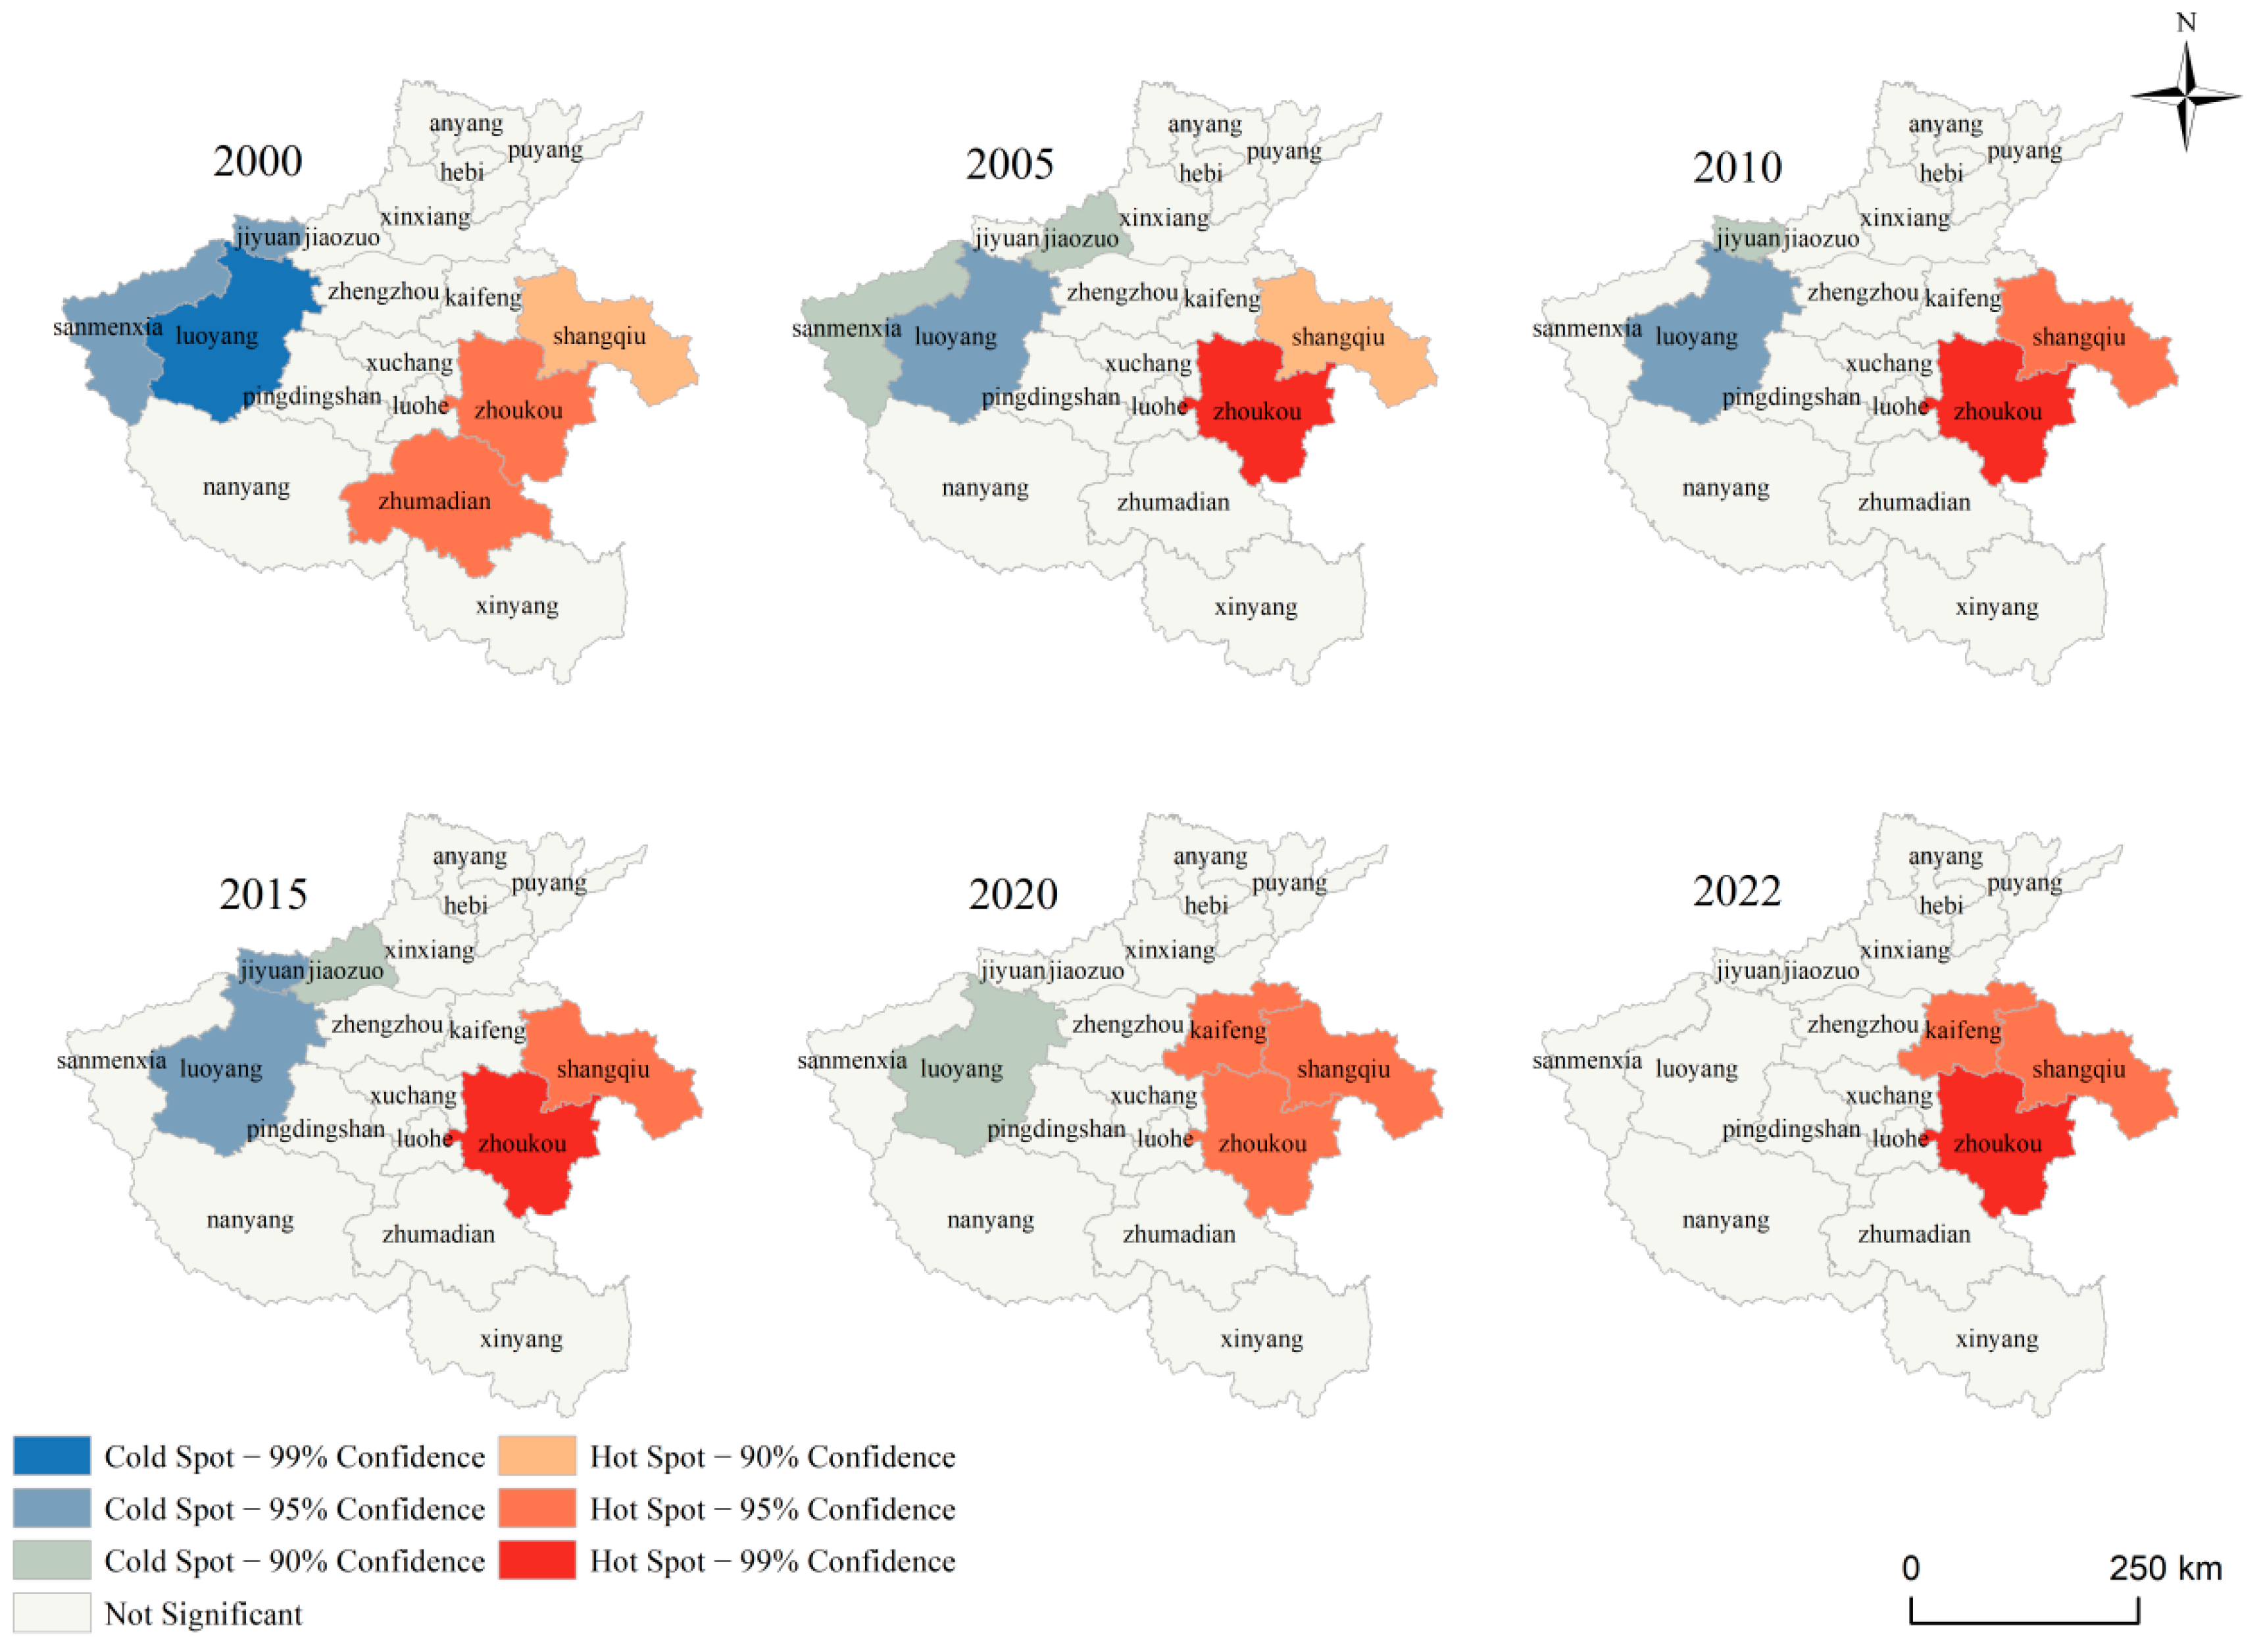
After analyzing the spatial distribution of cropland use in CLUI in Henan Province, the hot spot analysis tool in ArcGIS 10.8 software was further utilized to create a Cold-hot spot map of cropland use intensity in Henan Province based on the natural break method (Figure 4).
Overall, the cold and hot spot areas of CLUI in Henan Province exhibit dynamic changes in spatial distribution. The degree of agglomeration in CLUI hot spot areas gradually deepens and shifts spatially, while cold spot areas continue to shrink and eventually disappear. Based on the evolution of hotspot regions, in 2000, hotspots were sporadically distributed only in Zhumadian and Zhoukou in southern Henan. After 2005, these hotspots concentrated in Zhoukou and contracted in scale. By 2020, hotspots expanded to Kaifeng, ultimately forming a high-value cluster zone across the entire region. This reflects the spatial spillover effect of agricultural technology diffusion and large-scale management on CLUI.
The cold spot areas were primarily distributed in the western Henan cities of Luoyang and Sanmenxia, with their intensity continuously weakening. By 2020, these cold spot areas had completely disappeared, which may be attributed to the improvement of mountainous cropland management, advancements in dryland agriculture technology, and increased agricultural investment due to regional economic development, breaking the low-value agglomeration. In summary, the hot spot areas of CLUI in Henan Province from 2000 to 2022 showed a continuous strengthening of hot spot agglomeration and a gradual retreat of cold spot distribution. This evolution is essentially a comprehensive reflection of the enhancement of agricultural intensification and the balanced spatial development.

3.2. Temporal Pattern of CUCE in Henan Province

3.2.1. Evolution Trend of Carbon Emissions from Different Carbon Sources in Agricultural Production in Henan Province from 2000 to 2022

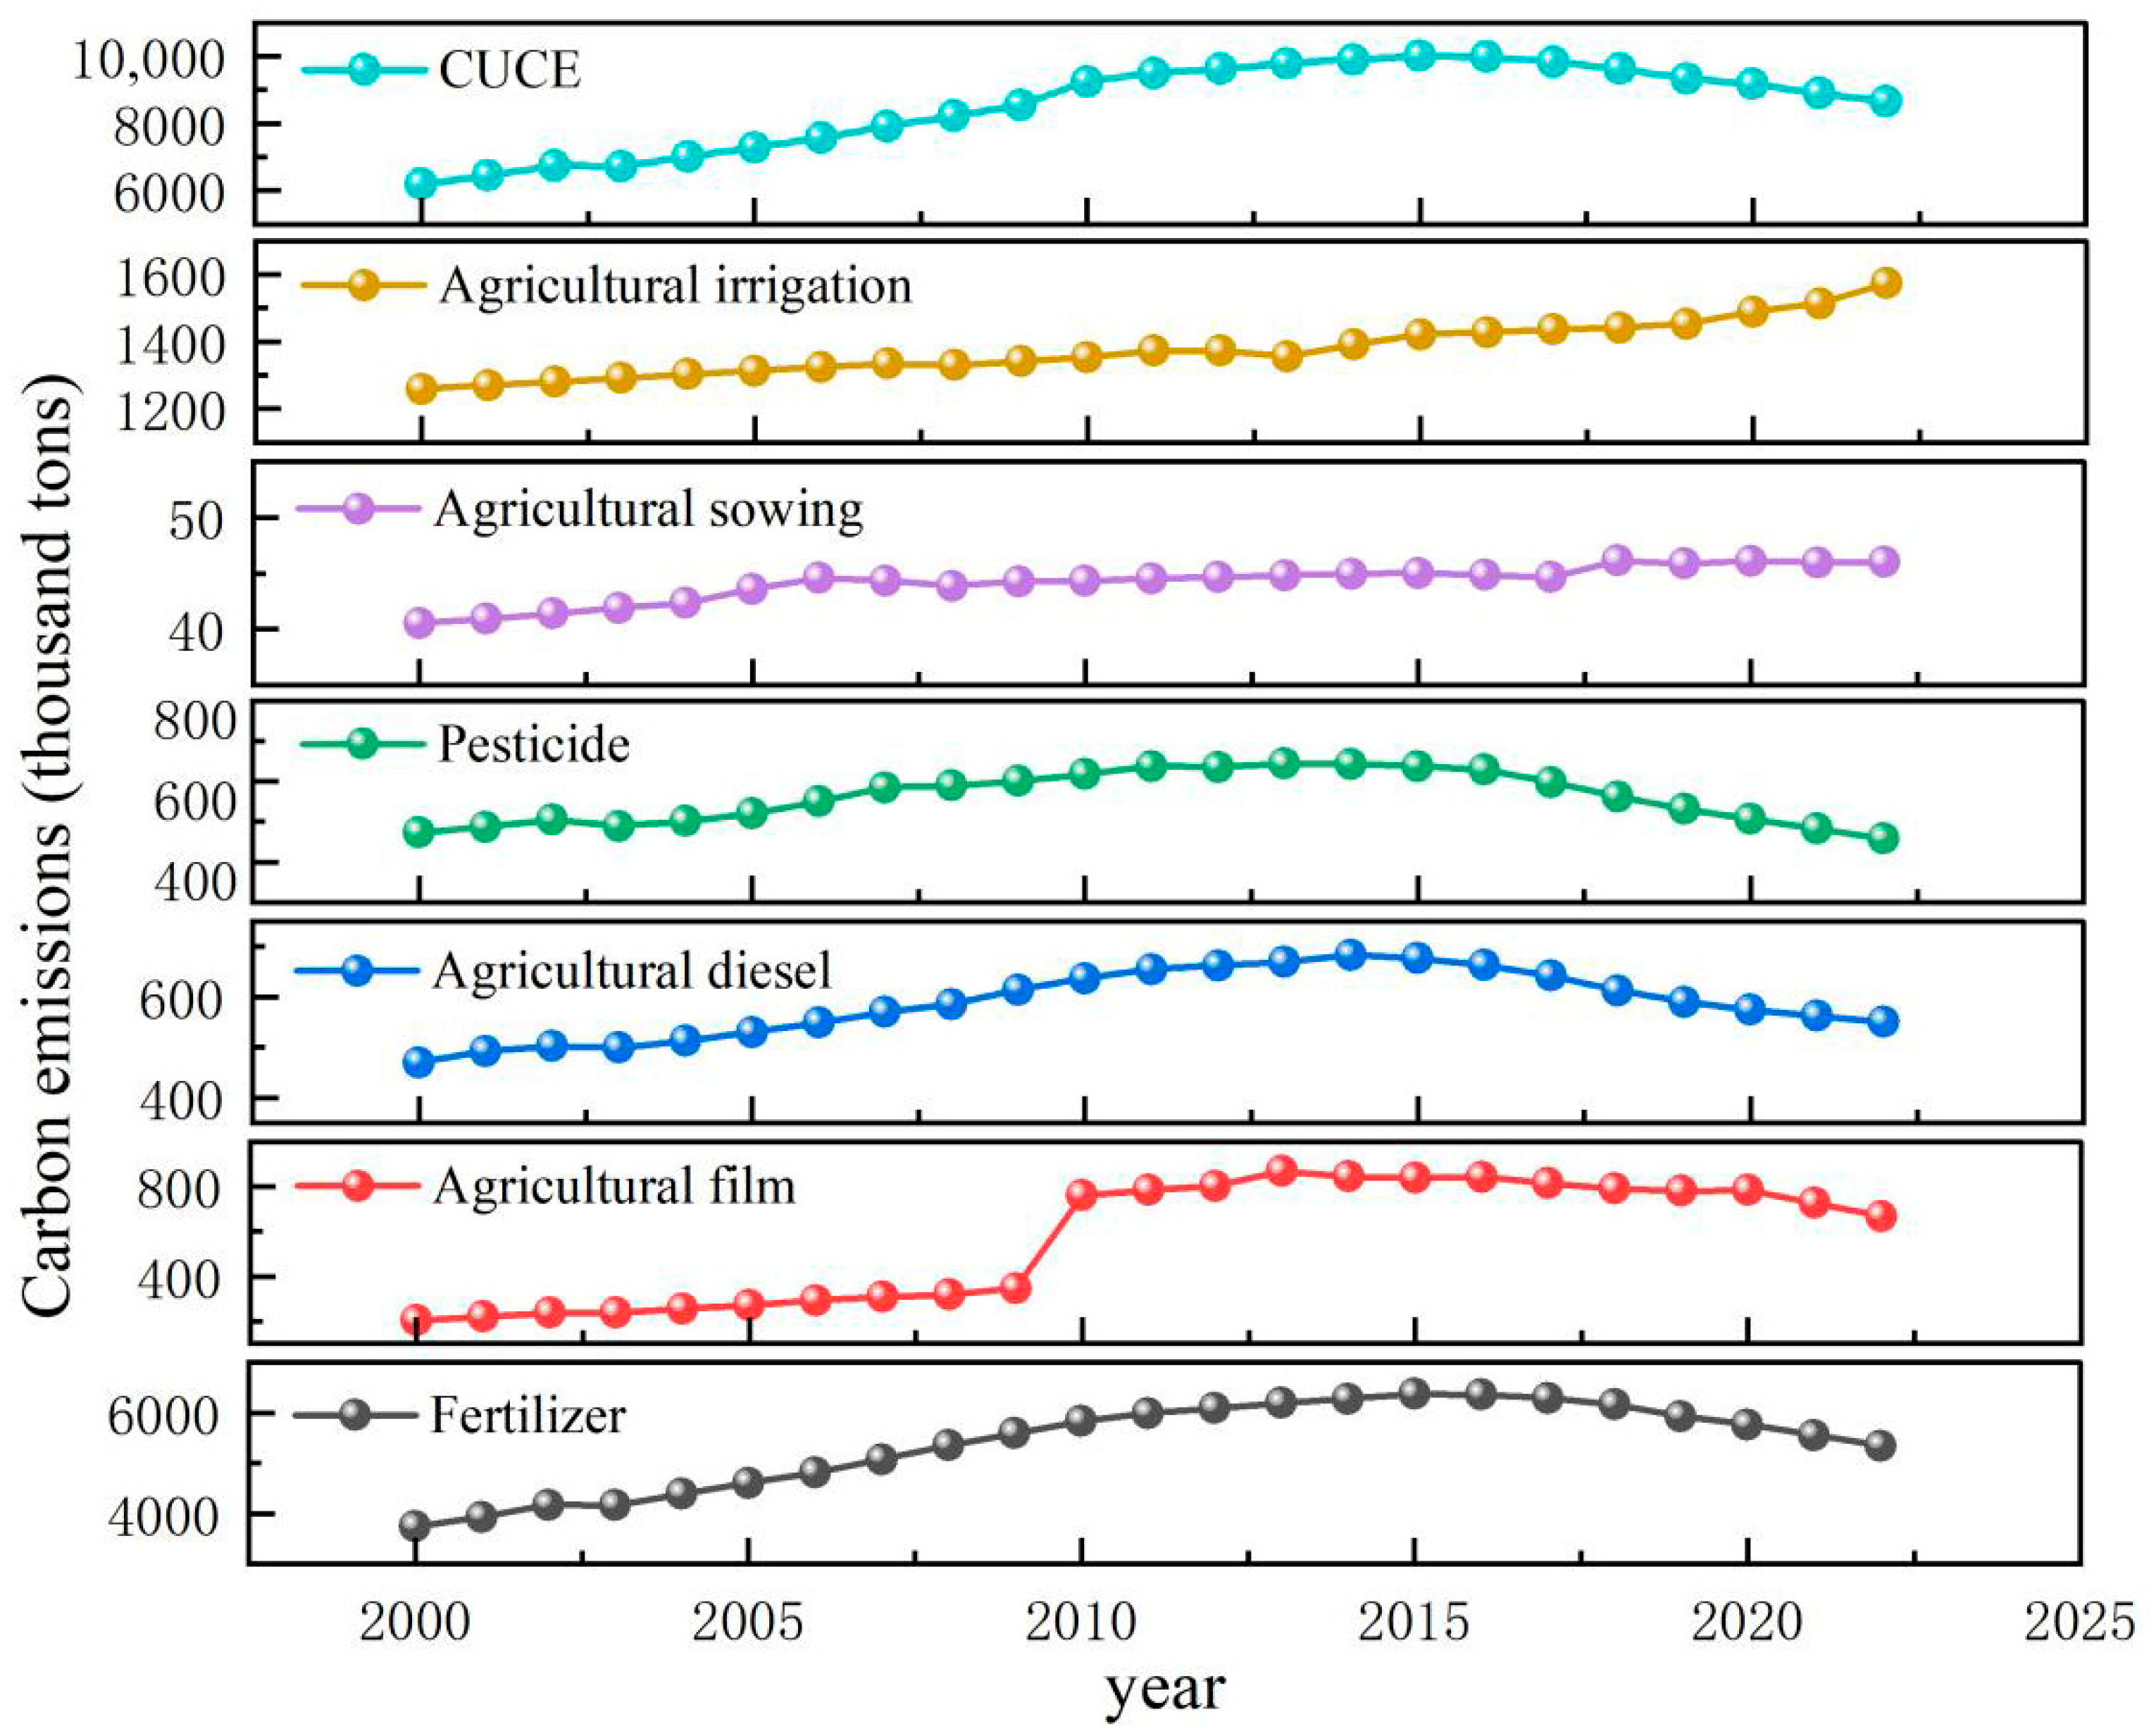
Based on the carbon emission coefficients of different carbon sources, the carbon emissions from various carbon sources in agricultural production in Henan Province were calculated, and the changing trends of carbon emissions from different carbon sources in Henan Province from 2000 to 2022 were plotted using Origin 2024 software (Figure 5).
Overall, the CUCE showed a trend of increasing first and then gradually decreasing. Starting from 2000, it continued to rise, reaching a peak around 2015, and then gradually declined, but still remained at a relatively high level. In the early stage, due to extensive agricultural production, the total CUCE continued to increase. In the later stage, due to the strengthening of environmental protection policies by the government and the green transformation of agricultural production methods, the CUCE were controlled to a certain extent.
From the perspective of carbon emissions from various carbon sources, agricultural irrigation showed a continuous and stable growth trend. During the period from 2001 to 2012, the growth rate was relatively stable and ranged between 1% and 2%. In fact, changes in total irrigation-related carbon emissions result from the combined effects of carbon emission intensity per unit area and the extent of irrigated land. The adoption of irrigation technologies generally reduces carbon emission intensity per unit area. However, if the area of irrigated cultivated land expands substantially alongside the diffusion of irrigation technologies, total irrigation-related carbon emissions may still increase due to the expansion of irrigation scale, even when per-unit-area emission intensity declines. The steady growth in the scale of agricultural irrigation may be related to factors such as the expansion of agricultural planting area and the popularization of irrigation technology.
The carbon emission trend of agricultural sowing was relatively stable, showing an overall upward trend. However, there were negative growths in 2008 and 2016–2017, which may have been influenced by factors such as changes in planting structure and climatic conditions. The carbon emissions from pesticides showed a trend of increasing first and then decreasing. In the early stage, it gradually increased from 2000 and reached a peak around 2015, after which it began to decline. This may be due to the application of green control technologies, which have helped control the use of pesticides.
The carbon emission trend of agricultural diesel exhibits an initial increase followed by a gradual decline. In the early stage, agricultural diesel usage gradually increased, peaking around 2015 before starting a slow decrease. This pattern reflects that diesel consumption for agricultural machinery initially rose with the development of agricultural mechanization, but later decreased possibly due to the promotion of energy-efficient machinery and optimization of operational models.
The carbon emission trend of agricultural film was initially stable, followed by rapid growth and a slight decline in the later stage. Before 2010, the growth was relatively slow, but it began to rise rapidly around 2010. After 2014, there were several instances of negative growth, with particularly large negative growth rates in 2021–2022, which may be attributed to the promotion of degradable agricultural films or the strengthening of agricultural film usage regulations, leading to a decrease in consumption. The carbon emissions from fertilizers showed a trend of increasing first and then decreasing. Starting from 2000, it continued to rise and reached a peak around 2015, after which it began to decline. Negative growth was observed starting in 2016, with the negative growth rate gradually increasing, indicating a reduction in fertilizer usage. The carbon emissions from fertilizer use increased with the increasing demand for agricultural fertilization in the early stage, but decreased later due to improvements in fertilization techniques and the replacement with organic fertilizers.
In summary, the carbon emissions from cropland irrigation and agricultural sowing continued to increase, while the carbon emissions from other agricultural inputs or activities showed a growth trend in the early stage and experienced a turning point around 2015, reflecting the differences in the development stages of different agricultural production stages and the effects of policy and technological interventions.

3.2.2. Spatial Evolution of CUCE in Henan Province from 2000 to 2022

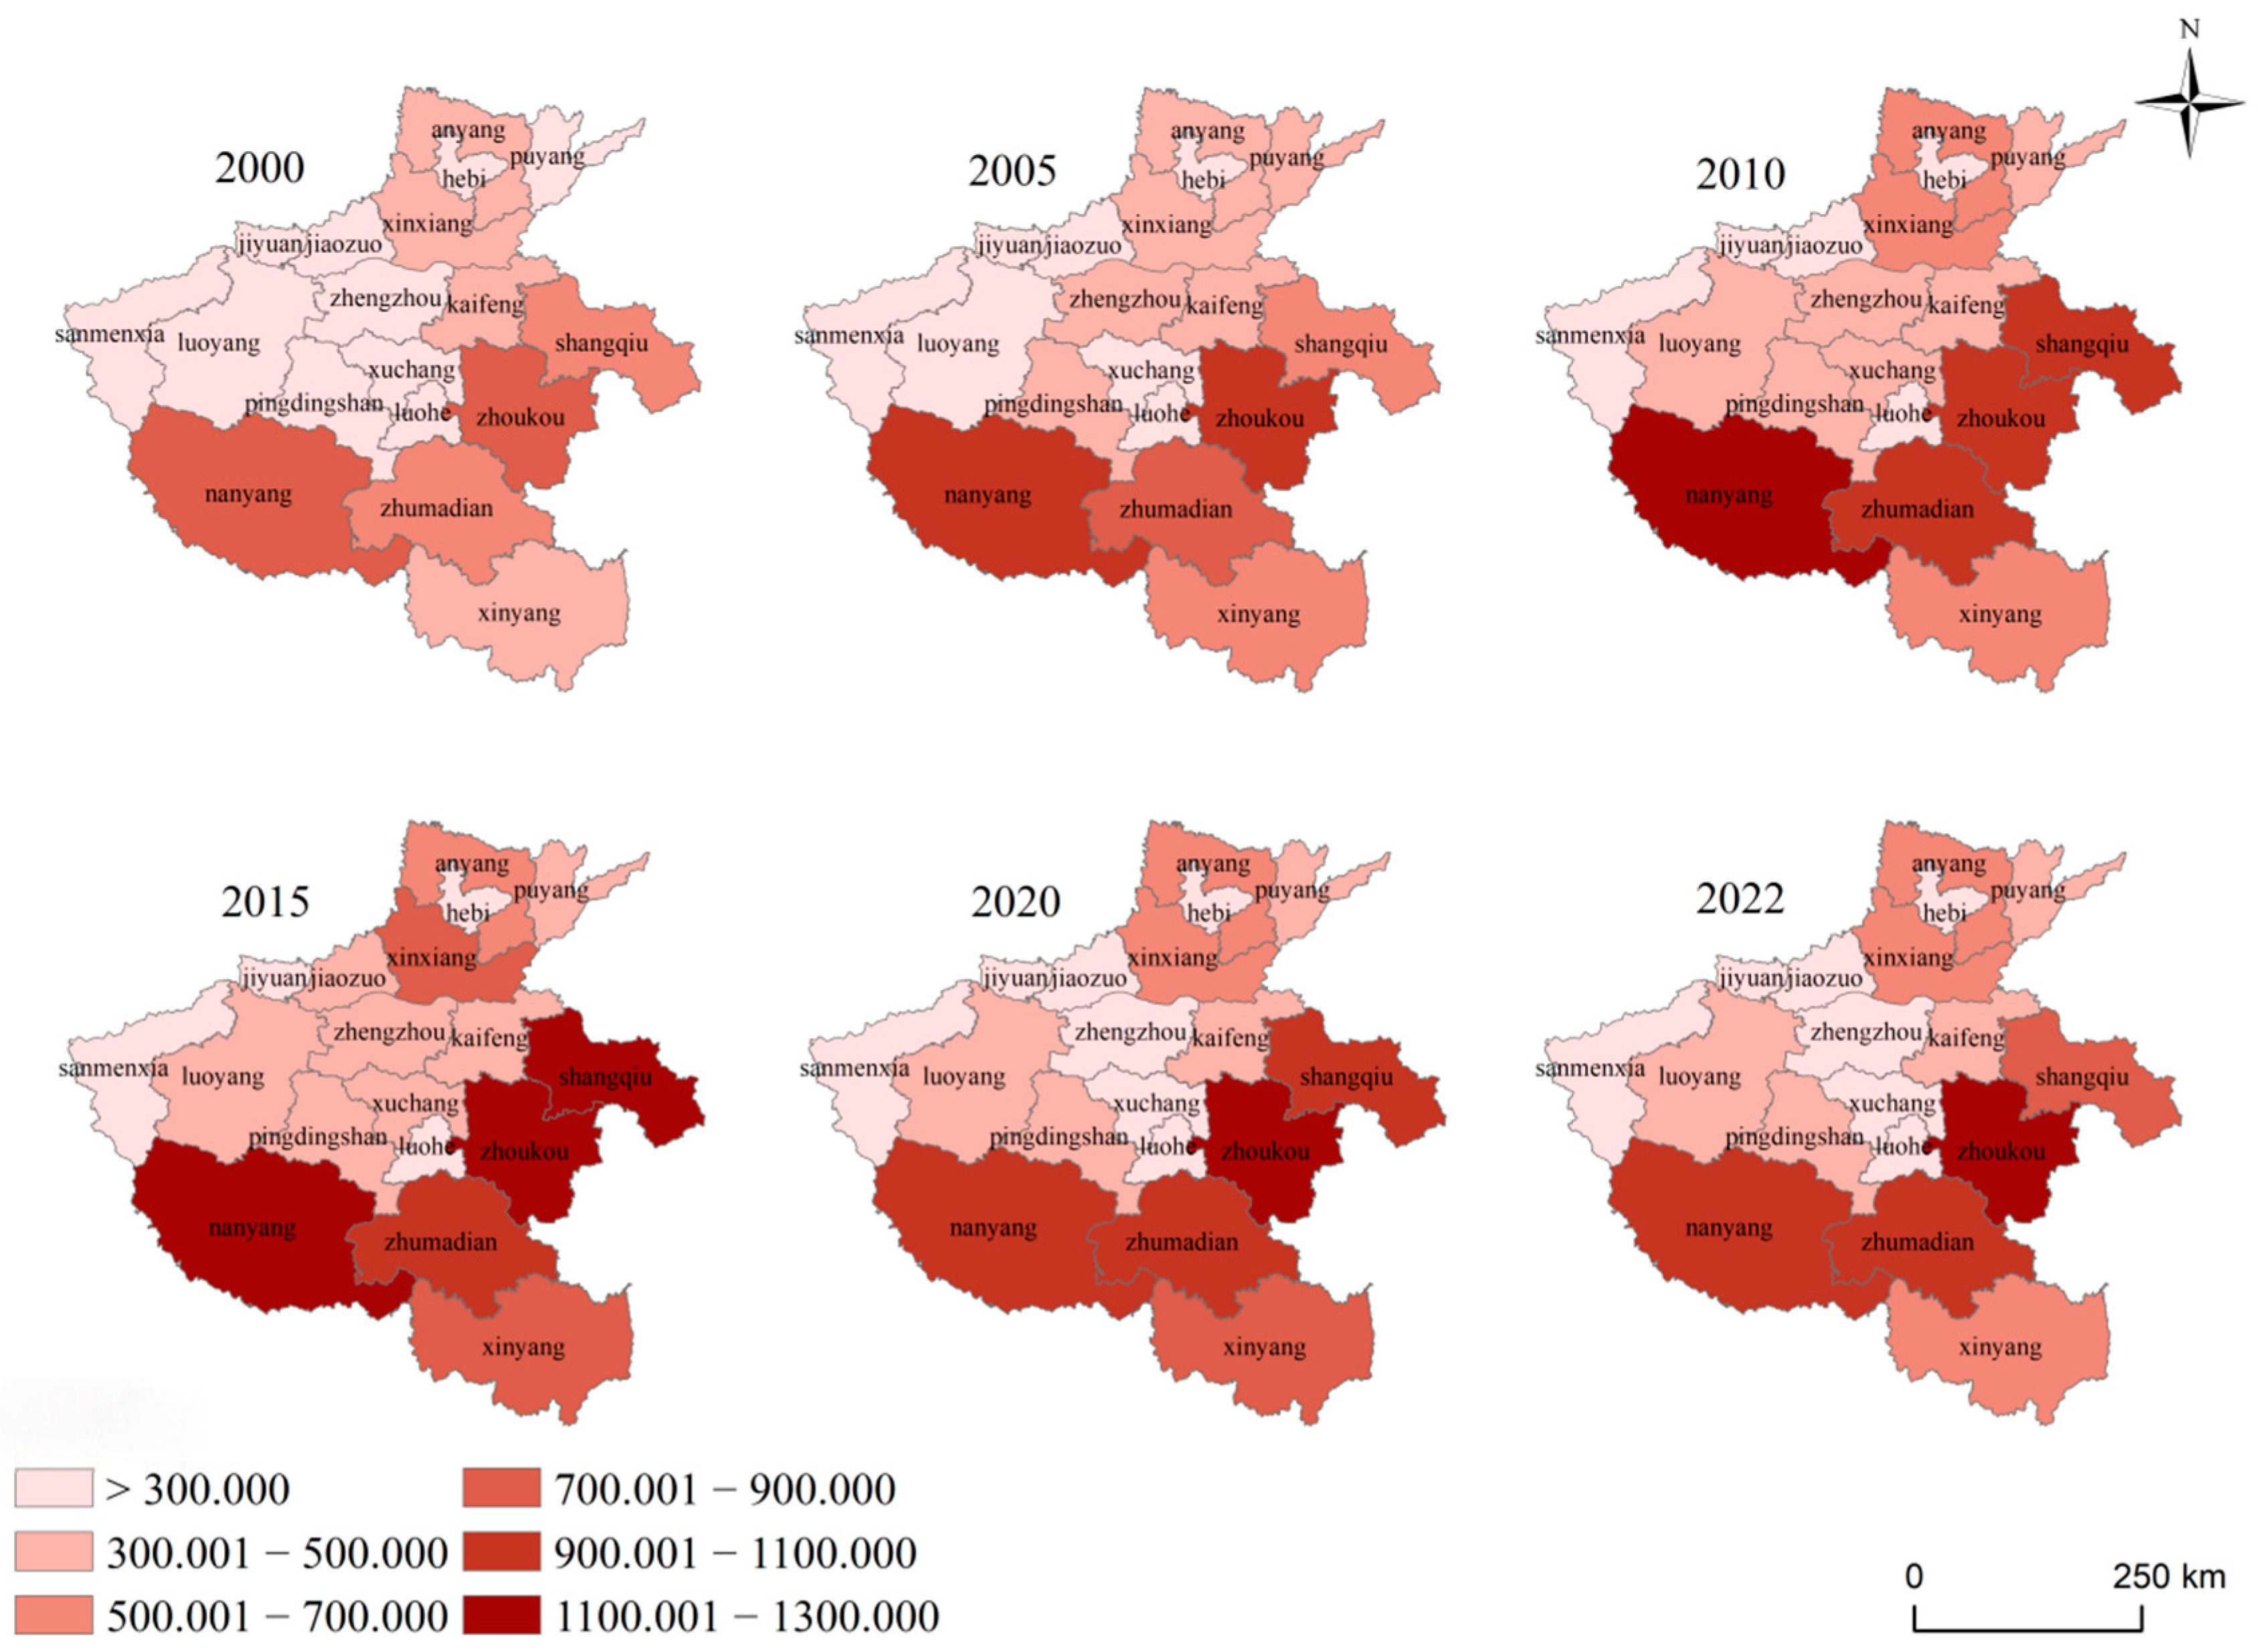
Overall, the CUCE in Henan Province showed a trend of increasing first and then decreasing, with the southern region significantly higher than the northern region (Figure 6). Before 2015, the CUCE in Henan Province rose rapidly, with most areas reaching a peak around 2015 and then beginning to decline.
From the perspective of carbon emissions in various regions, cities such as Zhoukou, Nanyang, and Zhumadian in the southern part of Henan Province consistently had higher carbon emissions at different times. These regions have large areas of cropland and intensive agricultural activities, resulting in a significant cumulative effect of carbon emissions from sources such as fertilizers, pesticides, and agricultural machinery energy consumption. The carbon emissions in cities like Jiyuan, Hebi, Sanmenxia, and Luohe were much lower than in other regions. The reasons for this include the smaller cropland area and production scale in Jiyuan and Hebi, which directly led to lower total carbon emissions compared to other regions. Although Luohe is a major agricultural city in Henan, its cropland is less concentrated, and the decentralized management model reduces the concentrated use of high-carbon-emission inputs such as fertilizers and pesticides. As a model city for green and low-carbon transformation in Henan Province, Sanmenxia has vigorously promoted the green and low-carbon transformation of agriculture in recent years, reducing carbon emissions during agricultural production.
From a phased perspective, comparing maps from different years shows that carbon emissions have undergone dynamic changes, expanding initially and then contracting locally. In 2000, high-value carbon emission areas were only concentrated in parts of Nanyang and Zhoukou. From 2005 to 2015, Zhumadian and Xinyang also joined the high-value areas, and the high-value ranges of Nanyang, Zhoukou, and Shangqiu further expanded. This period was a time of large-scale agricultural development in Henan Province, with significant increases in the use of fertilizers and pesticides, and enhanced agricultural machinery tillage intensity, driving rapid growth in carbon emissions in the major agricultural cities of southern Henan. From 2015 to 2022, the high-value areas contracted locally, with the high-value ranges of Shangqiu and Nanyang shrinking, leaving only Zhoukou maintaining its high value.
From a north–south difference perspective, from 2000 to 2015, the gap between the north and south continued to widen, with the difference between the low and medium value areas in the north and the high value areas in the south continuously expanding. This indicates that during this period, the growth rate of carbon emissions in the major agricultural cities of southern Henan far exceeded that of the north, with the regional differences in cropland use carbon emissions widening. As a major grain-producing region, southern Henan is characterized by relatively high agricultural input intensity, resulting in significantly higher CUCE than those in the northern areas. In contrast, cultivated land in northern cities is dominated by rain-fed agriculture, with the multiple cropping index remaining stable at a “single-cropping-per-year” pattern over a long period. The slow growth in cultivated land use intensity in the north, compared with the faster increase in the south, has ultimately led to a continuous widening of regional disparities in CUCE. From 2015 to 2022, after the north–south gap stabilized, the expansion momentum of high-value areas slowed down, and the carbon emissions in medium and low-value areas did not show a significant decrease, leading to a relatively stable overall spatial gradient hierarchy. This transformation is directly associated with policy interventions. After 2015, Henan Province implemented a series of agricultural emission-reduction policies, including soil testing and formula fertilization as well as initiatives aimed at reducing fertilizer use while improving efficiency. As a result, the growth rate of fertilizer inputs across the province continuously declined, the expansion of cultivated land use intensity slowed, and the increase in carbon emissions was effectively contained. This reflects that the spatial pattern of cropland use carbon emissions in Henan Province has formed a relatively solidified structure of high values in the south and low values in the north.
To rigorously verify the reliability of the spatiotemporal variation trends in cultivated land use intensity and CUCE in Henan Province, this study applied the Mann–Kendall trend test and the Pettitt test. The results indicate that, during the period 2000–2019, CUCE in Henan Province exhibited a significant overall upward trend (Z = 3.960, p < 0.01), whereas CLUI showed no significant trend, despite a modest increasing tendency in the earlier stage (Z = 0.476, p > 0.05).
The Pettitt test further revealed a significant change point in CUCE, with the breakpoint occurring in 2010 (U = 9245.664, p < 0.01). After 2010, carbon emissions shifted from an increasing to a decreasing trend, which closely corresponds to the policy timeline of the fertilizer and pesticide reduction and efficiency enhancement initiative launched in Henan Province in 2015. In contrast, cultivated land use intensity exhibited a significant change point in 2006 (U = 1.708, p < 0.05).

3.3. Spatiotemporal Evolution of the Decoupling Relationship Between CLUI and CUCE in Henan Province

3.3.1. Analysis of the Overall Decoupling Relationship Between CLUI and CUCE in Henan Province

Based on Formula 3, the decoupling index and decoupling status of CLUI and CUCE in Henan Province for the five periods of 2000–2005, 2005–2010, 2010–2015, 2015–2020, and 2020–2022 were calculated (Table 4).
Based on the results in Table 4, the relationship between CLUI and CUCE in Henan Province has gradually improved from strong negative decoupling from 2000 to 2010, achieving the optimal strong decoupling from 2015 to 2020, but then transitioning to recessive decoupling from 2020 to 2022, overall showing a trend of deterioration, followed by optimization, and then fluctuation. In the first stage (2000–2010), the relationship between CLUI and CUCE in Henan Province continued to deteriorate. Both the periods of 2000–2005 and 2005–2010 showed strong negative decoupling, with the absolute value of the decoupling index increasing from −2.641 to −17.607. The continuous expansion of the absolute value of the decoupling index reflects the increasingly sharp contradiction between CLUI and CUCE. The development trends of the two indicators show a clear divergent trend, with CLUI decreasing while CUCE continue to increase. From the perspective of agricultural production methods, agricultural production in Henan Province was relatively extensive at that time, with a high degree of reliance on high-carbon-emitting agricultural inputs. During this period, farmers extensively used agricultural fertilizers, pesticides, agricultural films, and agricultural diesel to increase grain yields. Moreover, although the level of agricultural mechanization was gradually improving, the relatively backward technology resulted in high energy consumption of agricultural machinery and low energy utilization efficiency, further exacerbating the increase in carbon emissions.
In the second stage (2010–2015), the relationship between CLUI and CUCE in Henan Province showed some mitigation but remained in a negative decoupling state. During this period, the growth rate of CUCE significantly slowed down, with the change rate decreasing from 0.258 to 0.070. At the same time, CLUI shifted from decreasing to increasing, and the decoupling index also turned positive, indicating that the relationship between the two was gradually improving. However, CUCE was still increasing. During this period, Henan Province intensified efforts to adjust its industrial structure, leading to a decrease in the proportion of high-energy-consuming agricultural industries. Simultaneously, the government strengthened its supervision of agricultural production and introduced a series of environmental protection policies and standards. These measures encouraged agricultural producers to focus more on energy conservation and emission reduction, adopting more environmentally friendly and efficient production methods. This also contributed to the slowdown in the growth rate of carbon emissions to some extent.
In the third stage (2015–2022), Henan Province achieved the ideal state of strong decoupling, where the CLUI increased while the CUCE showed a downward trend. This is an extremely ideal development model, indicating that Henan Province has found a good balance between cropland resource utilization and ecological environmental protection, achieving coordinated economic and environmental development. From 2020 to 2022, CUCE continued to decrease, but there was a slight decrease in CLUI. The decoupling status shifted from strong decoupling to recessive decoupling, but the relationship between the two remained positive and did not revert to the previous deteriorating state. This period coincided with the outbreak of the COVID-19 pandemic. Disruptions to agricultural input supply chains and the suppression of farmers’ cultivation incentives caused by the pandemic may have been key factors driving the decline in CLUI.

3.3.2. Spatial Evolution of the Decoupling Between CLUI and CUCE in Henan Province

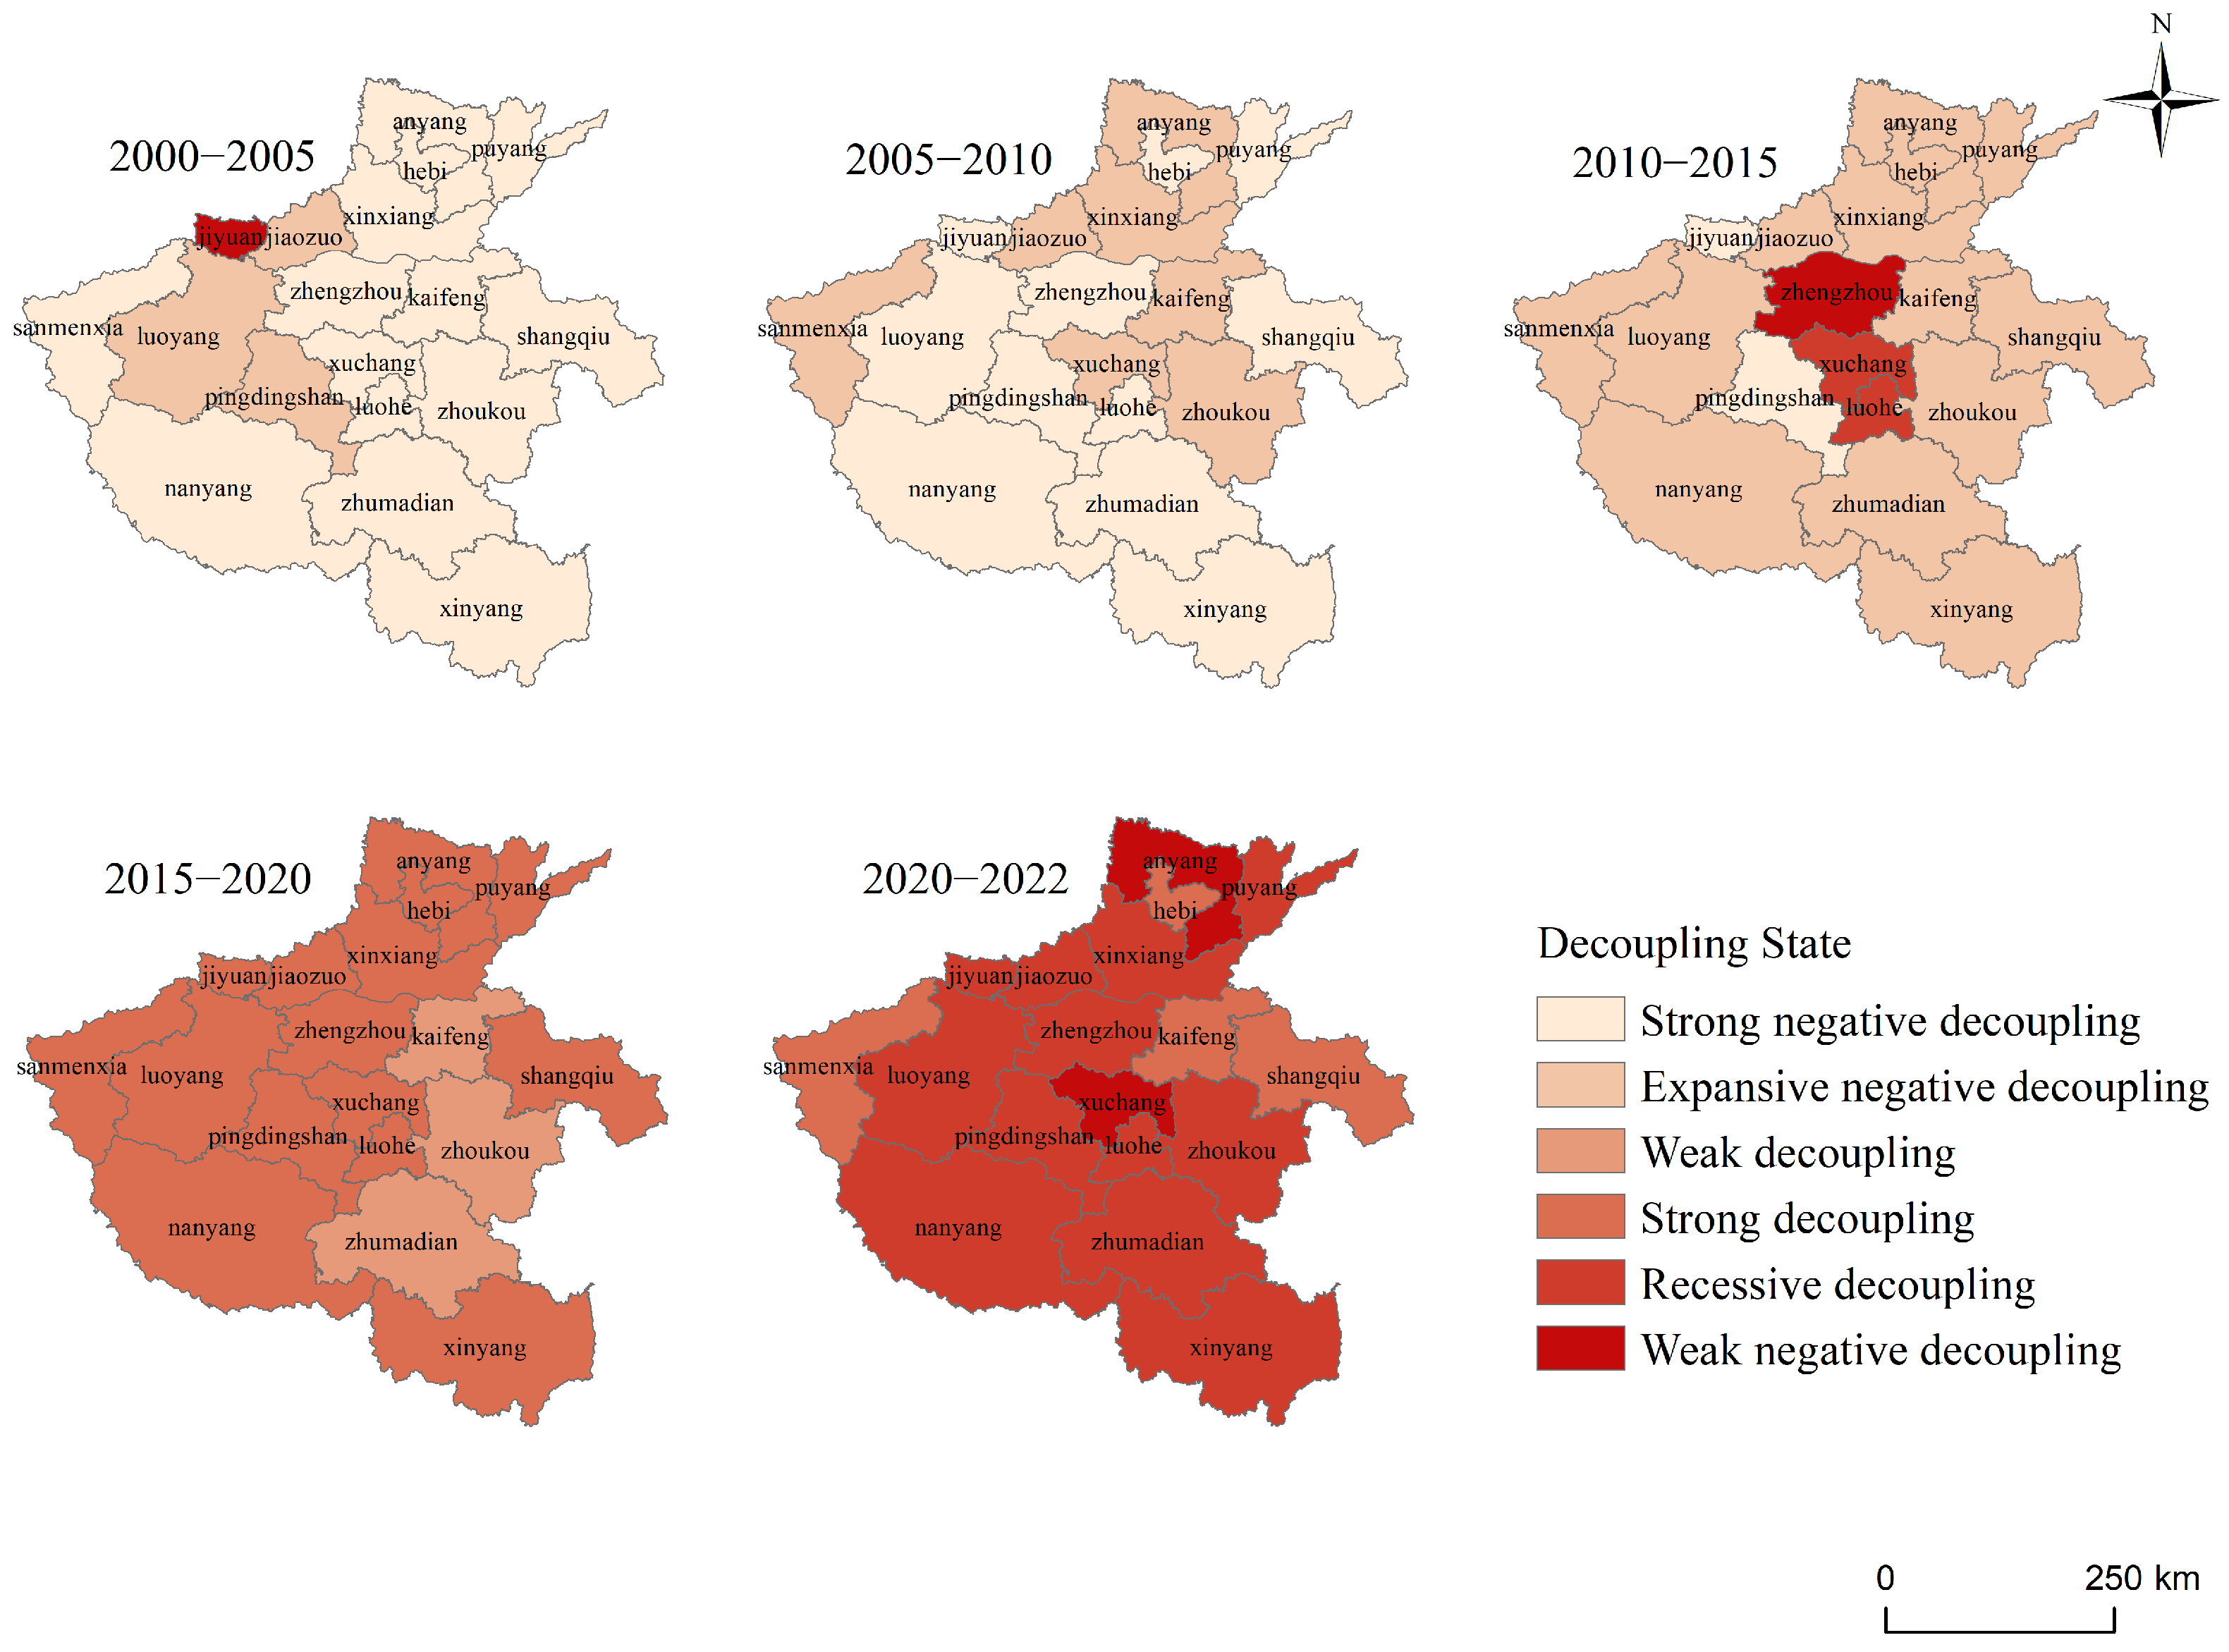
Figure 7 illustrates the decoupling status between CLUI and CUCE in Henan Province across five periods, including 2000–2005 and 2005–2010. Overall, in the early stage, the decoupling types in Henan Province were dominated by expansive negative decoupling and strong negative decoupling. During this period, the economic–environmental relationship was mostly in negative or weak correlation. Subsequently, Xuchang and Luohe began to show localized breakthroughs of strong decoupling. In the later stage, strong decoupling and recessive decoupling emerged in most regions of Henan Province, eventually achieving full territorial coverage. This process indicates that Henan Province has achieved a qualitative shift from passive association to active decoupling in the relationship between CUCE and the impact of CLUI. The strength, breadth, and depth of decoupling continue to increase steadily.
Viewed in stages, the decoupling status across periods exhibits significant differences. Between 2000 and 2005, a distinct decoupling pattern emerged in four cities in Luoyang and Pingdingshan, Henan Province, while the rest of the region was dominated by strong negative decoupling, highlighting a pronounced adverse relationship between economic activities and environmental impact. From 2005 to 2010, the overall decoupling status in Henan Province improved, albeit gradually. Only the northern fringe cities and a few in the central-eastern part, such as Kaifeng and Zhoukou, sustained expansionary negative decoupling. The number of cities exhibiting this type of decoupling increased from four to seven, with the remainder still in the strong negative decoupling category. This suggests that during this period, there was a moderate improvement in the relationship between CLUI and CUCE in Henan Province, although most areas continued to display significant misalignment.
Between 2010 and 2015, the majority of Henan Province experienced expansionary negative decoupling. Notably, in Zhengzhou, Xuchang, and Luohe, there were instances of strong decoupling and recessive decoupling, signaling a shift in the province’s decoupling trend towards stronger correlations and more apparent transformations during this period.
From 2015 to 2020, strong decoupling regions in Henan Province expanded significantly. The decoupling status rapidly spread spatially. CLUI increases and CUCE intensity decreases have become the mainstream trend. From 2020 to 2022, most central regions in Henan Province saw their decoupling status shift from strong decoupling to recessive decoupling, with Anyang and Xuchang moving to a state of weak negative decoupling.

3.4. Territorial Spatial Planning in Henan Province Considering the Decoupling Between CLUI and CUCE

3.4.1. Regional Differentiation in CLUI Management

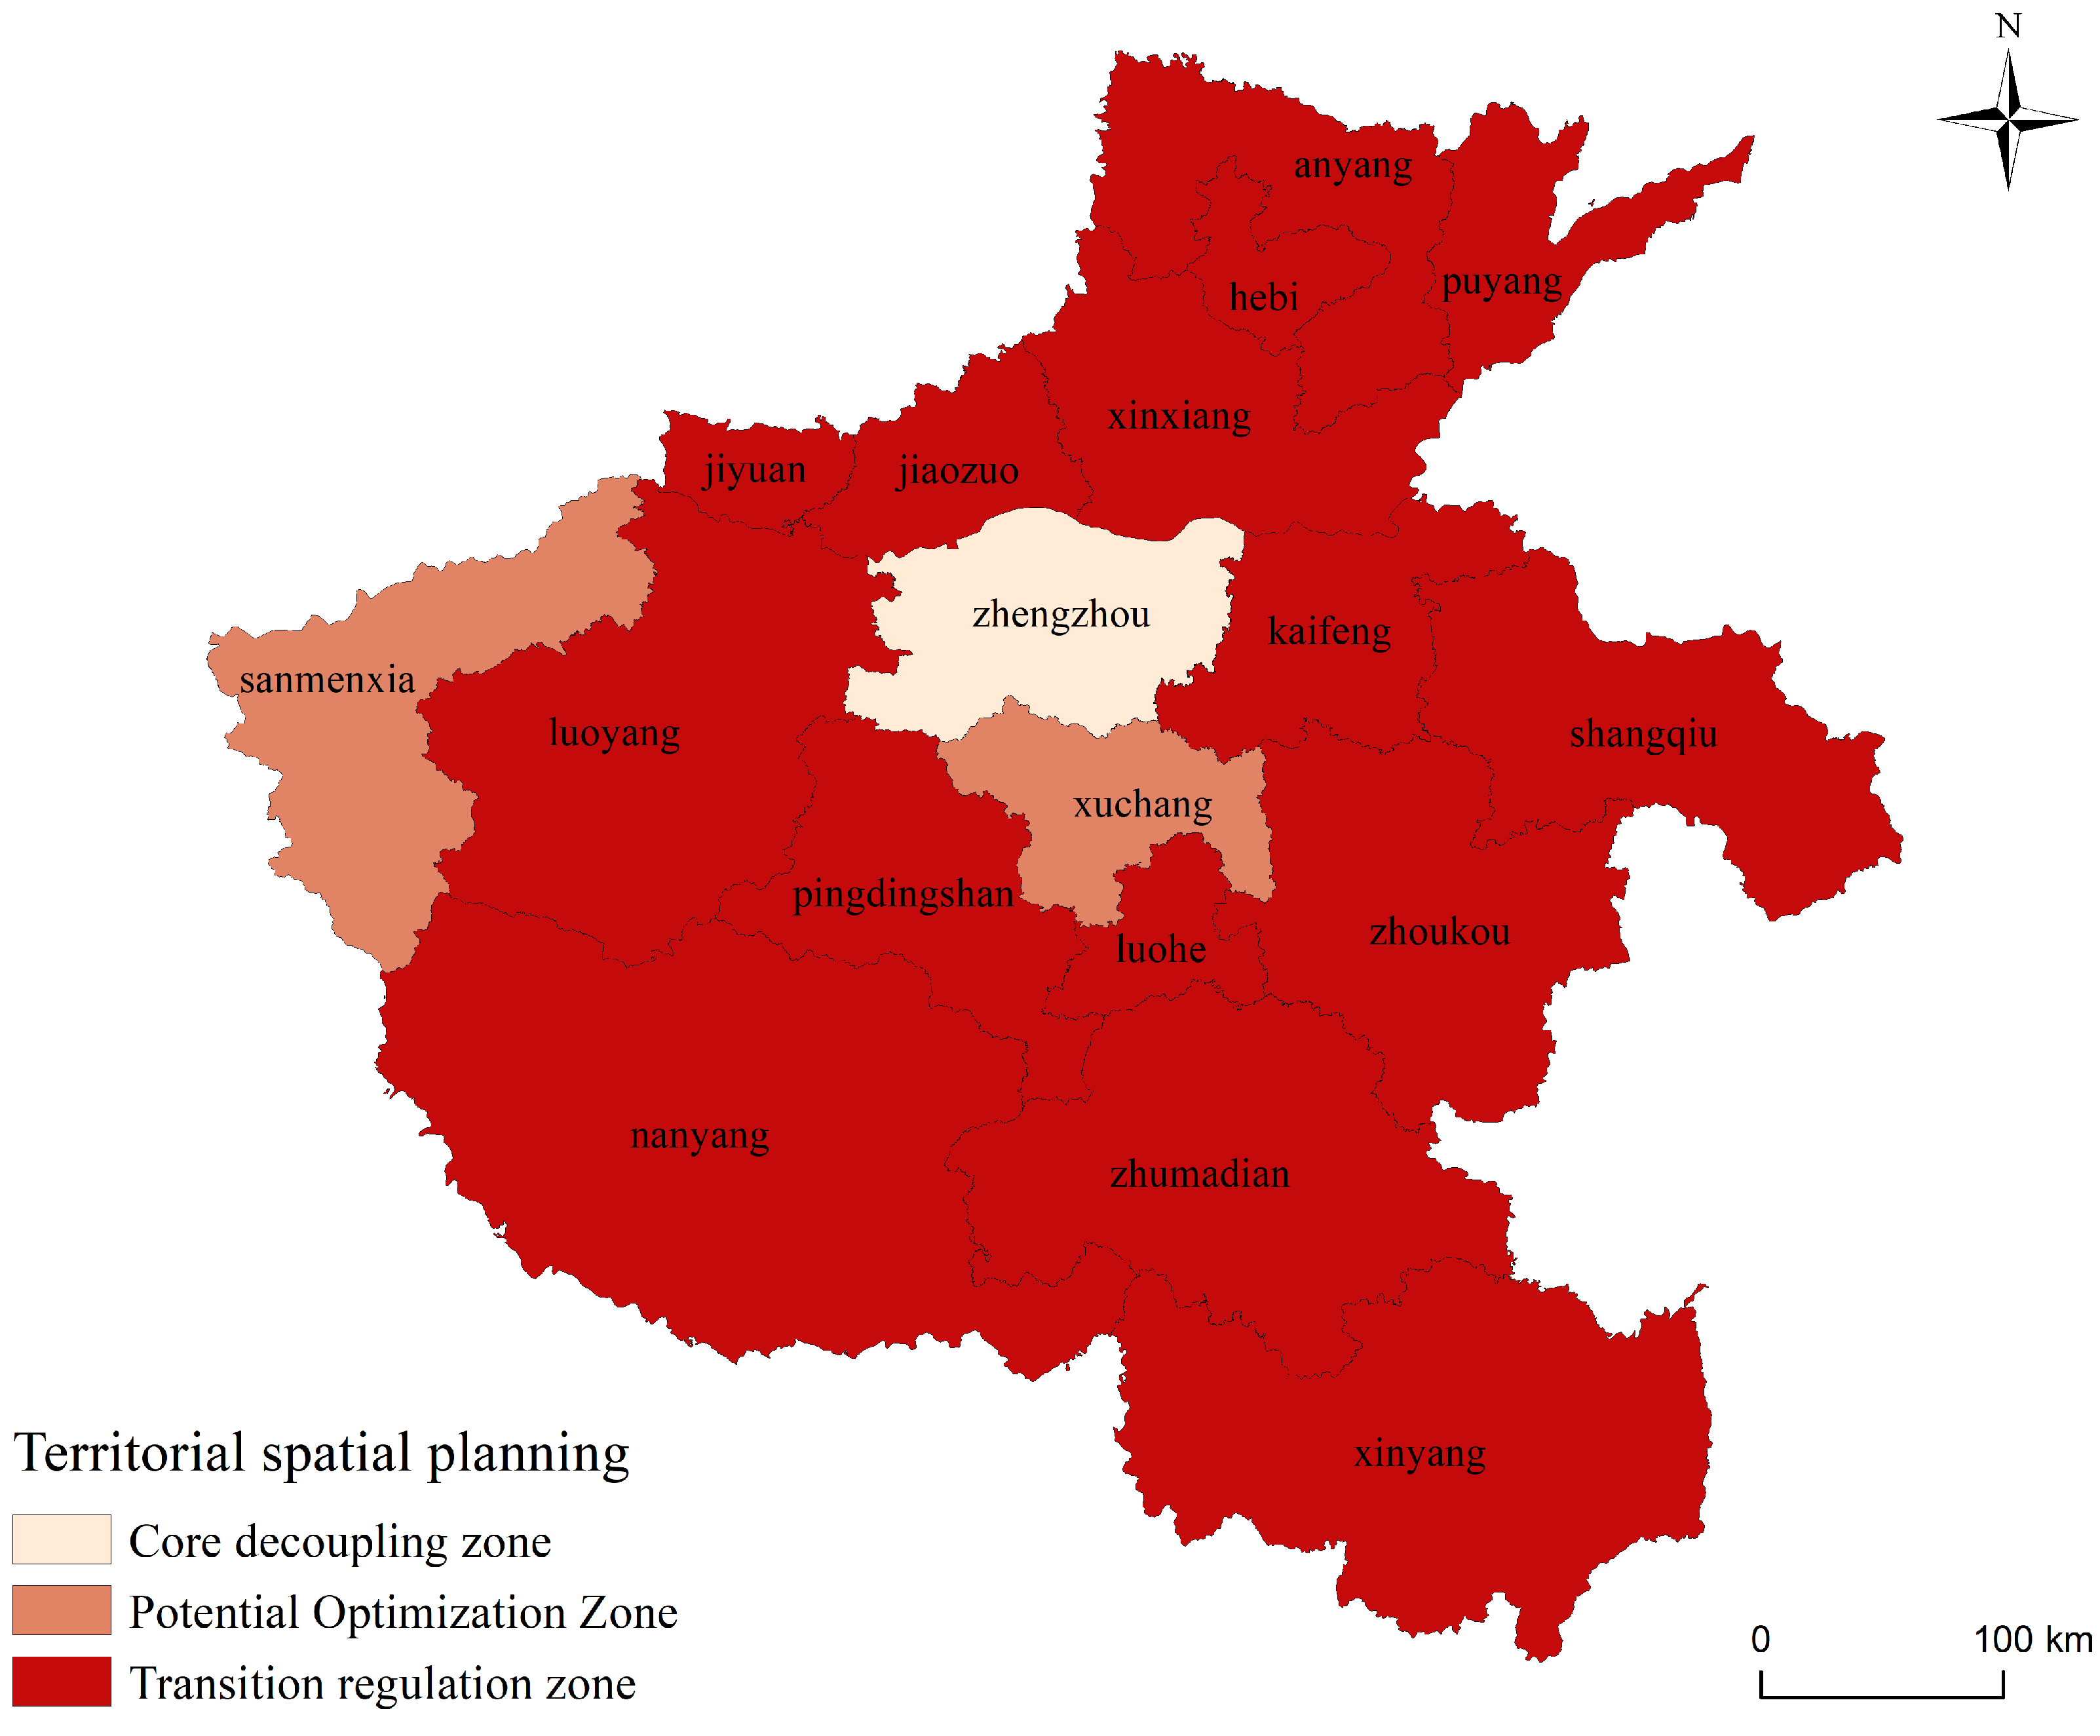
The decoupling relationship between CLUI and CUCE highlights the extent of harmony in regional cropland resource utilization. Understanding the patterns of this relationship is crucial for guiding cropland protection, utilization, and ecological coordination in Henan Province’s Territorial Spatial Planning. Due to the impacts of the COVID-19 pandemic, the objectivity and reliability of estimation results for the period 2020–2022 were reduced to some extent. To effectively avoid potential interference from data uncertainties during this period with the core conclusions of the study, this research draws on the complete evolutionary patterns and characteristics of the decoupling relationship between CUCE and CLUI from 2000 to 2019. By integrating Tapio decoupling types, thresholds of CLUI, and the spatial differentiation characteristics of carbon emission levels, an optimization pathway for territorial spatial planning was proposed from the perspective of zoned management. Accordingly, Henan Province is divided into three categories: Core Decoupling Zone, Potential Optimization Zone, and Transformation Regulation Zone (Figure 8, Table 5). Targeted strategies are implemented to regulate CLUI and integrate Territorial Spatial Planning. These measures aim to promote the formation of efficient cropland utilization and low-carbon emission patterns across regions. The criteria for delineating the Core Decoupling Zones were defined as areas that exhibited a strong decoupling state throughout the study period. The Potential Optimization Zones were identified as areas predominantly characterized by weak decoupling, expansive coupling, and recessive decoupling during the study period. In contrast, the Transition Regulation Zones were delineated as areas mainly dominated by expansive negative decoupling, strong negative decoupling, weak negative decoupling, and recessive coupling over the study period.
Based on Figure 8, the Core Decoupling Zone for CUCE and CLUI in Henan Province includes only Zhengzhou. This zone acts as a provincial benchmark for decoupling CLUI from CUCE, having largely achieved a virtuous pattern of high-intensity cropland utilization with low-carbon emissions. In the territorial spatial planning, it is vital to reinforce the established decoupling benefits. This involves prioritizing the establishment of modern agricultural industrial parks and smart agriculture demonstration areas. The adoption of precision farming techniques and low-carbon agricultural machinery will further enhance cropland utilization intensification and low-carbon emission patterns. Simultaneously, the planning reserves moderate space for agricultural technology innovation. This supports the R&D and application of green agricultural technologies while strengthening their technological spillover effects to neighboring regions. Such measures aim to drive province-wide improvements in decoupling performance.
The Potential Optimization Zone encompasses areas such as Sanmenxia and Xuchang. These areas hold potential for enhancing CLUI; however, they risk concurrent increases in carbon emissions with any growth in intensity. The primary challenge stems from the suboptimal quality of cropland and the dependence on high-carbon inputs. This zone serves as a key potential area for optimizing the decoupling relationship across the province. Planning should focus on unlocking decoupling potential. First, by constructing high-standard cropland, we can address key issues like poor soil fertility and outdated irrigation systems. Soil enhancement and upgraded water-efficient irrigation systems are implemented to achieve a consistent increase in CLUI without raising carbon emissions. Second, promoting low-carbon agricultural practices, such as straw incorporation and the substitution of chemical fertilizers with organic alternatives, will optimize the agricultural input structure, facilitating a transition from weak to strong decoupling.
The Transition Regulation Zone includes the majority of Henan Province. Due to policies including the protection of the Taihang Mountain ecological barrier and the development of the Xuchang urban area’s ecological green wedge, the Transition Regulation Zone faces a conflict between managing cropland use intensity and meeting ecological protection needs. This has resulted in temporary fluctuations in the decoupling relationship. The Territorial Spatial Planning requires balancing ecological protection and cropland utilization efficiency. It mandates strict implementation of ecological red line control and safeguarding of reforestation achievements. For retained croplands, ecological utilization transformation is promoted through eco-agriculture and circular agriculture practices, aiming to reduce per-unit cropland carbon emission intensity CUCE. Additionally, integrating cropland use with ecological tourism can enhance the ecological and economic value of cropland without compromising food production capacity.

3.4.2. Spatiotemporal Adaptability Adjustment of Cropland Utilization Policies

The temporal evolution of decoupling relationships between CUCE and CLUI in Henan Province reveals that the economic-environmental linkage logic of cropland utilization varies across different stages. This requires targeted adjustments to policy tools within Territorial Spatial Planning.
Short to Medium Term (2025–2030): Addressing the return of decoupling status in certain regions between 2020 and 2022, it is crucial to enhance the integration of policies regarding ecological compensation and cropland protection in the transition regulation areas of western and northern Henan. For example, in regions where CLUI has decreased due to farmland reforestation, it is essential to not only increase ecological compensation standards but also to formulate a plan to enhance cropland quality. Measures such as soil amelioration and fertility enhancement are promoted to lay a foundation for sustainable CLUI enhancement in the future. Moreover, drawing on the experiences of rapidly expanding strong decoupling regions, we should enhance policy incentives for low-carbon agricultural technologies in potential optimization areas. Incorporate the promotion of low-carbon agricultural technologies into the “Agricultural Special Action” of territorial spatial planning, and accelerate the adoption of technologies like precision irrigation and green pest control through fiscal subsidies and technical training, thus accelerating the decoupling process.
Long-term (2031–2035): With the aim of achieving proactive decoupling, it is imperative to establish pilot projects for policy innovation that foster low-carbon agricultural development in the core decoupling areas. Explore the cropland carbon accounting system to incorporate CUCE into the cropland protection assessment index system under Territorial Spatial Planning. Employ market-based tools such as carbon trading and carbon subsidies to prompt agricultural producers to actively reduce carbon emissions, thereby achieving long-term stability in the decoupling relationship.

4. Discussion

4.1. Optimization Strategies for CLUI in Henan Province

The study found that cultivated land use intensity in Henan Province during 2000–2022 exhibited spatial differentiation, which essentially resulted from the long-term coupled effects of natural endowment constraints and policy-guided regulation.
Policy interventions have been instrumental in altering CLUI. In Henan Province, a key national grain production hub, policies such as the High-quality Grain Industry Initiative and the High-standard Farmland Construction Program have been implemented. These policies, through soil enhancement and irrigation upgrades, have effectively increased the cropland’s carrying capacity. This provides a foundation for expanding sown area and increasing multiple cropping index. Concurrently, with the enforcement of agricultural subsidy policies and the growth of large-scale agricultural operations, land transfer rates have surged. Large-scale agricultural operators tend to maximize profits by increasing cropping intensity, leading to a gradual resurgence and surpassing of previous CLUI levels.
Based on the above analysis and considering the synergistic needs of food security and ecological protection in cropland utilization across Henan Province, optimization strategies are proposed from spatially differentiated control and technological upgrading perspectives. First, the government should increase agricultural infrastructure investment in CLUI low-value regions of Western and Southern Henan. Through land consolidation and terrace construction, terrain constraints are reduced, enhancing cropland connectivity and mechanization suitability while narrowing facility gaps with high-value regions. Such policies require local government financial support for infrastructure construction, entail moderate implementation costs, and involve land transfer coordination, necessitating careful consideration of farmers’ interests and placing relatively high demands on grassroots governance capacity. In the long term, however, they can effectively overcome topographic constraints, enhance the contiguity and mechanization suitability of cultivated land in peripheral areas, and narrow the development gap with core zones. Second, technological innovation and upgrading should be advanced. Specifically, the development and promotion of small-scale machinery for mountainous areas are prioritized to overcome the barriers imposed by terrain to mechanization. Technological innovation can be built upon the existing agricultural technology extension system, but it requires targeted development of small-scale agricultural machinery suitable for mountainous areas, which entails a certain R&D cycle. Furthermore, the implementation of low-carbon and environmentally friendly practices, such as crop rotation systems and precision fertilization, can facilitate the coordinated advancement of food security and ecological protection.

4.2. Low-Carbon Pathways for CUCE in Henan Province

The research indicates that CUCE in Henan Province from 2000 to 2022 followed a trend of initial increase and subsequent decrease, with notable variations between the southern and northern regions.
The northern and eastern plains of Henan Province, being the primary grain production zones, witness highly intensified and scaled agricultural activities. In these regions, the quest for maximizing grain output often entails the extensive use of agricultural inputs, which in turn leads to elevated carbon emissions. In regions such as southern and western Henan, the terrain is dominated by mountains and hills, resulting in relatively limited cropland area. Agricultural production in these areas is predominantly small-scale and decentralized, leading to relatively low input of agricultural materials. Consequently, carbon emissions remain relatively low. Additionally, natural factors such as climate conditions and soil types across different regions influence crop growth and the demand for agricultural materials, thereby affecting the spatial distribution of CUCE.
Based on this, two key strategies are proposed: Firstly, vigorously promote the resource utilization of agricultural residues by converting crop straw, livestock, and poultry manure into biomass energy, organic fertilizers, and other useful products. Simultaneously, popularize low-carbon agricultural technologies such as smart irrigation and precision fertilization to reduce fertilizer and pesticide use, thereby lowering carbon emissions. At the same time, strengthen measures to enhance farmland carbon sequestration by increasing soil organic carbon through practices such as straw incorporation, green manure cultivation, and deep tillage with soil improvement. Secondly, enhance and refine incentive and constraint mechanisms, optimizing policies like cropland rotation and cropping subsidies. Lump-sum incentives should be provided to large-scale operators who maintain reasonable cropland use intensity and stable yields. This approach will encourage farmers to move away from the indiscriminate pursuit of high cropland use intensity towards a more efficient and sustainable use of cropland, ensuring the viability of agricultural production over the long term.

4.3. Systematic Optimization of the Decoupling Nexus Between CLUI and CUCE in Henan Province

The research reveals that the decoupling nexus between CLUI and CUCE in Henan Province exhibited a trend of initial deterioration, followed by an improvement, and later fluctuations. As a leading agricultural province, Henan promptly aligns with the national initiative for sustainable agricultural development, implementing policies such as the Action Plan for Reducing Chemical Fertilizer and Pesticide Use while Enhancing Efficiency, and the Special Plan for Agricultural Non-point Source Pollution Control. By offering subsidies for fertilizer reduction and promoting green pest control technologies, Henan prompts the transformation of agricultural production methods through a dual approach of regulation and motivation.
With advances in agricultural technology, low-carbon agricultural practices such as precision fertilization and water-saving irrigation have become widespread. This has led to effective control over the input of agricultural materials, resulting in a slowdown in carbon emissions growth and even a decrease. CLUI has been enhanced through intensive management, improving the decoupling relationship between CUCE and CLUI, evolving towards either strong or weak decoupling. Following this improvement, the decoupling relationship enters a phase of periodic fluctuations. During this stage, affected by factors such as extreme weather events, fluctuations in agricultural product market prices, and changes in the cost of agricultural production factors, some regions may experience a rebound in the use of chemical fertilizers and pesticides to address short-term output fluctuations.
Considering the evolutionary characteristics of the decoupling relationship between CLUI and CUCE in Henan Province, the construction of a multi-level optimization system is required to achieve long-term stable decoupling and promote green, sustainable agricultural development. Firstly, implement differentiated green support policies. Establish a special fund for agricultural green transition in regions with low CLUI-CUCE decoupling levels. Provide special subsidies for low-carbon inputs—such as water-saving irrigation equipment, organic fertilizer application, and green pest control technologies—to reduce green transition costs. Meanwhile, create a technical assistance pairing mechanism between high-decoupling and low-decoupling agricultural zones. This promotes balanced diffusion of green development models across regions, enhancing the province’s overall decoupling level. Second, at the policy level, improve green incentive and constraint mechanisms for agriculture. Link the evaluation results of decoupling status to agricultural subsidies and project applications, and provide additional rewards to regions and business entities that show sustained improvement in decoupling status. Third, a carbon emission monitoring system should be established across the province’s cropland, utilizing advanced technologies like big data and the Internet of Things. The network system collects key carbon source data—including fertilizer and pesticide application rates, irrigation energy consumption, and agricultural machinery operation duration—in real time. This provides local agricultural departments with data support to implement precise policies and proactively address issues like excessive carbon input.
In the short term, priority should be given to optimizing subsidy policies and improving incentive and constraint mechanisms to quickly accumulate policy effects. In the medium term, investments in infrastructure and technical support in peripheral areas should be gradually increased to reduce regional disparities. In the long term, the construction of carbon source monitoring networks and the exploration of carbon trading pilots should be steadily advanced to establish a long-term mechanism driven by both policy guidance and market incentives. At the same time, it is necessary to strengthen grassroots implementation capacity, improve data-sharing mechanisms, and optimize funding arrangements according to the constraints of different policy levels to ensure the sustainability of policy implementation.

4.4. Research Limitations

This study explored the relationships among input reduction and efficiency enhancement, cultivated land use, and carbon emissions under the context of intensive agriculture in Henan Province, providing foundational insights for regional agricultural green transformation. However, considering the long-term requirements of the “dual carbon” goals and national food security strategy, there remain avenues for further research.
First, carbon emission calculations did not account for soil carbon sequestration in cultivated land, such as carbon fixed through straw incorporation, which may underestimate the ecological benefits of cultivated land. Second, the core function of the Tapio decoupling model is to identify the relative change relationship between two variables over a given period, representing a static analysis that cannot directly reveal the underlying drivers of the decoupling state. Future studies could combine the LMDI decomposition method to conduct quantitative analyses, further uncovering the key driving factors and pathways of decoupling between CLUI and CUCE under food security constraints.
Third, the emission factors used for calculating CUCE in this study were sourced from multiple channels. Due to limited resources, no localized calibration was conducted specifically for Henan Province, which may introduce deviations from actual conditions. Subsequent research could perform localized validation and calibration of core emission factors to improve the accuracy and reliability of results. Fourth, due to data limitations, this study only covers the past two decades, failing to capture longer-term cyclical fluctuations in the climate system, phase-based adjustments in land use policies, and other critical drivers at the county scale. Future work is recommended to extend the temporal coverage, refine the study regions, and incorporate climate variability scenarios to enhance model robustness.

5. Conclusions

This study focuses on the 18 prefecture-level municipalities in Henan Province, analyzing the spatial and temporal dynamics of CLUI and CUCE from 2000 to 2022. The Tapio decoupling model is employed to assess the decoupling relationship between CLUI and CUCE. In conjunction with the requirements of Territorial Spatial Planning, optimization strategies are proposed. The key findings are as follows:
The spatiotemporal evolution of CLUI in Henan Province exhibits fluctuating upward trends and intensified aggregation characteristics. From 2000 to 2022, CLUI shows a fluctuating upward trajectory, with intensity increasing from 1.887 to 1.948, primarily driven by sustained growth in sown area. Regional evolution trends reveal that overall CLUI in Henan undergoes a “high-low-high” evolutionary process. High-value zones have long centered on the Yudong Plain, forming a clumped aggregation pattern, while low-value zones distribute in ring patterns along provincial boundaries. The aggregation intensity of CLUI hotspots gradually deepens and undergoes spatial shifts, while coldspots continuously contract and eventually vanish.
The CUCE in Henan Province exhibit an initial increase followed by a decrease, with notable differences between the southern and northern regions. Over the study period, the CUCE in Henan Province showed an initial increase followed by a decrease, peaking around 2015. In terms of carbon emissions from various carbon sources, emissions from agricultural irrigation and sowing activities continue to increase. Emissions from other agricultural activities show a trend of first increasing and then decreasing, with a turning point around 2015. Among these, the use of chemical fertilizers and agricultural irrigation are the primary contributors to CUCE. Spatially, the CUCE in the southern region of Henan Province substantially exceed those in the northern region.
The decoupling relationship between CLUI and CUCE in Henan Province has been improving, following a trend of initial deterioration, subsequent optimization, and later fluctuations. From 2015 to 2022, Henan cropland use achieved an ideal state of strong decoupling, fostering coordinated economic and environmental development. However, from 2020 to 2022, this relationship shifted from strong decoupling to recessive decoupling, although it remains generally positive. Regionally, in the initial phase, the primary decoupling types were expansive and strong negative decoupling. Later, most areas of Henan experienced a mix of strong and weak decoupling, covering nearly the entire region.
The study, based on the decoupling relationship between CLUI and CUCE, proposes optimization paths for Territorial Spatial Planning through regionalized management and policy adjustments. Henan Province is categorized into three types of regions: key decoupling zones, areas with potential for optimization, and areas requiring transformational regulation. It is recommended that short-term policies focus on risk management, while long-term policies prioritize institutional innovation, creating a planning system that is spatially targeted and temporally appropriate. The analytical framework and judgment ideas constructed in this study based on the carbon emission driving logic of intensive cultivated land use have methodological reference significance for agriculturally intensive regions with large-scale grain production in the same latitude worldwide. However, due to the regional differences in natural endowments, agricultural policies and farming patterns, the direct applicability of specific quantitative conclusions needs to be adjusted according to the actual regional conditions.

Author Contributions

Conceptualization, Y.W.; methodology, Y.W.; software, Y.W.; validation, H.Z.; investigation, H.Z.; resources, H.Z.; data curation, H.Z.; writing—original draft preparation, Y.W.; writing—review and editing, Y.W.; visualization, H.Z.; supervision, H.Z.; project administration, H.Z.; funding acquisition, H.Z. All authors have read and agreed to the published version of the manuscript.

Funding

This work was supported by the Key Area Science and Technology Tackling Program of the Xinjiang Production and Construction Corps (2023CB008-22).

Data Availability Statement

The data used to support the findings of this study are available from the corresponding author upon request.

Conflicts of Interest

The authors declare no conflicts of interest.

References

  1. Li, S.; Wang, Z. The effects of agricultural technology progress on agricultural carbon emission and carbon sink in China. Agriculture 2023, 13, 793. [Google Scholar] [CrossRef] [Scilit]
  2. Sun, Y.; Su, X.; Xu, H. Correlation between levels of cultivated land intensive use and carbon emission efficiency in Hebei Province. Trans. Chin. Soc. Agric. Eng. 2016, 32, 258–267. [Google Scholar]
  3. Lu, X.; Kuang, B.; Li, J. Regional differences and its influencing factors of cultivated land use efficiency under carbon emission constraint. J. Nat. Resour. 2018, 33, 657–668. [Google Scholar]
  4. Gao, J.; Qiao, W.; Liu, Y.; Li, Y.-R.; Tu, W.; Zhang, Y.-X. The higher grain production, the more social deprivation? A case study of Henan province in traditional agricultural areas of China. J. Mt. Sci. 2018, 15, 167–180. [Google Scholar] [CrossRef] [Scilit]
  5. Lu, X.; Qu, Y.; Sun, P.; Yu, W.; Peng, W. Green transition of cultivated land use in the Yellow River Basin: A perspective of green utilization efficiency evaluation. Land 2020, 9, 475. [Google Scholar] [CrossRef] [Scilit]
  6. Al-Musawi, Z.K.; Vona, V.; Kulmány, I.M. Utilizing Different Crop Rotation Systems for Agricultural and Environmental Sustainability: A Review. Agronomy 2025, 15, 1966. [Google Scholar] [CrossRef] [Scilit]
  7. Gavrilescu, M. Water, Soil, and Plants Interactions in a Threatened Environment. Water 2021, 13, 2746. [Google Scholar] [CrossRef] [Scilit]
  8. Kleijn, D.; Kohler, F.; Báldi, A.; Batáry, P.; Concepción, E.; Clough, Y.; Díaz, M.; Gabriel, D.; Holzschuh, A.; Knop, E.; et al. On the relationship between farmland biodiversity and land-use intensity in Europe. Proc. R. Soc. B Biol. Sci. 2009, 276, 903–909. [Google Scholar] [CrossRef] [Scilit] [PubMed]
  9. Felipe-Lucia, M.R.; Soliveres, S.; Penone, C.; Fischer, M.; Ammer, C.; Boch, S.; Boeddinghaus, R.S.; Bonkowski, M.; Buscot, F.; Fiore-Donno, A.M.; et al. Land-use intensity alters networks between biodiversity, ecosystem functions, and services. Proc. Natl. Acad. Sci. USA 2020, 117, 28140–28149. [Google Scholar] [CrossRef] [Scilit] [PubMed]
  10. Zhuang, D.; Liu, J. Study on the Model of Regional Differentioation of Land Use Degree in China. J. Nat. Resour. 1997, 12, 10–16. [Google Scholar]
  11. Jiang, L.; Deng, X.; Seto, K.C. The impact of urban expansion on agricultural land use intensity in China. Land Use Policy 2013, 35, 33–39. [Google Scholar] [CrossRef] [Scilit]
  12. Xu, E.; Zhang, H. Aggregating land use quantity and intensity to link water quality in upper catchment of Miyun Reservoir. Ecol. Indic. 2016, 66, 329–339. [Google Scholar] [CrossRef] [Scilit]
  13. Li, Y.; Zhang, B.; Qin, S.; Li, L.; Huang, H. Review of research and application of forest canopy closure and its measuring methods. World For. Res. 2008, 21, 40–46. [Google Scholar]
  14. Xu, Y.; Huang, H.; Dai, Q.; Guo, Z.-D.; Zheng, Z.-W.; Pan, Y.-C. Spatial-temporal variation in net primary productivity in terrestrial vegetation ecosystems and its driving forces in southwest China. Environ. Sci. 2023, 44, 2704–2714. [Google Scholar]
  15. Neumann, K.; Verburg, P.H.; Stehfest, E.; Müller, C. The yield gap of global grain production: A spatial analysis. Agric. Syst. 2010, 103, 316–326. [Google Scholar] [CrossRef] [Scilit]
  16. Erb, K.; Haberl, H.; Jepsen, M.; Kuemmerle, T.; Lindner, M.; Müller, D.; Verburg, P.H.; Reenberg, A. A conceptual framework for analysing and measuring land-use intensity. Curr. Opin. Environ. Sustain. 2013, 5, 464–470. [Google Scholar] [CrossRef] [Scilit]
  17. Huang, H.; Jia, J.; Chen, D.; Liu, S. Evolution of spatial network structure for land-use carbon emissions and carbon balance zoning in Jiangxi Province: A social network analysis perspective. Ecol. Indic. 2024, 158, 111508. [Google Scholar] [CrossRef] [Scilit]
  18. Martinez-Harms, M.J.; Bryan, B.A.; Figueroa, E.; Pliscoff, P.; Runting, R.K.; Wilson, K.A. Scenarios for land use and ecosystem services under global change. Ecosyst. Serv. 2017, 25, 56–68. [Google Scholar] [CrossRef] [Scilit]
  19. Wang, Q.; Yang, C.; Wang, M.; Zhao, L.; Zhao, Y.-C.; Zhang, Q.-P.; Zhang, C.-Y. Decoupling analysis to assess the impact of land use patterns on carbon emissions: A case study in the Yellow River Delta efficient eco-economic zone, China. J. Clean. Prod. 2023, 412, 137415. [Google Scholar] [CrossRef] [Scilit]
  20. Yang, J.; Huang, X. The 30 m annual land cover dataset and its dynamics in China from 1990 to 2019. Earth Syst. Sci. Data 2021, 13, 3907–3925. [Google Scholar] [CrossRef] [Scilit]
  21. Bai, J.; Chen, H.; Gu, X.; Ji, Y.; Zhu, X. Temporal and spatial characteristics of carbon emissions from cultivated land use and their influencing factors: A case study of the Yangtze River Delta region. Int. Rev. Econ. Financ. 2024, 96, 103501. [Google Scholar] [CrossRef] [Scilit]
  22. West, T.; Marland, G. A synthesis of carbon sequestration, carbon emissions, and net carbon flux in agriculture: Comparing tillage practices in the United States. Agric. Ecosyst. Environ. 2002, 91, 217–232. [Google Scholar] [CrossRef] [Scilit]
  23. Li, B.; Zhang, J.; Hai, P. Research on Spatial-temporal Characteristics and Affecting Factors Decomposition of Agricultural Carbon Emission in China. China Popul. Resour. Environ. 2011, 21, 80–86. [Google Scholar]
  24. IPCC. Climate Change 2013: The Physicle Science Basis Technical Summary; IPCC: Geneva, Switzerland, 2013. [Google Scholar]
  25. Zhi, J.; Gao, J. Analysis of Carbon Emission Caused by Food Consumption in Urban and Rural Inhabitants in China. Prog. Geogr. 2009, 28, 429–434. [Google Scholar]
  26. Dubey, A.; Lal, R. Carbon footprint and sustainability of agricultural production systems in Punjab, India, and Ohio, USA. J. Crop Improv. 2009, 23, 332–350. [Google Scholar] [CrossRef] [Scilit]
  27. Zhang, C.; He, H. The evolution of spatiotemporal patterns and the influencing factors of the multiple cropping index of cultivated land in Southwest China. Agric. Res. Arid. Areas 2020, 38, 222–230. [Google Scholar]
  28. Yi, J.; Guo, J.; Ou, M.; Shen, L. Urban expansion and arable land use intensity: Adjustment effect of industrial development and farmers’ resource endowment. China Popul. Resour. Environ. 2018, 28, 56–64. [Google Scholar]
  29. Tapio, P. Towards a theory of decoupling: Degrees of decoupling in the EU and the case of road traffic in Finland between 1970 and 2001. Transp. Policy 2005, 12, 137–151. [Google Scholar] [CrossRef] [Scilit]
  30. Zhao, X.; Wen, J.; Xie, P.; Cai, G. Construction and application of decoupling model between sustainable development and carbon emissions. Resour. Sci. 2024, 46, 2194–2209. [Google Scholar]
  31. Wang, Q.; Su, M. Drivers of decoupling economic growth from carbon emission–an empirical analysis of 192 countries using decoupling model and decomposition method. Environ. Impact Assess. Rev. 2020, 81, 106356. [Google Scholar] [CrossRef] [Scilit]
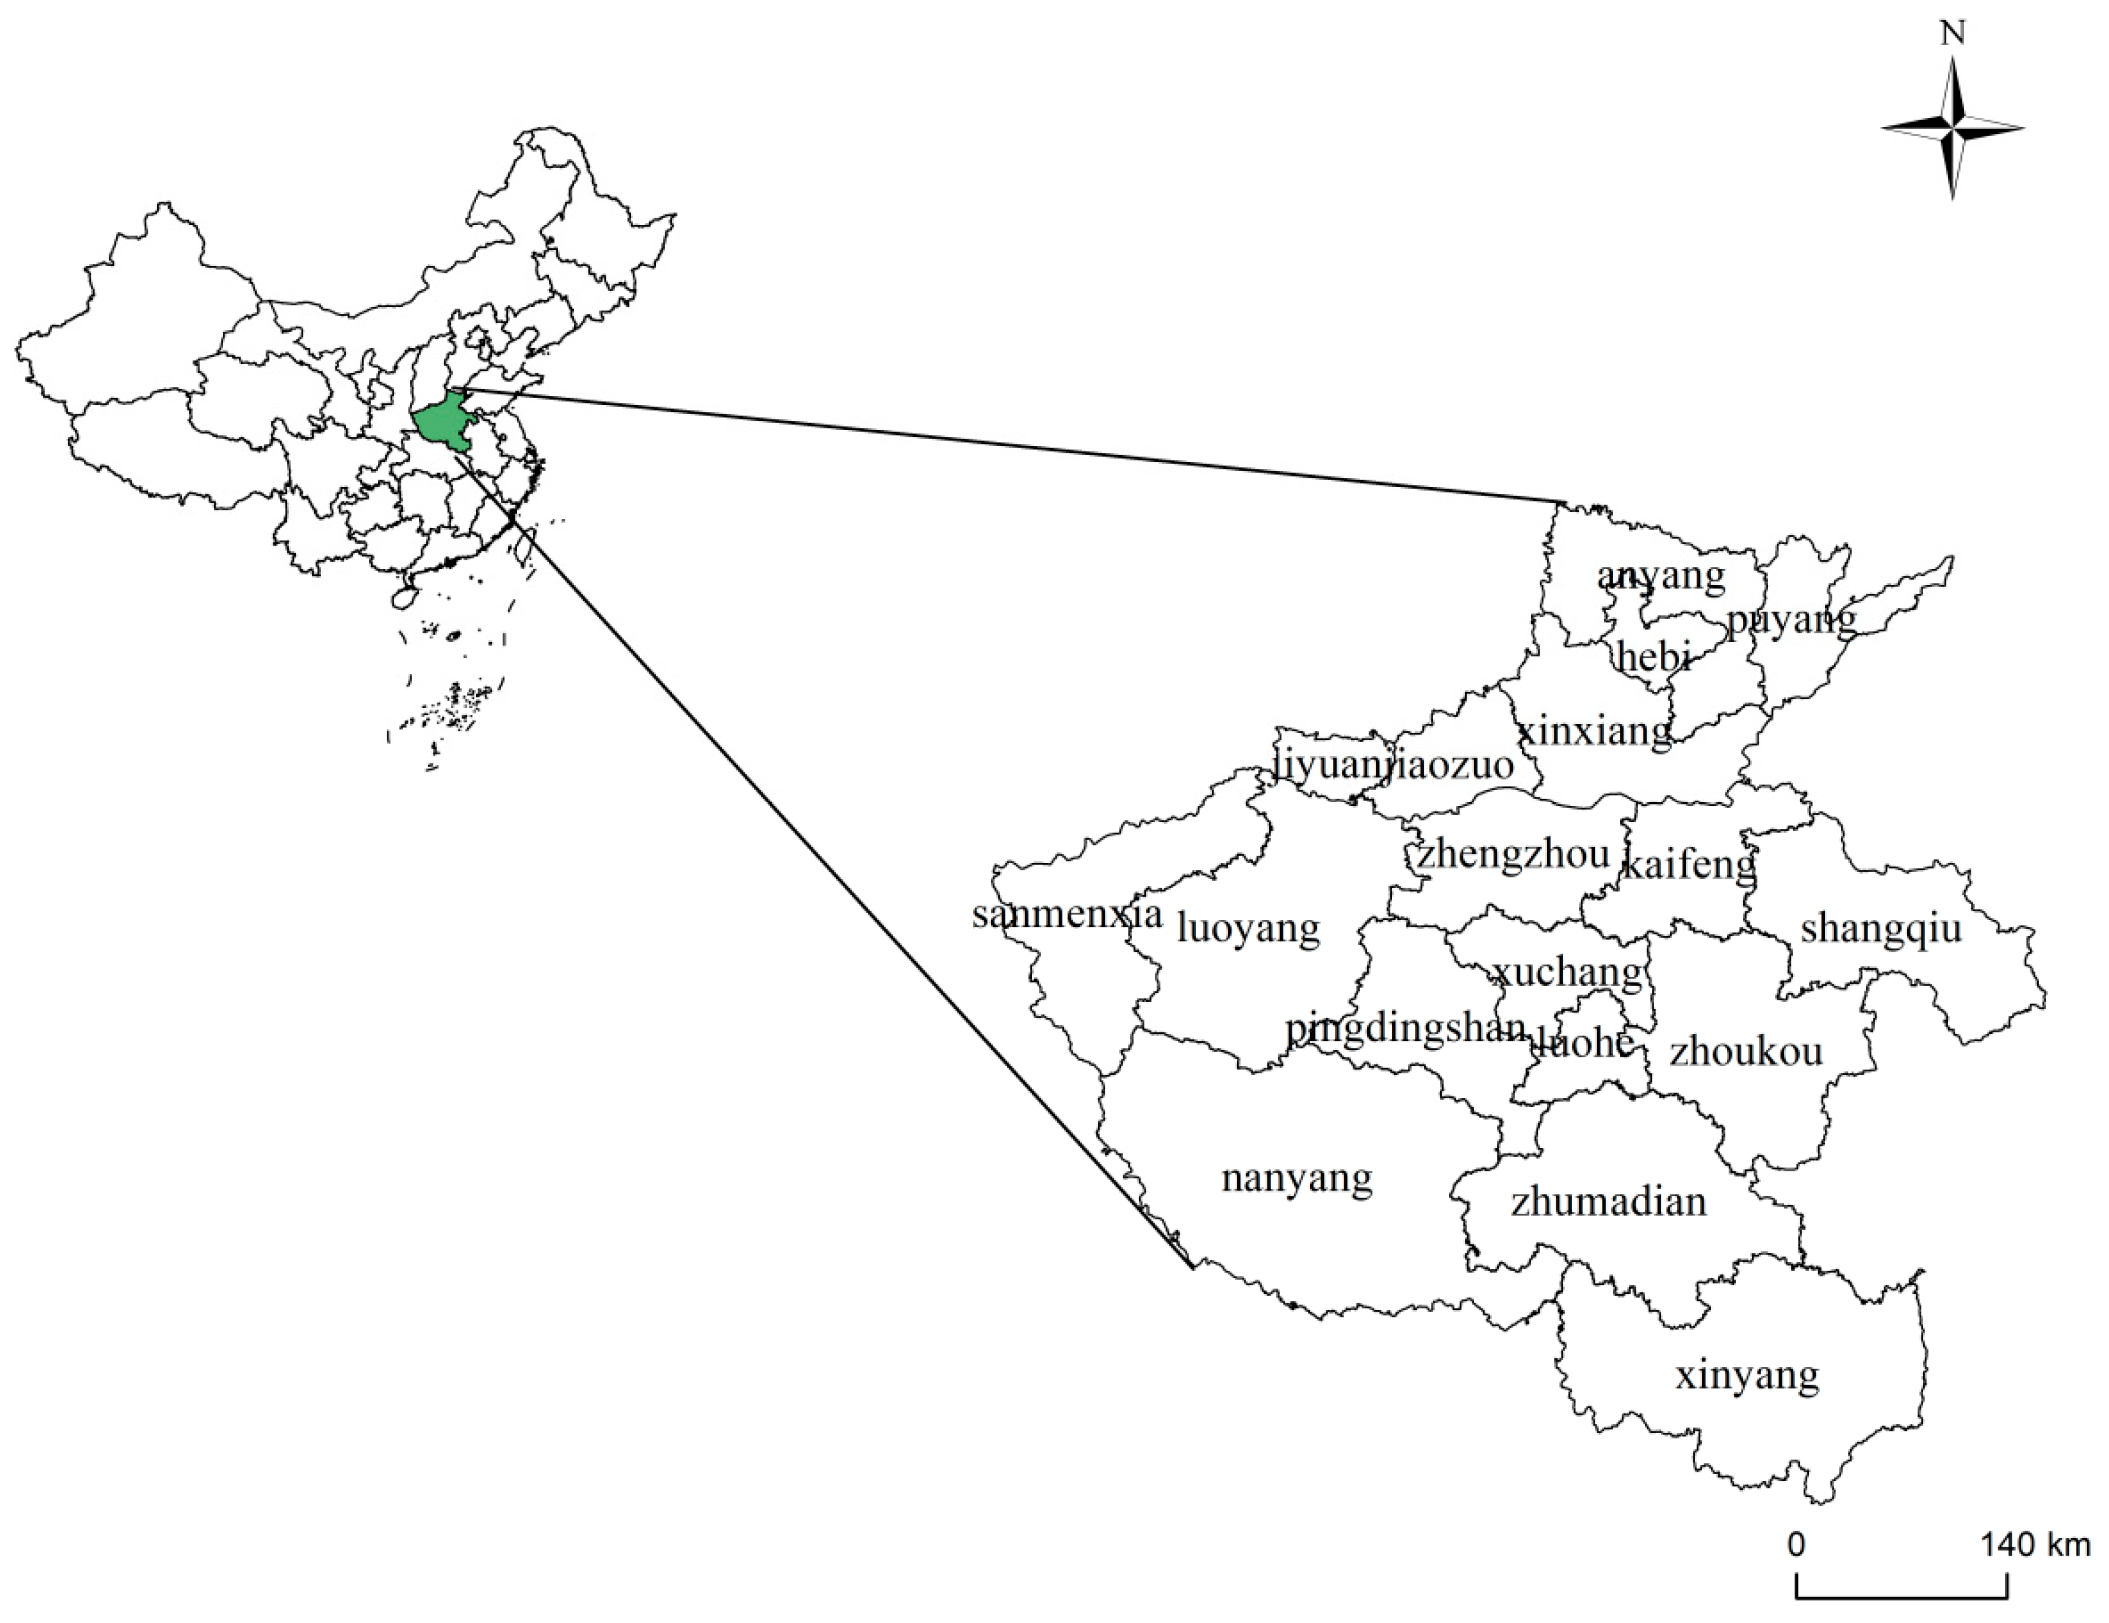
Figure 1. Overview of Henan Province’s Regional Profile.
Land 15 00133 g001
Figure 2. Trends in Cropland Use Intensity in Henan Province from 2000 to 2022.
Land 15 00133 g002
Figure 3. Spatial Evolution of Cropland Use Intensity in Henan Province from 2000 to 2022.
Land 15 00133 g003
Figure 4. Hot Spot Areas of CLUI in Henan Province from 2000 to 2022.
Land 15 00133 g004
Figure 5. Trends in Carbon Emissions from Different Carbon Sources in Cropland Use in Henan Province from 2000 to 2022.
Land 15 00133 g005
Figure 6. Spatial Evolution Characteristics of CUCE in Henan Province from 2000 to 2022.
Land 15 00133 g006
Figure 7. Spatial Evolution Characteristics of the Decoupling Relationship between CUCE and CLUI in Henan Province from 2000 to 2022.
Land 15 00133 g007
Figure 8. Henan Province Territorial Spatial Planning.
Land 15 00133 g008
Table 1. Data Sources.
Data NameAccuracyData Source
Land Use Data30 m × 30 mAnnual China Land Cover Dataset (CLCD) [20]
Administrative Boundary DataScientific Data Center for Resources and Environmental Sciences, Chinese Academy of Sciences (SDCRES, CAS)
Agricultural DataNational and Henan Provincial Statistical Yearbooks
Table 2. Carbon Emission Factors of Different Carbon Sources.
Carbon Source TypeCarbon Emission Coefficient ( η i )UnitData Source
Fertilizer0.89kg/kgOak Ridge National Laboratory (ORNL) [22]
Pesticides4.95kg/kgORNL [22]
Agricultural Films5.18kg/kgResearch from Nanjing Agricultural University [23]
Diesel0.59kg/kgIPCC 2013 “Greenhouse Gas Inventory Report” [24]
Agricultural Sowing312.60kg/km2Calculations based on field experiments from China Agricultural University [25]
Agricultural Irrigation266.48kg/hm2Related research by scholars [26]
Table 3. Classification Criteria for Decoupling Status.
Decoupling TypeVariable Change CharacteristicsElasticity Coefficient RangeDevelopment Significance
Strong Decoupling Δ C L U I > 0 ,   Δ C U C E < 0 η < 0 CLUI and environmental pressure are decoupled, which is the most ideal state.
Weak Decoupling Δ C L U I > 0 ,   Δ C U C E > 0 0   <   η   <   0 .8CLUI dominates, with a slowdown in the growth rate of environmental pressure.
Expansion Connection Δ C L U I > 0 ,   Δ C U C E > 0 0.8     η     1 .2CLUI and environmental pressure grow in sync.
Expansion Negative Decoupling Δ C L U I > 0 ,   Δ C U C E > 0 η   >   1 .2CLUI rises slowly but environmental pressure surges.
Strong Negative Decoupling Δ C L U I < 0 ,   Δ C U C E > 0 η < 0 CLUI decreases while environmental pressure increases.
Weak Negative Decoupling Δ C L U I < 0 ,   Δ C U C E < 0 0   <   η   <   0 .8The rate of decrease in CLUI is faster than that of environmental pressure.
Recession Connection Δ C L U I < 0 ,   Δ C U C E < 0 0.8     η   ≤ 1.2CLUI and environmental pressure decrease in sync.
Recession Decoupling Δ C L U I < 0 ,   Δ   C U C E < 0 η > 1.2The rate of decrease in CLUI is slower than that of environmental pressure.
Table 4. Decoupling Results of CLUI and CUCE in Henan Province, 2000–2022.
Research PeriodΔCLUCEΔCLUI η Decoupling Status
2000–20050.148−0.073−2.641Strong Negative Decoupling
2005–20100.258−0.017−17.607Strong Negative Decoupling
2010–20150.0700.0213.178Expansion Negative Decoupling
2015–2020−0.0880.134−0.761Strong Decoupling
2020–2022−0.062−0.0145.249Recessive Decoupling
Table 5. Decoupling Results of CLUI and CUCE and Regional Classification in Henan Province, 2000–2019.
Study AreaDecoupling StateCorresponding ZoneStudy AreaDecoupling StateCorresponding Zone
ZhengzhouStrong DecouplingCore Decoupling ZoneXuchangExpansion ConnectionPotential Optimization Zone
KaifengExpansion Negative DecouplingTransition Regulation ZoneLuoheStrong Negative DecouplingTransition Regulation Zone
LuoyangExpansion Negative DecouplingTransition Regulation ZoneSanmenxiaExpansion ConnectionPotential Optimization Zone
PingdingshanExpansion Negative DecouplingTransition Regulation ZoneNanyangExpansion Negative DecouplingTransition Regulation Zone
AnyangExpansion Negative DecouplingTransition Regulation ZoneShangqiuExpansion Negative DecouplingTransition Regulation Zone
HebiStrong Negative DecouplingTransition Regulation ZoneXinyangStrong Negative DecouplingTransition Regulation Zone
XinxiangExpansion Negative DecouplingTransition Regulation ZoneZhoukouExpansion Negative DecouplingTransition Regulation Zone
JiaozuoExpansion Negative DecouplingTransition Regulation ZoneZhumadianExpansion Negative DecouplingTransition Regulation Zone
PuyangExpansion Negative DecouplingTransition Regulation ZoneJiyuanStrong Negative DecouplingTransition Regulation Zone
Disclaimer/Publisher’s Note: The statements, opinions and data contained in all publications are solely those of the individual author(s) and contributor(s) and not of MDPI and/or the editor(s). MDPI and/or the editor(s) disclaim responsibility for any injury to people or property resulting from any ideas, methods, instructions or products referred to in the content.