Abstract
Promoting the coordinated development of tourism and enhancing residents’ prosperity has become a critical issue in the contemporary era. This study examines five northwestern provinces in China, constructing an index system to measure the dynamic interplay between common prosperity and tourism development. A Geographically and Temporally Weighted Regression (GTWR) model was employed to analyze the key driving factors influencing the coupling coordination between common prosperity and tourism development levels. The results revealed the following: (1) From 2012 to 2022, the level of common prosperity in the five northwestern provinces exhibited an upward trend, while tourism development levels initially increased and then declined. Shaanxi Province had the highest levels of both common prosperity and tourism development, whereas Qinghai Province had the lowest. (2) Although coupled coordination between common prosperity and tourism development has improved, it remains relatively low. Shaanxi Province exhibits superior coupling coordination compared to the other provinces. (3) The analysis of influencing factors indicates that the proportion of tourism income has the most significant impact on the coupling coordination between common prosperity and tourism development. Moreover, the degree and direction of the influence of various factors on coupling coordination differ across regions. Based on these findings, measures are proposed to enhance the coordinated development of tourism and common prosperity in the northwestern provinces.
1. Introduction
In his report at the 20th National Congress of the Communist Party of China, General Secretary Xi Jinping explicitly emphasized that achieving common prosperity is both a fundamental requirement of socialism and a significant feature of Chinese modernization [1]. The “14th Five-Year Plan for National Economic and Social Development and the Long-Range Objectives Through 2035” further emphasizes the necessity of actively and systematically reducing income disparities, ensuring a more equitable distribution of development gains and continuously enhancing people’s sense of fulfillment, happiness, and security [2]. In this contemporary era, while material living standards remain a key focus, there is a growing societal emphasis on spiritual enrichment and cultural well-being as integral components of prosperity. Tourism, due to its substantial multiplier effect on related industrial chains, has been recognized as a strategic pillar industry of the national economy and a “happiness industry” that improves residents’ quality of life [3]. Consequently, an in-depth exploration of the driving role of tourism in promoting common prosperity and the interactive relationship between the two has emerged as a critical research focus in geography and tourism studies.
Common prosperity, characterized by distinct Chinese attributes, represents a fundamental aspiration for an improved quality of life among the population [4]. In the contemporary phase of development, scholars have conducted extensive research on conceptual interpretations, categorical attributes, implementation pathways, and evaluation index system construction [5,6,7]. Existing research emphasizes that common prosperity should encompass not only material and spiritual enrichment but also address “comprehensively developed individuals” and “sustainability”. Achieving equitable income distribution while elevating overall affluence levels is a vital mechanism for advancing common prosperity [8]. Furthermore, as a multidimensional concept spanning political, economic, cultural, and social dimensions, common prosperity requires comprehensive industrial support systems. Regarding measurement frameworks, scholars primarily analyze development through dimensions such as material and spiritual wealth, social security, developmental capacity, shareability, and sustainability [5,9,10]. Empirical findings indicate that China has demonstrated continuous improvement in common prosperity levels, exhibiting an east–high, west–low spatial distribution pattern. Meanwhile, overall disparities have shown a narrowing trend, primarily attributable to inter-regional differences [10]. Additionally, economic and balancing effects serve as positive driving forces for this enhancement [11]. As China transitions to a mass tourism era, the tourism industry, functioning both as a strategic pillar and a well-being industry, plays a pivotal role in enhancing material living standards and fulfilling aspirations for better lives [3]. Its strong industrial linkages and extensive tourism coverage are key mechanisms for income generation, employment expansion, and urban–rural disparity reduction [12]. Quantitative research on tourism development has evolved from singular metrics (e.g., domestic/inbound tourism revenue and visitor numbers) to multi-factor, multidimensional, and multi-perspective analytical frameworks [13,14,15]. Methodological approaches predominantly employ economic geography and regional economics perspectives, utilizing techniques such as the entropy method, principal component analysis, analytic hierarchy process, Markov chains, and the Dagum–Gini coefficient [12,16,17]. While existing studies have made significant achievements in both qualitative and quantitative assessments of tourism development at the provincial, urban agglomeration, and specialized tourism typology levels, divergent research regions and perspectives continue to produce heterogeneous conclusions regarding tourism development levels and their driving mechanisms.
In the contemporary development stage, addressing issues of inadequate and imbalanced development, along with the bidirectional interaction between tourism development and common prosperity, have become focal points in academic research. Scholars have primarily examined the role of tourism in promoting economic growth, reducing household income disparities, and enriching residents’ spiritual and cultural lives [18,19]. Specifically, the tourism industry contributes to regional economic development by stimulating consumption growth, fostering service sector prosperity, creating substantial employment opportunities, and facilitating dual economic circulation [20]. Moreover, as a modern service industry driven by consumer mobility, tourism possesses wealth-distributing characteristics by supporting sustainable economic development and increasing household income, fostering holistic human development, and achieving income and wealth redistribution through market-oriented mechanisms, thereby narrowing income gaps and advancing common prosperity [21]. However, some scholars argue that regions with tourism-dominated economies and relative economic advancement often attract greater tourism investment, potentially exacerbating inter-regional development disparities [22]. Moreover, tourism promotes the preservation of intangible cultural heritage, festivals, and folk customs, which strengthen cultural confidence and enrich spiritual well-being [23]. While prior studies have established robust theoretical foundations and measurement methodologies for both common prosperity and tourism development, existing research predominantly emphasizes unilateral analyses of either concept. A deeper understanding of their coordinated relationships and the spatiotemporal evolution of driving factors remains underexplored.
As critical components of the Silk Road Economic Belt, the five northwestern provinces possess abundant natural and cultural tourism resources. However, their socioeconomic development levels remain uneven and lag behind those of eastern coastal regions. Existing studies have primarily focused on tourism efficiency, the spatial distribution of tourism resources, and competitiveness in these provinces [24,25,26], whereas research on tourism-driven improvements in livelihood well-being remains limited. To address this gap, this study constructs a dual indicator system to evaluate the spatiotemporal patterns of common prosperity and tourism development levels. A Geographically and Temporally Weighted Regression (GTWR) model is employed to analyze the factors influencing the coupling coordination between these two systems. These findings provide a theoretical reference for high-quality tourism development and the reduction in regional disparity.
2. Materials and Methods
2.1. Study Area
The five northwestern provinces (Shaanxi, Gansu, Qinghai, Ningxia, and Xinjiang) span 73°15′–111°15′ E and 31°32′–49°10′ N, covering over 30% of China’s total land area (Figure 1). Characterized by temperate monsoon and continental climates, the region exhibits a diverse and heterogeneous landscape composition [27]. These unique climatic and topographic conditions provide the provinces with abundant historical and cultural heritage sites and natural resources. As of February 2024, there are 46 5A-rated tourist attractions in the five northwestern provinces, and the tourism resources in each province are characterized by their uniqueness while also exhibiting some overlap. However, geographical constraints have led to persistent disparities in tourism development levels, service quality, infrastructure development, and resident living standards across provinces.
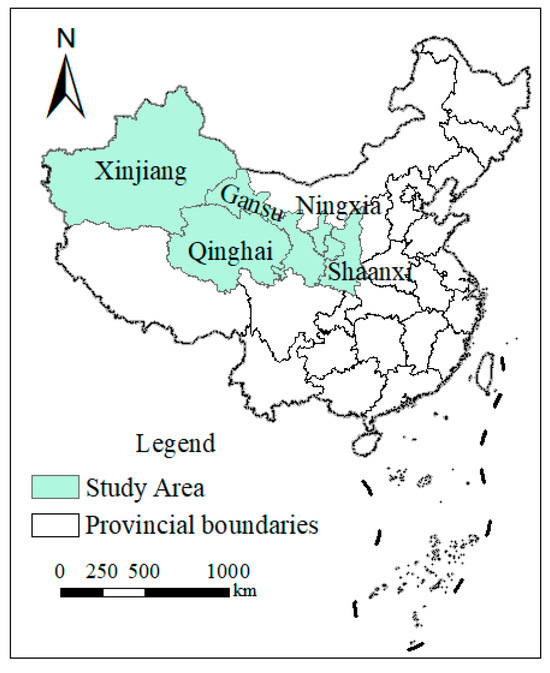
Figure 1.
Location map of the research area.
2.2. Indicator System Construction
Based on the connotations of common prosperity and the developmental goals outlined in the 20th National Congress report on China’s objectives for 2035, this study constructs an evaluation index system for assessing residents’ common prosperity. This system was developed by referencing existing research while adhering to the principles of data science, availability, and comprehensiveness [4,5]. It comprises 18 measurement indicators across the following three dimensions: developmental, shared, and sustainable (Table 1). Among these, the development level reflects regional economic development or wealth status. The Engel coefficient within the development dimension is adopted from existing research [28]. Sharedness, the central issue in achieving common prosperity, reflects how economic, healthcare, educational, and cultural achievements better benefit all people. Lastly, sustainable development is closely linked to achieving common prosperity within a region.

Table 1.
Indicator system for common prosperity and tourism development level (2012–2022).
To assess the tourism development levels, this study constructs an evaluation index system based on relevant research [29,30], incorporating the following three dimensions: tourism economy, reception capacity, and infrastructure (Table 1). In this context, the tourism economy primarily reflects the development level of the regional tourism industry, which indicates the service quality and scale of the local tourism sector, whereas infrastructure assesses the convenience of tourism in the area. This study employs the entropy weight method to determine the weights assigned to various indicators (Table 1).
The data used in this study were obtained from the China Statistical Yearbook, China Education Statistical Yearbook, China Tourism Statistical Yearbook, China Environmental Statistical Yearbook, and China City Statistical Yearbook for the years 2013 to 2023. A small portion of the missing data was estimated using the linear interpolation method.
2.3. Research Methodology
2.3.1. Entropy Weight Method
To ensure objectivity in the evaluation process, this study utilized the entropy weight method, an objective weighting technique, to determine the weights of the indicators. The procedure began with data standardization based on the relevant literature to eliminate dimensional interference. Subsequently, the weights of the indicators were calculated using information entropy [31]. The specific formulae involved in this process are as follows:
where Rij is the proportion of the j-th indicator in the i-th year; Aj denotes the entropy of the j-th indicator; Ej signifies the redundancy of the entropy value of the j-th indicator; Wj is the weight assigned to the j-th indicator; F represents the composite score for common prosperity or the overall level of tourism development; Xij′ indicates the standardized value of the j-th indicator in the i-th year.
2.3.2. Coupling Coordination Model
The coupling coordination degree model can reveal the interactions and coordinated development level between different systems [32]. This study employs a coupling coordination model to analyze the coordinated development status between residents’ common prosperity and tourism development. The calculation formula is as follows:
where C represents the coupling degree, and P and Q denote the common prosperity and tourism development systems, respectively.
To objectively reflect the level of coordinated development between the two systems of common prosperity and tourism development, this study introduces a coupled coordination degree model. The specific calculations are as follows:
where D represents the degree of coupling coordination between common prosperity and tourism development, ranging from 0 to 1; T denotes the comprehensive coordination index of the system; α and β represent the contribution degrees of common prosperity and tourism development to the coupling coordination degree, respectively. Considering the importance of both social development and the findings of previous studies, α and β are both set to 0.5. To describe the stages of common prosperity and tourism development more accurately, the coupling coordination degree was divided into ten levels (Table 2) based on previous research.
Table 2.
Coupling coordination degree level.
2.3.3. Geographically and Temporally Weighted Regression Model
The Geographically and Temporally Weighted Regression (GTWR) model accounts for both spatial and temporal non-stationarity, providing a more accurate reflection of the spatiotemporal variation in the effects of independent variables on the dependent variable [33]. Since the variables in this study vary across regions and time, the GTWR model is employed to explore the influencing factors of the coupling coordination degree between tourism development and common prosperity in different regions. The specific calculations are as follows:
where (ui, vi, ti) represent the spatiotemporal coordinates of the i-th sample point; ui, vi, ti denote the longitude, latitude, and time of the i-th sample point, respectively; b0(ui, vi, ti) is the regression constant of the i-th sample point; Xit denotes the value of the k-th independent variable at the i-th point; εi is the residual term. bk(ui, vi, ti) represents the k-th regression parameter for the i-th sample point and is estimated as follows:
where (ui, vi, ti) denotes the estimation of bk; X is the matrix of independent variables, Xt denotes the transpose of the matrix, and Y is the matrix formed by the sample data; W(ui, vi, ti) denotes the spatiotemporal weight matrix.
A Gaussian distance function was selected for W, and a bi-square spatial weight function was employed to derive the spatiotemporal weight matrix. The spatiotemporal distance between sample i and sample j is given by
3. Results
3.1. Spatiotemporal Characteristics of Common Prosperity and Tourism Development Levels
As shown in Figure 2, the overall level of common prosperity among residents in the five northwestern provinces of China exhibited an upward trend. During this period, the levels in Shaanxi, Gansu, Ningxia, Qinghai, and Xinjiang increased from 0.358, 0.274, 0.186, 0.123, and 0.232 in 2012 to 0.585, 0.378, 0.280, 0.214, and 0.324 in 2022, respectively (Figure 3a), representing growth rates of 63%, 38%, 51%, 74%, and 40%, respectively. This indicates that the strategies implemented by the Party and the government, such as the Silk Road Economic Belt and New Western Development initiatives, have promoted economic development, improved economic structures, and enhanced public services, thereby raising residents’ living standards and prosperity. From 2012 to 2022, the level of tourism development initially increased and then declined (Figure 2b). Except for Ningxia, the other provinces experienced growth rates in tourism development between 9% and 32% from 2012 to 2019, followed by varying degrees of recovery after reaching a low point in 2020. This is primarily due to the continuous deepening of upstream and downstream tourism cooperation in the five northwestern provinces under the Silk Road Economic Belt initiative. By leveraging their rich tourism resources, these provinces have improved tourism reception facilities, optimized the industrial structure and product supply of tourism, and built tourism brands, thereby driving high-quality development and efficiency enhancement in the tourism industry. However, the 2020 public health crisis, on the one hand, reduced tourism consumption demand by altering tourists’ travel intentions and behaviors. On the other hand, it impacted the resilience and recovery of the tourism industry by weakening its supply and resource allocation capacity, ultimately limiting the level of high-quality tourism development [34].
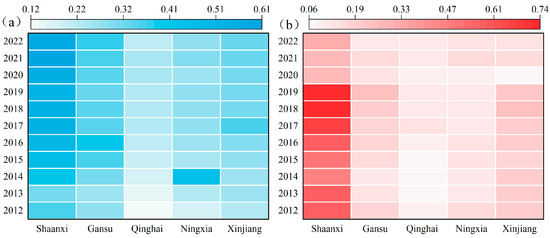
Figure 2.
Temporal changes in the levels of common prosperity (a) and tourism development (b) in the five northwest provinces from 2012 to 2022.
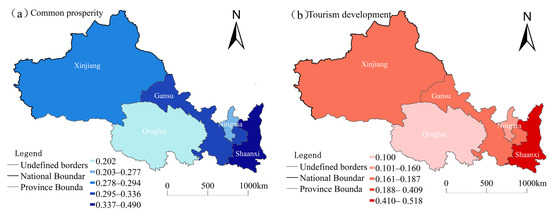
Figure 3.
Spatial changes in the levels of common prosperity (a) and tourism development (b) in the five northwest provinces from 2012 to 2022.
From a spatial perspective, the average level of common prosperity among residents in the five northwestern provinces followed the pattern of Shaanxi (0.491) > Gansu (0.336) > Xinjiang (0.294) > Ningxia (0.277) > Qinghai (0.202) (Figure 3a). Shaanxi, leveraging its early development advantages, has driven high-quality economic growth by constructing a modern industrial system, promoting coordinated development between the Xi’an metropolitan area and surrounding regions, advancing the integration of primary, secondary, and tertiary industries, and fostering equal access to public services. These efforts have increased urban and rural residents’ incomes and sense of fulfillment [35]. Although Qinghai has made significant progress in economic development and quality of life with the support of the eastern–western regional cooperation strategy, its relatively weak foundation in agricultural and pastoral areas and insufficient industrial support have resulted in a lower level of common prosperity [36]. In terms of tourism development, Shaanxi recorded the highest comprehensive development level, at 0.518, followed by Xinjiang (0.187), Gansu (0.166), and Ningxia (0.126); Qinghai had the lowest at 0.100 (Figure 3b). As a province with abundant tourism resources, Shaanxi boasts diverse landscape types, high-quality resources, and favorable geographical and social conditions [37]. In contrast, owing to its geographical disadvantages and constraints on production factors, Qinghai has a low level of tourism industry agglomeration and weak professional capabilities.
3.2. Spatiotemporal Characteristics of Coupling Coordination Between Common Prosperity and Tourism Development Levels
From 2012 to 2022, the degree of coupling between common prosperity and tourism development in the five northwestern provinces ranged from 0.825 to 0.997, indicating a high level of coupling (Figure 4). The degree of coupling coordination across these provinces initially increased and then decreased (Table 3). In 2012, provinces were categorized as having primary coordination, near imbalance, or mild imbalance. By 2018, only two provinces had near imbalances, whereas the rest had reached intermediate or barely coordinated levels. However, by 2022, the coordination levels declined (Table 3). This is primarily attributed to the changes in the tourism market and consumer demand caused by the public health crisis, resulting in a severe imbalance between tourism supply and demand, which, in turn, lowered the resilience and recovery of the tourism industry.
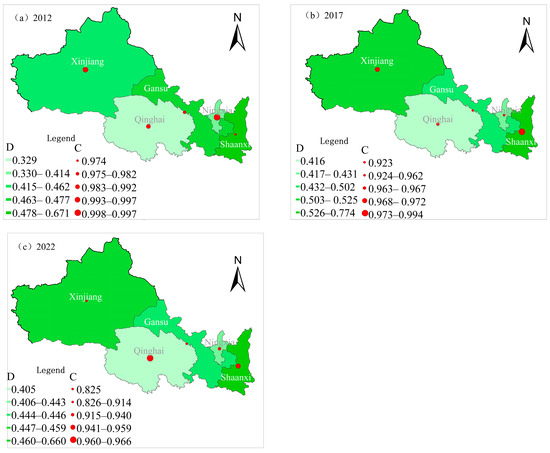
Figure 4.
Spatiotemporal characteristics of the coupling coordination degree between common prosperity and tourism development levels: (a) C and D in 2012; (b) C and D in 2017; (c) C and D in 2022.
Table 3.
Evolution of the coupling coordination degree between common prosperity and tourism development levels in the five northwestern provinces.
To analyze the spatial changes in coupling coordination more clearly, we selected data from 2012, 2017, and 2022 for spatial representation (Figure 4). In 2012, Shaanxi was classified as having primary coordination, Gansu, Ningxia, and Xinjiang were near imbalances, and Qinghai had a mild imbalance. By 2017, the degree of coupling coordination had improved, with Shaanxi reaching intermediate coordination, Gansu and Xinjiang barely achieving coordination, and Qinghai and Ningxia remaining near imbalance. In 2022, the spatial pattern of coupling coordination continued to show Shaanxi at the highest level (primary coordination) and Qinghai at the lowest level (near imbalance) (Figure 4). This spatial disparity is primarily attributed to differences in the foundational development of the tourism industry, regional development environments, and socioeconomic conditions across provinces.
3.3. Spatiotemporal Analysis of Driving Factors of Coupling Coordination
The common prosperity and tourism development system is driven by multiple factors. Drawing on research by scholars such as Zhao Chuansong [38] and Chen Menggen [39], this study analyzes the key factors influencing the coupling coordination between common prosperity and tourism development in the following three dimensions: economy (GDP per capita and proportion of tourism revenue), society (population density and proportion of people covered by pension insurance), and education (proportion of educated population). Ordinary least squares (OLS) regression analysis was conducted for each variable to eliminate spurious regressions (Table 4). Finally, the proportion of tourism revenue, population density, proportion of people covered by pension insurance, and proportion of the educated population were selected as explanatory variables for the Geographically and Temporally Weighted Regression (GTWR) models.
Table 4.
Least squares parameter.
3.3.1. Temporal Analysis of Driving Factors
As shown in Figure 5a, the impact of the population density on the coupling coordination exhibits a positive effect that initially increases and then decreases. In the early stages of development, the “demographic dividend” injected strong momentum into economic growth. However, an excessively high population density exerted significant pressure on ecology, living environments, education, and employment, thereby inhibiting the coupling coordination between the two factors. The proportion of tourism revenue had a significant positive impact on coupled coordination between common prosperity and tourism development, with coefficients ranging from 0.64 to 0.97 (Figure 5b). This indicates that an increase in the proportion of tourism revenue within a region directly promotes economic growth while also enhancing residents’ disposable income and narrowing the urban–rural income gap through industrial structure adjustment and increased employment rates, thereby improving the coupling coordination between the two [13]. The impact of the proportion of people covered by pension insurance on the coupling coordination gradually shifted from negative to positive (Figure 5c). This may be attributed to improvements in social security and livelihood systems, which enhanced residents’ quality of life through income regulation mechanisms and increased adaptability, thereby elevating prosperity and tourism demand. The impact of the proportion of the educated population on coupling coordination remained consistently high, showing an increasing trend annually with a gradually widening degree of dispersion (Figure 5d). On the one hand, the development of education provides talent support for tourism and economic development, contributing to the protection and inheritance of natural and cultural resources, and promoting deep integration between tourism and culture [40]. On the other hand, education enriches individuals’ spiritual worlds and fosters concepts of fairness and sharing, thereby inspiring aspirations for a better life and enhancing recognition and practical abilities for common prosperity.
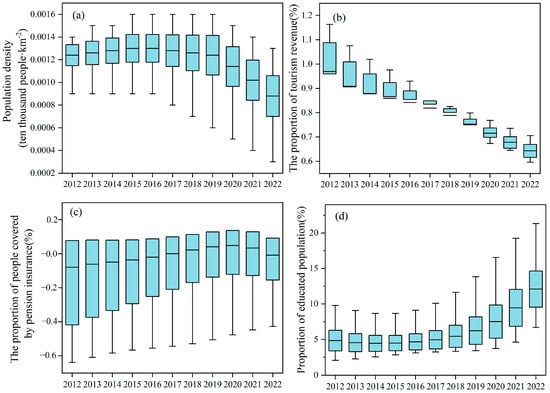
Figure 5.
Temporal variation in the GTWR regression coefficients. (a) Population density; (b) Proportion of tourism revenue; (c) Proportion of people covered by pension insurance; (d) Proportion of educated population.
3.3.2. Spatial Analysis of Driving Factors
To gain a deeper understanding of the spatial differences in the factors influencing the coupling coordination between residents’ common prosperity and tourism development in the five northwestern provinces of China, this study employed a Geographically and Temporally Weighted Regression (GTWR) model to reveal the spatial heterogeneity of the driving factors of coupling coordination (Figure 6). The regression coefficient for population density was the largest in Shaanxi, showing a positive effect (Figure 6a). This is attributed to population agglomeration in Shaanxi, which drives economic growth through knowledge and human capital, the urbanization rate, and labor sharing, thereby increasing residents’ disposable income. The regression coefficient for the proportion of tourism revenue exhibited a significant positive effect across all five northwestern provinces (Figure 6b). This is because tourism revenue not only promotes economic growth, creates employment opportunities, and increases residents’ income but also enhances social welfare, fosters balanced regional development, and drives cultural inheritance and innovation, all of which contribute to the high-quality development of the tourism economy and the realization of common prosperity [21]. The regression coefficient for the proportion of people covered by pension insurance showed a positive effect only in Shaanxi and Ningxia (Figure 6c). This is primarily because of the well-established pension insurance and social security systems in these regions, which improve the quality of life for the elderly population and enhance residents’ consumer confidence, thereby promoting diverse tourism demands and a stable tourism consumption market. The regression coefficient for the proportion of educated population also exhibits a strong positive effect across all five northwestern provinces, with a spatial distribution pattern of “higher in the west and lower in the east” (Figure 6d). An increase in the number of educated individuals enhances the quality of the labor force, contributing to the overall level of human capital in society and providing more professional and efficient labor resources for tourism development [41]. Additionally, investment in education and talent cultivation can narrow development gaps, promote balanced regional economic development, improve social welfare and the quality of life, and strengthen sustainable developmental capabilities.
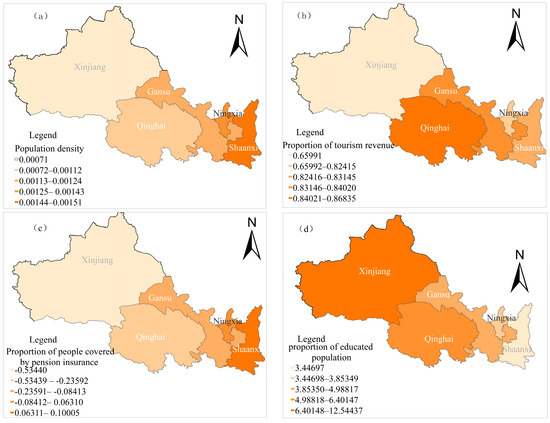
Figure 6.
Spatial distribution of the GTWR regression coefficients. (a) Population density; (b) Proportion of tourism revenue; (c) Proportion of people covered by pension insurance; (d) Proportion of educated population.
4. Discussion
Promoting the coordinated development of prosperity for all people and the tourism industry has become a critical issue in China’s modernization. Analyzing the coupling relationship between the two and their driving mechanisms has significant theoretical and policy implications. This study demonstrates that, from 2012 to 2022, the levels of common prosperity and tourism development among residents in the five northwestern provinces of China improved (Figure 2), which aligns with the findings of Liu Yu, Wang jinwei, and others, who observed a year-by-year increase in China’s tourism industry and common prosperity levels [4,42]. The underlying reason for this is that China has promoted the high-quality development of the tourism industry and improved living standards through strategies such as enhancing the quality and efficiency of the tourism industry, accelerating infrastructure upgrades, fostering coordinated regional development, and alleviating poverty. However, this finding is inconsistent with He Hong’s assertion that the development of the tourism industry in China remains at a medium-to-low level [43]. This discrepancy arises because the latter perspective primarily focuses on high-quality development, paying greater attention to the quality of tourism supply and demand structures and overall benefits.
Spatially, Shaanxi Province exhibits higher levels of tourism development and common prosperity than the other provinces (Figure 3), a result which is consistent with Shi et al.’s findings on measuring high-quality tourism development and common prosperity levels nationwide based on panel data [44]. This is primarily attributed to the differences in location conditions, resource endowments, economic foundations, and development models among cities. Against the backdrop of cultural tourism integration, Shaanxi has extended the modern tourism industry chain, built a trillion-yuan cultural tourism industrial cluster, and innovated its cultural tourism brand through a series of strategic initiatives, leading its cultural tourism industry in terms of scale and competitiveness compared to other provinces. Moreover, existing research has confirmed the significant “polarization effect” caused by development disparities in western cities.
This study also reveals significant spatial disparities in the coupling coordination degree between tourism development and common prosperity (Figure 4). This is mainly due to the weak economic foundations and lagging industrial systems in western cities, which limit the direct and spillover effects of tourism, thereby hindering the benign coordination process between the two [2]. In contrast, Shaanxi Province benefits from a relatively strong industrial foundation, higher levels of regional integration, and advanced economic and social development. The increase in residents’ consumption levels and the aggregation of resource factors have enhanced the tourism industry’s radiative driving force and its effects on income generation for the local population. Additionally, this study finds that the proportion of tourism revenue, population density, proportion of the educated population, and proportion of people covered by pension insurance significantly influence the degree of coupled coordination between tourism and common prosperity. However, the intensity and direction of these effects vary spatially and temporally (Figure 5 and Figure 6). These results align with the conclusion of Wang et al. [42] that common prosperity and tourism development levels are jointly influenced by population density, environmental governance investment, tourism revenue proportion, and per capita GDP. This indicates that tourism and common prosperity form an organically coupled system with a complex structure and interconnections driven by a combination of political, economic, cultural, and social factors.
Based on the dynamics of common prosperity and tourism development, as well as the driving mechanisms of their coupling coordination degree, the following recommendations are proposed.
(1) This study indicates that Shaanxi Province exhibits the highest levels of tourism development and common prosperity, while Qinghai Province ranks the lowest (Figure 3). Therefore, each province should leverage the spillover effects of tourism according to local conditions. For provinces with higher development levels, such as Shaanxi, technological innovation, cultural empowerment, and the consolidation of tourism brands should be strengthened. Relying on the development pattern of “one circle, one cluster” amplifies the radiating effects of tourism on the economies of rural areas, thereby fostering a positive feedback loop between tourism and common prosperity. Provinces with lower development levels should fully utilize national policy support and resource advantages to develop borders and ice–snow tourism. The transition from resource-dependent to technology-driven tourism development through expanding tourism formats and optimizing industries has increased the role of tourism in rural residents’ income.
(2) The coupling coordination level between tourism development and common prosperity in the five northwestern provinces is relatively low, with Qinghai ranking below the other provinces (Figure 4). Qinghai should strengthen the construction of tourism infrastructure and explore its tourism development potential to increase the supply of high-quality tourism products. Additionally, leveraging policy guidance to promote the flow of tourism and resource elements among regions can enhance the radiating effects of the tourism industry. This will ensure that the benefits of tourism development are more widely shared among low-income residents, ultimately achieving alignment between the tourism industry and economic development.
(3) The proportion of tourism revenue in the five northwestern provinces significantly impacts the coupling coordination between common prosperity and tourism development. Therefore, each province should focus on its regional characteristics to enhance the quality of tourism development. Regions with lower levels of development, such as Qinghai, Ningxia, and Gansu, should create high-quality ecological and cultural tourism routes. They can improve the efficiency of tourism resource utilization and attractiveness through green, low-carbon development and the promotion of distinctive tourism brands. At the same time, it is essential to pay attention to improving internal education levels and cultivating high-end talent in the tourism industry. By integrating tourism with other industries, these regions can strengthen their core competitiveness. Moreover, Shaanxi can enhance local residents’ sense of participation and tourism consumption demand through cultural festivals and community tourism activities, thereby improving both their material and cultural quality of life.
Based on panel data, this study analyzed the interactive relationship and driving factors between common prosperity and tourism development in northwestern China. However, it has the following limitations. First, due to data availability constraints, the income and spiritual life conditions of different groups were not included in the evaluation system. Future research should continuously enrich and improve on these aspects. Second, the relationship between common prosperity and tourism development is complex. Although this study employed the Geographically and Temporally Weighted Regression (GTWR) model to clarify the spatiotemporal changes in the factors driving their interaction, to enhance its universality and practical applicability, future research should adopt system dynamics to provide a more comprehensive analysis of the driving mechanisms.
5. Conclusions
(1) From 2012 to 2022, the level of common prosperity among residents in the five northwestern provinces showed an upward trend, while the level of tourism development initially increased and then declined. Spatially, the highest values for both the common prosperity and tourism development levels were observed in Shaanxi Province, whereas the lowest values were observed in Ningxia Province.
(2) From 2012 to 2022, the degree of coupling coordination between common prosperity and tourism development in the five northwestern provinces improved initially but subsequently declined. In 2012, Xinjiang, Gansu, and Ningxia were on the verge of an imbalance, Qinghai experienced a mild imbalance, and Shaanxi reached a state of primary coordination. By 2017, Shaanxi was at an intermediate coordination, Gansu and Xinjiang were at marginal coordination, and Ningxia and Qinghai were near imbalance. By 2022, Shaanxi had maintained its primary coordination status, while the other four provinces were on the verge of an imbalance.
(3) An analysis of the influencing factors revealed that population density, the proportion of tourism revenue, and the proportion of the educated population had a positive impact on the degree of coupling coordination between common prosperity and tourism development, while the influence of the proportion of the population covered by pension insurance shifted from negative to positive. Among these factors, the proportion of tourism revenue had the greatest impact on the degree of coupling coordination. Moreover, the degree and direction of the influence of these factors on the degree of coupling coordination varied across different regions. This study provides a theoretical foundation for formulating policies to advance high-quality tourism development and promote common prosperity in China’s five northwestern provinces.
Author Contributions
Conceptualization, H.Z.; methodology, H.Z.; software, H.Z. and X.M.; data curation, X.M.; writing—original draft preparation, H.Z.; writing—review and editing, H.Z. and X.X.; visualization, H.Z. and X.M.; supervision, X.X.; funding acquisition, H.Z. and X.X. All authors have read and agreed to the published version of the manuscript.
Funding
This research was funded by the National Natural Science Foundation of China (grant no. 42261041), Tianchi Talent Project, and the Key Laboratory for Sustainable Development of Xinjiang’s Historical and Cultural Tourism, Xinjiang University, China (grant no. LY2022-06).
Data Availability Statement
The original contributions presented in the study are included in the article, further inquiries can be directed to the corresponding author.
Conflicts of Interest
The authors declare no conflicts of interest.
Abbreviations
The following abbreviations are used in this manuscript:
| GTWR | Geographically and Temporally Weighted Regression |
| GDP | Gross Domestic Product |
| CNY | Chinese Yuan (Renminbi) |
| OLS | Ordinary Least Squares Regression |
References
- Xi, J. Holding high the great banner of socialism with Chinese characteristics and striving together to build a modern socialist country in an allround way: Report at the 20th National Congress of the Communist Party of China. People’s Daily, 26 October 2022. [Google Scholar]
- Feng, L.L.; Zhong, H. Interrelationships and Methods for Improving University Students’ Sense of Gain, Sense of Security, and Happiness. Front. Psychol. 2021, 12, 729400. [Google Scholar] [CrossRef] [PubMed]
- Kumail, T.; Sadiq, M.; Ali, W.; Sadiq, F. The impacts of tourism development on income inequality: How does tourism capital investment contribute to income distribution? Tourism Agenda 2030. Tour. Rev. 2023, 78, 630–645. [Google Scholar] [CrossRef]
- Liu, Y.; Dong, K.; Wang, J.; Taghizadeh-Hesary, F. Towards sustainable development goals: Does common prosperity contradict carbon reduction? Econ. Anal. Policy 2023, 79, 70–88. [Google Scholar] [CrossRef]
- Ma, X.F.; Zhang, R.; Ruan, Y.F. Evaluation of common prosperity level and regional difference based on the background of green development. Sustainability 2022, 14, 15863. [Google Scholar] [CrossRef]
- Dunford, M. The Chinese path to common prosperity. Int. Crit. Thought 2022, 12, 35–54. [Google Scholar] [CrossRef]
- Li, S. Understanding China’s road to common prosperity: Background, definition and path. China Econ. J. 2023, 16, 1–13. [Google Scholar] [CrossRef]
- Zhu, C.; Wang, Z.; Jiang, Q.; Xie, C. Does industry monopolization widen wage residual inequality in China? Int. Rev. Econ. Financ. 2024, 96, 103503. [Google Scholar] [CrossRef]
- Sun, Y.; Zhou, L.; Wang, D.; Jin, K.; Wu, Q.; Wu, R. How economic policy uncertainty affects common prosperity in China? The mediating role of green finance and the moderating role of low-carbon technology. Financ. Res. Lett. 2024, 67, 105701. [Google Scholar] [CrossRef]
- Xie, T.; Zhang, Y.; Song, X. Research on the spatiotemporal evolution and influencing factors of common prosperity in China. Environ. Dev. Sustain. 2024, 26, 1851–1877. [Google Scholar] [CrossRef]
- Deng, Y.; Li, C.; Wang, S.; Tang, R. The Impact of Economic Openness on Common Prosperity: Insights from Provincial Panel Data. Int. Rev. Econ. Financ. 2025, 98, 103908. [Google Scholar] [CrossRef]
- Liu, J.; Nijkamp, P.; Lin, D. Urban-rural imbalance and tourism-led growth in China. Ann. Tour. Res. 2017, 64, 24–36. [Google Scholar] [CrossRef]
- Zeng, K.; Luo, X. China’s inbound tourist revenue and Beijing Olympic Games 2008. China World Econ. 2008, 16, 110–126. [Google Scholar] [CrossRef]
- Yan, X.; Luo, M.; Zhong, C. Evaluation of rural tourism development level based on entropy-weighted grey correlation analysis: The case of Jiangxi Province. Grey Syst. Theory Appl. 2023, 13, 677–700. [Google Scholar] [CrossRef]
- Zhang, L.; Marzuki, A.; Liao, Z. The coordination pattern of tourism efficiency and development level in Guangdong Province under high-quality development. Humanit. Soc. Sci. Commun. 2023, 10, 796. [Google Scholar] [CrossRef]
- Chen, Q.; Chen, W.; Wu, D.; Zheng, L.; Li, J. Spatiotemporal evolution and influencing factors of tourism development efficiency in the Yangtze River Economic Belt, China. J. Clean. Prod. 2022, 379, 134722. [Google Scholar] [CrossRef]
- Ji, J.; Wang, D. Regional differences, dynamic evolution, and driving factors of tourism development in Chinese coastal cities. Ocean. Coast. Manag. 2022, 226, 106262. [Google Scholar] [CrossRef]
- Li, K.X.; Jin, M.; Shi, W. Tourism as an important impetus to promoting economic growth: A critical review. Tour. Manag. Perspect. 2018, 26, 135–142. [Google Scholar] [CrossRef]
- Kim, J.H.; Kang, K.H. The interaction effect of tourism and foreign direct investment on urban–rural income disparity in China: A comparison between autonomous regions and other provinces. In Current Issues in Asian Tourism: Volume II; Routledge: London, UK, 2021; pp. 204–217. [Google Scholar]
- Tang, C.F.; Tan, E.C. Does tourism effectively stimulate malaysia’s economic growth? Tour. Manag. 2015, 46, 158–163. [Google Scholar] [CrossRef]
- Comerio, N.; Pacicco, F. The role of tourism in reducing economic inequalities: The case of Italy. Econ. Politica 2024, 41, 839–880. [Google Scholar] [CrossRef]
- Zhang, J. The effects of tourism on income inequality: A meta-analysis of econometrics studies. J. Hosp. Tour. Manag. 2021, 48, 312–321. [Google Scholar] [CrossRef]
- Ahmad, A. The constraints of tourism development for a cultural heritage destination: The case of Kampong Ayer (Water Village) in Brunei Darussalam. Tour. Manag. Perspect. 2013, 8, 106–113. [Google Scholar] [CrossRef]
- Fan, T.; Xue, D. Spatial correlation of cultural industry and tourism industry in Shaanxi Province, China: LISA analysis based on coordination model. Asia Pac. J. Tour. Res. 2020, 25, 967–980. [Google Scholar] [CrossRef]
- Yang, Y.; Zhang, C.; Qin, Z.; Cui, Y. The spatial-temporal pattern evolution and influencing factors of county-scale tourism efficiency in Xinjiang, China. Open Geosci. 2022, 14, 1547–1561. [Google Scholar] [CrossRef]
- Liu, H.; Hasan, M.; Cui, D.; Yan, J.; Sun, G. Evaluation of tourism competitiveness and mechanisms of spatial differentiation in Xinjiang, China. PLoS ONE 2022, 17, e0263229. [Google Scholar] [CrossRef] [PubMed]
- Yang, H.N.; Su, H.Z.; Yang, L.J. Evolution of urban resilience from a multiscale perspective: Evidence from five provinces in Northwest China. Complexity 2023, 2023, 2352094. [Google Scholar] [CrossRef]
- Xie, Q.X.; Yi, F.J.; Tian, X. Disparate changes of living standard in China: Perspective from Engel’s coefficient. China Agric. Econ. Rev. 2022, 15, 481–505. [Google Scholar] [CrossRef]
- Li, J.; Zhu, M.; Tian, L. Evaluation of the coupling and corrdinated development of tourism and povertu alleaiation in China. Stat. Decis. 2021, 37, 175–179. [Google Scholar]
- Chen, Z.J.; Xu, F.X. Mechanism of rural tourism development on rural revitalization: Taking Guanzhong area as an example. Econ. Geogr. 2021, 37, 5–16. [Google Scholar]
- Liao, S.J.; Wu, Y.; Wong, S.W.; Shen, L.Y. Provincial perspective analysis on the coordination between urbanization growth and resource environment carrying capacity (RECC) in China. Sci. Total Environ. 2020, 730, 138964. [Google Scholar] [CrossRef]
- Zheng, X.; Yang, Z.P. Coordination or contradiction? The spatiotemporal relationship between ecological environment and tourism development within the tourism ecological security framework in China. Ecol. Indic. 2023, 157, 111247. [Google Scholar] [CrossRef]
- Huang, B.; Wu, B.; Barry, M. Geographically and temporally weighted regression for modeling spatio-temporal variation in house prices. Int. J. Geogr. Inf. Sci. 2010, 24, 383–401. [Google Scholar] [CrossRef]
- Sharma, G.D.; Thomas, A.; Paul, J. Reviving tourism industry post-COVID-19: A resilience-based framework. Tour. Manag. Perspect. 2021, 37, 100786. [Google Scholar] [CrossRef] [PubMed]
- Liu, J.S.; Li, C.; Tao, J.Q.; Ma, Y.F.; Wen, X.J. Spatiotemporal coupling factors and mode of tourism industry, urbanization and ecological environment: A case study of Shaanxi, China. Sustainability 2019, 11, 4923. [Google Scholar] [CrossRef]
- Li, S.H.; Yu, D.Y.; Li, X.Y. Exploring the impacts of ecosystem services on human well-being in Qinghai Province under the framework of the sustainable development goals. J. Environ. Manag. 2023, 345, 118880. [Google Scholar] [CrossRef] [PubMed]
- Guo, Y.J.; Cao, Z. A study on the tourism efficiency of tourism destination based on DEA model: A case of ten cities in Shaanxi province. PLoS ONE 2024, 19, e0296660. [Google Scholar] [CrossRef]
- Zhao, C.S.; Ren, J.L.; Chen, Y.B.; Liu, K. Spatial-temporal coupling and driving forces of China’s provincial tourism industry and regional development under the background of comprehensive tourism. China Popul. Resour. Environ. 2018, 28, 149–159. [Google Scholar]
- Chen, M.G.; Zhang, S. Regional economic imbalance in China and the influence factors: Based on night-time light data. Stat. Res. 2020, 37, 40–54. [Google Scholar]
- Shi, Z.Y.; Xu, D.H.; Xu, L.D. Spatiotemporal characteristics and impact mechanism of highquality development of cultural tourism in the Yangtze River Delta urban agglomeration. PLoS ONE 2021, 16, e0252842. [Google Scholar] [CrossRef]
- Wang, Q.; Wei, M.; Wang, N.; Chen, Q. The impact of human capital and tourism industry agglomeration on China’s tourism eco-efficiency: An analysis based on the undesirable Super-SBM-ML model. Sustainability 2024, 16, 6918. [Google Scholar] [CrossRef]
- Wang, J.W.; Wang, Q.Q.; Feng, L. Direct and spillover effects of tourism development on common prosperity. Acta Geogr. Sin. 2021, 37, 5–16. [Google Scholar]
- He, H.; Tuo, S.; Lei, K.; Gao, A. Assessing quality tourism development in China: An analysis based on the degree of mismatch and its influencing factors. Environ. Dev. Sustain. 2024, 26, 9525–9552. [Google Scholar] [CrossRef]
- Shi, P.F.; Li, X.M. Measurement and analysis of the spatial effects of high-quality development of tourism industry on promoting common prosperity- an empirical test based on data from 30 provinces in China. Jiangxi Soc. Sci. 2024, 44, 5–47. [Google Scholar]
Disclaimer/Publisher’s Note: The statements, opinions and data contained in all publications are solely those of the individual author(s) and contributor(s) and not of MDPI and/or the editor(s). MDPI and/or the editor(s) disclaim responsibility for any injury to people or property resulting from any ideas, methods, instructions or products referred to in the content. |
© 2025 by the authors. Licensee MDPI, Basel, Switzerland. This article is an open access article distributed under the terms and conditions of the Creative Commons Attribution (CC BY) license (https://creativecommons.org/licenses/by/4.0/).