Abstract
The coastal regions of major bay areas—including San Francisco, Tokyo, New York, Guangdong–Hong Kong–Macao, and Hangzhou—are important centers of economic and social growth due to their strategic location, resources, and dynamic economies. However, the significant development disparities between the central cities and surrounding areas, as well as the challenges of climate change, highlight the need for a comprehensive assessment of their development potential. The aim of this study is to find out which cities have the strongest development potential and what the main factors influencing the results are. To address this research question, we use a combination of the Analytic Hierarchy Process (AHP) and the Entropy Weight Method (EWM) to systematically assess the development potential of 63 cities in five bay area regions and explore the mechanisms that influence it. The principal component analysis (PCA) also examines the global networking and sustainability mechanisms. The results show that Shenzhen and Shanghai lead in development potential due to strong institutional frameworks and global connectivity, but significant imbalances remain in the bay areas. Key contributors to sustainability and connectivity include air passenger traffic, public libraries, and port handling, while traditional economic metrics such as GDP growth show limited impact. These findings underscore the importance of prioritizing urban livability, resource circulation, and infrastructure over traditional economic indicators for sustainability and provide actionable insights for policy makers to promote balanced and sustainable development in bay area cities.
1. Introduction
The sustainable development of a nation depends on the regional sustainability of its social, environmental, economic, and institutional systems. Bay areas, with their strategic ports, abundant marine and hinterland resources, and open economic structures, have evolved into regions with highly dynamic resource allocation and economic integration [1,2]. Driven by globalization and regional integration, the central cities in these bay areas have developed into global cities that serve as hubs for finance, shipping, and technology. Examples include New York, Hong Kong, San Francisco, and Tokyo, which play a central role in these areas worldwide [3,4]. According to a report by the World Bank, over half of the world’s economic output comes from bay areas and their immediate hinterlands [5].
Although scholars began studying bay areas in the 1960s, much of the research has focused on specific central cities such as New York and San Francisco, often examining their metropolitan areas or their status as global cities. While the role of ports and natural resources has occasionally been discussed, there have been few systematic studies of all cities within a bay area [6,7,8,9,10].
Debates about the development patterns and driving mechanisms of different bay area cities continue. The bay area of New York and Tokyo, for example, is often characterized by finance- and market-driven growth, San Francisco is characterized by technology-driven development, and the bay area of Guangdong, Hong Kong, and Macau is characterized by policy-driven initiatives [11]. In general, central cities dominate development in major global bay areas such as the San Francisco Bay Area, Tokyo Bay Area, New York Bay Area, Guangdong–Hong Kong–Macao Bay Area, and the emerging Hangzhou Bay Area. However, this central-city-driven model often leads to unbalanced regional development with little attention paid to surrounding cities [12].
While these central cities are leaders in finance and technology and transcend some administrative boundaries, their dominance can stunt the growth of neighboring cities. Financial and technological capital, unlike traditional economic activities, has weaker spatial spillover effects [13]. As the world transitions into the post-industrial age, technology is becoming one of the key drivers of global power, which will lead to more profound economic restructuring and exacerbate regional disparities. Moreover, globalization has accelerated the transformation of regional development, leading to a growing role for finance, technology, and highly connected transport networks [4]. In addition, urban coastal areas, including bay areas, are at increased risk of natural disasters as the effects of global climate change intensify, making their sustainable development a major concern for scientists [14]. Despite the importance of bay areas, most research focuses on individual city clusters rather than undertaking a systematic, global assessment of the development potential of all cities within these regions [15]. This gap underscores the need for a comprehensive assessment that examines both the global and local dynamics of urban development in bay areas.
Based on this, the main objective of this study is to find the main factors that influence the development potential of cities in bay areas and the mechanisms that influence them. The main question of this study revolves around the following: which cities have the strongest development potential, and what are the main factors that influence the results? We also consider whether economic factors are still the most important in the context of globalization and the Sustainable Development Goals (SDGs). The aim of this paper is to systematically assess the urban development potential of cities in the five major global bay areas. In this study, cities in the New York Bay Area, San Francisco Bay Area, Tokyo Bay Area, Guangdong–Hong Kong–Macao Greater Bay Area, and Hangzhou Bay Area are assessed using a combination of qualitative and quantitative methods. By analyzing 29 indicators in four main dimensions—economic elements, social environment, institutional environment, and global connectivity and sustainable development—this paper assesses the urban development potential for the period 2020 to 2021.
This study makes a significant contribution by filling the gap in comparative and systematic studies on bay areas at both global and city-specific levels. In contrast to previous studies that focused on individual city clusters or central cities, this paper provides a holistic assessment of the development potential of 63 cities in five major global bay areas. The comprehensive framework applied here, which combines qualitative findings with quantitative methods, allows for a nuanced understanding of how different factors—such as governance structures, sustainability practices, and global connectivity—influence urban development potential.
In addition, this study highlights the impact of regional imbalances, where dominant central cities often outshine their neighboring cities. By identifying the key drivers of development potential, the findings provide actionable insights for policy makers to design strategies that promote balanced, sustainable growth in bay area cities. The inclusion of sustainability indicators also provides important guidance for addressing environmental vulnerabilities, particularly in light of global climate change and its impacts on coastal regions. Ultimately, this paper contributes to the broader discourse on urban development and sustainability by providing a replicable methodology and a new perspective on the dynamics of global bay areas. The structure of this paper is as follows: In Section 2, the existing literature on bay areas is reviewed, focusing on development patterns, key challenges, and research gaps related to dynamics at regional and urban levels. Section 3 presents the hypotheses and the methodology using the Analytic Hierarchy Process (AHP) and Entropy Weight Method (EWM) to measure development potential and principal component analysis (PCA) to identify critical influencing factors. Section 4 presents the results, including the ranking of 63 cities within the five bay areas based on their development potential, along with an analysis of global connectivity and sustainability as drivers. Finally, The findings are discussed and summarized in Section 5, where trends, regional imbalances, and implications for urban development in global bay areas are examined, and outlines key innovations in comparison to existing research and makes recommendations to help policy makers and stakeholders promote balanced and sustainable urban development.
2. Literature Review
Bay areas, as shallow regions connecting land and sea, have become significant economic incubators due to their global port infrastructure and abundant natural resources on land and in water [16]. Their rich ecological and strategic geographical locations, combined with sustainable economic and social benefits, have established them as gateways for international trade and transportation [17]. Historically, bay areas have been important hubs for maritime trade [18]. For example, the San Francisco Bay Area became a focal point during the Gold Rush, spurring rapid urbanization and economic growth. Similarly, during the Meiji Restoration, Tokyo Bay became an important port that facilitated Japan’s integration into the global economy [9,19]. Scholars such as Portner et al. [20] have emphasized that this historical importance has supported continued growth and innovation in these regions. Since the industrial revolution, coastal regions have utilized world-class ports, a thriving maritime economy, and circulating capital to develop into major urban agglomerations, such as the New York Bay Area, Tokyo Bay, and the San Francisco Bay Area.
Historical analyses of bay areas have provided critical insights into their economic rise, often emphasizing industrialization, port development, and the role of trade [18,19]. However, these historical perspectives often fail to bridge the gap to future sustainability challenges, particularly under climate change conditions. For example, while the industrial restructuring of Tokyo Bay after World War II demonstrates its adaptive capacity, current vulnerabilities such as rising sea levels and urban heat islands require forward-looking solutions [21]. Similarly, the San Francisco Bay Area, whose legacy is Silicon Valley-driven innovation, faces new challenges in balancing technological growth with infrastructure resilience to climate impacts [22]. Understanding how past successes and failures feed into adaptation strategies is critical to the sustainability of bay areas. Capital and information agglomeration spaces that house multinational corporate headquarters and high-value service industries have become control centers for global capital in the age of economic globalization, often referred to as “global cities” [19,20,23].
Many researchers have analyzed the development processes and characteristics of large global bay areas in different phases. Early development in these regions was primarily based on the port economy, but industrial development and economic restructuring gradually shifted to finance- and innovation-driven industries [24]. For example, after World War II in Tokyo, factories were relocated out of the city to cope with the environmental, compositional, and overpopulation problems caused by industrial growth. This change enabled the central Tokyo Bay area to develop high-end service functions and create urban agglomerations with specialized functions [9,19]. In 2018, Tokyo Bay contributed to one-third of Japan’s GDP and was home to world-renowned companies such as Toyota, Honda, Mitsubishi, SoftBank, and Sony [21].
In contrast, the development of the New York Bay Area began with financial activities related to cross-border trade [25,26]. After the first industrial revolution, the introduction of the factory system attracted a large workforce and accelerated urbanization. Improved transportation networks enabled New York to drive the growth of surrounding cities and form a regional urban agglomeration [27]. Over time, particularly after the Great Depression, World War II, and several industrial restructurings, the region transformed into a center for financial services. In 2018, the New York Greater Bay Area accounted for approximately 8.72% of total U.S. GDP [9,28].
In contrast to the accumulation of financial capital in New York and Tokyo, the development of the San Francisco Bay Area as a leading global metropolitan area in the bay area has been driven primarily by the innovation and technology industries that provide access to global networks [29]. Historically, San Francisco had an agricultural-based extractive economy and heavy industry-driven urbanization, but the immigration boom of the 1848 Gold Rush marked the emergence of the financial and high-tech industries. Over time, Silicon Valley, located in the San Francisco Bay Area, established itself as a global center of innovation and contributed significantly to job creation and economic growth [22]. Today, the region is home to a large concentration of technology and financial companies, including Google, Facebook, Twitter, and Visa, making it the center for more than 40% of venture capital investment in the United States. In addition, the bay area accounts for 15.2% of professional licenses in the country, and its GDP accounted for 4.32% of the total U.S. economy in 2017 [4,18,30].
The Guangdong–Hong Kong–Macao Greater Bay Area (GBA), considered the largest urban agglomeration in the world, plays a central role in connecting regional and global networks. Unlike other bay areas, its development is primarily policy-driven, reflecting its unique position within China’s “one-country-two-systems” framework and its pioneering role in emerging manufacturing and advanced service industries [31]. As the most open and economically dynamic region in China, the GBA emphasizes the crucial importance of coordinated regional planning [32].
Similarly, Hangzhou Bay is included in China’s 2012 regional planning initiatives, which include Shanghai, the country’s financial and innovation center, and nearby major port cities [33]. The Hangzhou Bay city cluster benefits from its strategic geographical location and the strong economic bases of Shanghai, Hangzhou, and Ningbo and has significant development potential. It is increasingly regarded as an important urban region of the global bay area [34]. Comparative studies of global bay areas reveal different management models, port integration strategies, and approaches to ecological resilience. Tokyo Bay, for example, shows a highly centralized governance system that enables efficient infrastructure development but may limit regional cooperation [19]. In contrast, San Francisco Bay Area’s decentralized governance encourages innovation but has problems with regional coordination, particularly in addressing environmental and housing issues [4]. The Guangdong–Hong Kong–Macao Greater Bay Area, which relies on policy-driven integration, is a unique model for bridging institutional differences between cities. However, comparisons show that all bay areas face common environmental risks, such as sea level rise, which require cooperative and adaptive solutions.
The major urban regions of bay areas have developed differently, with central cities such as New York, Hong Kong, Tokyo, San Francisco, and Shanghai acting as key hubs of global capital and economic activity [7]. These global cities play a dominant role in shaping regional growth by concentrating economic power and influencing global financial flows. However, despite the importance of bay area city clusters and metropolitan regions as models for urban development, not all cities within these clusters exhibit uniform development potential or have similar goals and functions [35].
In the San Francisco Bay Area, for example, the rising cost of living in core cities has caused many residents to relocate to neighboring counties, resulting in population dispersion outside of primary urban centers [18,30]. Nonetheless, Silicon Valley remains a key driver of regional growth and maintains its role as a global center for innovation and technology [4].
In addition, the unique geographic characteristics of bay areas, combined with the pressing challenges of climate change, have shifted policy and research priorities towards sustainability and resilience. Current discussions on urban development in bay areas increasingly focus on balancing the demands of global economic integration with the need for long-term sustainability, emphasizing the importance of mitigating climate-related risks and ensuring resource efficiency [20,22,36].
Research on urban development potential has traditionally focused on key dimensions such as human capital, environmental resources, economic growth, and policy frameworks. These studies often use empirical methods to analyze urban development by constructing indicator systems with different foci [15,37]. Academic research on urban development potential gained prominence in the late 20th century, addressing topics such as the development potential of cities and communities and the unique characteristics of cities [38,39]. Comparative analyses have also made it clear that cities with different functional roles—different sizes, economic performance, international networks, infrastructure, and regional influence—have different development potential [40,41].
Some researchers emphasize the importance of urban development potential as a measure of sustainable growth and have developed conceptual models that depict urban potential as dynamic, interdependent, and mutually beneficial [42,43]. Advanced assessment techniques such as fuzzy modeling have been applied to account for the multifaceted factors that influence urban development at different stages and scales. These methods often use computerized tools such as coding and relational databases to make accurate assessments [39,44]. The development potential of major bay areas worldwide is significant due to their economic strength, strategic geographic location, and adaptive communities. However, fully realizing this potential requires addressing a number of complex challenges, particularly in terms of environmental sustainability, social equity, and infrastructure resilience.
After 2020, increasing frictions and barriers to international trade put coastal cities at the center of global connectivity, making them important hubs between national and international networks. This shift has increased scientific interest in their competitiveness and technological advancements [3,24]. The Global Cities Index (GCI) developed by Kearney assesses a city’s international connectivity based on five dimensions: economic vitality, human capital, information exchange, cultural experience, and political engagement [45]. This index incorporates a wide range of data, including measures of capital flows, education systems, media resources, and political activity [46].
Global cities in bay area urban regions are particularly influenced by their coastal location and maritime economies, which are a key part of their identity as global maritime centers [8]. The Leading Maritime Capitals of the World report assesses the overall capacity of maritime cities in areas such as shipping, maritime finance, legal and insurance frameworks, and technological capabilities. Cities such as London, Tokyo, Hong Kong, and Shanghai consistently occupy top positions, highlighting the strong correlation between coastal economies and global economic performance [47]. In addition, the report’s potential assessment evaluates the future prospects of cities based on 13 indicators divided into four dimensions: residents’ well-being, economic performance, innovation, and governance. Indicators such as environmental sustainability, infrastructure development, and innovation potential provide important insights for investors assessing the long-term viability of cities [45,48].
Coastal regions offer significant strategic advantages but are also highly vulnerable, especially to climate-related risks and natural disasters. Challenges such as global warming and sea level rise have a strong influence on the development paths of bay area urban regions [3]. These climate dynamics highlight the importance of incorporating global connectivity and sustainability considerations into the assessment of urban development potential [49]. In addition, environmental hazards, including flooding and extreme weather events, pose a serious threat to urban infrastructure and economic stability. The COVID-19 pandemic has also highlighted the vulnerability of global supply chains and underscored the need for robust adaptation strategies to strengthen regional resilience [50].
In the context of global sustainability goals and efforts to mitigate climate change, bay area urban regions are uniquely positioned to contribute to long-term solutions. Their unique geographic and economic characteristics make them important focal points for advancing global urban sustainability and resilience initiatives. Exploring the development potential of these regions is essential for addressing climate vulnerabilities and aligning regional growth with international sustainability and climate adaptation goals.
Despite extensive studies of bay area development, integrated frameworks that simultaneously consider economic growth, environmental sustainability, and social equity are still lacking. Much of the existing research focuses on economic metrics such as GDP and trade volume [6,23] without fully considering the environmental and social dimensions that are critical to sustainable urban growth. For example, while central cities such as New York and Tokyo dominate bay area studies, little attention has been paid to the development potential of peripheral cities, which could play a key role in promoting regional balance [35]. Moreover, given the growing risks of climate change, urban planning in bay areas has yet to systematically incorporate adaptation strategies such as green infrastructure or coastal protection, which are essential for long-term resilience [51]. Building a globally competitive city region with maritime centers requires a focus not only on the central metropolis but also on the untapped potential of the surrounding areas [20,52,53]. Despite the promising opportunities in bay areas, these regions face numerous challenges. Much of the existing research on bay area urban regions is case-specific, with limited efforts at broader comparative and integrative assessments. In addition, studies of sustainability in bay areas often neglect the importance of non-central cities within these regions. Pressing global issues such as climate change and sea level rise, which are particularly relevant to bay areas dominated by the financial, science, and technology sectors, are also addressed late.
A holistic understanding of bay area development requires the integration of knowledge from urban planning, coastal management, environmental science, and economics. For example, urban planning emphasizes the importance of equitable access to resources and services, but these perspectives are rarely linked to ecological considerations such as habitat preservation [8,54]. Coastal management studies provide valuable strategies for mitigating environmental risks through tools such as Integrated Coastal Zone Management (ICZM), which can guide sustainable urbanization in marine bay areas [55]. Similarly, economic analyses of port activities and trade flows need to be reconciled with assessments of environmental externalities such as emissions and habitat loss in order to develop policies that reconcile economic growth with sustainability goals.
3. Hypotheses and Methodology
3.1. Hypotheses
The city region centered on five major cities, including San Francisco, New York City, Shanghai, Hong Kong, and Tokyo, is globally influential in terms of both location and economic base. Based on this, the following hypothesis is formulated:
H1:
The core cities of the region have higher development potential.
Sustainable development in urban areas relies on four main systems: social, environmental, economic, and institutional [1,2]. With the spread of globalization, financial, technological, and transport networks are taking on greater importance in driving regional development [4]. Based on this, the following hypothesis is formulated:
H2:
Global connectivity and sustainability should be the most important factors influencing the development potential of the region.
In order to test the above hypotheses, we use the multi-indicator evaluation system to conduct empirical research.
3.2. Methodology and Data
We selected economic, social, and institutional components commonly used in urban development indicators to assess the development potential of cities in five major bay area urban regions (Figure 1). Figure 1 provides an overview of our study area, with all vector and raster data sourced from the Global Human Settlement Layer (GHSL) database published by the European Union [56]. Additional data were sourced from official economic reports, statistical yearbooks, city government publications, and international development databases, including the U.S. Bureau of Economic Analysis (BEA), OECD databases, and World Bank databases. These sources were selected for their comprehensive coverage of economic, social, and environmental indicators relevant to urban development potential.
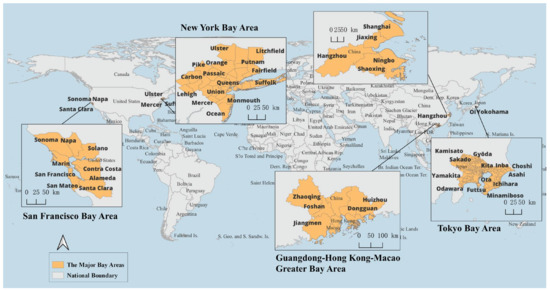
Figure 1.
The global major bay area urban regions.
City-level indicators were compiled from official U.S. state websites (e.g., nj.gov, ny.gov, trade.gov, census.gov), the U.S. Bureau of Statistics (BEA), and international organizations (worldbank.org, oecd.org). For Tokyo, the data were taken from statistical offices and government sources (e.g., cao.go.jp, pref.kanagawa.jp, chiba.lg.jp, saitama.lg.jp). For the Guangdong–Hong Kong–Macao Greater Bay Area, the data were taken from government planning documents and statistical yearbooks of the cities of Guangdong, Hong Kong, and Macao (e.g., gdstats.gov.cn, zj.gov.cn, sh.gov.cn, censtatd.gov.hk, sz.gov.cn, gov.mo). All indicators have been standardized and converted for consistency, with GDP data, for example, adjusted to the current U.S. dollar exchange rate based on official sources. To ensure the reliability of the data, rates of change or ratios were used for the indicators where possible.
To address the need for cities to integrate into global networks and strive for sustainable development, indicators specifically related to global connectivity and sustainability are included in the analytical framework in this study. Since there are no standardized definitions for city boundaries in countries such as Japan and the United States, where clear city boundaries are often not defined, counties were chosen as the unit of analysis to ensure consistency in data processing and logical validity. This study summarizes 29 indicators for 63 cities taken from official statistical websites, national and regional statistical yearbooks, and government-issued annual reports.
While most of the city-level data were collected for 2021, this analysis also takes into account the rate of change between 2020 and 2021 to mitigate possible indicator-specific anomalies and increase the reliability of the data. In cases where city-level institutional environment data were difficult to quantify or unavailable, national-level data were included to provide a broader perspective. Detailed descriptions of these indicators and their meaning can be found in Table 1. Where the direction of the indicator represents whether the change in that indicator is consistent with the target expectation, with “+” representing the higher values are better, “-” means lower values are better.

Table 1.
The indicators and data descriptions.
The methodology uses a combination of hierarchical analysis and entropy weighting to assess the development potential of key bay area cities. Principal component analysis (PCA) is then used to identify the most important factors for development potential, followed by regression analysis to examine the relationships between these factors in selected representative cities.
3.3. Analytic Hierarchy Process (AHP) and Weight
The AHP (Analytic Hierarchy Process) method was used to evaluate the relative importance of the individual indicators by creating a pairwise comparison matrix. This approach, which is widely used in multi-criteria decision models, combines qualitative and quantitative analyses to evaluate complex systems [57,58,59]. The core principle is to break down a complex decision problem into smaller components and arrange these factors in a hierarchical structure that includes levels such as the goal, criteria, and indicator levels. The relative importance of these components is then systematically evaluated to produce an overall ranking of the factors [60].
The AHP is a pairwise comparative decision-making methodology that allows experts to filter the more important influences and options from different priority groupings to form the best option [61]. In this study, questionnaires from six experts including researchers in the field of urban development and global cities as well as workers in government departments related to urban development were adopted. The results were averaged to obtain a determination matrix. The AHP steps are broadly divided into the following: constructing the decision hierarchy; determining the relative importance between attributes; assessing the overall weights; and consistency testing [62].
Urban development indicators are traditionally categorized into three main categories: economic, social, and institutional. However, in this study, global connectivity and sustainability are introduced as additional dimensions that reflect the specific characteristics of bay area cities, such as their exposure to climate risks and their integration into global networks [15,63,64]. Sustainability is represented by indicators such as average annual air quality, green area per capita, and built-up area per capita. For global connectivity, the throughput of the most important ports, the total value of import and export trade, and metro transportation systems are used, among others. To apply the AHP method, decision matrices were created for each component.
Of all the indicators, the per capita income and GDP had the greatest impact on the economic element indicators, and built-up area had the least impact (Table 2). Of the social environment indicators, the population with a bachelor’s degree or higher had the highest weight, and the rate of change in the labor force had the lowest weight (Table 3).
Table 2.
Determination matrix of economic elements.
Table 3.
Determination matrix of social environment.
The unemployment rate and government effectiveness play an important role in the institutional environment (Table 4).
Table 4.
Determination matrix of institutional environment.
Meanwhile, the volume of import and export trade, port throughput, per capita built-up area, and per capita green space area are important bases for global connectivity and sustainability indicators (Table 5).
Table 5.
Determination matrix of global connection and sustainability.
In comparison, the weights of the sub-indicators of global connection and sustainable development are more dispersed, while the weights of the economic element are more concentrated. And the overall weight of global connections and sustainable development is higher among the four groups of indicators (Table 6).
Table 6.
Determination matrix of urban potential.
The consistency metrics are defined as follows:
λ: maximum eigenroot; n: unique non-zero eigenroot; CI = 0, with perfect agreement. When the CI is close to 0, there is satisfactory agreement. The larger the CI, the more serious the inconsistency. To measure the size of the CI, the random consistency index RI is introduced. The method involves randomly constructing m judgment matrices, A1, A2, …, Am; then, we can obtain the consistency index: CI1, CI2, …, CIm. This leads to the random consistency index formula:
The Consistency Indicator RI table (Table 7) is shown below:
Table 7.
Consistency Indicator RI table.
We tested the consistency of each part of the determination matrix separately using the following formula. The consistency ratio is defined as follows:
In general, when the consistency ratio (CR) is less than 0.1, the inconsistency level of the judgment matrix A is deemed acceptable, indicating satisfactory consistency. Under these conditions, the normalized eigenvector is used as the weight vector. However, if the CR exceeds this threshold, the judgment matrix A must be reconstructed, and adjustments are required to improve consistency.
In this study, all matrices successfully passed the consistency test and have an acceptable level of consistency. The calculated weights derived from these matrices are also consistent, as shown in Table 8. The results of the consistency tests for each matrix are summarized in Table 9.
Table 8.
The results of the consistency test.
Table 9.
The weights of the indicators determined by the hierarchical analysis.
3.4. The Entropy Weight Method (EWM) Process and Weight
The entropy weighting method (EWM) was then applied to calculate the weighting of the indicators based on their variability between different cities [65]. Although hierarchical analysis is a widely used method, it is inherently subjective because the assignment of weights relies entirely on expert judgment [57]. To address this limitation, we adopted a combined approach that combines hierarchical analysis with the EWM. The greater the dispersion of an indicator, the greater the combined impact of that indicator. The EWM was used as an objective weighting technique to improve the robustness of the analysis. Since the dataset also contains negative indicators, it was necessary to normalize the data to ensure dimensionless comparability. For positive indicators, the normalization process was performed as follows:
When the indicator is negative, the calculation is as follows:
The weight of indicator j in program i is calculated, i.e., the magnitude of variation for that indicator is calculated:
The information entropy of each indicator is calculated:
where ≧ 0. If = 0, then = 0.
The weight of each indicator is calculated according to the information entropy:
This table presents the weights of the 29 indicators calculated using the Entropy Weighting Method (EWM) and the Analytic Hierarchy Process (AHP), where x15, x16, and x23 are negative indicators. To derive the final indicator weights for assessing the development potential of major bay area urban regions, the weights from the two methods were combined through arithmetic averaging (Table 10). A robustness check was performed by adjusting the weights of the economic and social indicators by ±10% to evaluate the stability of the development potential scores. This approach ensured the reliability of the results by assessing the sensitivity of the calculated scores to variations in the weight distribution.
Table 10.
Indicator weights for development potential of major global bay area cities.
3.5. Principal Component Analysis (PCA)
After ranking the development potential of 63 cities within the five bay areas, three representative cities were selected for detailed analysis. This study also examined the key factors influencing the development potential of these cities by principal component analysis (PCA). Principal component analysis (PCA) was used to examine the most important factors influencing global connectivity and sustainability. Standardized data from 2010 to 2021 were used to assess global connectivity and sustainability, covering indicators such as international transport, international trade, financial markets, migration, cultural activities, and technological development (Table 11). The processed data were analyzed using SPSS to perform a PCA and identify the main components that significantly influence the development potential of these cities [66,67,68].
Table 11.
The global connection and sustainable development indicators of major global bay area cities.
The Kaiser–Meyer–Olkin (KMO) value was calculated to be 0.687, and the p-value of the Bartlett’s test was close to zero, indicating that the dataset was suitable for factor analysis. The results of the principal component analysis (PCA) identified the key factors contributing to urban development and revealed significant differences between coastal and inland cities. From the total variance decomposition table, two principal components with eigenvalues greater than 1 and a cumulative variance of over 80% were extracted for further analysis. These components were interpreted to represent the global connectivity and sustainability of bay area cities. Using mathematical–statistical methods, the two principal components were included in a loading matrix and applied to the indicators for each city to calculate a composite score (Table 12). Finally, the relationship between the global connectivity and sustainability indicators and each city’s GDP and population was analyzed separately to examine the mechanisms by which these factors influence the economic development of bay area cities.
Table 12.
Principal Component Score (PCS) and indicator weights.
4. Results
4.1. The Rankings of Major Bay Area Cities by Development Potential
Based on the calculated indicator weights, this study assessed the development potential of 63 major bay area cities worldwide. Shenzhen and Shanghai, both located in China, achieved the highest scores for development potential. Pike County in Pennsylvania, USA, also achieved a high ranking, although most of the cities with the highest development potential are located in Asia. In contrast, prominent U.S. economic centers such as New York and San Francisco were only ranked in the middle. The analysis shows an uneven development potential within the Guangdong–Hong Kong–Macao Greater Bay Area (GBA), with cities in this region having both the highest and lowest scores (Table 13). The top rankings of Shenzhen and Shanghai can be attributed to their well-developed economic infrastructure and strong institutional framework, which supports the hypothesis that economic and social indicators are key determinants of development potential. To test the robustness of these results, an alternative scenario was analyzed in which greater weight was assigned to environmental indicators. Although this adjustment changed the rankings slightly, Shenzhen and Shanghai remained the top performers, emphasizing their consistent strength across multiple dimensions of development. Such results partially disprove H1 that global cities with high economic fundamentals, such as New York and Hong Kong, do not reflect greater growth potential, but the performance of Shenzhen and Shanghai proves that factors other than economics are perhaps more important.
Table 13.
The development potential rank of major global bay area cities.
To illustrate the distribution of urban development potential in the major global bay areas, the development potential values of all cities were grouped and visualized. Figure 2 shows a clear representation of these values, with each bar representing a specific range of values. The analysis shows that the Tokyo Bay Area has a high urban development potential overall, with Kanagawa Prefecture having the highest value among the cities.
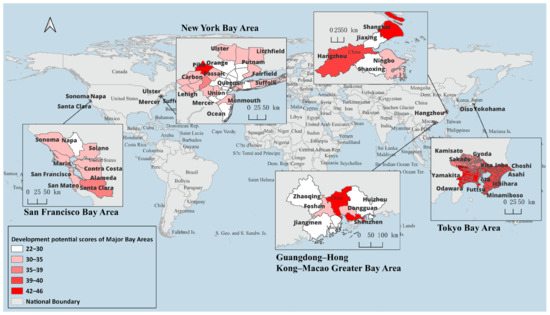
Figure 2.
Development potential scores of cities within major bay area urban regions.
In the San Francisco Bay Area, growth potential is relatively evenly distributed among the cities. Napa, the only city in the region that is not on the coast, has the lowest development potential, while Santa Clara in the southern part of the bay area has the highest potential. The New York Greater Bay Area, recognized as one of the most economically dynamic and fastest growing urban clusters in the world, shows greater variability in development potential among its cities. The area with the highest development potential in this region is Pike County, located in the northernmost part of the bay area. In contrast, most of the region’s coastal cities, with the exception of New York City (including Queens and Kings), have relatively low development potential. The peripheral cities within the bay area generally have higher growth potential (Figure 2).
4.2. Development Potential of Hongkong, New York, and Shenzhen Cases
The institutional environment, global connectivity, and sustainable development are cited as the most influential factors in determining the ranking of development potential. However, institutional factors are shaped by each country’s unique socio-political and economic systems, making cross-regional comparisons difficult. The Guangdong–Hong Kong–Macao Greater Bay Area (GBA), for example, operates under China’s “one country, two systems” policy, resulting in significant differences in the region’s institutional policies.
In contrast, the New York Greater Bay Area, one of the earliest planned and most integrated bay area regions, benefits from the global significance of New York City. As a major center of economic, cultural, and political influence, New York City drives the region’s development through significant economic spillover effects. As shown in Figure 2, Shenzhen stands out in the GBA with significantly higher development potential than other cities in the region. Previous studies have revealed significant intra-regional disparities within the GBA, while the mechanisms underlying the development of the New York Bay Area, as the oldest and most established model, have not yet been sufficiently explored. To address these gaps in knowledge, this study examines the two bay areas in depth to uncover the patterns and mechanisms underlying the development of urban clusters in the bay area.
Bay area development often functions like a general urban cluster, with a central city serving as a hub for global network connections to drive regional economic growth. Consequently, global connectivity plays a critical role in determining the sustainability of economic development within these regions, a concept strongly supported by the global cities theory. New York is a prime example of a global city and consistently ranks at the top of Kearney’s Global Cities Index. Similarly, Hong Kong, once the world’s third largest financial center, was ranked as a global city by GaWC. By 2020, however, Hong Kong had dropped out of the top five.
Interestingly, among the five bay areas analyzed in this study, neither Hong Kong nor New York City ranked in the top five in terms of development potential. We hypothesize that this is due to the institutional environment, which plays a central role in resource allocation and economic direction throughout the city-region development process. In particular, Hong Kong has benefited from significant financial opportunities in the past under China’s “one country, two systems” concept. However, since the implementation of the Guangdong–Hong Kong–Macao Greater Bay Area Plan, Hong Kong’s role has shifted to regulating the domestic market, which has changed resource allocation and economic priorities. In addition, the industrial structures in both New York and Hong Kong have contributed to the unsustainability of their earlier rapid economic growth. In the later stages of development, these cities expanded their land markets without sufficient effort at regional coordination, resulting in significant development problems.
This study focuses on Hong Kong, Shenzhen, and New York to examine the differences in the persistence of global connectivity and sustainability factors between these three cities. Panel data were collected from 2010 to 2021, covering five key dimensions: transportation, trade, financial markets, population migration, and culture. Correlation analyses were conducted using GDP and population as dependent variables to provide a comprehensive assessment of the global connectivity and sustainability of these cities.
Hong Kong, Shenzhen, and New York are representative cities within the Guangdong–Hong Kong–Macao Greater Bay Area (GBA) and the New York Greater Bay Area, respectively. Using population density data from 1975 to 2015, the distribution of changes in population density within these two bay areas was calculated. The results reveal different patterns: The GBA shows a multi-centered distribution of population density changes, with a significant outward expansion around Guangzhou, Shenzhen, and Hong Kong. In contrast, the New York Greater Bay Area shows a constant concentration of population density around New York City over the 40-year period, indicating a more centralized distribution pattern (Figure 3 and Figure 4).
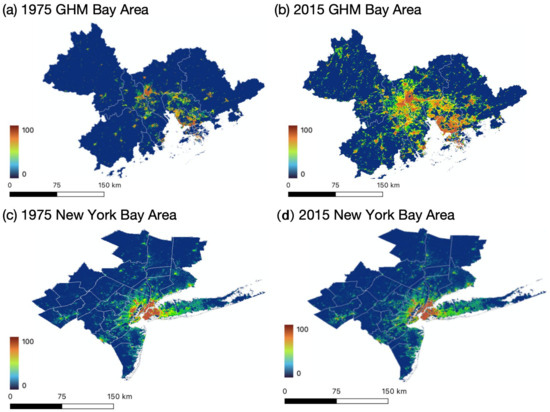
Figure 3.
Population density of New York Bay and the Guangdong–Hong Kong–Macao Greater Bay Area in 1975–2015.
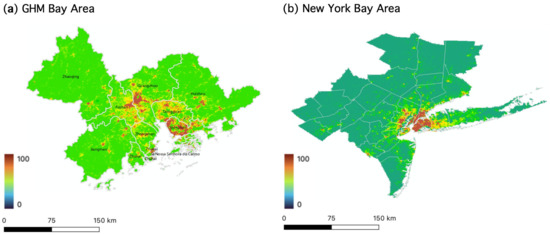
Figure 4.
Population density change in New York Bay and the Guangdong–Hong Kong–Macao Greater Bay Area in 1975–2015.
The results of the principal component analysis were used to evaluate the global connectivity and sustainability ranking of Shenzhen, Hong Kong, and New York. Across the years analyzed, Shenzhen consistently ranked first, with the exception of 2020, when Hong Kong took the top position. New York, on the other hand, ranked last throughout the period analyzed.
A regression analysis examining the relationship between global connectivity and sustainability indicators found that factors such as population growth rate, import and export trade volume, air passenger and cargo volume, port throughput, and public library availability have a significant impact. This is in line with our second hypothesis that global connectivity and sustainability play a more important role in increasing the development potential of cities. In contrast, the GDP growth rate and foreign direct investment had only a limited influence on these indicators. It is noteworthy that public libraries and air passenger volume were identified as the most influential factors for global connectivity and sustainability, while the population growth rate had the least influence (Table 14). Coef is the degree of influence of the independent variable on the dependent variable; a positive number indicates a positive correlation, and a negative number indicates a negative correlation. p is used to determine the probability of whether the coefficient is significant or not; p < 0.05 indicates that the coefficient is statistically significant. Std. is the standard error of the coefficient estimate, which is used as a measure of the accuracy of the coefficient estimate; the smaller the coefficient estimate, the more reliable the coefficient estimate.
Table 14.
The coefficients of development potential of global connectivity and sustainability.
5. Discussion and Conclusions
This study used a combination of the Entropy Weight Method and the Analytic Hierarchy Process to evaluate the development potential of 63 cities in five major global bay area urban regions: the Greater New York Bay Area, the San Francisco Bay Area, Tokyo Bay, the Guangdong–Hong Kong–Macao Bay Area, and the Hangzhou Bay Area. The results show significant differences in development potential, with Shenzhen and Shanghai consistently leading the rankings through 2021, followed by Pike County in Pennsylvania, USA. These results partially align with the existing literature—for instance, the Global Power City Index (GPCI) 2021 also identifies Shanghai and Shenzhen as top performers in Asia due to their advanced economic diversification and innovation ecosystems [69]. In particular, the Guangdong–Hong Kong–Macao Greater Bay Area and the New York Greater Bay Area show pronounced intra-regional imbalances, highlighting the need for more equitable development strategies.
Instead of using development potential as a descriptive indicator of sustainable growth, our study constructs a new system of indicators that combines economic, global connectivity, institutional, and social factors to provide a more intuitive picture of the region’s development potential [38,39]. At the same time, other scholars have focused more on the center of the region than the surrounding cities and have overestimated the role of GDP and economic power in the development potential of today’s bay area cities [20,23,52]. Indeed, we find significant regional imbalances between the Guangdong–Hong Kong–Macao Greater Bay Area and the New York Bay Area, and the OECD also noted in 2022 that agglomeration economies in favor of the core cities can create unbalanced development within the region [70]. However, our analysis further finds that policy incentives are a compounding factor, such that while Shenzhen would profit from China’s special economic zone policy, neighboring cities such as Zhuhai lack the same financial autonomy. This same pattern emerges in San Francisco’s Silicon Valley [71]. These similarities suggest that balanced development requires not only infrastructure development but also decentralized resource allocation in the institutional environment.
Among the five indicator categories—economic elements, social environment, institutional environment, global connectivity, and sustainable development—the indicators for institutional environment, global connectivity, and sustainability were found to be the most influential factors. This study highlights the growing importance of “soft strengths” such as public libraries, air transportation, and trade networks over traditional economic metrics such as the GDP growth rate and fixed asset investment. Sassen also argued that the competitiveness of global cities is increasingly dependent on soft power such as cultural and logistical networks [72]. Our findings challenge conventional assumptions about the primacy of direct economic indicators in urban development and underscore the critical role of global connectivity and sustainability in transforming bay area cities into global hubs.
From a policy perspective, these findings underscore the need for targeted interventions to address regional inequalities and promote sustainable development. Policy makers should prioritize investments in infrastructure that improves connectivity, such as transportation networks and cultural facilities, and focus on creating an equitable environment for both central and peripheral cities. For example, improving access to public libraries and strengthening port and air transportation infrastructure can significantly increase global connectivity and quality of life.
In addition, this study sheds light on the evolving dynamics of bay area development and provides valuable insights for aligning urban strategies with global sustainability goals, such as the United Nations’ Sustainable Development Goals (SDGs). Future strategies should incorporate new technologies, green infrastructure, and climate resilience measures to ensure that these regions remain competitive and sustainable.
Despite its contribution, this study acknowledges limitations related to the availability of long-term data and the narrow scope of the composite indicators. This reliance on composite indices may oversimplify dynamic urban systems, and future research could look to real-time data from smart city platforms (e.g., Singapore’s Virtual Singapore) [73]. Comparative studies with other global urban clusters, such as the Rhine–Ruhr conurbation or the Tokyo metropolitan area, could also provide valuable insights.
In summary, the findings emphasize that economically developed cities within bay areas need to pursue forward-looking policies that prioritize global connectivity, sustainability, and equitable development over purely economic growth metrics. In this way, these cities can consolidate their position as global ocean centers while contributing to a broader global sustainability agenda.
Author Contributions
Conceptualization, Y.J. and L.Z.; methodology, L.Z.; software, L.Z.; validation, Y.J. and L.Z.; formal analysis, L.Z.; investigation, Y.J.; resources, Y.J.; data curation, L.Z.; writing—original draft preparation, L.Z.; writing—review and editing, Y.J.; visualization, L.Z.; supervision, Y.J.; project administration, Y.J.; funding acquisition, Y.J. All authors have read and agreed to the published version of the manuscript.
Funding
This research received no external funding.
Data Availability Statement
Data related to this research can be made available on request by the corresponding author.
Acknowledgments
We sincerely thank our colleagues at School of Geographic Sciences from East China Normal University for their technical support and constructive discussions.
Conflicts of Interest
The authors declare no conflicts of interest. The funders had no role in the design of this study; in the collection, analyses, or interpretation of data; in the writing of this manuscript; or in the decision to publish the results.
Abbreviations
The following abbreviations are used in this manuscript:
| AHP | Analytic Hierarchy Process |
| BEA | U.S. Bureau of Statistics |
| EWM | Entropy Weight Method |
| GBA | Guangdong–Hong Kong–Macao Greater Bay Area |
| ICZM | Integrated Coastal Zone Management |
| KMO | Kaiser–Meyer–Olkin |
| PCA | Principal component analysis |
References
- Aerts, J.C.; Botzen, W.W.; Emanuel, K.; Lin, N.; De Moel, H.; Michel-Kerjan, E.O. Evaluating flood resilience strategies for coastal megacities. Science 2014, 344, 473–475. [Google Scholar] [CrossRef] [PubMed]
- Li, Y.; Zhang, X.; Zhao, X.; Ma, S.; Cao, H.; Cao, J. Assessing spatial vulnerability from rapid urbanization to inform coastal urban regional planning. Ocean Coast. Manag. 2016, 123, 53–65. [Google Scholar] [CrossRef]
- Hui, E.C.; Li, X.; Chen, T.; Lang, W. Deciphering the spatial structure of China’s megacity region: A new bay area—The Guangdong-Hong Kong-Macao Greater Bay Area in the making. Cities 2020, 105, 102168. [Google Scholar] [CrossRef]
- Walker, R.; Schafran, A. The strange case of the Bay Area. Environ. Plan. A 2015, 47, 10–29. [Google Scholar] [CrossRef]
- Zheng, M.; Lian, F.; Yang, Z. Study on the transport advantage and optimal port scale of a Bay Area. Ocean Coast. Manag. 2022, 219, 106056. [Google Scholar] [CrossRef]
- Sassen, S. The Global City: Introducing a Concept. Brown J. World Aff. 2004, 11, 27. [Google Scholar]
- Sassen, S. The Global City: New York, London, Tokyo; Princeton University Press: Princeton, NJ, USA, 2013. [Google Scholar]
- Boschken, H.L. Global cities are coastal cities too: Paradox in sustainability? Urban Stud. 2013, 50, 1760–1778. [Google Scholar] [CrossRef]
- Schmidt, S. From Global War to Global Cities: Planning, Art, and Post-WWII Urban History in New York, Berlin, and Tokyo. Doctoral Dissertation, Massachusetts Institute of Technology, Cambridge, MA, USA, 2017. [Google Scholar]
- Massey, D. World City; Polity Press: Cambridge, UK, 2003. [Google Scholar]
- Tian, Z.; Zhou, B. Sustainable future: A systematic review of city-region development in bay areas. Front. Sustain. Cities 2023, 5, 1052568. [Google Scholar] [CrossRef]
- Lee, K.H.; Noh, J.; Khim, J.S. The Blue Economy and the United Nations’ sustainable development goals: Challenges and opportunities. Environ. Int. 2020, 137, 105528. [Google Scholar] [CrossRef]
- Coe, N.M.; Kelly, F.; Yeung, H.W. Economic Geography: A Contemporary Introduction; John Wiley & Sons: Hoboken, NJ, USA, 2019. [Google Scholar]
- The Intergovernmental Panel on Climate Change (IPCC), Climate Change 2022 Mitigation of Climate Change, Working Group III Contribution to The IPCC Sixth Assessment Report (AR6). 2023. Available online: https://www.ipcc.ch/report/ar6/wg3/ (accessed on 10 February 2025).
- Kriegler, E.; Edmonds, J.; Hallegatte, S.; Ebi, K.L.; Kram, T.; Riahi, K.; Winkler, H.; van Vuuren, D. A new scenario framework for climate change research: The concept of shared climate policy assumptions. Clim. Change 2014, 122, 401–414. [Google Scholar] [CrossRef]
- Gagné, K.; Rasmussen, M.B. Introduction–an amphibious anthropology: The production of place at the confluence of land and water. Anthropologica 2016, 58, 135–149. [Google Scholar] [CrossRef]
- Calzati, S.; Santos, F.; Casarola, G. On the (non) institutional disclosure of urban commons: Evidence, practices and challenges from the Netherlands and Belgium. Front. Sustain. Cities 2022, 4, 934604. [Google Scholar] [CrossRef]
- Scott, M. The San Francisco Bay Area: A Metropolis in Perspective; University of California Press: Berkeley, CA, USA, 1985. [Google Scholar]
- Takeuchi, A. How to sustain Tokyo’s competitiveness in the 21st century. Int. J. Urban Sci. 1998, 2, 12–23. [Google Scholar] [CrossRef]
- Portner, H.O.; Roberts, D.C.; Tignor, M.M.B.; Poloczanska, E.S.; Mintenbeck, K.; Alegría, A.; Craig, M.; Langsdorf, S.; Löschke, S.; Möller, V.; et al. Climate Change 2022: Impacts, Adaptation and Vulnerability. Contribution of Working Group II to the Sixth Assessment Report of the Intergovernmental Panel on Climate Change; Cambridge University Press: Cambridge, UK, 2022. [Google Scholar]
- The Portal Site of Official Statistics of Japan. Japan Statistical Yearbook. 2021. Available online: https://www.stat.go.jp/data/nenkan/index1.html (accessed on 10 February 2025).
- Shirzaei, M.; Bürgmann, R. Global climate change and local land subsidence exacerbate inundation risk to the San Francisco Bay Area. Sci. Adv. 2018, 4, eaap9234. [Google Scholar] [CrossRef] [PubMed]
- Fang, C.; Yu, D. Urban agglomeration: An evolving concept of an emerging phenomenon. Landsc. Urban Plan. 2017, 162, 126–136. [Google Scholar] [CrossRef]
- Hasegawa, J. The plans for Tokyo Bay: The challenge of urban policy, 1950s–1990s. Urban Hist. 2023, 51, 414–434. [Google Scholar] [CrossRef]
- Shefter, M. Capital of the American Century: The National and International Influence of New York City; Russell Sage Foundation: New York, NY, USA, 1993. [Google Scholar]
- Lichtenberg, R.M. One-Tenth of a Nation: National Forces in the Economic Growth of the New York Region; Harvard University Press: Cambridge, UK, 1960. [Google Scholar]
- Toz, A.C.; Koseoglu, B.; Sakar, C. Numerical modelling of oil spill in New York Bay. Arch. Environ. Prot. 2016, 42, 22–31. [Google Scholar] [CrossRef][Green Version]
- US Bureau of Economic Analysis (BEA), GDP by Metro Area. 2023. Available online: https://www.bea.gov/data/gdp/gdp-county-metro-and-other-areas (accessed on 10 February 2025).
- Mok, K.H. The role of higher education, innovation, and entrepreneurship in bay areas: Challenges and opportunities. In Higher Education, Innovation and Entrepreneurship from Comparative Perspectives: Reengineering China Through the Greater Bay Economy and Development; Springer: Singapore, 2022; pp. 1–14. [Google Scholar]
- Walker, R.A. The Country in the City: The Greening of the San Francisco Bay Area; University of Washington Press: Seattle, WA, USA, 2009. [Google Scholar]
- Yu, H. The Guangdong-Hong Kong-Macau Greater Bay Area in the making: Development plan and challenges. Camb. Rev. Int. Aff. 2021, 34, 481–509. [Google Scholar] [CrossRef]
- Song, C.; Sun, C.; Xu, J.; Fan, F. Establishing coordinated development index of urbanization based on multi-source data: A case study of Guangdong-Hong Kong-Macao Greater Bay Area, China. Ecol. Indic. 2022, 140, 109030. [Google Scholar] [CrossRef]
- Wang, T.; Hu, M.; Song, L.; Yu, J.; Liu, R.; Wang, S.; Wang, Y. Coastal zone use influences the spatial distribution of microplastics in Hangzhou Bay, China. Environ. Pollut. 2020, 266, 115137. [Google Scholar] [CrossRef]
- Yang, C.; Li, Q.; Hu, Z.; Chen, J.; Shi, T.; Ding, K.; Wu, G. Spatiotemporal evolution of urban agglomerations in four major bay areas of US, China and Japan from 1987 to 2017: Evidence from remote sensing images. Sci. Total Environ. 2019, 671, 232–247. [Google Scholar] [CrossRef] [PubMed]
- Kanai, J.M.; Grant, R.; Jianu, R. Cities on and off the map: Abibliometric assessment of urban globalisation research. Urban Stud. 2018, 55, 2569–2585. [Google Scholar] [CrossRef]
- Rizk Hegazy, I. Towards sustainable urbanization of coastal cities: The case of Al-Arish City, Egypt. Ain Shams Eng. J. 2021, 12, 2275–2284. [Google Scholar] [CrossRef]
- Ji, J.; Wang, D. Regional differences, dynamic evolution, and driving factors of tourism development in Chinese coastal cities. Ocean Coast. Manag. 2022, 226, 106262. [Google Scholar] [CrossRef]
- Dowall, D.E. The Suburban Squeeze: Land Conversion and Regulation in the San Francisco Bay Area; University of California Press: Berkeley, CA, USA, 2023. [Google Scholar]
- Etminani-Ghasrodashti, R.; Paydar, M.; Ardeshiri, A. Recreational cycling in a coastal city: Investigating lifestyle, attitudes and built environment in cycling behavior. Sustain. Cities Soc. 2018, 39, 241–251. [Google Scholar] [CrossRef]
- Al-hagla, K.S. Sustainable urban development in historical areas using the tourist trail approach: A case study of the Cultural Heritage and Urban Development (CHUD) project in Saida, Lebanon. Cities 2010, 27, 234–248. [Google Scholar] [CrossRef]
- Duy, N.; Chapman, L.; Tight, M. Resilient transport systems to reduce urban vulnerability to floods in emerging-coastal cities: A case study of Ho Chi Minh City, Vietnam. Travel Behav. Soc. 2019, 15, 28–43. [Google Scholar] [CrossRef]
- Bates, T. The Urban Development Potential of Black-Owned Businesses. J. Am. Plan. Assoc. 2006, 72, 227–237. [Google Scholar] [CrossRef]
- Kannen, A.; Green, D.R.; Glavovic, B.C.; Agardy, T.S.; Ramanathan, A.L.; Krishnamurthy, R.R.; Zengcui, H. Global Coastal Zone: The Challenge. In Integrated Coastal Zone Management; Research Publishing Services: Singapore, 2008; pp. 1–19. [Google Scholar]
- Feng, S.; Xu, L.D. Decision support for fuzzy comprehensive evaluation of urban development. Fuzzy Sets Syst. 1999, 105, 1–12. [Google Scholar] [CrossRef]
- Kearney, A.T. The 2023 Global Cities Report: The Distributed Geography of Opportunity. 2023. Available online: https://www.kearney.com/documents/291362523/299003325/The+distributed+geography+of+opportunity-the+2023+Global+Cities+Report.pdf (accessed on 10 February 2025).
- Roweis, S. EM Algorithms for PCA and SPCA. Adv. Neural Inf. Process. Syst. 1997, 10, 626–632. [Google Scholar]
- Verma, P.; Raghubanshi, A.S. Urban sustainability indicators: Challenges and opportunities. Ecol. Indic. 2018, 93, 282–291. [Google Scholar] [CrossRef]
- DNV The Leading Maritime Capitals of The World 2023. 2023. Available online: www.dnv.com/news/leading-maritime-cities-report-2022-singapore-still-in-top-spot-followed-by-rotterdam-and-london-215099/ (accessed on 10 February 2025).
- Verhetsel, A.; Sel, S. World maritime cities: From which cities do container shipping companies make decisions? Transp. Policy 2009, 16, 240–250. [Google Scholar] [CrossRef]
- World Economic Forum. Supply Chain Resilience: How Are Pandemic-Related Disruptions Reshaping Managerial Thinking? 2021. Available online: https://www.weforum.org/agenda/2021/12/supply-chain-resilience-lessons-from-covid-19/ (accessed on 10 February 2025).
- Nicholls, R.J.; Cazenave, A. Sea-level rise and its impact on coastal zones. Science 2010, 328, 1517–1520. [Google Scholar] [CrossRef] [PubMed]
- Banai, R. The metropolitan region: From concepts to indicators of urban sustainability. J. Urban. Int. Res. Placemaking Urban Sustain. 2013, 6, 1–23. [Google Scholar] [CrossRef]
- Yigitcanlar, T.; Teriman, S. Rethinking sustainable urban development: Towards an integrated planning and development process. Int. J. Environ. Sci. Technol. 2015, 12, 341–352. [Google Scholar] [CrossRef]
- Campbell, S. Green cities, growing cities, just cities? Urban planning and the contradictions of sustainable development. Class. Read. Urban Plan. 1996, 62, 296–312. [Google Scholar] [CrossRef]
- Cicin-Sain, B.; Knecht, R.W. Integrated Coastal and Ocean Management: Concepts and Practices; Island Press: Washington, DC, USA, 1998. [Google Scholar]
- Florczyk, A.J.; Corbane, C.; Ehrlich, D.; Freire, S.; Kemper, T.; Maffenini, L.; Melchiorri, M.; Pesaresi, M.; Politis, P.; Schiavina, M.; et al. GHSL Data Package 2019, EUR 29788 EN; Publications Office of the European Union: rue de Reims, Luxembourg, 2019; ISBN 978-92-76-13186-1. [Google Scholar]
- Hu, Y.; Li, W.; Wang, Q.; Liu, S.; Wang, Z. Evaluation of water inrush risk from coal seam floors with an AHP–EWM algorithm and GIS. Environ. Earth Sci. 2019, 78, 290. [Google Scholar] [CrossRef]
- Sáenz-Royo, C.; Chiclana, F.; Herrera-Viedma, E. Ordering vs. AHP. Does the intensity used in the decision support techniques compensate? Expert Syst. Appl. 2024, 238, 121922. [Google Scholar] [CrossRef]
- Grošelj, P.; Zandebasiri, M.; Pezdevšek Malovrh, Š. Evaluation of the European experts on the application of the AHP method in sustainable forest management. Environ. Dev. Sustain. 2024, 26, 29189–29215. [Google Scholar] [CrossRef]
- Darko, A.; Chan AP, C.; Ameyaw, E.E.; Owusu, E.K.; Pärn, E.; Edwards, D.J. Review of application of analytic hierarchy process (AHP) in construction. Int. J. Constr. Manag. 2019, 19, 436–452. [Google Scholar] [CrossRef]
- Saaty, T.L. Decision making with the analytic hierarchy process. Int. J. Serv. Sci. 2008, 1, 83–98. [Google Scholar] [CrossRef]
- Schoenherr, T.; Tummala, R.; Harrison, T. Assessing supply chain risks with the analytic hierarchy process: Providing decision support for the offshoring decision by a US manufacturing company. J. Purch. Supply Manag. 2008, 14, 100–111. [Google Scholar] [CrossRef]
- Mori, K.; Christodoulou, A. Review of sustainability indices and indicators: Towards a new City Sustainability Index (CSI). Environ. Impact Assess. Rev. 2012, 32, 94–106. [Google Scholar] [CrossRef]
- Munda, G. Social multi-criteria evaluation for urban sustainability policies. Land Use Policy 2006, 23, 86–94. [Google Scholar] [CrossRef]
- Zhang, Y.; Wen, Z.; Zhang, J.; Huang, J.; Qi, J.; Li, M. Study on stability evaluation of goaf based on AHP and EWM—Taking the northern new district of Liaoyuan city as an example. Sci. Rep. 2024, 14, 17876. [Google Scholar] [CrossRef]
- Ohenhen, L.O.; Shirzaei, M.; Ojha, C.; Sherpa, S.F.; Nicholls, R.J. Disappearing cities on US coasts. Nature 2024, 627, 108–115. [Google Scholar] [CrossRef]
- Mackiewicz, A.; Ratajczak, W. Principal components analysis (PCA). Comput. Geosci. 1993, 19, 303–342. [Google Scholar] [CrossRef]
- Daffertshofer, A.; Lamoth, C.J.C.; Meijer, O.G.; Beek, J. PCA in studying coordination and variability: A tutorial. Clin. Biomech. 2004, 19, 415–428. [Google Scholar] [CrossRef]
- Institute for Urban Strategies. Global Power City Index 2021. 2021. Mori Memorial Foundation. Available online: https://world.seoul.go.kr/city-hall/the-ranking-of-seoul/city-competitiveness-index/2-gpci-the-mori-memorial-foundation/ (accessed on 10 February 2025).
- OECD Regional Outlook 2022: Bridging Divides. 2022. OECD Publishing. Available online: https://www.imf.org/en/publications/reo?sortby=Region&series=Asia+and+Pacific (accessed on 10 February 2025).
- Scott, A.J. The Constitution of the City: Economy, Society, and Urbanization; Palgrave Macmillan: London, UK, 2020. [Google Scholar]
- Sassen, S. Cities in a World Economy, 5th ed.; Sage Publications: Washington, DC, USA, 2018. [Google Scholar]
- Kitchin, R. The Datafied City: Big Data and Urban Governance; MIT Press: Cambridge, UK, 2023. [Google Scholar]
Disclaimer/Publisher’s Note: The statements, opinions and data contained in all publications are solely those of the individual author(s) and contributor(s) and not of MDPI and/or the editor(s). MDPI and/or the editor(s) disclaim responsibility for any injury to people or property resulting from any ideas, methods, instructions or products referred to in the content. |
© 2025 by the authors. Licensee MDPI, Basel, Switzerland. This article is an open access article distributed under the terms and conditions of the Creative Commons Attribution (CC BY) license (https://creativecommons.org/licenses/by/4.0/).