Abstract
Greenways offer sustainable benefits at ecological, cultural and economic levels, enhancing human well-being. Landscape performance assessment is a crucial task for evaluating these benefits and guiding the sustainable development of greenways. To clarify the characteristics and roles of landscape performance in the development of the US greenway system, text analysis was conducted using KH Coder, and a meta-analysis was performed on three databases to select research cases on greenway performance evaluation in the US. The results show that the evaluation of social performance is higher than that of ecological and economic performances, and the data related to economic performance is more difficult to obtain. The efficacy of greenway projects varies with the construction stage and is influenced by social background and target benefits. The sustainability characteristics of high co-occurrence relationships are key to guiding greenway performance assessment, which helps in selecting indicators for evaluating greenways and providing references for improving planning directions. In the future, innovative technical means tailored to the goals of greenway landscapes should be used for performance evaluation.
1. Introduction
The term “Greenway” first appeared officially in 1987 in the Report of the Commission on the Presidency of the United States. The definition in this report is critical: a vibrant network of greenways that give residents easy access to open space near their homes and that connect rural and urban landscapes throughout the United States, like a vast circulatory system extending through urban and rural areas. The park system planned by Olmsted in Boston in 1867 is regarded as the prototype of greenways [1]. The concept of greenways gradually took shape from the late 1960s to the early 1970s [2]. With the rise of environmental protection awareness and the innovation of urban planning concepts, policies such as the National Environmental Policy Act of 1969 provided opportunities and theoretical support for the construction of greenways and other green infrastructure [3]. Since the 1990s, cities across the United States have initiated the global greenway movement. As a complex natural–humanistic system, greenways have become part of green infrastructure and are of great significance for enhancing human well-being [4,5,6] (Figure 1). In 1987, Little presented the definition of greenways in his book “Greenways in the United States.” Greenways can be classified into five types: leisure greenways, urban river corridors, scenic trails or historical routes, ecological and natural corridors, and comprehensive greenway network systems. According to J. G. Fábos’ definition, the construction period is divided into five stages: The first phase, from 1867 to 1900, was the early greenway planning. The second phase, from the 1900s to 1960, was the greenway planning by landscape architects. The third phase, from the 1960s to the 1980s, was the greenway planning under the influence of the environmental movement. The fourth phase, from the 1980s to the 1990s, was the greenway naming movement. The fifth phase, from the 1990s to present, has been the stage when greenways have become an international movement [7]. Contemporary greenways, composed of linear elements forming a land network, are planned and designed for multiple purposes [8]. They connect urban parks and communities, facilitating human–nature interactions and providing valuable ecological services and environmental benefits. Greenways also protect natural, historical, and cultural resources [9,10], enhance residents’ quality of life, and offer social benefits [11]. Additionally, they create business opportunities and increase land and property values, yielding economic benefits [12]. Although greenways have many benefits, if they are not properly planned, designed and managed, they may also have unexpected negative environmental consequences, such as greenway design that only considers human use and ignores ecological functions, may introduce wildlife into high-risk urban areas, or excessive lighting, noise and human activities may interfere with human disturbance. It makes the originally designed “corridor” become the “barrier” that they cannot or do not want to cross, which just confirms the necessity and importance of continuous landscape performance evaluation.
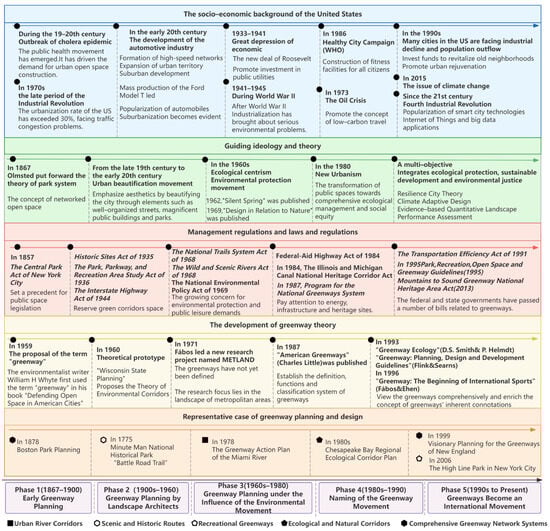
Figure 1.
Evolutionary history of greenways in the United States.
In 2010, the Landscape Architecture Foundation (LAF) introduced the Landscape Performance Series (LPS), which defines landscape performance assessment as the measurement of a landscape’s achievement of its predetermined goals and its contribution to sustainable development [13]. The LPS quantifies the benefits of completed landscape projects through the Case Study Investigation (CSI) program [14]. This method provides a scientific basis for design decisions, reflects construction efficiency, enhances stakeholders’ understanding of sustainable outcomes, and facilitates timely adjustments in the planning or design process [15]. The theoretical basis of landscape performance assessment is based on the concept of sustainable development. Just as emphasized in the 2003 United Nations Millennium Ecosystem Assessment (MEA) report, landscape performance aims to evaluate the environmental, social, and economic benefits of landscapes, aligning with the three pillars of sustainability: environmental friendliness, social equity, and economic feasibility [16]. The selection of indicators is usually tailored to the characteristics of the case. The first step is to analyze the sustainable features. Identifying the sustainable features is the key to evaluation, and quantitative evaluation of the sustainable features is the core of evaluation [17].
Landscape performance evaluation provides a clear assessment of the quality of landscape architecture projects and their actual performance benefits. It also includes greenway landscape projects [18]. The evaluation results applied to greenways are abundant [19,20]. However, relevant studies mainly focus on the selection of evaluation indicators and methods [21]. Single cases are the main body of the analysis of evaluation practice [22], lacking meta-analysis of multiple case samples of the same project type and horizontal and vertical selection of multiple typical cases for unified discussion on a unified theme [23]. In addition to the aforementioned issues, the current landscape performance assessment framework is characterized by its broad scope, encompassing a wide range of landscape projects. This extensive coverage has led to the generalization of evaluation indicators and methods, which in turn has resulted in inefficient performance assessments for specific projects such as greenways [24]. The purpose of this study is to identify and optimize the selection of indicators specifically tailored for greenways, thereby enhancing the efficiency and accuracy of performance evaluations for this particular type of project.
Based on the landscape performance evaluation framework, this paper suggests the adaptive index system for the performance evaluation of greenways. By using the KH Coder software, we conducted a quantitative and qualitative combined analysis on greenways’ landscape performance research documents. We carried out a meta-analysis on the cases of greenway performance evaluation in the United States from three databases: the LPS case library, the LAUP thesis collection, and the academic conference papers collection of Fábos Landscape and Greenway Planning. Through this process, we identified key characteristics and trends in U.S. greenway performance evaluation, proposed targeted improvements, and offered insights for greenway development, landscape performance research, and LPS plan updates.
2. Materials and Methods
2.1. Research Methodology
Data Source: As of November 2023, CSI had recorded 194 landscape assessment cases, including 16 greenway cases, among which 9 are from the United States. To expand the sample size of the performance assessment of greenways in the United States, two additional databases were used: the international journal Landscape and Urban Planning (LAUP), which aims to propose sustainable solutions for landscape changes, and the proceedings of the Fábos Landscape and Greenway Planning Academic Conference, which aims to study the origin, development and trends of greenways worldwide. Using the search terms “greenway” and “trails” as retrieval keywords, and with the geographical location of the research project being the United States as the screening condition, a preliminary pre-search was conducted on the literature reports. Thus, 48 cases of performance evaluation of greenways in the United States were selected. The case names and sources are detailed in the following table (Table 1).

Table 1.
Case Names and Sources of Greenways and Their Performance Evaluations.
The decision to limit this review to the United States was based on methodological considerations. The political, legal, cultural and economic backgrounds within the United States are relatively consistent, and there are standardized and high-quality performance data available (such as through the LPS system), which enables a controlled and systematic cross-case analysis. Moreover, the greenway project originated in the United States and has already formed a complete system. Building on a critical foundational understanding of greenway cases in the United States can serve as a starting point for broader comparative studies in Asia and Europe in the future [25,26].
Data preprocessing: Review the full texts of 48 case studies and extract text fragments related to greenway names, locations, types, evaluation contents, construction times, landscape performance benefits, etc. Follow the structure of “Group: Category: Subcategory” (Benefit Type: Sustainable Feature: Specific Evaluation Indicator) to organize the three-level coding of the greenway landscape performance system [27]. The relationships between each level are subordinate. For example, “Ecological benefit: Transportation: The number and proportion of various modes of transportation”. When screening and defining the evaluation indicator information, according to the landscape performance definition, two principles are followed: (1) The evaluation result of the indicators can be quantified; (2) The evaluation benefits have sustainability and reflect the current situation. Greenway types are classified according to the classification standards in the previous review. Projects that meet multiple criteria are summarized and determined as a single type according to the evaluation report’s evaluation quantity feature. The construction time of greenways is based on the final completion time of greenways involved in the assessment report, and the evaluation time is recorded according to the report’s release date.
Software analysis: The extracted text fragments are encoded, quantified, and analyzed for their correlations using the quantitative content and text mining software KH Coder. This software supports multiple languages and visualization. During the encoding process, terms such as indicators and methods are standardized to facilitate statistical measurement. After measurement, descriptive statistics, cross-tabulation, and co-occurrence networks are used to conduct visualization analysis.
2.2. Overall Hierarchical Analysis of Greenway Landscape Performance Indicators System
2.2.1. Greenways Landscape Performance Indicators
The quantitative analysis of 48 case indicators was classified under the system of “Benefit Classification: Sustainable Characteristics: Evaluation Indicators”, revealing the distribution and hierarchical relationship within the performance evaluation indicator system of greenway landscapes (Table 2). The indicators of the case objects were divided into 3 types of benefits and 29 sustainable characteristics, totaling 184 evaluation indicators.
Table 2.
Hierarchical Structure of the Performance Evaluation System for Greenway Landscape.
From the hierarchical indicator count chart (Figure 2), at the level of benefit type (the outer layer of the circle in Figure 2), the number of sustainable features and evaluation indicators included in social and ecological benefits is similar and greater than that included in economic benefits. At the level of sustainable features (in inner layer of the circle in Figure 2), the number of subcategory indicators related to the evaluation of “transportation”, “recreation and social value”, “healthy and high-quality life”, “land creation and efficiency”, “flood control”, “rainwater management”, “visitor consumption and income”, “economic growth”, and “construction cost” is relatively large, which means that when evaluating corresponding benefits, there are also more indicators to choose from.
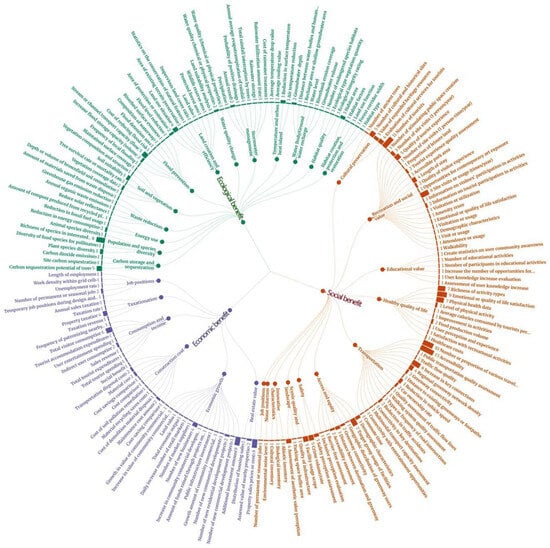
Figure 2.
The hierarchical coding count results of the Benefit Types: Sustainable Features: Specific Evaluation Indicators of the Greenway Landscape Performance Indicators. The outermost circular chart reflects the quantity and proportion of the collected indicators.
The assessment methods for the “transportation” aspect of greenways include conducting traffic monitoring by analyzing traffic flow and speed data, measuring traffic accessibility and non-motorized traffic attractiveness, and revealing the user behavior of greenway users and the effectiveness of design [28,29,30]. For instance, Knoxville Oasis Greenway uses the peak-hour count data to accurately measure the traffic volume and speed of vehicles passing through the greenway, thereby verifying the effectiveness of traffic calming facilities and traffic diversion measures in the greenway’s traffic design [4].
The assessment of “Leisure and Social Value” and “Quality of Life for Health” is mainly conducted through on-site questionnaire surveys and social media analysis. Effective questionnaire surveys and scale design are crucial for performance evaluation. For instance, the Cincinnati area tri-Continental trail greenway collected 734 valid questionnaires at 20 locations using the intercept survey method with electronic tablets. The questionnaires evaluated the activities of greenway users in the trail sections and the usage of related facilities. The questionnaire contents included travel characteristics, users’ views on the greenways, socio-demographic information, and location information. Descriptive statistics, statistical correlation analysis, and geographic mapping were used to analyze the survey results, converting the results of perception surveys such as attitudes and preferences into quantifiable data [31].
The indicators related to the ecological benefits, such as “Land creation and efficiency,” “Flood prevention,” and “Population and species diversity”, of the greenways are evaluated by leveraging data obtained through unmanned aerial vehicles and remote sensing technologies. By applying remote sensing, genetic analysis, and ecological modeling techniques, the accuracy and efficiency of the evaluation can be enhanced. The ecological impact of the greenways on the surrounding areas is assessed [32,33]. For instance, Brooklyn Sunset Park Greenway has developed a toolkit for green infrastructure design, aiming to identify various recurring conditions along the entire 14-mile greenway, such as the boundaries of flood-prone areas, topography, the direction and volume of existing rainwater runoff, street geometry, groundwater level height, the possibility of forward drainage, and the current land use situation. The evaluation aims to assess the potential of the greenway as a green infrastructure [34].
To assess “Economic growth” and “Construction cost”, market research is necessary. The interests of various stakeholders should be taken into account. The assessment should be conducted by comparing costs and benefits. This requires the relevant management of the greenway to provide detailed cost reports [35]. For example, Tammany Trace Railway Research utilized the user statistics provided by Trace Ranger from 2008 to 2014, which included data from local, out-of-state, out-of-district and international tourists, as well as access data from KidsKonnect (an online learning platform), to analyze and obtain the expenditures on dining, accommodation, bicycle parts and equipment, accommodation and fuel, and quantify the economic impact brought by the greenway [36].
The number of indicators can partially depict the difficulty of quantifying benefits. Analysis of the case studies on greenway performance evaluation indicates that currently, social and ecological benefits dominate the greenway performance evaluation, indirectly suggesting that evaluating the economic benefits of greenways is more difficult than social and ecological benefits. In the current greenway performance evaluation, new technologies and multi-disciplinary integration methods have been adopted [27,37], but new technologies that can save labor and time (such as machine learning) are still very limited in application. This is due to two reasons: one is the technical difficulty that makes them hard to popularize in the evaluation process, and the other is the delay in research results due to the need for time for report upload and review, resulting in a lag in application performance.
2.2.2. Common Performance Evaluation Tools for Greenways
Among the 48 case studies summarized, five commonly used online access assessment tools were applied to the quantitative analysis of greenway benefits (see Table 3). Specifically, they include i-Tree Eco (ecosystem service assessment tool), EPA’s Motor Vehicle Emissions Simulation System (MOVES), Eco-Visio (greenway usage monitoring platform), iNaturalist (biodiversity record platform), and Community Recreation Observation System (SOPARC). It is worth noting that i-Tree Eco, iNaturalist and SOPARC have been included in the 32 preferred toolkits of the Landscape Planning Support System (LPS) database. These tools can achieve greenway benefit assessment through two paths: first, directly calculate the ecological benefits (such as carbon sink capacity, species diversity) and social benefits (such as public leisure participation degree) of the greenway; second, establish a conversion model from ecological and social benefits to economic value by quantifying the assessment results (such as carbon trading pricing, health cost savings accounting).
Table 3.
General Toolkit for Greenway Performance Evaluation.
The information age has increased demand for large-scale data processing and cross-scale spatial assessment. Meanwhile, new technologies (such as big data analysis, machine learning, eye-tracking, electroencephalography, etc.) have been gradually applied to the field of performance assessment. However, the assessment modeling tools provided by the LPS website mainly target small-scale landscapes, and some of these tools have limited application scopes and require professional skills for support. To make up for this deficiency, this article will introduce emerging technology tools that have not been applied in the 48 assessment cases. These tools are expected to provide more efficient methods and ideas for the performance assessment of greenway landscapes.
3. Results
3.1. Analysis of the Correlation Between Greenway Types and Periods
3.1.1. The Correlation Between Greenway Types and the Construction Period of Greenways
The development of greenways is closely linked to the historical context of the United States. From the heat maps of the construction stages of various types of greenways (Figure 3), it can be seen that most of the evaluated greenways were constructed in the fifth phase, especially comprehensive network systems, leisure greenways, and urban river greenways. In the first stage, during the nascent period of greenways, the number of projects was limited, and theoretical research dominated. Therefore, this study did not cover this period. In the second phase, as the comprehensive greenway network and leisure greenways emerged, they were promoted by the Olmsted urban park movement. Greenways were constructed to provide scenic lanes for leisure purposes. In the third and fourth phases, ecological natural corridors emerged, benefiting from the environmental protection movement in the 1970s. In the third and fifth phases, scenic trails and historical routes were extensively built, related to the construction of American heritage corridors that emerged after the 1960s and the approval by the US Congress of 23 heritage corridor projects in 2001. During the fifth phase, a large number of leisure greenways and river corridors were built, echoing the multi-objective environmental ethics view of environmental protection, sustainable development, and environmental justice that emerged since 1990.
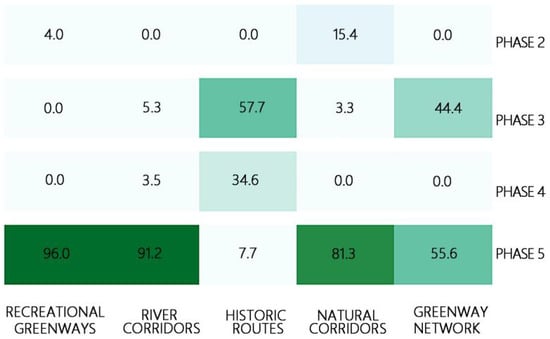
Figure 3.
Heat map of the construction stages of various types of greenways. The X-axis represents the five types of greenways, and the Y-axis represents the four different stages of greenway development. The depth of green color indicates the percentage of the assessment distribution. The sum of all values in any column is 100.0 vertically.
3.1.2. The Correlation Between the Types of Greenways and the Evaluation Periods of Greenways
According to the time heat map of the assessment of various types of greenways (Figure 4), the earliest type of greenway to undergo extensive assessment was the historical route. From 1995 to 1999, the number of assessments for this type of greenway was the highest. The ecological natural corridor was extensively assessed from 1995 to 1999, and then from 2005 to 2009. The urban river corridor and the comprehensive greenway network were also assessed before 2005. From 2010 to 2014, and then from 2015 to 2019, the number of assessments for these two types suddenly increased. From 2015 to 2019, the number of assessments for all five types of greenways increased. Since 2010, especially since 2020, the assessment research on recreational greenways and the comprehensive greenway network system has been the most frequent.
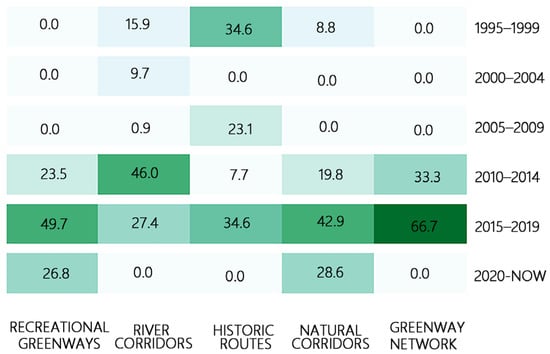
Figure 4.
Heat map of assessment time for various types of greenways. The X-axis represents five types of greenways, and the Y-axis represents six assessment periods of greenways. The depth of green color indicates the proportion of different distributions of assessments. The sum of all values in any column is 100.0 vertically.
The types of greenways and the evaluation period can reflect the development trend of landscape performance assessment in the United States. In the cases selected for this study, the data sources for greenway evaluation cases before 2010 were Landscape and Urban Planning and Fábos, the proceedings of the Landscape and Greenway Planning Academic Conference. The evaluation was mainly based on the Post-Use Evaluation System (POE) proposed in the late 1960s, the series of Sustainable Community Planning and Development Assessment (LEED-ND) proposed by the American Green Building Council in 1988, and the Sustainable SITES Initiative (SITES) released by four authoritative institutions in the United States in 2005. POE, LEED-ND, and SITES are all evidence-based evaluation systems. The scoring process of these systems mostly relies on predictions rather than actual measurements, rather than the actual performance during construction and use. To fill this gap, in 2010, LAF introduced the concept of landscape performance and initiated the Case Study Investigation Program (CSI). The concept of landscape performance was not originated by LAF. The development history of landscape performance assessment in the United States can be understood as emerging in early non-specialized evidence-based evaluation systems such as POE, SITES, and LEED-ND, and then being formally established when LAF proposed the landscape performance assessment system. Several years after LAF proposed the concept of landscape performance, a large number of greenway landscape performance evaluations were conducted.
3.2. Correlation Analysis of the Construction Period of Greenways and the Characteristics of Landscape Performance Evaluation Indicators
The greenways constructed in different periods do not focus on the same types of benefits. These trends can be reflected in the bubble charts of greenway benefit types at different phases (Figure 5). By analyzing the bubble sizes and development stages in the bubble charts, in the third phase, the ecological benefit bubbles are larger, highlighting the importance of ecological factors in the performance of greenway landscapes during the environmental protection movement period. In the fourth stage, ecological benefits are on par with educational, historical and aesthetic functions. By the fifth stage, various benefit indicators have significantly increased, and social and economic indicators have become more prominent, continuously emphasizing the assessment of the diverse functions and actual benefits of greenways.

Figure 5.
Bubble chart for evaluating the benefits of greenways at different stages. The X-axis represents three main types of benefits, while the Y-axis represents the four different stages of greenway development. The area of the squares in the vertical direction indicates the proportion of indicators within a certain type of benefit. The total sum of all squares in the vertical direction for any type of benefit is 100%.
The sustainable characteristics of greenways vary across different periods, which can be observed from the bubble charts of the sustainable characteristics of greenways at different stages (Figure 6). In the second phase, greenways emphasized “Transportation”, “Job positions”, “Cultural preservation”, “Habitat creation, protection and restoration”, “Recreation and social value”, and “Economic growth”. During this phase, the National Park Service and landscape architects played a key role in integrating the ecological, social, and economic sustainability of greenways, connecting urban and natural landscapes. In the third phase, the completed greenways mainly brought ecological benefits such as “Land creation and efficiency”, “Soil and vegetation”, “Habitat quality”, and “Population and species diversity”. These benefits manifested as open-space systems on a metropolitan scale, with their main function being leisure and natural landscape protection. In the fourth phase, the completed greenways added sustainable characteristics such as “Water body/ground water recharge” and economic benefits such as “Real estate value” and “Taxation.”. These sustainable characteristics were related to urban or rural life and economic development. During this phase, the greenway movement was officially named, and the report of the US President’s Committee on Outdoor Activities recommended the formation of a greenway lifestyle network. In the fifth phase, the performance evaluation of greenways was the most extensive, and the evaluation indicators used constituted a complete greenway landscape performance evaluation system. More and more regions began to attach importance to the planning and construction of greenways, regarding them as one of the important ways to improve urban environments and promote sustainable development. Cities are more concerned about global issues such as “Waste reduction”, “Temperature and urban heat island”, “Carbon storage and sequestration”, and “Energy use”, and emphasize the importance of “Flood prevention”, “Stormwater management”, “Transportation”, and “Economic growth” when formulating urban planning policies.
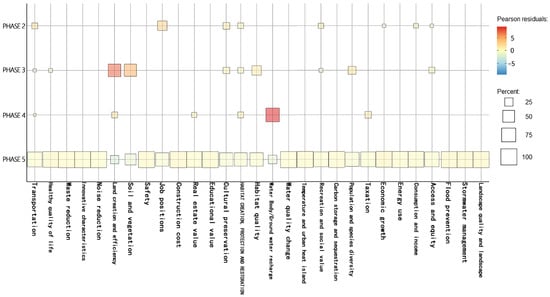
Figure 6.
Bubble chart showing the distribution of sustainable characteristics of greenways at different stages. The X-axis represents 33 sustainable characteristics, and the Y-axis represents the four development stages of greenways. The size of the squares indicates the vertical degree of each sustainable characteristic. The sum of all squares in any column of sustainable characteristics equals 100%.
As time goes by, the functions of greenways have become increasingly complex and multi-faceted, reflecting an increasing number of goals. Factors such as community participation, cultural heritage, public policies, economic development and sustainable development goals influence greenway planning, resulting in the diversification of sustainable benefits. Therefore, the assessment of greenways must take into account social, ecological, cultural and policy-oriented goals.
3.3. Analysis of the Co-Occurrence of Greenway Types and Sustainable Characteristics
Analyzing the co-occurrence relationship between greenway types and sustainable characteristics is helpful for deepening the understanding of greenway features and providing a basis for future performance evaluation. If a certain sustainable characteristic has a high co-occurrence relationship with a specific type of greenway, it indicates that this characteristic is universal in that type of greenway. In the co-occurrence relationship diagram of greenway types and sustainable characteristics (Figure 7), several pairs of high co-occurrence relationships are obtained. Recreational greenways are related to “Recreation and social value” and “Health quality of life”. Ecological and natural corridors are related to “Water body/ground water recharge”, “Land creation and efficiency”, and “Soil and vegetation”. Scenic and historic routes are related to “Land creation and efficiency” and “Cultural protection”. Urban river corridors are related to “Economic growth” and “Flood prevention”. Comprehensive greenway networks are related to “Transportation”. These high co-occurrence associations indicate that there is a close connection between greenway types and sustainable characteristics.
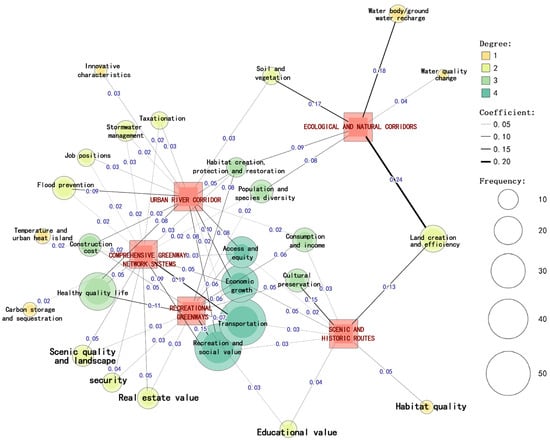
Figure 7.
Co-occurrence relationship between different development stages and various sustainable characteristics. Red squares represent five types of greenways. Different colored circles represent different sustainable characteristics, with colors ranging from yellow to blue, indicating that the stronger the “centrality”, the more central the position of the characteristic in the co-occurrence network. Circle size corresponds to feature frequency. Edge thickness reflects co-occurrence intensity between feature pairs, where thicker lines denote stronger inter-characteristic correlations. Jaccard coefficients displayed on edges quantitatively measure pairwise co-occurrence strength.
The sustainable characteristics of leisure greenways are more focused on social benefits, emphasizing improved quality of life, diverse leisure activities, and enhanced community cohesion through greenway networks. Urban river greenways feature specific sustainability traits in flood control, ecosystem restoration, and landscape enhancement, with benefits centered on improving river ecosystems, strengthening flood resilience, and urban beautification. Ecological natural corridors prioritize habitat quality, biodiversity, and water resource protection, with benefits focused on supporting species habitats and migration. Comprehensive greenway network systems combine these characteristics and have complex and diverse sustainable characteristics, with the focus on forming a convenient, accessible, and extensive urban–rural network.
The sustainability characteristics with high co-occurrence relationships often represent the core goals and key influencing factors of greenway projects. This co-occurrence mapping bridges the gap between normative planning (idealized sustainable development goals) and performance-driven design (attribute priority ranking based on evidence). Through this assessment paradigm with awareness of correlation, planners can align greenway intervention measures with the sustainable development priorities of greenway functions.
4. Discussion
Machine learning enhances the objectivity and accuracy of greenway landscape evaluation by integrating multi-source data and nonlinear modeling. In ecological benefit assessment, algorithms such as Random Forest and XGBoost quantify vegetation-related metrics (e.g., NDVI, canopy density, leaf area index), achieving higher cross-validation accuracy than traditional InVEST models [38,39]. In social benefit assessment, semantic networks linking landscape elements with perceptual texts are constructed via joint learning of scene segmentation and semantic segmentation. For instance, weakly supervised learning extracts landscape features from photo metadata, while BERT model analyzes the sentiment tendencies of social media texts, thereby achieving large-scale data quantification related to the impact of landscape quality on health, emotions and quality of life [40,41]. In economic benefit assessment, collaborative valuation models integrate multi-source heterogeneous data. Graph neural networks analyze UAV imagery, street scene segmentation, and public opinion derived from NLP, identifying economic contributions such as property value premiums and employment opportunities [42].
The greenway landscape, as a synthesis of urban natural elements and humanistic spaces, necessitates transitioning from traditional subjective questionnaire surveys to objective physiological index analysis grounded in neuroscience. Eye-tracking and electroencephalography (EEG) technologies provide multidimensional empirical support for understanding the healing mechanisms, visual preferences, and economic value of greenway landscapes. These tools record visual behavior patterns (e.g., fixation points, scanning paths, pupil diameter), brain activation states (e.g., alpha wave relaxation, beta wave concentration), and autonomic nervous system responses. For example, eye-tracking technology reveals visual attention distribution patterns in greenways [43], enabling the construction of personalized attention restoration models to differentiate landscape demand profiles between high-stress individuals and the general population. EEG technology quantifies neural mechanisms underlying emotional regulation and cognitive restoration by analyzing brainwave frequency bands and event-related potentials (ERPs). By synchronizing eye-tracking and portable EEG devices, researchers can monitor initial fixation times and theta wave energy in landscape areas, thereby assessing visual appeal and relaxation effects, and linking these metrics to landscape quality, health outcomes, and quality of life [44].
5. Conclusions
The assessment of U.S. greenway landscape performance provides valuable guidance for governments, planners, and designers. Based on 48 cases from three data sources, we developed a three-level coding system—“benefit classification–sustainability characteristics–evaluation indicators”—to address the gap in specialized greenway evaluation. Our analysis reveals correlations between greenway types and sustainability features, offering methodological support for differentiated evaluation. Key findings are: (1) U.S. greenway evaluation emphasizes social and ecological benefits, with economic indicators underrepresented due to limited data; the LPS program has improved system completeness. (2) Greenway effectiveness evolves with construction stages, with the fifth stage (1990–present) showing the most comprehensive coverage across social, economic, and ecological dimensions. (3) High co-occurrence clusters between greenway types and sustainability characteristics provide universal guidance for indicator selection.
We recommend applying new technologies (e.g., machine learning, eye-tracking) to improve efficiency and accuracy, strengthening economic performance studies, and integrating evaluation into life-cycle management with multi-sector collaboration and public participation. Future research should compare cases across regions to test the universality of indicators. Although there are similarities between the objectives and the basic design principles, institutional, financial and social participation factors have a significant impact on the actual effect of greenway projects in different regions. Therefore, the evaluation indicators proposed in this study may need to be adjusted in terms of policy institutions, cultural preferences, and ecological/land conditions when applied to Asian or European contexts. Ultimately, the broad significance of this research does not lie in promoting a rigid American model, but in providing a toolkit of flexible assessment concepts, methods, and potential pitfalls. It offers a starting point for other countries, enabling them to establish greenway performance assessment systems that suit their own characteristics based on their cultural backgrounds and environmental needs, and to draw on the experiences and lessons from mature practices.
Author Contributions
Conceptualization, J.W.; methodology and software, Z.X.; supervision, Y.L.; project administration, Y.X. All authors have read and agreed to the published version of the manuscript.
Funding
This research was funded by the [Guangzhou Science and Technology Bureau Social Development Project] grant number [202203010058]. And The APC was funded by the [Guangdong Natural Science Foundation Project] grant number [2023A1515011451] and the [National Natural Science Foundation Project] grant number [51978274].
Conflicts of Interest
The authors declare no conflict of interest.
References
- Shibley, R.G.; Schneekloth, L.H. Olmsted Park and Parkway System for the 21st Century. In Proceedings of the Fábos Conference on Landscape and Greenway Planning, Budapest, Hungary, 8–11 July 2010; Volume 3. [Google Scholar] [CrossRef]
- Walmsley, A. Greenways and the making of urbaan form. Landsc. Urban Plan. 1995, 33, 81–127. [Google Scholar] [CrossRef]
- Fábos, J.G. Greenway planning in the United States: Its origins and recent case studies. Landsc. Urban Plan. 2004, 68, 321–342. [Google Scholar] [CrossRef]
- Bertulis, T.; Furth, P. Oasis Greenways: A New Model of Urban Park within Street Right-of-Ways in Dorchester, Massachusetts. In Proceedings of the Fábos Conference on Landscape and Greenway Planning, Amherst, MA, USA, 12–13 April 2013; Volume 4. [Google Scholar] [CrossRef]
- Bischoff, A. A Strategy for Integrating Public Art into Greenway Planning: A Look at the Design Competitions for the Canalside Bike Path in Turners Falls, Massachusetts. In Proceedings of the Fábos Conference on Landscape and Greenway Planning, Budapest, Hungary, 8–11 July 2010; Volume 3. [Google Scholar]
- Canzonieri, C. M.E. Benedict and E.T. McMahon, Green Infrastructure: Linking Landscapes and Communities. Landsc. Ecol. 2007, 22, 797–798. [Google Scholar] [CrossRef]
- Fabos, J.G. Introduction and overview: The greenway movement, uses and potentials of greenways. Landsc. Urban Plan. 1995, 33, 1–13. [Google Scholar] [CrossRef]
- Horte, O.S.; Eisenman, T.S. Urban Greenways: A Systematic Review and Typology. Land 2020, 9, 40. [Google Scholar] [CrossRef]
- Lardner, E.; Klein, J. More than a Trail: Greenways and Heritage Tourism. In Proceedings of the Fábos Conference on Landscape and Greenway Planning, Budapest, Hungary, 8–11 July 2010; Volume 3. [Google Scholar]
- Ryan, R.L.; Eisenman, T.S. Building Connections to the Minute Man National Historic Park: Greenway Planning and Cultural Landscape Design. In Proceedings of the Fábos Conference on Landscape and Greenway Planning, Amherst, MA, USA, 28–30 March 2019. [Google Scholar]
- Liu, Z.; Lin, Y.; De Meulder, B.; Wang, S. Can greenways perform as a new planning strategy in the Pearl River Delta, China? Landsc. Urban Plan. 2019, 187, 81–95. [Google Scholar] [CrossRef]
- Fasla, C.S. “But How Do We Get to the Greenway?”—A Multi-disciplinary, Multi-jurisdiction, Multimodal Strategy to Increase Connections to the Charles River Basin. In Proceedings of the Fábos Conference on Landscape and Greenway Planning, Amherst, MA, USA, 12–13 April 2013; Volume 4. [Google Scholar]
- Canfield, J.; Yang, B.; Whitlow, H. Evaluating Landscape Performance: A Guidebook for Metrics and Methods Selection; Landscape Architecture Foundation: Washington, DC, USA, 2018. [Google Scholar] [CrossRef]
- Shi-l, D.U. Landscape Performance: Past, Present, and Future. Landsc. Archit. 2015, 1, 40–51. Available online: https://www.semanticscholar.org/paper/Landscape-Performance%3A-Past%2C-Present%2C-and-Future-Shi-l/5713c320f73a62cb2f533428727257cce876235c (accessed on 20 September 2025).
- Luo, Y.; Li, M.-H. A Study of Landscape Performance: Do Social, Economic and Environmental Benefits Always Complement Each Other? Landsc. Archit. Front. 2014, 2, 42–56. [Google Scholar]
- Reid, W.V. Millennium Ecosystem Assessment: Ecosystems and Human Well-Being; World Resources Institute: Washington, DC, USA, 2005; ISBN 978-1-59726-040-4. Available online: https://www.wri.org/research/millennium-ecosystem-assessment-ecosystems-and-human-well-being (accessed on 20 September 2025).
- Li, M.-H.; Dvorak, B.; Luo, Y. Landscape performance: Quantified benefits and lessons learned from a treatment wetland system and naturalized landscapes. Landsc. Archit. Front. 2013, 1, 56–68. [Google Scholar]
- Miller, W.; Collins, M.G.; Steiner, F.R.; Cook, E. An approach for greenway suitability analysis. Landsc. Urban Plan. 1998, 42, 91–105. [Google Scholar] [CrossRef]
- Brown, R.D.; Corry, R.C. Evidence-based landscape architecture: The maturing of a profession. Landsc. Urban Plan. 2011, 100, 327–329. [Google Scholar] [CrossRef]
- Parton, L.C. Measuring the effects of public land use change: An analysis of greenways in Raleigh, North Carolina. Land Use Policy 2023, 131, 106689. [Google Scholar] [CrossRef]
- Luo, Y.; Li, M.-H. Landscape performance of built projects: Comparing Landscape Architecture Foundation’s published metrics and methods. Landsc. Archit. 2015, 2015, 52–69. [Google Scholar]
- Hoover, F.-A.; Meerow, S.; Coleman, E.; Grabowski, Z.; McPhearson, T. Why go green? Comparing rationales and planning criteria for green infrastructure in U.S. city plans. Landsc. Urban Plan. 2023, 237, 104781. [Google Scholar] [CrossRef]
- Yang, Y.; Guangsi, L. The Development, Connotations, and Interests of Research on Landscape Performance Evaluation for Evidence-Based Design. Landsc. Archit. Front. 2020, 8, 74. [Google Scholar] [CrossRef]
- Yang, B. Landscape performance evaluation in socio-ecological practice: Current status and prospects. Socio-Ecol. Pract. Res. 2020, 2, 91–104. [Google Scholar] [CrossRef]
- Balsas, C.J.L. The greenway planning movement in the Iberian Peninsula: A tribute. Landsc. Ecol. 2023, 12, 3329–3334. [Google Scholar] [CrossRef]
- Liu, Z.; Lin, Y.; Chung, C.K.L. Regional governance for greenways in China: A control rights perspective. J. Urban Aff. 2024, 1–19. [Google Scholar] [CrossRef]
- Mears, M.R.; Kiley, O.D.; Billetdeaux, N.J. Cuyahoga Greenways: A Community-Driven, Data-Enriched Initiative to Implement a Regional Greenway Vision. In Proceedings of the Fábos Conference on Landscape and Greenway Planning, Amherst, MA, USA, 28–30 March 2019; Volume 6. [Google Scholar]
- Furth, P.G.; Loutzenheiser, D.; Miller, S.; Noursalehi, P. A Greenway Network Vision for Metro Boston. In Proceedings of the Fábos Conference on Landscape and Greenway Planning, Amherst, MA, USA, 12–13 April 2013; Volume 4. [Google Scholar]
- Lindsey, G.; Qi, Y.; Gobster, P.H.; Sachdeva, S. The 606 at Three: Trends in Use of Chicago’s Elevated Rail-Trail. In Proceedings of the Fábos Conference on Landscape and Greenway Planning, Amherst, MA, USA, 28–30 March 2019; Volume 6. [Google Scholar]
- Shahani, F. The Role of Sustainable Greenways in Achievement of Improving the Quality of Life (Tehran’s Greenways as a Case Study). In Proceedings of the Fábos Conference on Landscape and Greenway Planning, Amherst, MA, USA, 12–13 April 2013. [Google Scholar]
- Chen, N.; Lindsey, G.; Johnston, W.; Adcock, K. Trail Users in the Cincinnati Metropolitan Region: Purposes, Patterns, and Preferences. In Proceedings of the Fábos Conference on Landscape and Greenway Planning, Amherst, MA, USA, 28–30 March 2019; Volume 6. [Google Scholar]
- Livingston, M.; Myers, D. Contributions of watercourse-associated greenways to green infrastructure: A comparison between two case studies in Arizona and Maryland, USA. In Proceedings of the Fábos Conference on Landscape and Greenway Planning, Budapest, Hungary, 8–11 July 2010. [Google Scholar]
- Zusmanis, V.D.; Alvarez, L.; Lipscomb, M.; Gravel, R. Implementing the Vision: The Atlanta BeltLine Corridor, Georgia, USA. In Proceedings of the Fábos Conference on Landscape and Greenway Planning, Budapest, Hungary, 30 June–3 July 2016; Volume 5. [Google Scholar]
- Martin, T. Greenways as Resilient Infrastructure: The Brooklyn Greenway Case Study. In Proceedings of the Fábos Conference on Landscape and Greenway Planning, Budapest, Hungary, 30 June–3 July 2016; Volume 5. [Google Scholar]
- Koske, P. Connecting the “Big Easy”: Lessons from the people surrounding the Lafitte Greenway in New Orleans, Louisiana. In Proceedings of the Fábos Conference on Landscape and Greenway Planning, Amherst, MA, USA, 12–13 April 2013; Volume 4. [Google Scholar]
- Hammons, H.T. Assessing the Economic Benefits of Multi-Use Trails and Greenways: A Case Study into the Tammany Trace Rail-Trail in St. Tammany Parish, Louisiana, U.S.A. In Proceedings of the Fábos Conference on Landscape and Greenway Planning, Budapest, Hungary, 30 June–3 July 2016; Volume 5. [Google Scholar]
- Cheng, C.; Brabec, E.; Yang, Y.-C.; Ryan, R. Effects of Detention for Flooding Mitigation under Climate Change Scenarios—Implication for Landscape Planning in the Charles River Watershed, Massachusetts, USA. In Proceedings of the Fábos Conference on Landscape and Greenway Planning, Amherst, MA, USA, 12–13 April 2013. [Google Scholar] [CrossRef]
- Zhang, Z.; Xin, Q.; Li, W. Machine Learning-Based Modeling of Vegetation Leaf Area Index and Gross Primary Productivity Across North America and Comparison With a Process-Based Model. J. Adv. Model. Earth Syst. 2021, 13, e2021MS002802. [Google Scholar] [CrossRef]
- Zhao, D.; Zhen, J.; Zhang, Y.; Miao, J.; Shen, Z.; Jiang, X.; Wang, J.; Jiang, J.; Tang, Y.; Wu, G. Mapping mangrove leaf area index (LAI) by combining remote sensing images with PROSAIL-D and XGBoost methods. Remote Sens. Ecol. Conserv. 2023, 9, 370–389. [Google Scholar] [CrossRef]
- Du, S.; Zhu, H.; Lin, G.; Liu, Y.; Wang, D.; Shi, J.; Wu, Z. Weakly supervised grounded image captioning with semantic matching. Appl. Intell. 2024, 54, 4300–4318. [Google Scholar] [CrossRef]
- Qin, X.; Yang, D.; Wangari, V.W. Quantitative characterization and evaluation of highway greening landscape spatial quality based on deep learning. Environ. Impact Assess. Rev. 2024, 107, 107559. [Google Scholar] [CrossRef]
- Law, S.; Paige, B.; Russell, C. Take a Look Around: Using Street View and Satellite Images to Estimate House Prices. ACM Trans. Intell. Syst. Technol. 2019, 10, 1–19. [Google Scholar] [CrossRef]
- Liu, L.; Qu, H.; Ma, Y.; Wang, K.; Qu, H. Restorative benefits of urban green space: Physiological, psychological restoration and eye movement analysis. J. Environ. Manag. 2022, 301, 113930. [Google Scholar] [CrossRef] [PubMed]
- Ma, R.; Luo, Y.; Furuya, K. Classifying visually appealing elements in parks using social media data-assisted eye-tracking: Case study of Shinsui parks in Tokyo, Japan. J. Outdoor Recreat. Tour. 2023, 44, 100672. [Google Scholar] [CrossRef]
Disclaimer/Publisher’s Note: The statements, opinions and data contained in all publications are solely those of the individual author(s) and contributor(s) and not of MDPI and/or the editor(s). MDPI and/or the editor(s) disclaim responsibility for any injury to people or property resulting from any ideas, methods, instructions or products referred to in the content. |
© 2025 by the authors. Licensee MDPI, Basel, Switzerland. This article is an open access article distributed under the terms and conditions of the Creative Commons Attribution (CC BY) license (https://creativecommons.org/licenses/by/4.0/).