


Exploring the Coordinated Development of Smart-City Clusters in China: A Case Study of Jiangsu Province


Abstract
1. Introduction
2. A Review of the Evaluation of the Balanced Development of Smart-City Agglomeration
3. Methods and Data Sources
3.1. Construction of the Evaluation Index System
3.1.1. Construction of the Evaluation Index System for the Population-Development Subsystem
3.1.2. Construction of an Evaluation Index System for the Economic-Development Subsystem
3.1.3. Construction of an Evaluation Index System for Social-Development Subsystems
3.2. Construction of the Coupled and Coordinated Development-Evaluation Model
3.2.1. Determination of Weights Using the Entropy Weight Method (EWM)
3.2.2. Modeling the Degree of Coordination of Coupled Demographic–Economic–Social Systems
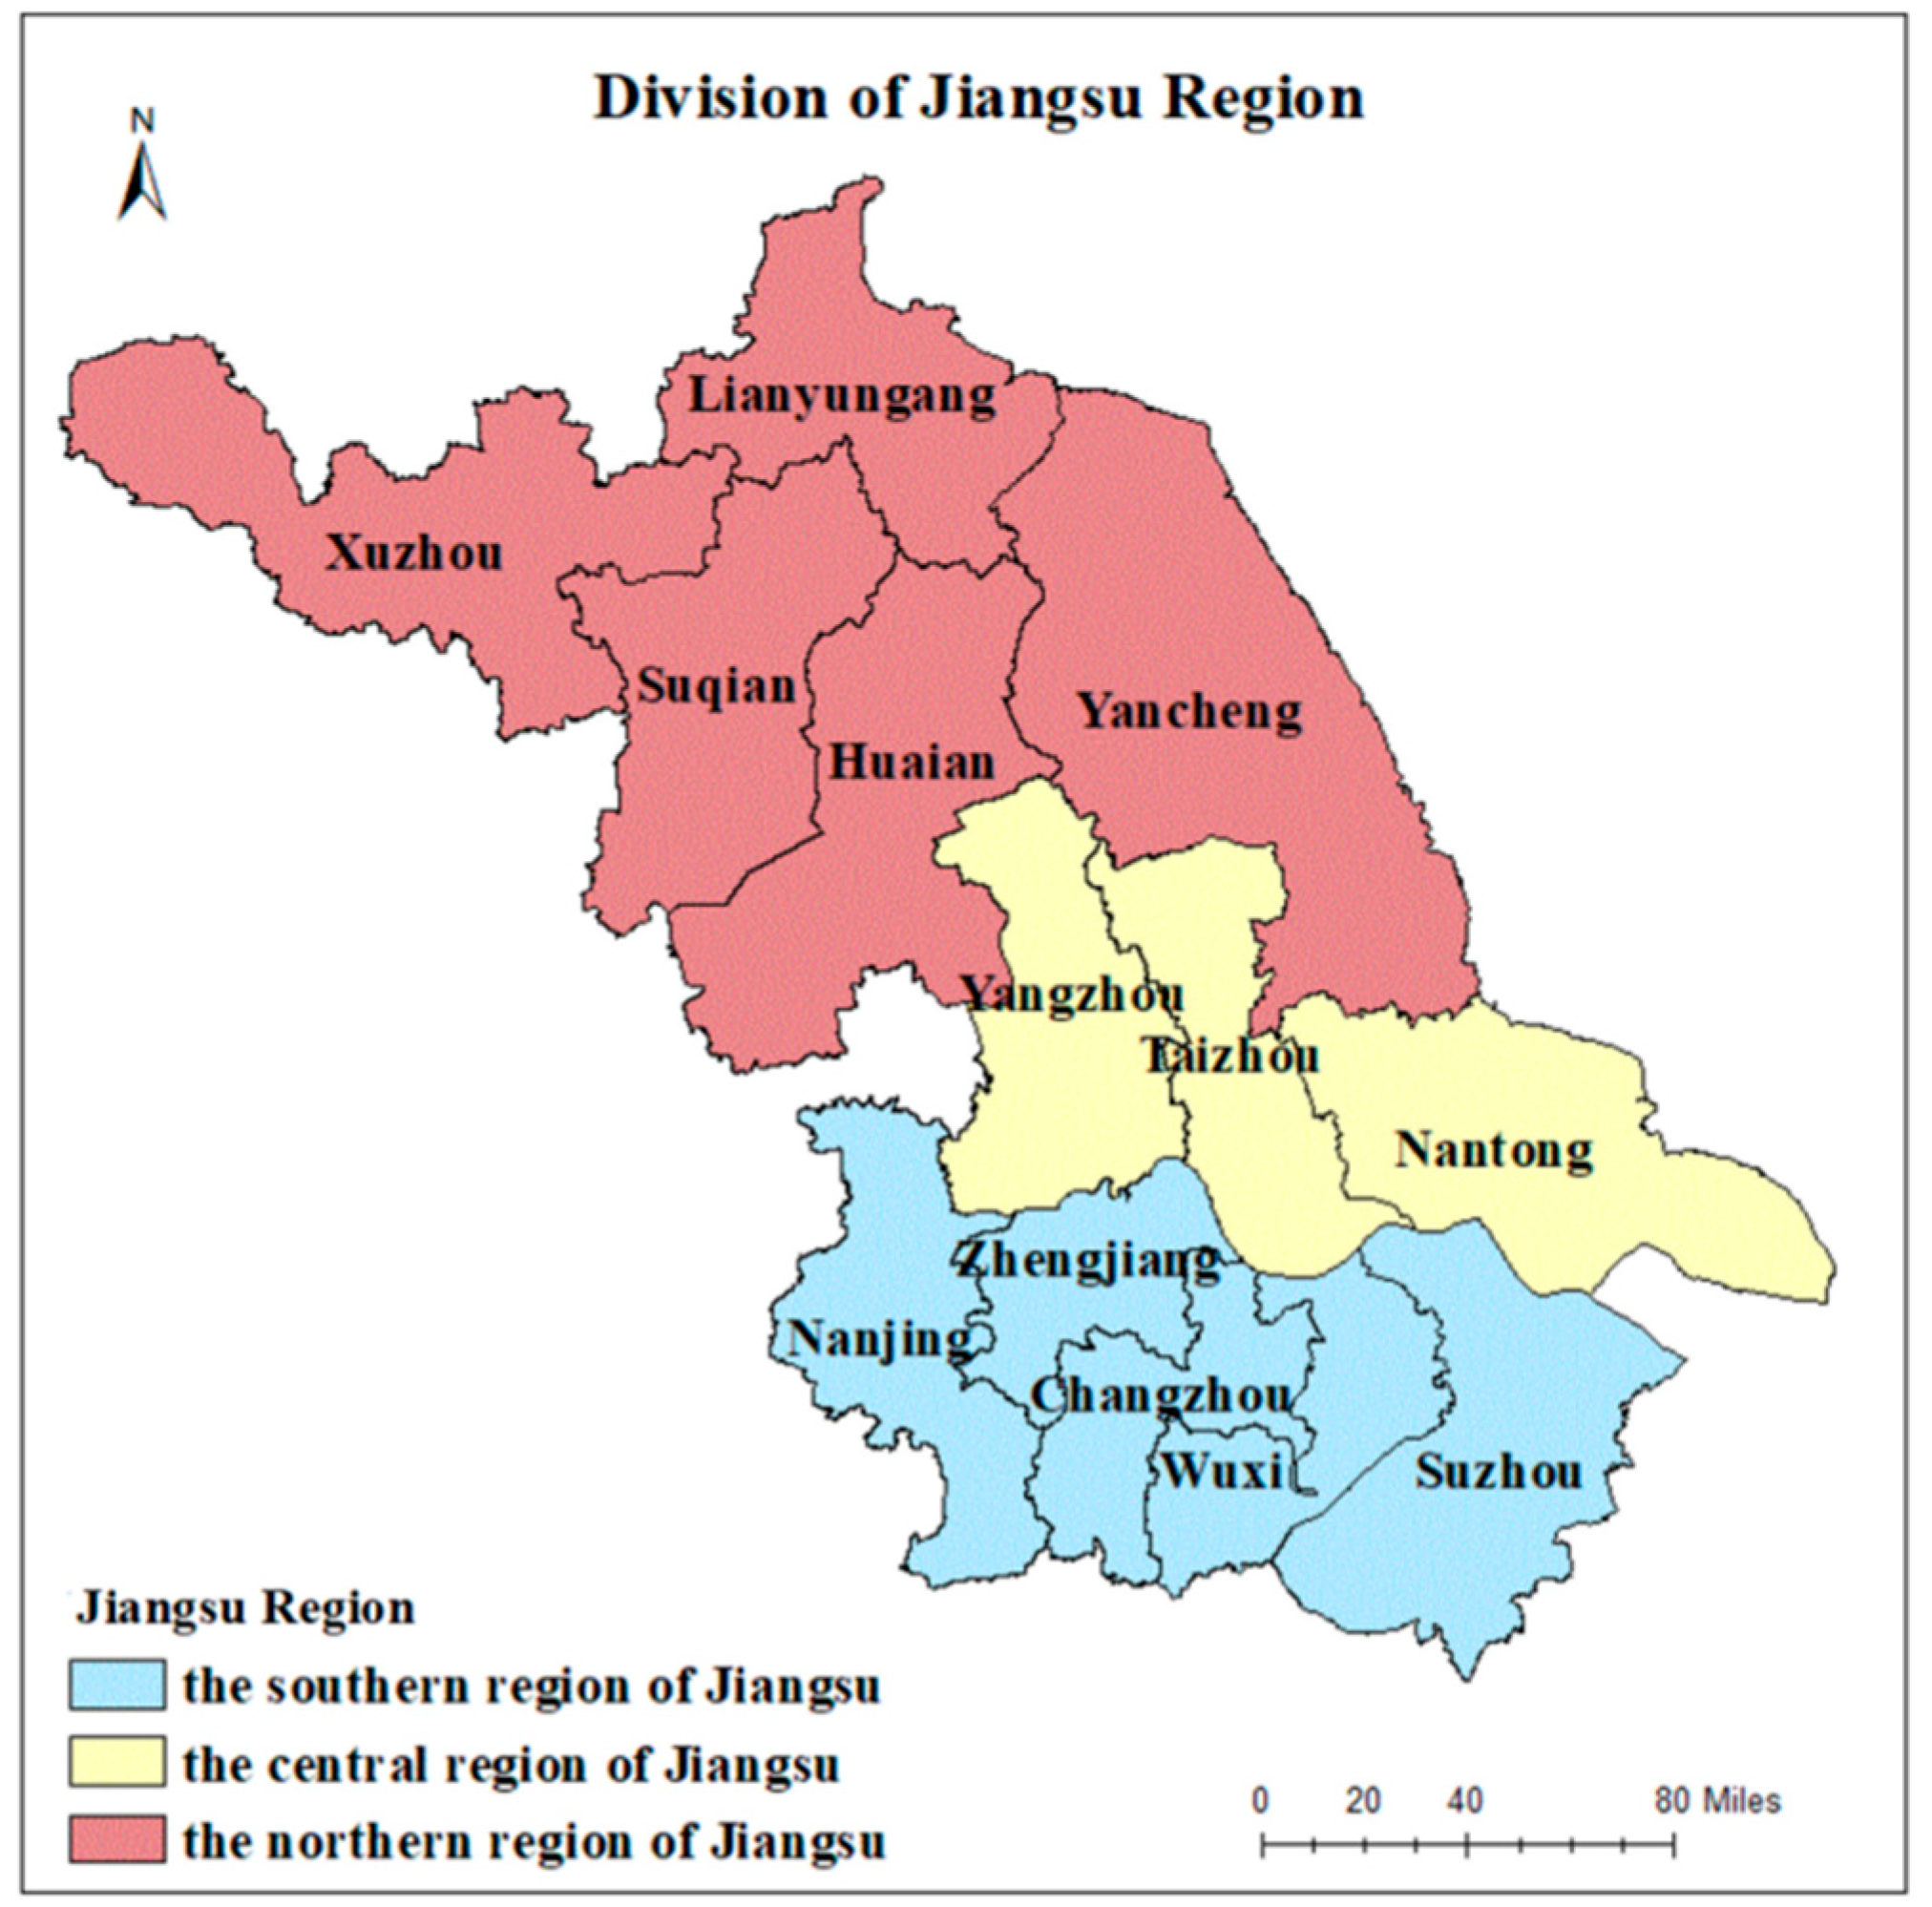
3.3. Study Area and Data Sources
4. Results
4.1. Index Weighting Values
4.2. Development Indices
4.3. Coordination Indices
5. Discussion
5.1. Geographic Differences
5.2. The Matthew Effect
5.3. Game Thinking
5.4. Differences in Industrial Structure
6. Conclusions
6.1. Strengthen Cross-Regional Cooperation
6.2. Promote Data Sharing and Interoperability
6.3. Deepen Industrial Synergistic Development
6.4. Foster Innovation Capacity
Author Contributions
Funding
Institutional Review Board Statement
Data Availability Statement
Conflicts of Interest
| 1 | There are various studies on the connotation of social development. In this paper, social development refers to the ecological environment, infrastructure, social security system, and scientific and educational development of the whole society, excluding population development and economic development. Essentially, social development is the social attributes of the environment and resources. The study of a population–economic–social-development system in this paper belongs to the research subfield of population economics. |
References
- Xiang, Y.; Jiang, Y. From Technological Transformation to Value Co creation: The Development and Evolutionary Logic of Smart Communities: A Diachronic Study Based on the “Palm Cloud Community” in Qixia District, Nanjing. Adm. Forum 2023, 30, 142–149. [Google Scholar]
- Wen, G. Digital Retina, Evolving Smart Cities from “Clear” to “Understanding”. Sci. China 2020, 12, 30–31. [Google Scholar]
- Wang, B.; Lu, P.; Zhen, F. Urban Geography Research in a Smart Society from the Perspective of Resident Activities. Geogr. Res. 2018, 37, 2075–2086. [Google Scholar]
- Del Bo, C. Smart Cities: Is It Just a Fad? Sci. Reg. Ital. J. Reg. Sci. 2018, 19, 7–14. [Google Scholar]
- Wu, Z.; Pan, Y.; Ye, Q.; Kong, L. Intelligent City Evaluation Index System: Development Process and Application. Eng. Geol. 2016, 2, 105–137. [Google Scholar]
- Cities Using Technological Solutions to Improve the Management and Efficiency of the Urban Environment. Available online: https://commission.europa.eu/eu-regional-and-urban-development/topics/cities-and-urban-development/city-initiatives/smart-cities_en (accessed on 20 February 2020).
- Lai, C.S.; Jia, Y.; Dong, Z.; Wang, D.; Tao, Y.; Lai, Q.H.; Wong, R.T.K.; Zobaa, A.F.; Wu, R.; Lai, L.L. A review of technical standards for smart cities. Clean Technol. 2020, 2, 290–310. [Google Scholar] [CrossRef]
- Liu, H.; Ma, L. Spatial pattern and effects of urban coordinated development in China’s urbanization. Sustainability 2020, 12, 2389. [Google Scholar] [CrossRef]
- Wang, C.; Meng, Q. Research on the sustainable synergetic development of Chinese urban economies in the context of a study of industrial agglomeration. Sustainability 2020, 12, 1122. [Google Scholar] [CrossRef]
- Liu, Z.; Wu, J. A Review of the Theory and Practice of Smart City Construction in China. Sustainability 2023, 15, 7161. [Google Scholar] [CrossRef]
- Cong, X.; Wang, S.; Wang, L.; Qi, Z.; Skibniewski, M.J. New smart city clusters’ construction level evaluation under economic circles: The case of Shandong, China. Technol. Econ. Dev. Econ. 2023, 29, 949–998. [Google Scholar] [CrossRef]
- Ghonimi, I.G. The role of urban space configuration in maintaining social inclusion: A comparison of four types of neighborhoods in greater cairo region-egypt. J. Urban Res. 2021, 39, 75–104. [Google Scholar] [CrossRef]
- Deng, X.; Liang, L.; Wu, F.; Wang, Z.; He, S. Regional Balanced Development in China from the Perspective of Development Geography. J. Geogr. 2021, 76, 261–276. [Google Scholar]
- Xiao, L. A Preliminary Study on the Theory and Practice of Coordinated Development of Regional Economy in China. Modern Business. 2010, 18, 58–60. [Google Scholar] [CrossRef]
- Xia, W.; Yu, G. Research on the Imbalance of Regional Economic Development in China. J. Anhui Norm. Univ. (Humanit. Soc. Sci. Ed.) 2018, 46, 111–121. [Google Scholar] [CrossRef]
- Li, Y.; Chen, H.; Xu, Z. Research on Integrated Water Resource Management Theory and Quantitative Evaluation Application: A Case Study of the Heihe River Basin. China Ind. Econ. 2010, 264, 139–148. [Google Scholar]
- Li, J.; Cao, Y.; Sun, C. Research on Regional Economic Differences and Coordinated Development in Henan Province. Econ. J. 2018, 35, 20–26. [Google Scholar] [CrossRef]
- Li, Z.; Zheng, K.; Zhong, Q. Comprehensive evaluation and spatial-temporal pattern of green development in Hunan Province, China. Sustainability 2022, 14, 6819. [Google Scholar] [CrossRef]
- Wu, Y.; Zhang, Y. Research on the Coupling and Coordinated Development of Regional Economic Growth and Environment in China. Resour. Sci. 2008, 1, 25–30. [Google Scholar]
- Liu, X. Quantitative evaluation of coordinated development of regional population, resources, environment, and economic systems. Stat. Decis. Mak. 2007, 229, 64–65. [Google Scholar]
- Wang, S.; Liu, Y. Measurement of Regional Coordinated Development Level from the Perspective of High Quality Development. Stat. Decis. Mak. 2023, 39, 99–104. [Google Scholar]
- Xu, C. Research on Regional Differences and Coordinated Development Based on Regional Economic Competitiveness. Ecol. Econ. 2008, 192, 46–51+157. [Google Scholar]
- Liu, Q.; Li, J. Industrial Structure Upgrading and Regional Economic Coordinated Development: Empirical Evidence from Provinces and Urban Agglomerations. Economist 2022, 8, 53–64. [Google Scholar]
- Wang, Z.; Feng, Y.; Zhang, F. Comprehensive evaluation of the high-quality economic development capacity of coastal provinces in China. Stat. Decis. Mak. 2022, 38, 114–118. [Google Scholar]
- Xu, Y.; Wu, H. Empirical Study on the Comprehensive Efficiency of Regional Coordinated Development under Environmental Constraints. China Ind. Econ. 2010, 8, 34–44. [Google Scholar]
- Zhang, C.; Zhong, C.; Jiang, T.; Li, X. Spatial and temporal differentiation of regional coordinated development in China and its influencing factors. Econ. Geogr. 2020, 40, 15–26. [Google Scholar]
- Song, S. Performance Evaluation of Regional Coordinated Development under Urban Circle Integration. Jianghuai Forum 2021, 3, 61–68. [Google Scholar]
- Deng, Z.; Zhang, C. Population mobility and regional coordinated development under the background of domestic circulation. Econ. Rev. 2022, 443, 54–64. [Google Scholar]
- Liu, B.; Fan, X. Theoretical Logic and Path Selection of Regional Coordination Centered on Economic Construction. Beijing Soc. Sci. 2023, 239, 24–34. [Google Scholar]
- Yu, X.; Wang, P. Economic effects analysis of environmental regulation policy in the process of industrial structure upgrading: Evidence from Chinese provincial panel data. Sci. Total Environ. 2021, 753, 142004. [Google Scholar] [CrossRef]
- Lewis, A. Theory of Dual Economy; Beijing Institute of Economics Press: Beijing, China, 1989. [Google Scholar]
- Li, Z. Population Economics; Tsinghua University Press: Beijing, China, 2013. [Google Scholar]
- Lewis, W.A. Economic development with unlimited supplies of labo. Manch. Sch. Econ. Soc. Stud. 1954, 22, 139–191. [Google Scholar] [CrossRef]
- Newling, B.E. The spatial variation of urban population densities. Geogr. Rev. 1969, 59, 242–252. [Google Scholar] [CrossRef]
- Lee, E.S. A theory of migration. Demogr. Res. 1966, 3, 47–57. [Google Scholar] [CrossRef]
- Peng, J. The Formation and Development of Contemporary Western Demographic Economics. Popul. Econ. 1987, 5, 55–60. [Google Scholar]
- Liu, J.; Jin, X.; Xu, W.; Gu, Z.; Yang, X.; Ren, J.; Fan, Y.; Zhou, Y. A new framework of land use efficiency for the coordination among food, economy and ecology in regional development. Sci. Total Environ. 2020, 710, 135670. [Google Scholar] [CrossRef]
- Grennfelt, P.; Engleryd, A.; Forsius, M.; Hov, Ø.; Rodhe, H.; Cowling, E. Acid rain and air pollution: 50 years of progress in environmental science and policy. Ambio 2020, 49, 849–864. [Google Scholar] [CrossRef]
- Cai, J.; Li, X.; Liu, L.; Chen, Y.; Wang, X.; Lu, S. Coupling and coordinated development of new urbanization and agro-ecological environment in China. Sci. Total Environ. 2021, 776, 145837. [Google Scholar] [CrossRef]
- Li, W.; Yi, P. Assessment of city sustainability—Coupling coordinated development among economy, society and environment. J. Clean. Prod. 2020, 256, 120453. [Google Scholar] [CrossRef]
- Qiu, M.; Yang, Z.; Zuo, Q.; Wu, Q.; Jiang, L.; Zhang, Z.; Zhang, J. Evaluation on the relevance of regional urbanization and ecological security in the nine provinces along the Yellow River, China. Ecol. Indic. 2021, 132, 108346. [Google Scholar] [CrossRef]
- Kvint, V. Theoretical basis and methodology of strategizing of the private and public sectors of the Kuzbass region as a medial subsystem of the national economy. Russ. J. Ind. Econ. 2020, 13, 290–299. [Google Scholar] [CrossRef]
- Malizia, E.; Feser, E.; Renski, H.; Drucker, J. Understanding Local Economic Development; Routledge: London, UK, 2020. [Google Scholar]
- Wezel, A.; Herren, B.G.; Kerr, R.B.; Barrios, E.; Gonçalves, A.L.R.; Sinclair, F. Agroecological principles and elements and their implications for transitioning to sustainable food systems. A review. Agron. Sustain. Dev. 2020, 40, 40. [Google Scholar] [CrossRef]
- Duong, V.C.; Sung, B. Examining the role of luxury elements on social media engagement. J. Glob. Fash. Mark. 2021, 12, 103–119. [Google Scholar] [CrossRef]
- Zhang, S.; Zhang, M.; Chi, G. A Science and Technology Evaluation Model Based on Entropy Weight Method and Its Empirical Study. J. Manag. 2010, 7, 34–42. [Google Scholar]
- Li, J.; Sun, W.; Li, M.; Meng, L. Coupling coordination degree of production, living and ecological spaces and its influencing factors in the Yellow River Basin. J. Clean. Prod. 2021, 298, 126803. [Google Scholar] [CrossRef]
- Feng, C.; Huang, Y.; Luo, Y. A Study on the Coupling and Coordination of EEET Systems in Western Resource Based Cities: A Case Study of Three Cities in Guangxi. Ecol. Econ. 2020, 36, 104–110. [Google Scholar]
- Zhao, T.; Yu, C.; Pan, H. Research on the Coupling Coordination Degree of Low Carbon City 3E1S System. Stat. Decis. Mak. 2019, 35, 131–135. [Google Scholar]
- Li, J.; Yu, H.; Fu, Y.; Zhao, Y. The spatiotemporal changes and clustering model of “population economy land society ecology” urbanization co scheduling in Guangdong Province. Prog. Geogr. Sci. 2018, 37, 287–298. [Google Scholar]
- Yao, S.; Zhang, F. Balanced and high-quality development of regional economy and the new development pattern of “dual circulation”. Macro Qual. Res. 2021, 9, 1–16. [Google Scholar]
- Cai, A.; Zhuang, L.; Liang, J. Measurement and Analysis of Regional Economic Differences in Jiangsu Province: Based on Gini Coefficient Decomposition. Econ. Geogr. 2011, 31, 1995–2000. [Google Scholar]
- Xu, X.; Pan, L.-C.; Ni, Q.-H.; Yuan, Q.-Q. Eco-efficiency evaluation model: A case study of the Yangtze River Economic Belt. Environ. Monit. Assess. 2021, 193, 457. [Google Scholar] [CrossRef] [PubMed]
- Rodríguez-Pose, A.; Storper, M. Housing, urban growth and inequalities: The limits to deregulation and upzoning in reducing economic and spatial inequality. Urban Stud. 2020, 57, 223–248. [Google Scholar] [CrossRef]
- Yang, L.Z.; Liu, X. Is there ”Matthew Effect” in regional technology transfer? The driving orientation of inter-regional technology transfer. Stud. Sci. Sci. 2014, 32, 1820–1827+1858. [Google Scholar] [CrossRef]
- Kümpel, A.S. The Matthew Effect in social media news use: Assessing inequalities in news exposure and news engagement on social network sites (SNS). Journalism 2020, 21, 1083–1098. [Google Scholar] [CrossRef]
- Pavolini, E.; Van Lancker, W. The Matthew effect in childcare use: A matter of policies or preferences? In The Future of the Social Investment State; Routledge: London, UK, 2020; pp. 78–93. [Google Scholar]
- Linde, L.; Sjödin, D.; Parida, V.; Wincent, J. Dynamic capabilities for ecosystem orchestration A capability-based framework for smart city innovation initiatives. Technol. Forecast. Soc. Change 2021, 166, 120614. [Google Scholar] [CrossRef]
- Zhang, Y.; Kumar, S.; Huang, X.; Yuan, Y. Human capital quality and the regional economic growth: Evidence from China. J. Asian Econ. 2023, 86, 101593. [Google Scholar] [CrossRef]
- Song, Y.; Zhang, X.; Zhang, M. The influence of environmental regulation on industrial structure upgrading: Based on the strategic interaction behavior of environmental regulation among local governments. Technol. Forecast. Soc. Change 2021, 170, 120930. [Google Scholar] [CrossRef]
- Woodall, L.C.; Talma, S.; Steeds, O.; Stefanoudis, P.; Jeremie-Muzungaile, M.-M.; de Comarmond, A. Co-development, co-production and co-dissemination of scientific research: A case study to demonstrate mutual benefits. Biol. Lett. 2021, 17, 20200699. [Google Scholar] [CrossRef]
- Chen, Y.; Li, J.; Lu, H.; Yang, Y. Impact of unconventional natural gas development on regional water resources and market supply in China from the perspective of game analysis. Energy Policy 2020, 145, 111750. [Google Scholar] [CrossRef]
- Zhou, X.; Tao, C. Horizontal Knowledge Spillover, Technology Embedded Innovation, and Industrial Structure Coordination: Taking China’s Manufacturing Industry as an Example. Sci. Res. Manag. 2021, 42, 126–136. [Google Scholar]
- Hao, Y.; Zheng, S.; Zhao, M.; Wu, H.; Guo, Y.; Li, Y. Reexamining the relationships among urbanization, industrial structure, and environmental pollution in China—New evidence using the dynamic threshold panel model. Energy Rep. 2020, 6, 28–39. [Google Scholar] [CrossRef]
- Ding, R.; Wang, H. Economic Differences in Urban Agglomeration, Industrial Structure, and North South Economic Differentiation. Financ. Trade Econ. 2022, 43, 128–143. [Google Scholar]
- Li, E.; Cui, Z. Coupling and Coordination Analysis of Regional Innovation Capability and Economic Development Level in China. Geogr. Sci. 2018, 38, 1412–1421. [Google Scholar]
- Deng, J.; Sun, Q. The Impact of Industrial Agglomeration on the Efficiency of Green Development of Logistics Industry: An Empirical Analysis Based on the Yangtze River Economic Belt. Bus. Econ. Res. 2023, 23, 176–180. [Google Scholar]
- Fan, H. Several Thoughts on Deepening Regional Cooperation. Comp. Econ. Soc. Syst. 2013, 168, 1–10. [Google Scholar]
- Southern, S.Y.; Han, B. Analysis of the Funding Performance, Situation, and Inspiration Suggestions of the China Europe Joint Funding Program. Sci. Technol. Manag. Res. 2023, 43, 43–49. [Google Scholar]
- Fan, H. Deepening the opening-up and regional cooperation of the central region in all aspects. Macroecon. Manag. 2013, 353, 26–29. [Google Scholar]
- Xiang, Z. How Creative Execution by Local Governments Is Possible—A Case Analysis Based on the Implementation Process of the “Smart T City”. Proj. China Adm. Manag. 2023, 39, 124–131. [Google Scholar]
- Moorthy, V.; Restrepo, A.M.H.; Preziosi, M.-P.; Swaminathan, S. Data sharing for novel coronavirus (COVID-19). Bull. World Health Organ. 2020, 98, 150. [Google Scholar] [CrossRef]
- Yu, L. Ethical issues and regulations of scientific research data in the era of big data. Library 2023, 594, 75–81. [Google Scholar]
- Yuan, J.; Zhou, Y.; Huang, X. Research on the Coupled and Coordinated Development of Sports Industry and Tourism Industry in Urban Agglomeration of Guangdong Hong Kong Macao Greater Bay Area. Resour. Dev. Mark. 2023, 39, 1527–1536. [Google Scholar]
- Ke, Z. Has the construction of smart cities promoted energy conservation and emission reduction—Based on the Experience Analysis of 141 Districts and Counties in the Yangtze River Delta Urban Agglomeration. Financ. Res. 2023, 7, 134–153. [Google Scholar]
- Tang, J.; Gao, Y.; Li, P. Can smart cities promote the achievement of the “dual carbon” goal through smart energy construction——Experimental evidence based on synthetic control method. Soft Sci. 2023, 37, 90–96+133. [Google Scholar]
- Li, X.; Zhou, M.; Mi, Y. The Application of Smart Environmental Protection Systems in Environmental Governance. J. Environ. Eng. Technol. 2021, 11, 992–1003. [Google Scholar]
- Fan, F.; Lian, H.; Wang, S. Can regional collaborative innovation improve innovation efficiency? An empirical study of Chinese cities. Growth Change 2020, 51, 440–463. [Google Scholar] [CrossRef]
- Ramírez-Montoya, M.S.; Castillo-Martínez, I.M.; Sanabria-Z, J.; Miranda, J. Complex thinking in the framework of Education 4.0 and Open Innovation—A systematic literature review. J. Open Innov. Technol. Mark. Complex. 2022, 8, 4. [Google Scholar] [CrossRef]
- Zhu, Y.; Song, K. Exploring the influencing factors of enterprise participation in school enterprise patent cooperation: An empirical analysis based on structural equation. Chin. Univ. Sci. Technol. 2023, 11, 90–96. [Google Scholar]


| Target Level | Standardized Layer | Serial Number | Index Layer | Index Properties |
|---|---|---|---|---|
| Population-development subsystem indices | Size of population | A1 | Number of births (persons) | + |
| A2 | Number of deaths (persons) | − | ||
| A3 | Household population at the end of the year (10,000) | + | ||
| A4 | Year-end resident population (10,000) | + | ||
| Quality of population | A5 | Illiteracy and semi-illiteracy (%) | − | |
| A6 | Percentage of people with Bachelor’s degree or above (%) | + | ||
| A7 | Percentage of people with high-school education or less (%) | − | ||
| Population structure | A8 | Sex ratio at birth | − | |
| A9 | Percentage of 0–14-year-olds (%) | + | ||
| A10 | Percentage of 15–64-year-olds (%) | + | ||
| A11 | Percentage of persons aged 65 and over (%) | + | ||
| A12 | Population density (persons/km2) | + | ||
| A13 | Percentage of urban population (%) | + |
| Target Level | Standardized Layer | Serial Number | Index Layer | Index Properties |
|---|---|---|---|---|
| Economic-development subsystem indices | Size of the economy | B1 | Year-end gross domestic product GDP (billions of yuan) | + |
| B2 | General public budget revenue (billions of yuan) | + | ||
| B3 | Gross industrial output (billions of yuan) | + | ||
| Quality of the economy | B4 | GDP per capita (yuan) | + | |
| B5 | GDP growth rate (%) | + | ||
| B6 | Per capita local fiscal revenue (million yuan) | + | ||
| B7 | Per capita gross industry output (yuan) | + | ||
| Economic structure | B8 | Share of primary production value (%) | + | |
| B9 | Share of secondary production value (%) | + | ||
| B10 | Share of output value of the third sector (%) | + |
| Target Level | Standardized Layer | Serial Number | Index Layer | Index Properties |
|---|---|---|---|---|
| Social-development subsystem indices | Infrastructure | C1 | Road area per capita (square meters) | + |
| C2 | Public transportation vehicles for 10,000 people (standard units) | + | ||
| C3 | Supply of liquefied petroleum gas per 10,000 people (tons) | + | ||
| C4 | Water supply per capita (tons) | + | ||
| Cultural Education | C5 | Per capita financial expenditure on education (yuan) | + | |
| C6 | Total number of students enrolled in school at all levels (10,000) | + | ||
| C7 | Total number of teachers at all levels (10,000) | + | ||
| C8 | Public library holdings per capita (volumes) | + | ||
| Medical System | C9 | Total number of hospitals, health centers | + | |
| C10 | Number of hospital beds per 10,000 persons (sheets) | + | ||
| C11 | Percentage of persons covered by basic health insurance (%) | + | ||
| C12 | Percentage of employees insured against work-related injuries (%) | + | ||
| C13 | Unemployment insurance participation (%) | + | ||
| Ecological Environment | C14 | Sewage-treatment rate (%) | + | |
| C15 | Volume of domestic waste removed (tons) | + | ||
| C16 | Green space per capita in parks (square meters) | + |
| Development Index | [0–0.3) | [0.3–0.4) | [0.4–0.5) | [0.5–0.6) | [0.6–0.7) | [0.7–0.8) | [0.8–1] |
|---|---|---|---|---|---|---|---|
| Level of development | Extremely low | Medium low | Lower | Medium | Higher | Medium high | Extremely high |
| Low | Medium | High | |||||
| Coordination Index | Coordination Phase | Degree of Coordinated Development |
|---|---|---|
| [0–0.1) | Disordered type | Extremely disordered |
| [0.1–0.2) | Severely disordered | |
| [0.2–03) | Mildly disordered | |
| [0.3–0.4) | Transition type | Endangered coordination |
| [0.4–0.5) | Fragile coordination | |
| [0.5–0.6) | Barely coordinated | |
| [0.6–0.7) | Basic coordination | |
| [0.7–0.8) | Coordinated development | Intermediate coordination |
| [0.8–0.9) | Well-coordinated | |
| [0.9–1.0] | High-quality coordination |
| Level 1 Indices | Secondary Indices | Tertiary Indices | W2010 | W2015 | W2020 |
|---|---|---|---|---|---|
| Population-development subsystem indices | Size of population | Number of births (persons) | 0.09 | 0.08 | 0.07 |
| Number of deaths (persons) | 0.05 | 0.06 | 0.05 | ||
| Household population at the end of the year (10,000) | 0.06 | 0.06 | 0.06 | ||
| Year-end resident population (10,000) | 0.08 | 0.07 | 0.09 | ||
| Quality of population | Illiteracy and semi-illiteracy (%) | 0.07 | 0.10 | 0.06 | |
| Undergraduate education and above (%) | 0.07 | 0.10 | 0.06 | ||
| High-school education and below (%) | 0.08 | 0.06 | 0.07 | ||
| Population Structure | sex ratio at birth | 0.08 | 0.08 | 0.05 | |
| Percentage of 0–14-year-olds (%) | 0.08 | 0.07 | 0.07 | ||
| Percentage of 15–64-year-olds (%) | 0.12 | 0.10 | 0.12 | ||
| Percentage of persons aged 65 and over (%) | 0.04 | 0.05 | 0.07 | ||
| Population density (persons/km2) | 0.07 | 0.09 | 0.11 | ||
| Percentage of urban population (%) | 0.10 | 0.09 | 0.11 | ||
| Economic-development subsystem indices | Size of economy | Year-end GDP (billions of yuan) | 0.11 | 0.13 | 0.12 |
| Public budget revenue (billions of yuan) | 0.12 | 0.14 | 0.15 | ||
| Gross industrial output (billions of yuan) | 0.11 | 0.12 | 0.12 | ||
| Quality of the economy | GDP per capita (yuan) | 0.09 | 0.10 | 0.08 | |
| GDP growth rate (%) | 0.05 | 0.05 | 0.07 | ||
| Per capita local fiscal revenue (ten thousand yuan) | 0.09 | 0.09 | 0.11 | ||
| Gross industrial output per capita (million yuan) | 0.10 | 0.12 | 0.10 | ||
| Economic Structure | Share of primary production value (%) | 0.11 | 0.12 | 0.11 | |
| Share of secondary production value (%) | 0.10 | 0.05 | 0.04 | ||
| Share of output value of the third sector (%) | 0.12 | 0.06 | 0.10 | ||
| Social-development subsystem indices | Infrastructure | Road area per capita (square meters) | 0.05 | 0.05 | 0.08 |
| Public transportation vehicles for 10,000 people (standard units) | 0.06 | 0.04 | 0.07 | ||
| Oil and gas supply for 10,000 people (tons) | 0.05 | 0.06 | 0.04 | ||
| Water supply per capita (tons) | 0.07 | 0.08 | 0.07 | ||
| Cultural Education | Per capita financial expenditure on education (yuan) | 0.06 | 0.06 | 0.06 | |
| Total number of students in school (10,000) | 0.04 | 0.06 | 0.07 | ||
| Total number of teachers at all stages (10,000) | 0.05 | 0.05 | 0.06 | ||
| Public library holdings per capita (volumes) | 0.06 | 0.07 | 0.06 | ||
| Medical Protection | Total number of hospitals, health centers (number) | 0.04 | 0.04 | 0.04 | |
| Number of beds per 10,000 people (beds) | 0.07 | 0.06 | 0.03 | ||
| Number of people enrolled in basic health insurance (%) | 0.06 | 0.07 | 0.06 | ||
| Number of persons insured against work-related injuries (%) | 0.08 | 0.09 | 0.09 | ||
| Number of participants in unemployment insurance (%) | 0.07 | 0.07 | 0.08 | ||
| Ecological Environment | Sewage-treatment rate (%) | 0.08 | 0.03 | 0.07 | |
| Volume of domestic waste removed (tons) | 0.11 | 0.12 | 0.09 | ||
| Per capita green space in parks (square meters) | 0.05 | 0.03 | 0.04 |
| Regions | 2010 | 2015 | 2020 | |||||||
|---|---|---|---|---|---|---|---|---|---|---|
| Index | Rankings | Leve | Index | Rankings | Leve | Index | Rankings | Leve | ||
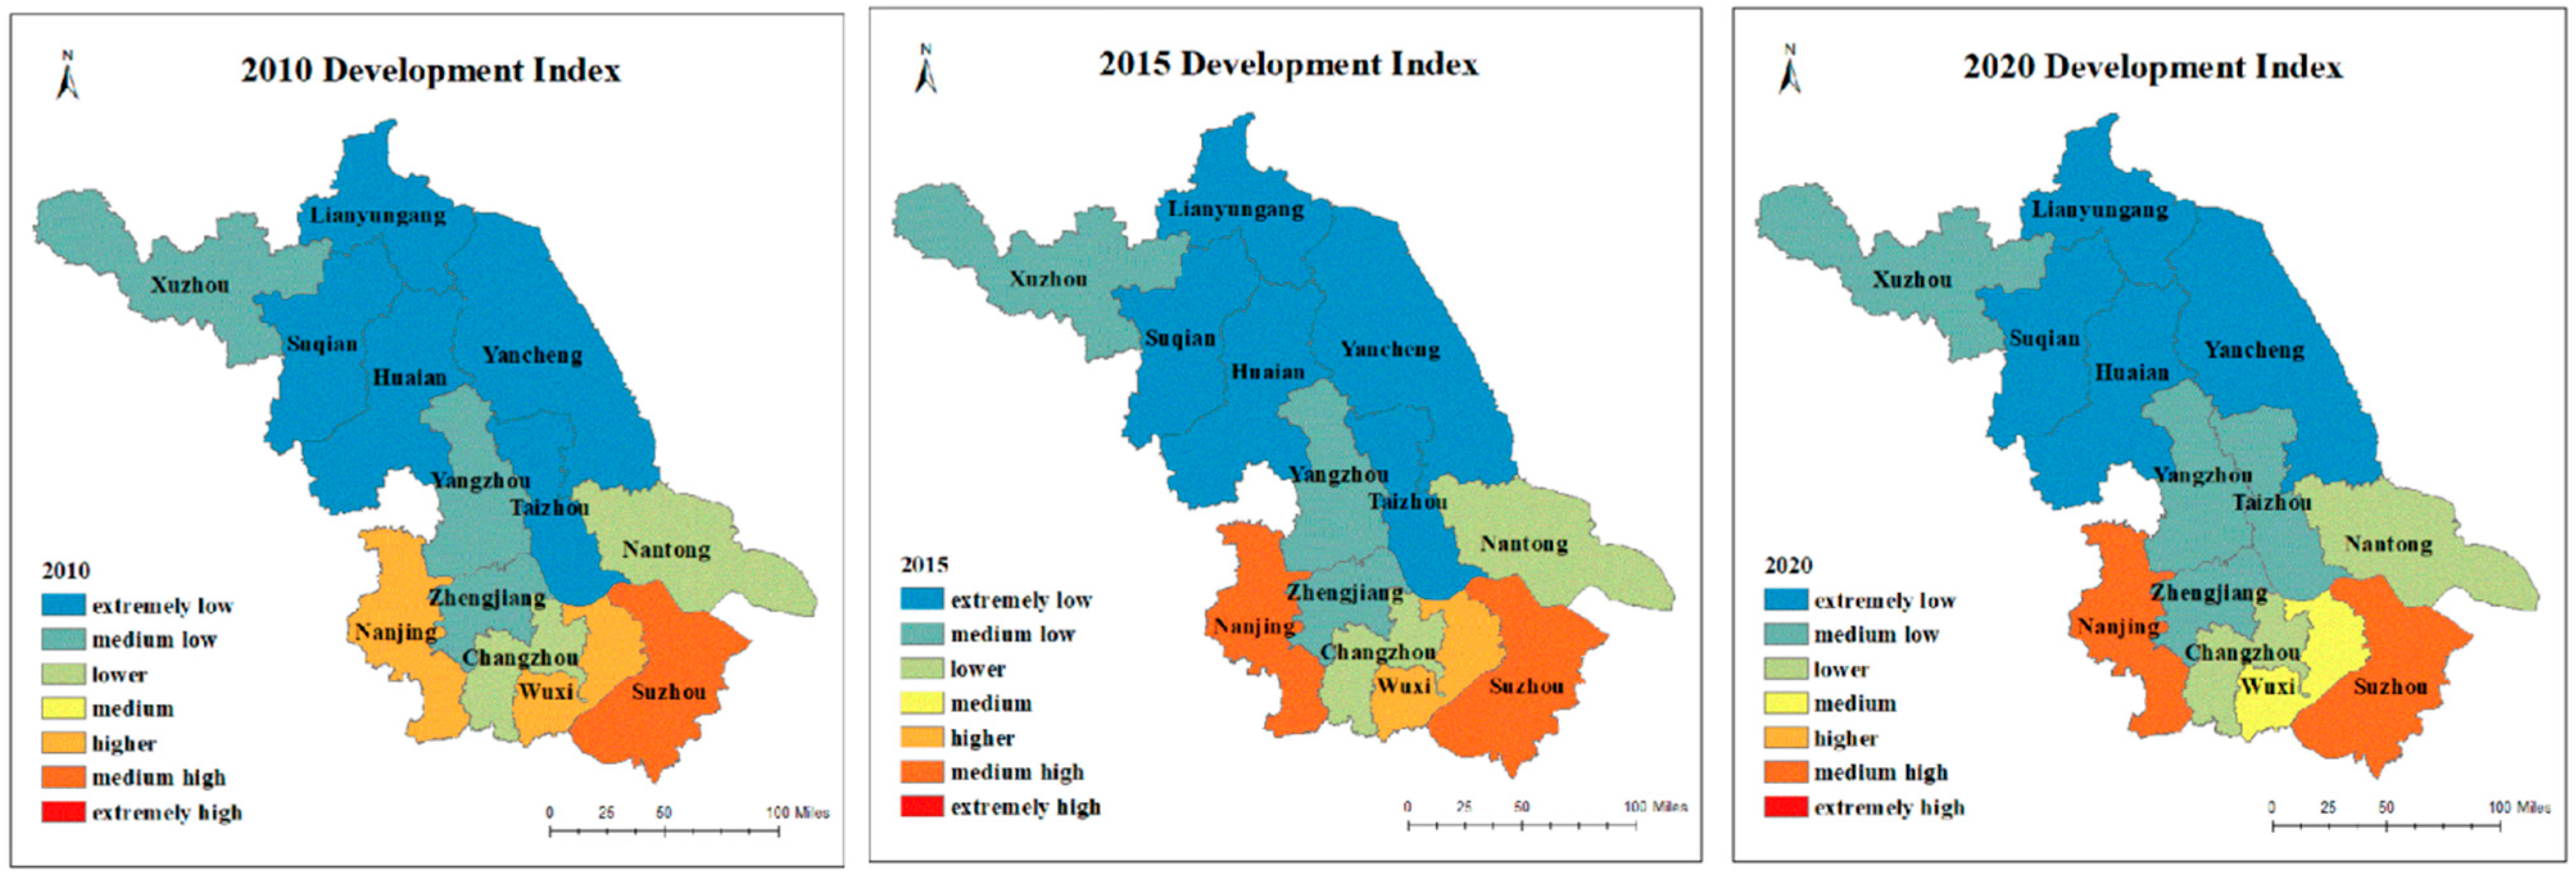
| Southern Jiangsu | Suzhou | 0.71 | 1 | Medium–High | 0.77 | 1 | Medium–High | 0.76 | 1 | Medium–High |
| Nanjing | 0.65 | 2 | Higher | 0.70 | 2 | Medium–High | 0.72 | 2 | Medium–High | |
| Wuxi | 0.63 | 3 | Higher | 0.60 | 3 | Higher | 0.59 | 3 | Higher | |
| Changzhou | 0.45 | 4 | Lower | 0.45 | 4 | Lower | 0.46 | 4 | Lower | |
| Zhenjiang | 0.36 | 6 | Medium–Low | 0.39 | 6 | Medium–Low | 0.37 | 6 | Medium–Low | |
| Central Jiangsu | Nantong | 0.40 | 5 | Lower | 0.42 | 5 | Lower | 0.40 | 5 | Lower |
| Yangzhou | 0.35 | 7 | Medium–Low | 0.34 | 8 | Medium–Low | 0.33 | 8 | Medium–Low | |
| Taizhou | 0.29 | 9 | Extremely Low | 0.28 | 10 | Extremely Low | 0.30 | 9 | Medium–Low | |
| Northern Jiangsu | Xuzhou | 0.33 | 8 | Medium–Low | 0.36 | 7 | Medium–Low | 0.32 | 7 | Medium–Low |
| Yancheng | 0.26 | 10 | Extremely Low | 0.29 | 9 | Extremely Low | 0.27 | 10 | Extremely Low | |
| Huai’an | 0.24 | 11 | Extremely Low | 0.28 | 11 | Extremely Low | 0.25 | 11 | Extremely Low | |
| Lianyungang | 0.22 | 12 | Extremely Low | 0.24 | 12 | Extremely Low | 0.23 | 12 | Extremely Low | |
| Suqian | 0.21 | 13 | Extremely Low | 0.23 | 13 | Extremely Low | 0.22 | 13 | Extremely Low | |
| Regions | 2010 | 2015 | 2020 | |||||||
|---|---|---|---|---|---|---|---|---|---|---|
| Value | Level | Rankings | Value | Level | Rankings | Value | Level | Rankings | ||
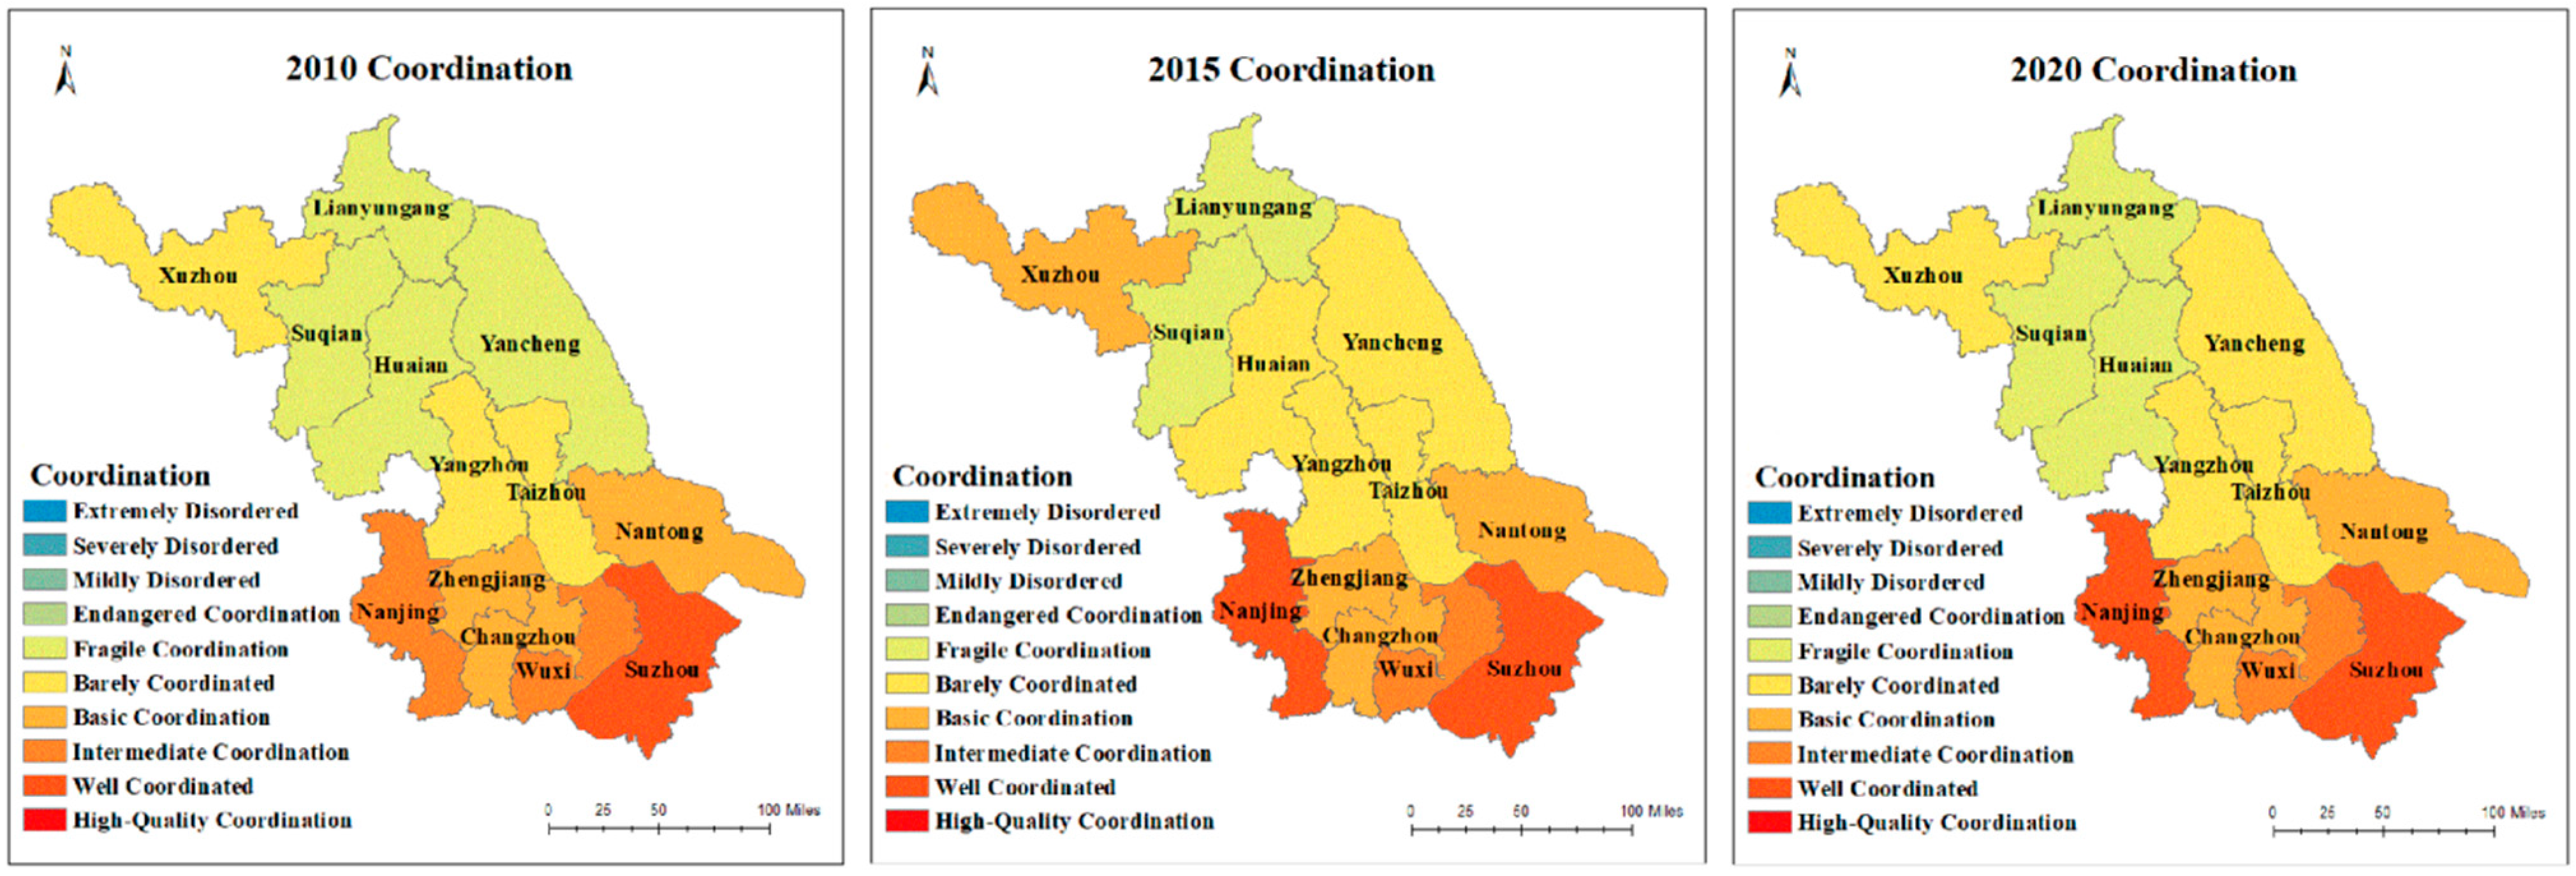
| Southern Jiangsu | Suzhou | 0.84 | Well | 1 | 0.87 | Well | 1 | 0.87 | Well | 1 |
| Nanjing | 0.79 | Intermediate | 2 | 0.83 | Well | 2 | 0.85 | Well | 2 | |
| Wuxi | 0.79 | Intermediate | 3 | 0.77 | Intermediate | 3 | 0.77 | Intermediate | 3 | |
| Changzhou | 0.67 | Basic | 4 | 0.67 | Basic | 4 | 0.67 | Basic | 4 | |
| Zhenjiang | 0.60 | Basic | 6 | 0.62 | Basic | 6 | 0.60 | Basic | 6 | |
| Central Jiangsu | Nantong | 0.63 | Basic | 5 | 0.65 | Basic | 5 | 0.63 | Basic | 5 |
| Yangzhou | 0.59 | Barely | 7 | 0.58 | Barely | 8 | 0.57 | Barely | 7 | |
| Taizhou | 0.53 | Barely | 9 | 0.53 | Barely | 10 | 0.55 | Barely | 8 | |
| Northern Jiangsu | Xuzhou | 0.57 | Barely | 8 | 0.60 | Basic | 7 | 0.55 | Barely | 9 |
| Yancheng | 0.49 | Fragile | 10 | 0.54 | Barely | 9 | 0.51 | Barely | 10 | |
| Huai’an | 0.48 | Fragile | 11 | 0.52 | Barely | 11 | 0.49 | Fragile | 11 | |
| Lianyungang | 0.45 | Fragile | 12 | 0.48 | Fragile | 12 | 0.47 | Fragile | 12 | |
| Suqian | 0.45 | Fragile | 13 | 0.48 | Fragile | 13 | 0.46 | Fragile | 13 | |
Disclaimer/Publisher’s Note: The statements, opinions and data contained in all publications are solely those of the individual author(s) and contributor(s) and not of MDPI and/or the editor(s). MDPI and/or the editor(s) disclaim responsibility for any injury to people or property resulting from any ideas, methods, instructions or products referred to in the content. |
© 2024 by the authors. Licensee MDPI, Basel, Switzerland. This article is an open access article distributed under the terms and conditions of the Creative Commons Attribution (CC BY) license (https://creativecommons.org/licenses/by/4.0/).
Share and Cite
Shi, G.; Liang, B.; Ye, T.; Zhou, K.; Sun, Z. Exploring the Coordinated Development of Smart-City Clusters in China: A Case Study of Jiangsu Province. Land 2024, 13, 308. https://doi.org/10.3390/land13030308
Shi G, Liang B, Ye T, Zhou K, Sun Z. Exploring the Coordinated Development of Smart-City Clusters in China: A Case Study of Jiangsu Province. Land. 2024; 13(3):308. https://doi.org/10.3390/land13030308
Chicago/Turabian StyleShi, Guoqing, Bing Liang, Taotao Ye, Kexin Zhou, and Zhonggen Sun. 2024. "Exploring the Coordinated Development of Smart-City Clusters in China: A Case Study of Jiangsu Province" Land 13, no. 3: 308. https://doi.org/10.3390/land13030308
APA StyleShi, G., Liang, B., Ye, T., Zhou, K., & Sun, Z. (2024). Exploring the Coordinated Development of Smart-City Clusters in China: A Case Study of Jiangsu Province. Land, 13(3), 308. https://doi.org/10.3390/land13030308