
Precise Identification of Site Characteristics and Risk Management of Ningdong Coal Power Base

Abstract
:1. Introduction
2. Data Sources and Classification System
2.1. Study Area Delineation
2.2. Data Source
2.3. Indicator System
3. Ningdong Coal Power Base/Regional Feature Identification
3.1. Ningdong Coal Power Base/Regional Feature Information Extraction
3.1.1. Feature Information Extraction
3.1.2. Accuracy Verification
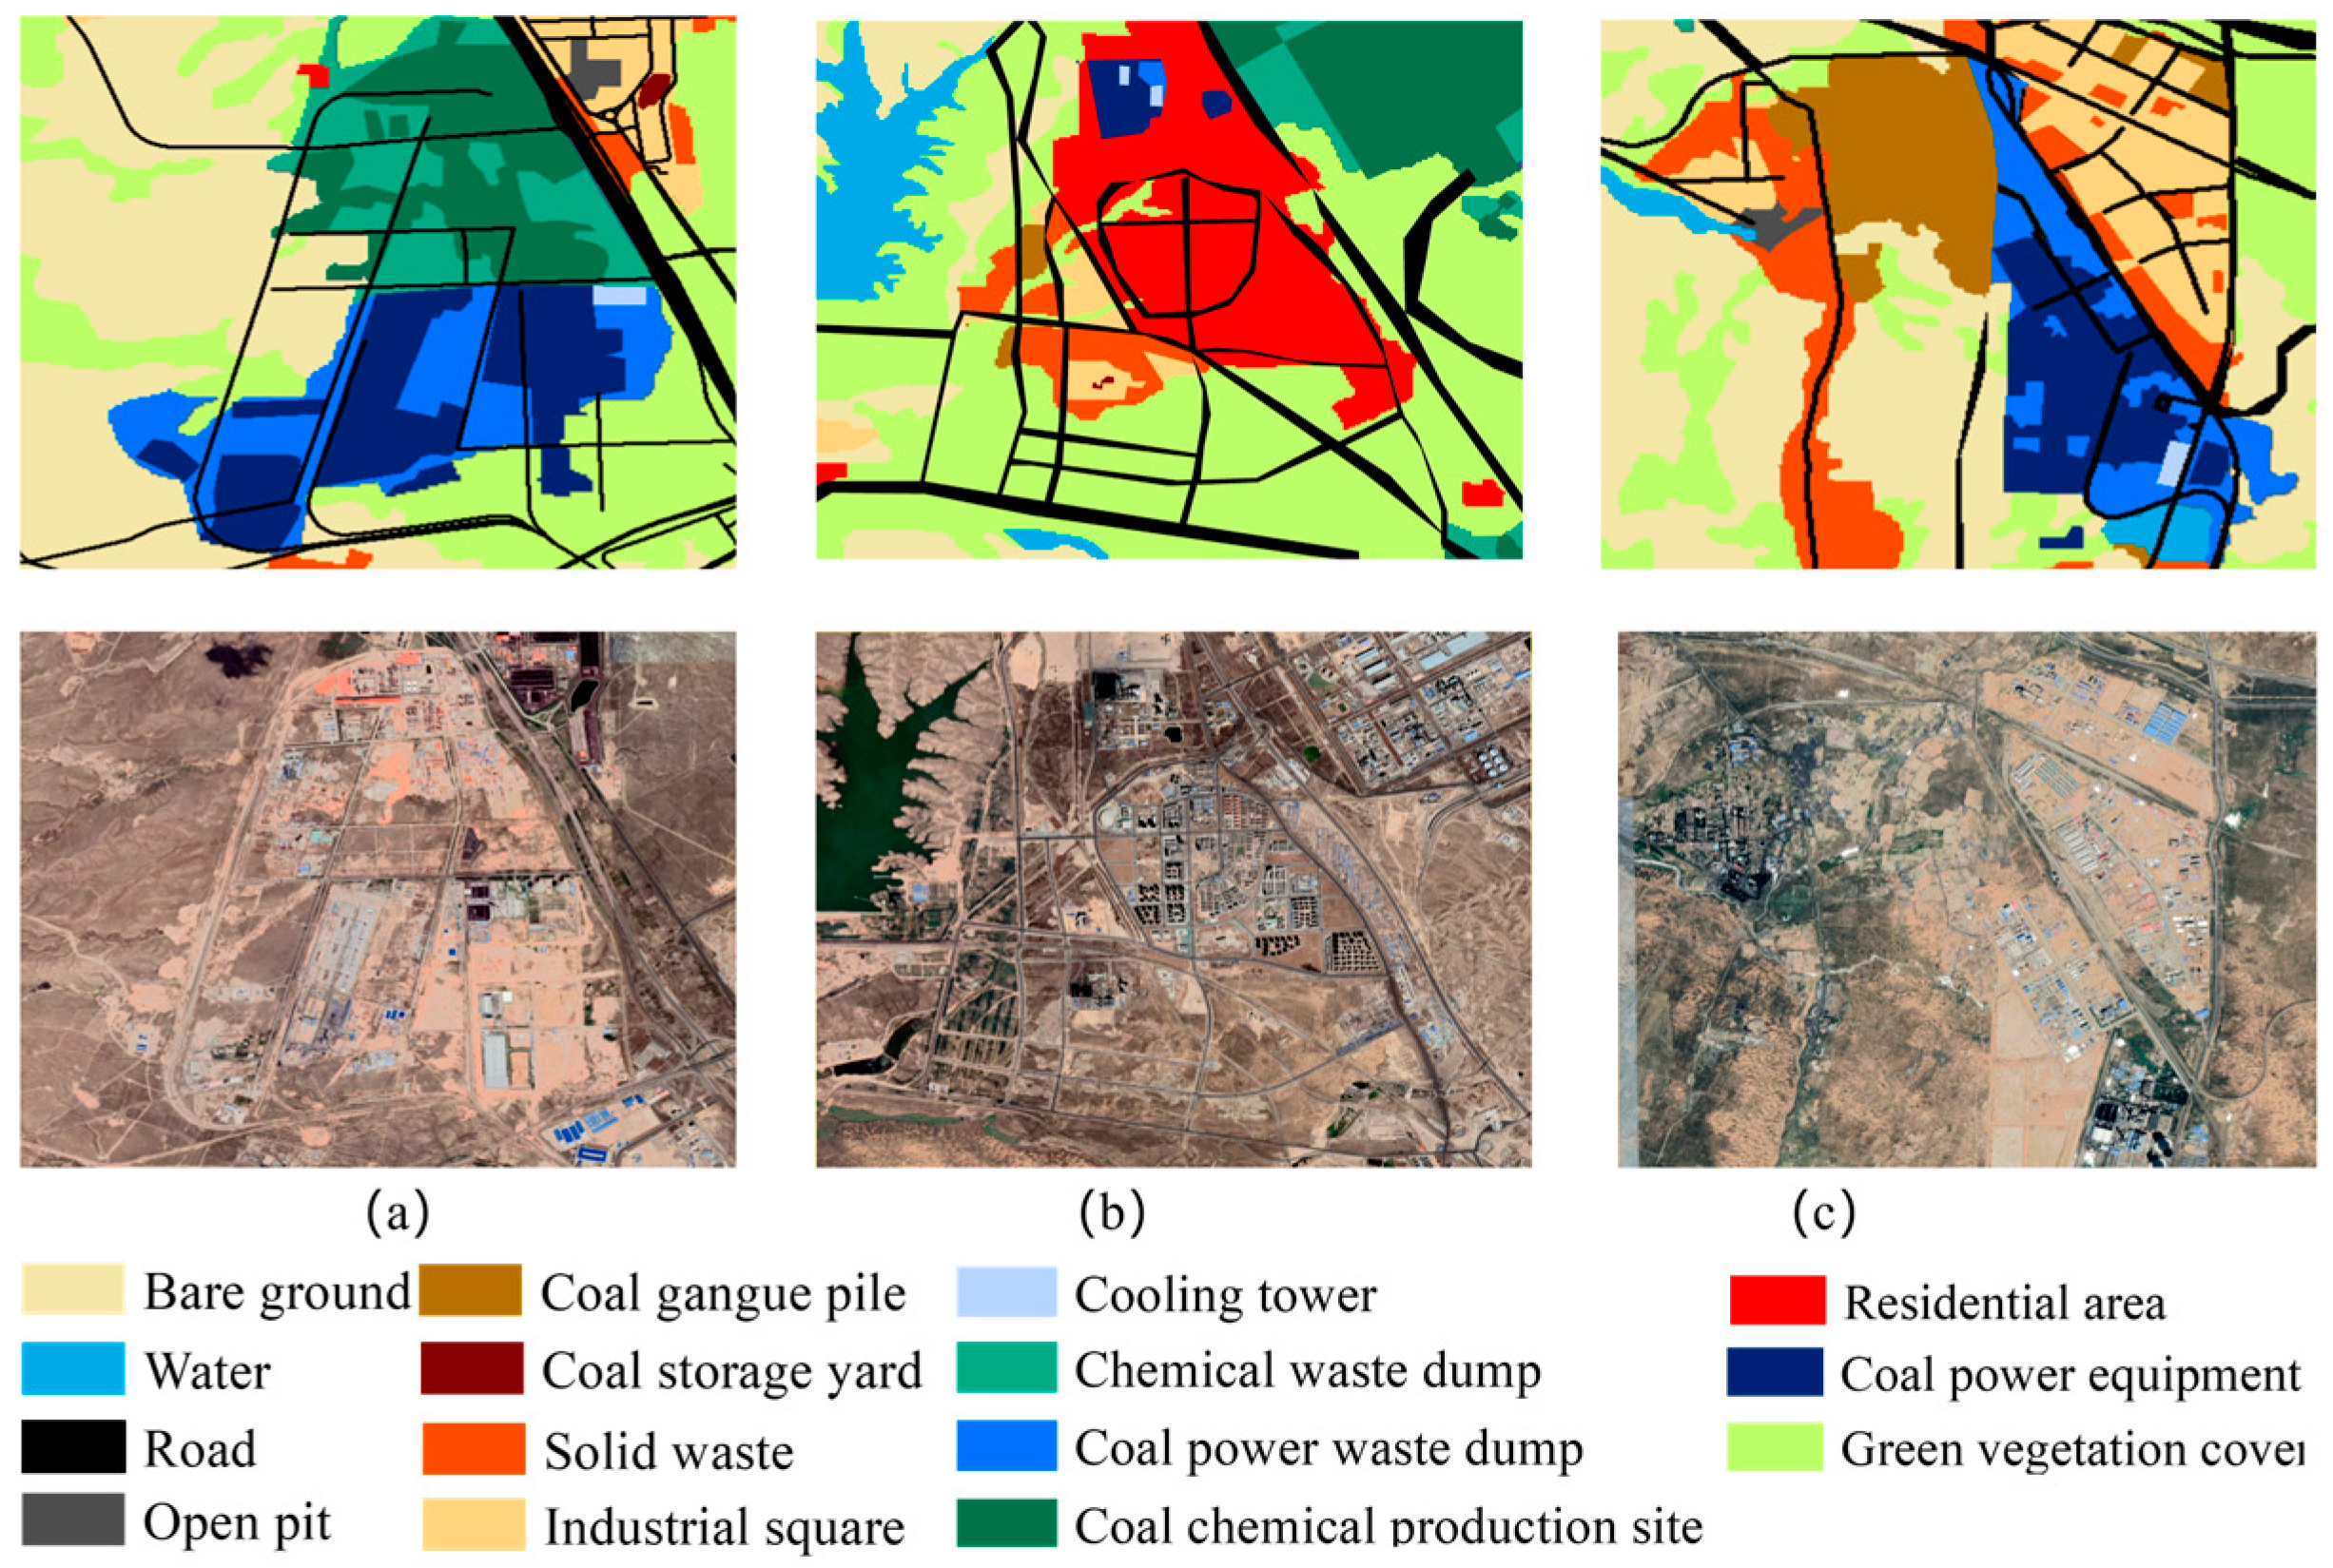
3.2. Characteristics of Ningdong Coal Power Base Site
3.3. Analysis of Changes in Spatial Characteristics of Ningdong Coal Power Base
3.3.1. Land Use Dynamics Formula
3.3.2. Land Use Dynamic Data Results
3.3.3. Analysis of the Results of Land Use Trends
3.4. Transfer Matrix Analysis of Spatial Characteristics of Ningdong Coal Power Base
3.4.1. Transfer Matrix
3.4.2. Transfer Matrix Analysis Result Map
4. Scale Analysis of Coal, Coal Power, and Coal Chemical Sites Based on Sentinel-2 Data
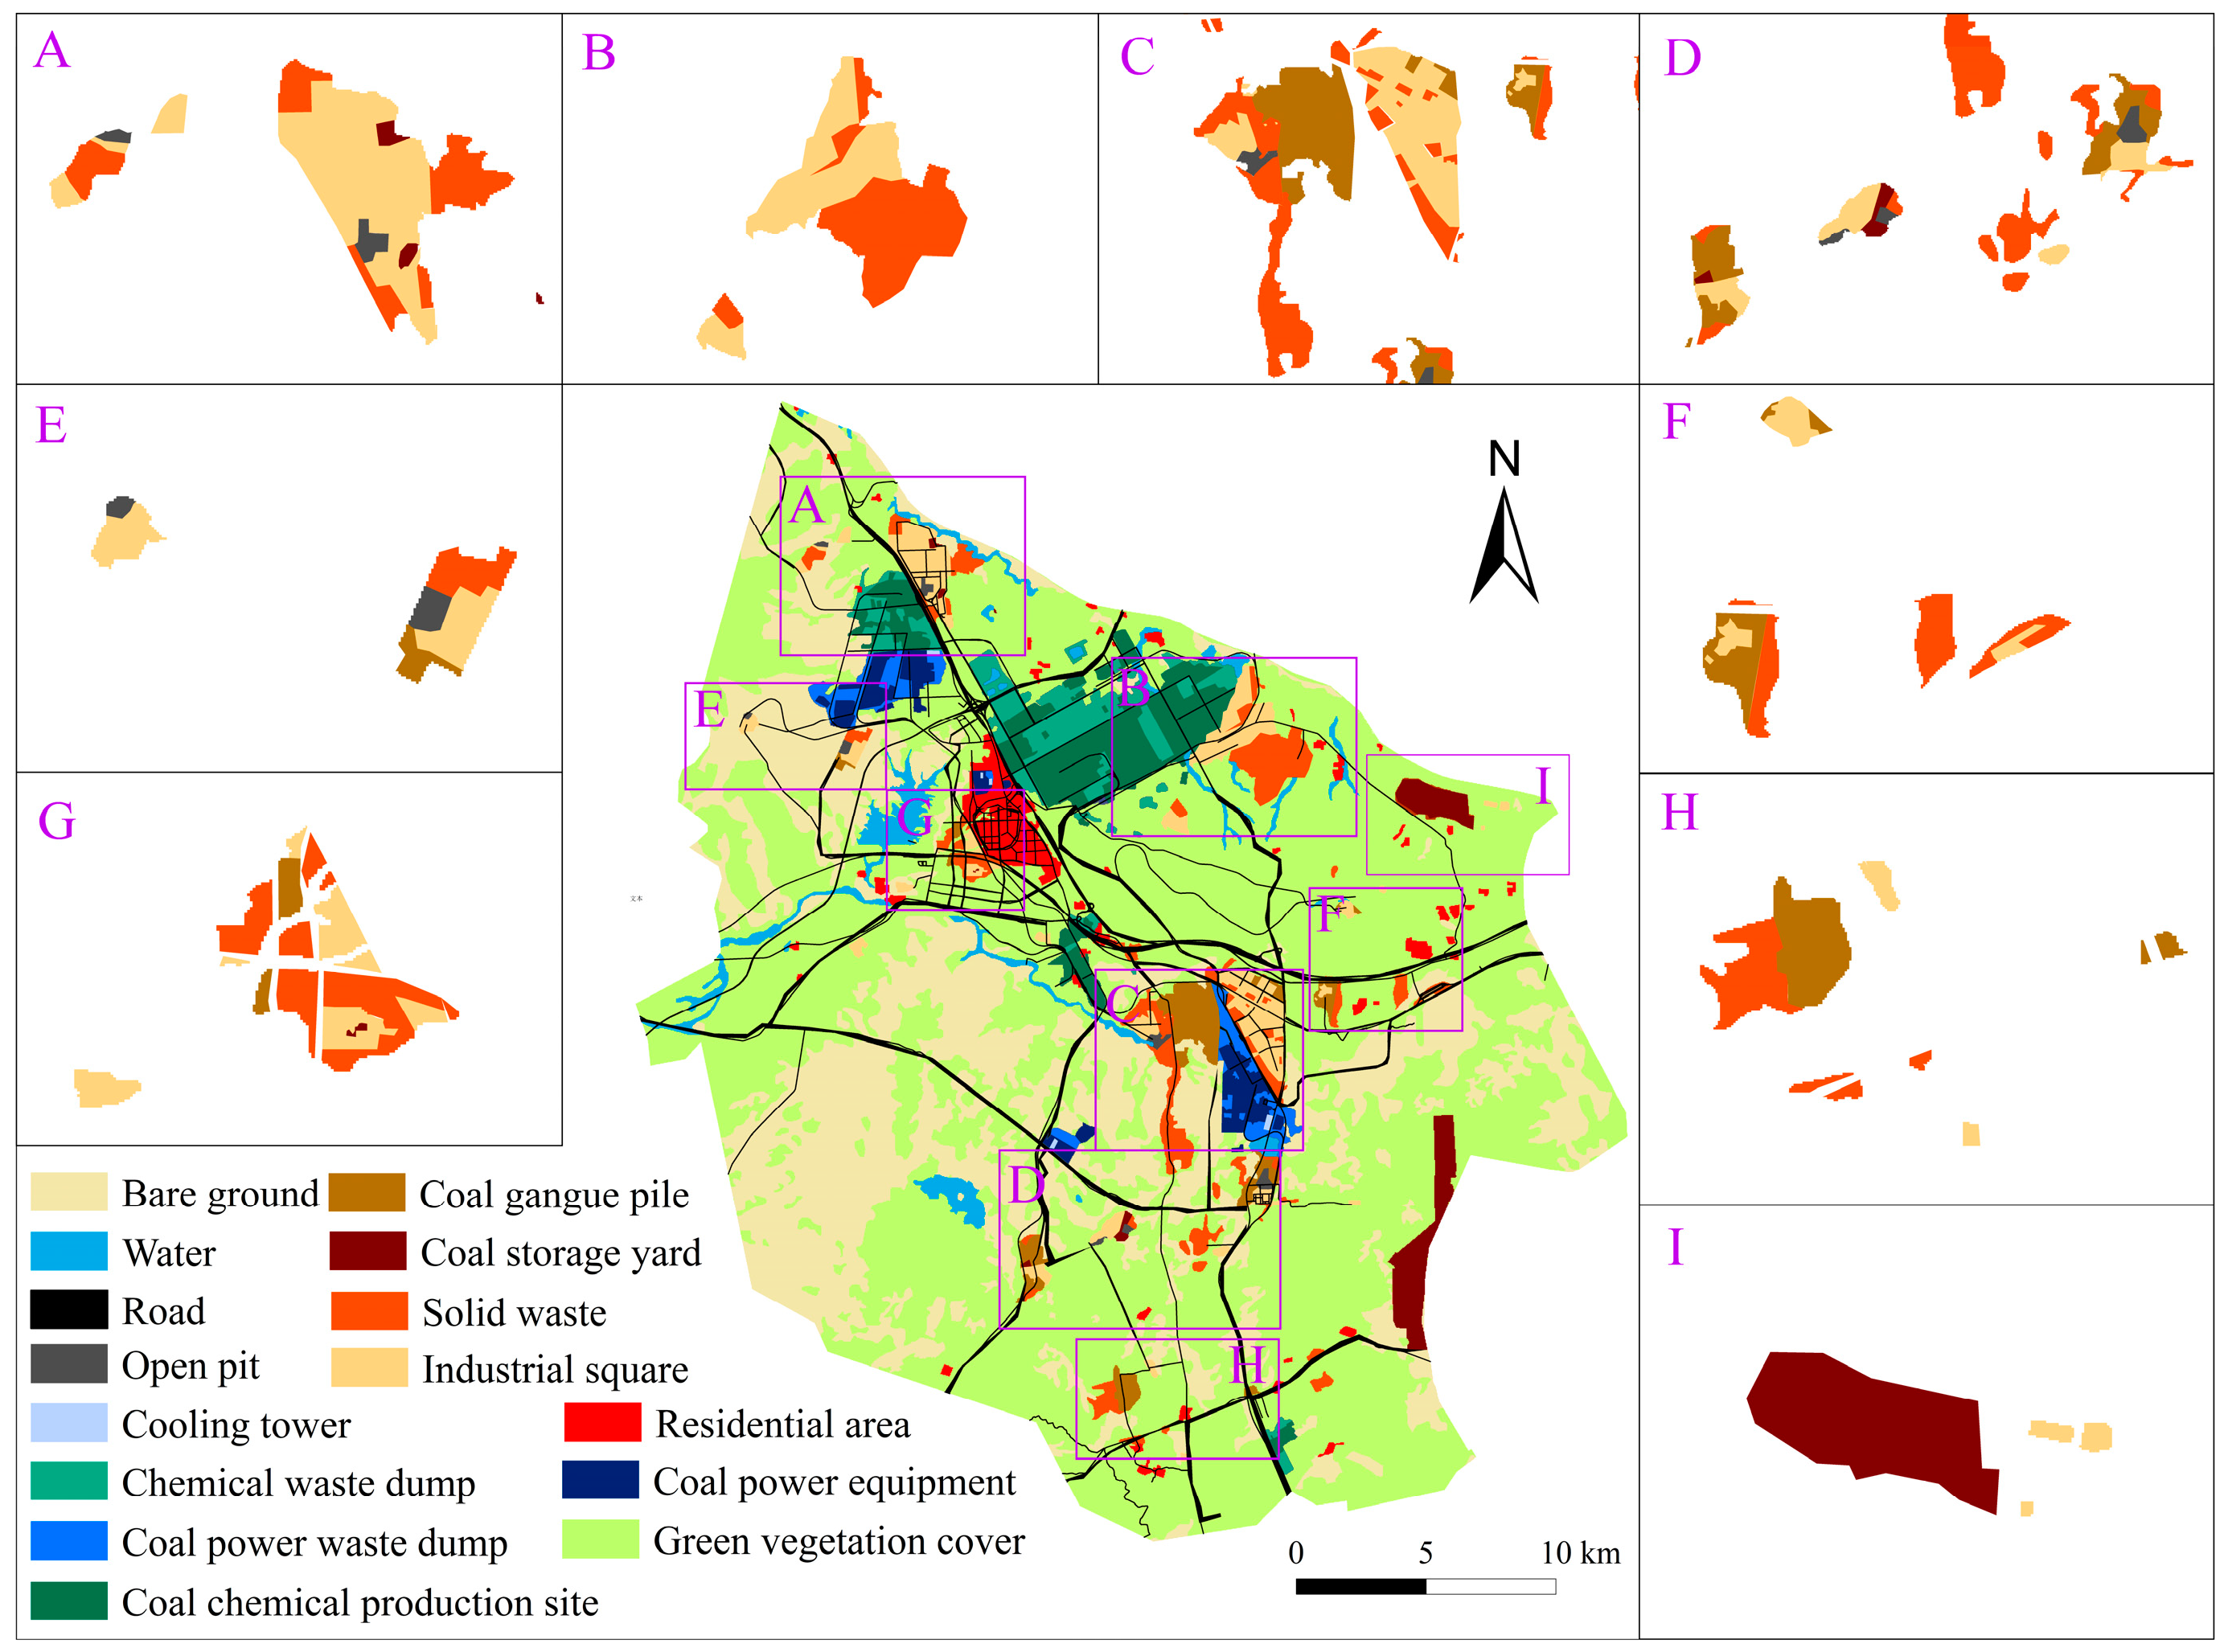
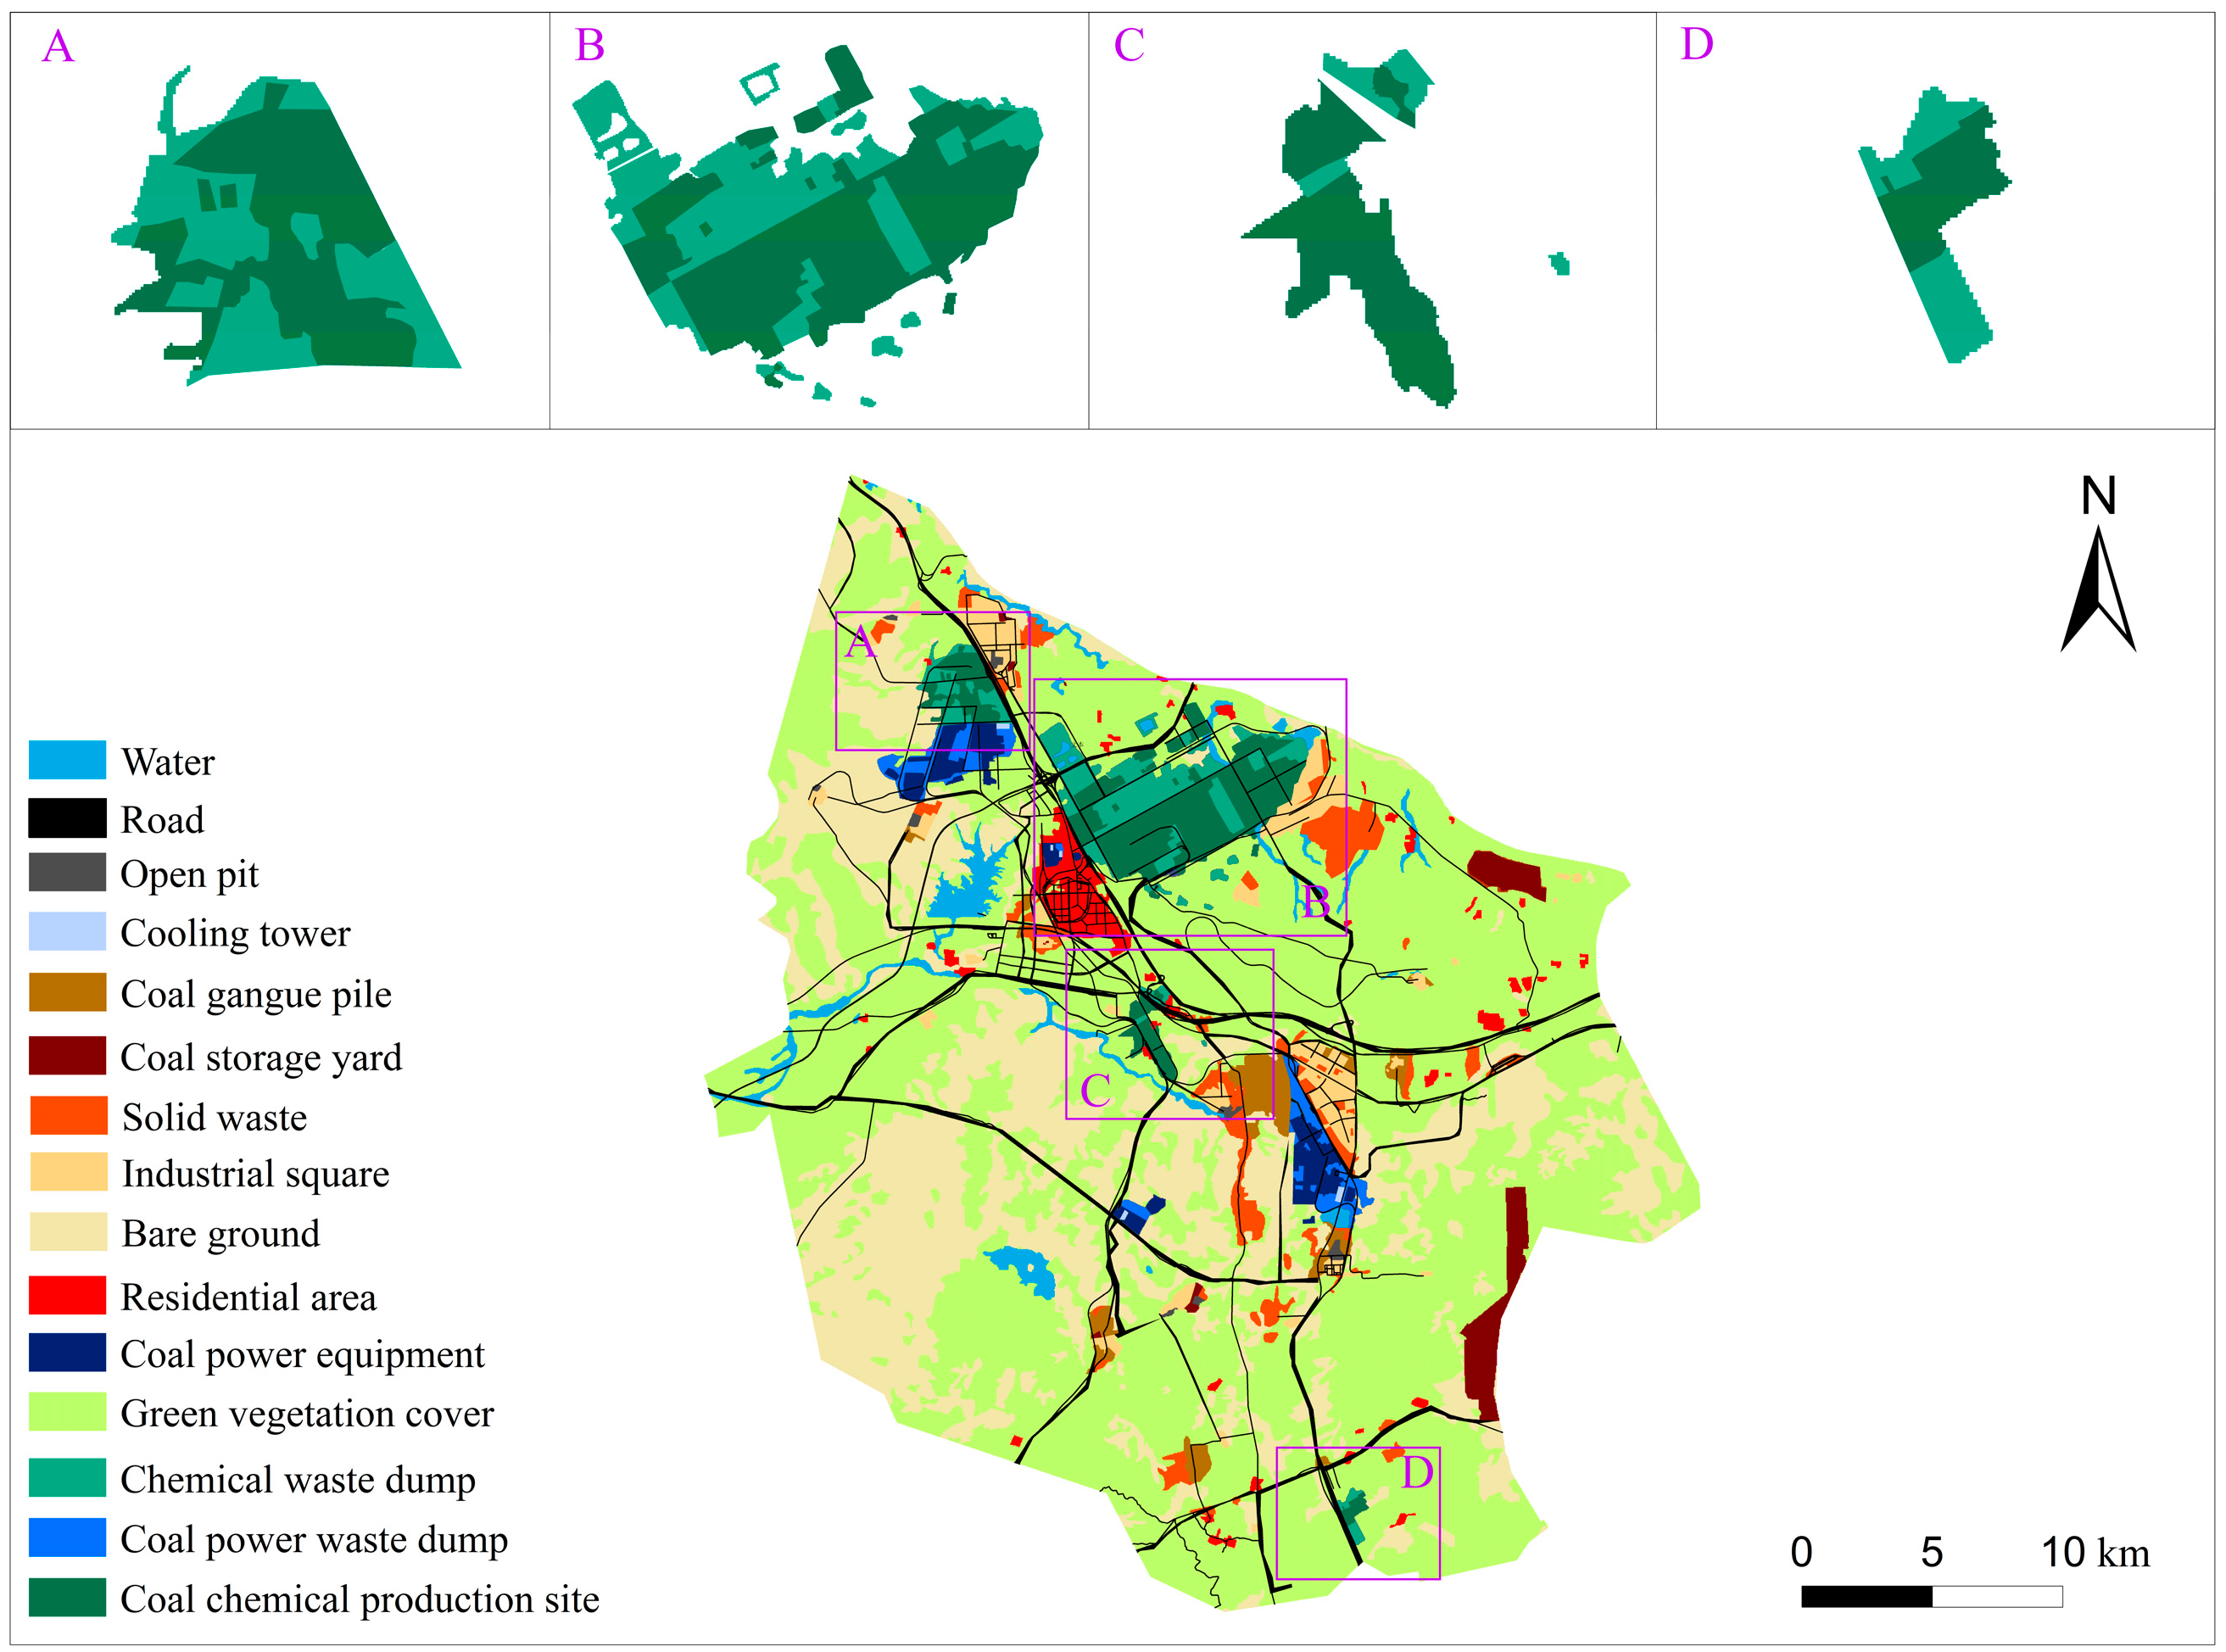
4.1. Distribution of Coal, Coal Power, and Coal Chemical Sites
4.2. Spatial Structure of Coal, Coal Power, and Coal Chemical Sites
4.2.1. Spatial Structure of Coal Sites
4.2.2. Spatial Structure of Coal Power Sites
4.2.3. Spatial Structure of Coal Chemical Industry
5. Risk Control of Ningdong Coal Power Base
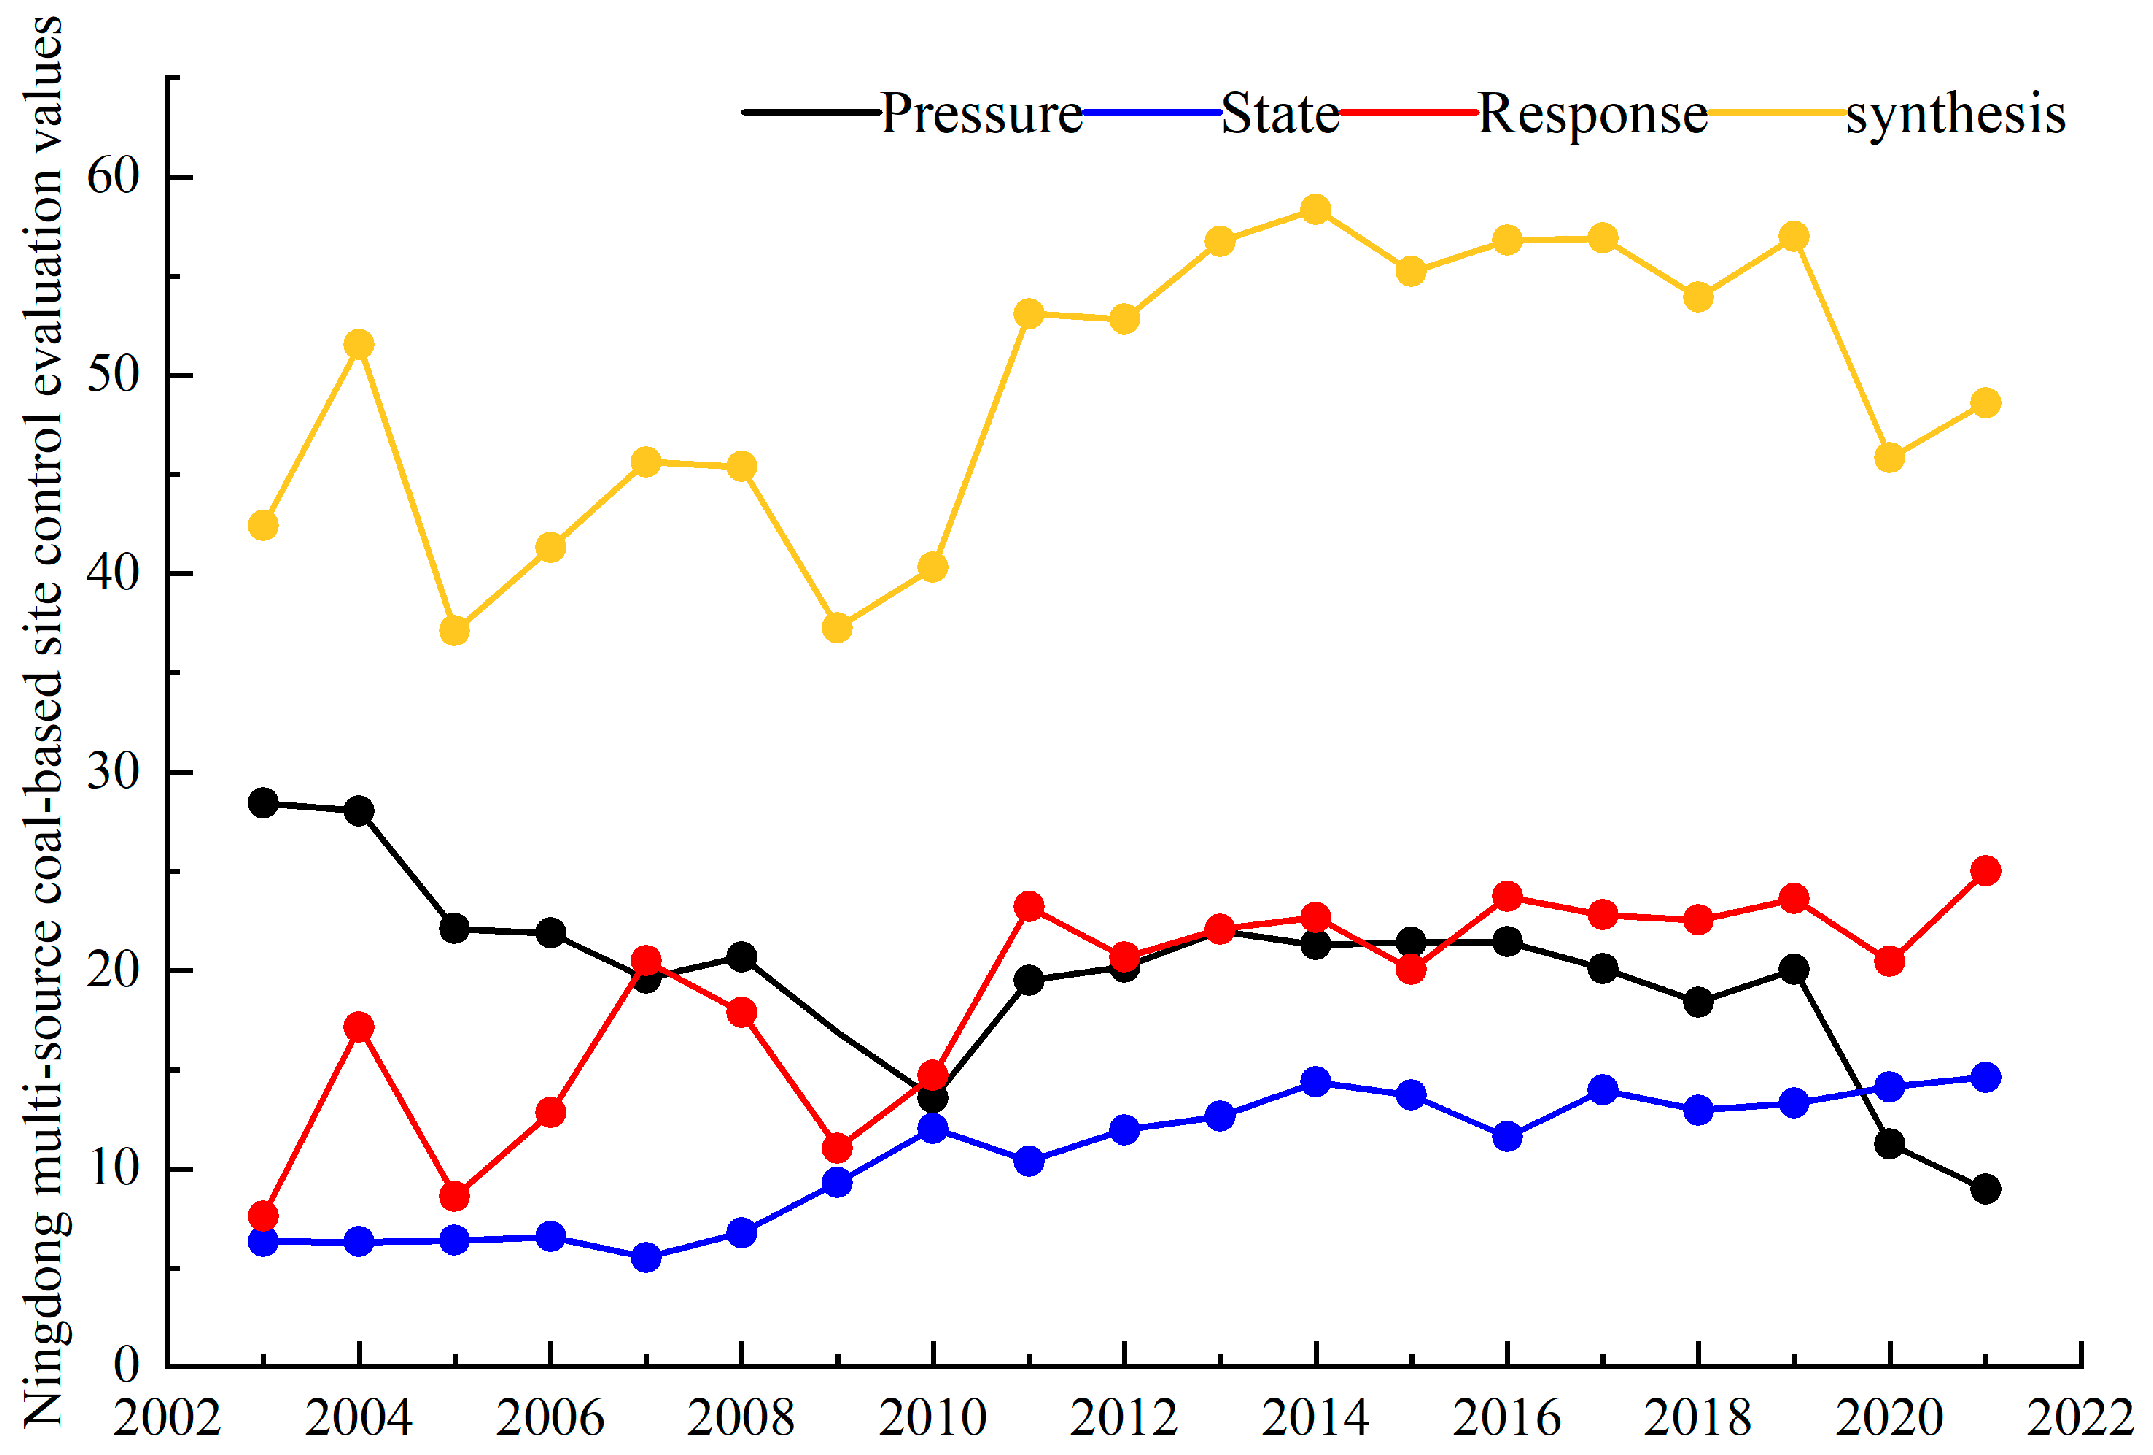
5.1. “Pressure–State–Response” Control Evaluation
5.2. Risk Management
5.2.1. Control Zoning Based on Site Characteristics
5.2.2. Risk Control Strategy
6. Conclusions
Author Contributions
Funding
Data Availability Statement
Conflicts of Interest
References
- General Office of the People’s Government of the Autonomous Region on the issuance of the Ningdong Energy and Chemical Industry Base “14th Five-Year Plan” Development Plan Notice-Ningxia. Available online: https://www.nx.gov.cn/zwgk/qzfwj/202112/t20211207_3207682.html (accessed on 6 November 2022).
- Letter from the Department of Ecology and Environment of the Ningxia Hui Autonomous Region on the Co-Operation of Proposal No.056 of the First Session of the Thirteenth National People’s Congress of the Autonomous Region. Available online: https://sthjt.nx.gov.cn/zfxxgk/zfxxgkml/202306/t20230615_4147072.html (accessed on 4 December 2023).
- The Comprehensive Utilization of Coal Gangue Resources to Improve the Quality of the Large Space. Available online: http://paper.people.com.cn/zgnyb/html/2022-06/13/content_25923312.htm (accessed on 6 November 2022).
- Ningdong Energy and Chemical Industry Base to Implement the Second Round of Central Ecological Environmental Protection Supervision Report Rectification Programme. Available online: http://ningdong.nx.gov.cn/xwdt_277/gsgg/202211/t20221117_3847116.html (accessed on 4 December 2023).
- Sarim, M.; Jan, T.; Khattak, S.A.; Mihoub, A.; Jamal, A.; Saeed, M.F.; Soltani-Gerdefaramarzi, S.; Tariq, S.R.; Fernández, M.P.; Mancinelli, R.; et al. Assessment of the Ecological and Health Risks of Potentially Toxic Metals in Agricultural Soils from the Drosh-Shishi Valley, Pakistan. Land 2022, 11, 1663. [Google Scholar] [CrossRef]
- Liang, T.; Werner, T.T.; Heping, X.; Jingsong, Y.; Zeming, S. A Global-Scale Spatial Assessment and Geodatabase of Mine Areas. Glob. Planet. Chang. 2021, 204, 103578. [Google Scholar] [CrossRef]
- Kim, D.-P.; Kim, S.-B.; Back, K.-S. Analysis of Mine Change Using 3D Spatial Information Based on Drone Image. Sustainability 2022, 14, 3433. [Google Scholar] [CrossRef]
- Pre-Acceptance Meeting of the Project “Survey on Land Degradation Factors in Key Mining Areas in the West” Held in Nanjing-China University of Mining and Technology. Available online: https://cesi.cumt.edu.cn/info/1083/1778.htm (accessed on 6 November 2022).
- Yi, S.; Li, X.; Chen, W. A Classification System for the Sustainable Management of Contaminated Sites Coupled with Risk Identification and Value Accounting. Int. J. Environ. Res. Public Health 2023, 20, 1470. [Google Scholar] [CrossRef] [PubMed]
- Beckley, L.; McHugh, T. A Conceptual Model for Vapor Intrusion from Groundwater through Sewer Lines. Sci. Total Environ. 2020, 698, 134283. [Google Scholar] [CrossRef] [PubMed]
- Li, X.; Jiao, W.; Xiao, R.; Chen, W.; Liu, W. Contaminated Sites in China: Countermeasures of Provincial Governments. J. Clean. Prod. 2017, 147, 485–496. [Google Scholar] [CrossRef]
- Wanner, P.; Freis, M.; Peternell, M.; Kelm, V. Risk Classification of Contaminated Sites-Comparison of the Swedish and the German Method. J. Environ. Manag. 2023, 327, 116825. [Google Scholar] [CrossRef] [PubMed]
- Li, X.; Xiao, R.; Chen, W.; Chang, C.; Deng, Y.; Xie, T. A Conceptual Framework for Classification Management of Contaminated Sites in Guangzhou, China. Sustainability 2017, 9, 362. [Google Scholar] [CrossRef]
- The Establishment of the Zoning Control System of “Three Lines and One List” Ecological Environment in Mianyang_Mianyang Municipal People’s Government. Available online: http://www.my.gov.cn/english/dynamic/27006721.html (accessed on 6 November 2023).
- Xu, F.; Shao, Y.; Xu, B.; Li, H.; Xie, X.; Xu, Y.; Pu, L. Evaluation and Zoning of Cultivated Land Quality Based on a Space–Function–Environment. Land 2023, 12, 174. [Google Scholar] [CrossRef]
- Linming, D.; Jinghui, S.; Jiameng, C.; Xianglan, L.; Jingqi, D.; Hongzhen, Z.; Lai, Z. International comparative study of risk classification methods for soil and groundwater contamination in industrial sites. Environ. Pollut. Prev. 2023, 45, 113–121. [Google Scholar] [CrossRef]
- Krzaklewski, W.; Pietrzykowski, M. Site classification in post-mining areas reclaimed for forestry use with special focus on the phytosociological-soil method. Sylwan 2007, 151, 51–57. [Google Scholar] [CrossRef]
- Xu, Z.; Lian, J.; Zhang, J.; Bin, L. Investigating and Optimizing the Water Footprint in a Typical Coal Energy and Chemical Base of China. Sci. Total Environ. 2020, 727, 138781. [Google Scholar] [CrossRef] [PubMed]
- Li, P.; Chen, P.; Shen, J.; Deng, W.; Kang, X.; Wang, G.; Zhou, S. Dynamic Monitoring of Desertification in Ningdong Based on Landsat Images and Machine Learning. Sustainability 2022, 14, 7470. [Google Scholar] [CrossRef]
- Kuang, W.; Zhang, S.; Du, G.; Yan, C.; Wu, S.; Li, R.; Lu, D.; Pan, T.; Ning, J.; Guo, C.; et al. Monitoring Periodically National Land Use Changes and Analyzing Their Spatiotemporal Patterns in China during 2015–2020. J. Geogr. Sci. 2022, 32, 1705–1723. [Google Scholar] [CrossRef]
- Liping, C.; Yujun, S.; Saeed, S. Monitoring and Predicting Land Use and Land Cover Changes Using Remote Sensing and GIS Techniques—A Case Study of a Hilly Area, Jiangle, China. PLoS ONE 2018, 13, e0200493. [Google Scholar] [CrossRef] [PubMed]
- Girma, R.; Moges, A.; Fürst, C. Integrated Modeling of Land Degradation Dynamics and Insights on the Possible Future Management Alternatives in the Gidabo River Basin, Ethiopian Rift Valley. Land 2023, 12, 1809. [Google Scholar] [CrossRef]
- An, X.; Jin, W.; Zhang, H.; Liu, Y.; Zhang, M. Analysis of Long-Term Wetland Variations in China Using Land Use/Land Cover Dataset Derived from Landsat Images. Ecol. Indic. 2022, 145, 109689. [Google Scholar] [CrossRef]
- Zhou, Y.; Li, X.; Liu, Y. Land Use Change and Driving Factors in Rural China during the Period 1995–2015. Land Use Policy 2020, 99, 105048. [Google Scholar] [CrossRef]
- Lai, S.; Sha, J.; Eladawy, A.; Li, X.; Wang, J.; Kurbanov, E.; Lin, Z.; Wu, L.; Han, R.; Su, Y.-C. Evaluation of Ecological Security and Ecological Maintenance Based on Pressure-State-Response (PSR) Model, Case Study: Fuzhou City, China. Hum. Ecol. Risk Assess. Int. J. 2022, 28, 734–761. [Google Scholar] [CrossRef]
- Ashraf, A.; Haroon, M.A.; Ahmad, S.; Abowarda, A.S.; Wei, C.; Liu, X. Use of remote sensing-based pressure-state-response framework for the spatial ecosystem health assessment in Langfang, China. Environ. Sci. Pollut. Res. 2023, 30, 89395–89414. [Google Scholar] [CrossRef]
- Xu, C.; Zhou, K.; Xiong, X.; Gao, F. Assessment of Coal Mining Land Subsidence by Using an Innovative Comprehensive Weighted Cloud Model Combined with a PSR Conceptual Model. Environ. Sci Pollut Res 2022, 29, 18665–18679. [Google Scholar] [CrossRef] [PubMed]
- Qiu, M.; Zuo, Q.; Wu, Q.; Yang, Z.; Zhang, J. Water Ecological Security Assessment and Spatial Autocorrelation Analysis of Prefectural Regions Involved in the Yellow River Basin. Sci. Rep. 2022, 12, 5105. [Google Scholar] [CrossRef] [PubMed]
- China Energy Ningxia Power’s 2 GW Photovoltaic Project Breaks Ground. Available online: https://www.ceic.com/gjnyjtwwEn/xwzx/202110/fd8c8ed5b69644d680a1fe55baf73fb3.shtml (accessed on 6 November 2023).
- Xiao, P.; Xu, J.; Zhao, C. Conflict Identification and Zoning Optimization of “Production-Living-Ecological” Space. Int. J. Environ. Res. Public Health 2022, 19, 7990. [Google Scholar] [CrossRef] [PubMed]
- Xia, N.; Hai, W.; Tang, M.; Song, J.; Quan, W.; Zhang, B.; Ma, Y. Spatiotemporal Evolution Law and Driving Mechanism of Production–Living–Ecological Space from 2000 to 2020 in Xinjiang, China. Ecol. Indic. 2023, 154, 110807. [Google Scholar] [CrossRef]
- Jonathan, W.; Coffman, G. Integrating the resilience concept into ecosystem restoration. Restor. Ecol. 2023, 31, 5. [Google Scholar] [CrossRef]
- Pawar, B.; Park, S.; Hu, P.; Wang, Q. Applications of Resilience Engineering Principles in Different Fields with a Focus on Industrial Systems: A Literature Review. J. Loss Prev. Process Ind. 2021, 69, 104366. [Google Scholar] [CrossRef]


| Date | Resolution/m | Type | Cloud Cover |
|---|---|---|---|
| 4 December 2003 | 30 | Landsat-TM | 6.00% |
| 8 December 2010 | 30 | Landsat-TM | 6.00% |
| 18 November 2021 | 30 | Landsat-OLI | 2.39% |
| 22 December 2021 | 10 | Sentinel-2 | 4.00% |
| Type | Characteristics | Sample | Type | Characteristics | Sample | ||
|---|---|---|---|---|---|---|---|
| Coal | Open pit | Uniformly toned black; Large patches |  | Coal power | Cooling tower | Black circular area with great height and distinctive shadows, tower of concrete material with distinctive areas of high intensity. |  |
| Industrial square | Around the open pit; Red and blue in shape |  | Coal power equipment | Reddish-blue, regular in shape, concentrated, with neatly distributed equipment |  | ||
| Solid waste | Light or dark grey; Rounded, semicircular, or conical; Patchy texture; Little surface vegetation |  | Coal power waste dumps | Located in the coal powerhouse, rough-textured and irregular in shape |  | ||
| Coal storage yard | Black or light black; Regular in shape; Large in size; Mainly in the vicinity of industrial squares |  | Coalchemical | Coal chemical production sites | Black, bright blue, yellow. or purple in color, with concentrated industrial facilities, regular shapes, and distinct boundaries |  | |
| Coal gangue pile | Light grey; rough textured and irregular in shape |  | Chemical waste dumps | Greyish-white in color with smooth texture and distinct accumulations |  | ||
| Year | Overall Accuracy | Kappa Factor |
|---|---|---|
| 2003 | 85.176% | 0.8023 |
| 2010 | 85.517% | 0.8220 |
| 2021 | 83.007% | 0.8003 |
| Year | Green Vegetation Cover | Bare Land | Water | Road | Residential Area | Coal | Coal Power | Coal Chemical |
|---|---|---|---|---|---|---|---|---|
| 2003 | 668.37 | 292.04 | 16.16 | 7.80 | 8.56 | 5.78 | 0.00 | 1.71 |
| 2010 | 636.29 | 266.97 | 16.37 | 18.40 | 14.66 | 29.34 | 6.49 | 11.90 |
| 2021 | 565.09 | 242.14 | 19.84 | 30.95 | 15.11 | 64.55 | 16.01 | 46.73 |
| Year | Projects | Type of Land Use | |||||||
|---|---|---|---|---|---|---|---|---|---|
| Green Vegetation Cover | Bare Land | Water | Road | Residential Area | Coal | Coal Power | Coal Chemical | ||
| 2003–2010 | Variation/km2 | −32.07 | −25.07 | 0.21 | 10.60 | 6.10 | 23.55 | 6.49 | 10.19 |
| Attitude/% | −0.69% | −1.23% | 0.18% | 19.43% | 10.18% | 58.21% | 0.00% | 85.06% | |
| 2010–2021 | Variation/km2 | −71.21 | −24.83 | 3.47 | 12.55 | 0.45 | 35.21 | 9.52 | 34.83 |
| Attitude/% | −1.02% | −0.85% | 1.93% | 6.20% | 0.28% | 10.91% | 13.34% | 26.60% | |
| 2003–2021 | Variation/km2 | −103.28 | −49.90 | 3.68 | 23.16 | 6.55 | 58.76 | 16.01 | 45.02 |
| Attitude/% | −39.14 | 0.25 | 3.26 | 1.95 | −5.65 | 11.66 | 3.03 | 24.64 | |
| Type | Area/km2 | Percentage/% | Type | Area/km2 | Percentage/% |
|---|---|---|---|---|---|
| Coal | 66.78 | 6.68 | Industrial park | 22.07 | 2.20 |
| Solid waste | 21.59 | 2.16 | |||
| Coal storage area | 11.61 | 1.16 | |||
| Waste rock pile | 10.25 | 1.02 | |||
| Open pit | 1.39 | 0.14 | |||
| Coal power | 18.32 | 4.73 | Cooling tower | 0.41 | 0.04 |
| Coal power equipment | 10.36 | 1.03 | |||
| Coal power waste dumps | 7.55 | 0.75 | |||
| Coal chemical. | 47.35 | 1.83 | Coal chemical production sites | 29.13 | 2.91 |
| Coal chemical waste dumps | 18.54 | 1.85 |
| Target Layers | Normative Layer | Elementary Layer | Indicator Layer | Indicators | Weight | Data Sources |
|---|---|---|---|---|---|---|
| Evaluation index system for control of Ningdong multi-source coal-based sites | Pressure indicator (P) | Socio-economic (P1) | Population of Nindong Township/person | N | 0.0669 | Statistical Yearbook of China’s Counties |
| Mining employment/person | N | 0.0481 | Statistical Yearbook of China’s Counties | |||
| Ecosystems (P2) | General industrial solid waste generation/tons | N | 0.0581 | Ningxia Hui Autonomous Region Statistical Yearbook | ||
| Total industrial wastewater discharge/tons | N | 0.0517 | Ningdong Energy and Chemical Base Statistics | |||
| Total industrial emissions/billion standard cubic meters | N | 0.0579 | Ningdong Energy and Chemical Base Statistics | |||
| Mining land in towns and villages and industrial and mining land/ha | N | 0.0719 | Ningxia Hui Autonomous Region Statistical Yearbook | |||
| Status indicator (S) | Natural state (S1) | Mineral reserves/billion tons | P | 0.0592 | Ningxia Hui Autonomous Region Statistical Yearbook | |
| Socio-economic (S2) | Investment in fixed assets in the mining industry/ten thousand RMB | P | 0.0618 | Ningxia Hui Autonomous Region Statistical Yearbook | ||
| Investment in fixed assets in the electricity, gas and water production, and supply industry/USD million | P | 0.0424 | Ningxia Hui Autonomous Region Statistical Yearbook | |||
| Per capita gross household income of urban residents/USD | P | 0.0476 | Statistical Yearbook of China’s Counties | |||
| Response indicator (R) | Socio-economic (R1) | Mining GDP/billion | P | 0.0516 | Ningdong Energy and Chemical Base Statistics | |
| GDP of electricity, gas, and water production and supply industry/billion dollars | P | 0.0576 | Ningxia Hui Autonomous Region Statistical Yearbook | |||
| Gross mining product as a share of GDP/per cent | P | 0.0613 | Ningxia Hui Autonomous Region Statistical Yearbook | |||
| Internal expenditure on R&D equivalent to GDP/% | P | 0.0448 | Ningxia Hui Autonomous Region Statistical Yearbook | |||
| Total imports/exports/million | P | 0.0508 | Ningxia Hui Autonomous Region Statistical Yearbook | |||
| Ecosystems (R2) | Solid waste management projects/unit | P | 0.0496 | Statistical Yearbook of China’s Counties | ||
| Wastewater treatment projects/unit | P | 0.0495 | Ningxia Hui Autonomous Region Statistical Yearbook | |||
| Exhaust gas treatment project/unit | P | 0.0693 | Ningdong Energy and Chemical Base Statistics |
| Year | Pressure | State | Response | Synthesis | Year | Pressure | State | Response | Synthesis |
|---|---|---|---|---|---|---|---|---|---|
| 2004 | 28.04 | 6.33 | 17.16 | 51.53 | 2014 | 21.30 | 14.38 | 22.67 | 58.35 |
| 2005 | 22.11 | 6.39 | 8.62 | 37.12 | 2015 | 21.43 | 13.73 | 20.05 | 55.21 |
| 2006 | 21.89 | 6.58 | 12.85 | 41.32 | 2016 | 21.45 | 11.63 | 23.72 | 56.80 |
| 2007 | 19.61 | 5.54 | 20.48 | 45.63 | 2017 | 20.10 | 13.99 | 22.81 | 56.90 |
| 2008 | 20.70 | 6.79 | 17.90 | 45.38 | 2018 | 18.40 | 12.97 | 22.56 | 53.93 |
| 2009 | 16.89 | 9.33 | 11.06 | 37.28 | 2019 | 20.05 | 13.31 | 23.62 | 56.98 |
| 2010 | 13.57 | 12.04 | 14.71 | 40.31 | 2020 | 11.25 | 14.14 | 20.45 | 45.84 |
| 2011 | 19.51 | 10.38 | 23.20 | 53.10 | 2021 | 8.97 | 14.62 | 25.02 | 48.61 |
| 2012 | 20.18 | 11.97 | 20.68 | 52.82 |
| Zoning | Characterization | Control Positioning | Area/km2 |
|---|---|---|---|
| Living area | Residential area | Prevent the increase in regional ecological risks and the further evolution and degradation of ecosystems | 14.28 |
| Ecological conservation area | Green vegetation cover, bare land, water | Ecological resilience restoration | 820.19 |
| Production monitoring and early warning zone | Coal-based sites | Preventing over-exploitation | 83.83 |
| Damage repair and reconstruction area | Open pits, solid waste, coal and power waste dumps, chemical waste dumps | Engineered resilience repair | 49.07 |
| Other regulated area | Roads, undeveloped land | Reducing the impact of anthropogenic disturbances and relying on ecosystem resilience to manage risks | 33.05 |
Disclaimer/Publisher’s Note: The statements, opinions and data contained in all publications are solely those of the individual author(s) and contributor(s) and not of MDPI and/or the editor(s). MDPI and/or the editor(s) disclaim responsibility for any injury to people or property resulting from any ideas, methods, instructions or products referred to in the content. |
© 2023 by the authors. Licensee MDPI, Basel, Switzerland. This article is an open access article distributed under the terms and conditions of the Creative Commons Attribution (CC BY) license (https://creativecommons.org/licenses/by/4.0/).
Share and Cite
Ren, Y.; Feng, X.; Ma, K.; Zhai, W.; Dong, J. Precise Identification of Site Characteristics and Risk Management of Ningdong Coal Power Base. Land 2024, 13, 3. https://doi.org/10.3390/land13010003
Ren Y, Feng X, Ma K, Zhai W, Dong J. Precise Identification of Site Characteristics and Risk Management of Ningdong Coal Power Base. Land. 2024; 13(1):3. https://doi.org/10.3390/land13010003
Chicago/Turabian StyleRen, Yuxin, Xiaotong Feng, Kun Ma, Wen Zhai, and Jihong Dong. 2024. "Precise Identification of Site Characteristics and Risk Management of Ningdong Coal Power Base" Land 13, no. 1: 3. https://doi.org/10.3390/land13010003
APA StyleRen, Y., Feng, X., Ma, K., Zhai, W., & Dong, J. (2024). Precise Identification of Site Characteristics and Risk Management of Ningdong Coal Power Base. Land, 13(1), 3. https://doi.org/10.3390/land13010003