Abstract
The occurrence of water scarcity and extreme hydrological events is becoming increasingly frequent worldwide. The river runoff process, as an important link in the water cycle of a basin, is an essential content of the study of hydrological processes in the basin. Vegetation is an influencing factor closely related to hydrological processes in a watershed. This article quantitatively analyzes the impact of vegetation restoration and climate variation on runoff in the Luan River Basin from 1982 to 2018. Firstly, trend analysis was conducted on runoff depth, precipitation, the Normalized Vegetation Index (NDVI), and reference evaporation. Then, Mann–Kendall mutation analysis and Pettitt mutation analysis were used to identify the year of runoff mutation. Finally, a Budyko model was constructed to quantitatively analyze the impact of vegetation and climate change on the runoff of the Luan River. The results showed that: (1) The runoff reduction rate of the Luan River was 1.2437 mm/a. The precipitation was increasing at a rate of 0.6977 mm/a. The reference evaporation rate decreased at a rate of 0.0977 mm/a. The annual growth rate of the Budyko parameter (n) was 0.0283. The annual growth rate of NDVI was 0.0022. (2) The coefficient of determination in the functional equation (a = 14.74, b = −3.4105) for NDVI and Budyko parameter (n) was 0.3297 (p < 0.01). (3) The contributions of Pr, ET0, NDVI, and (n) to reduced flow were −17.49%, 1.46%, 35.25%, and 80.78%, respectively. The increase in vegetation would lead to a decrease in runoff. This study can clarify the impact of vegetation restoration on water resource security in the Luan River Basin.
1. Introduction
Water is a precious resource for our human survival and development [1]. In the context of global change, the problem of water security and water resources supply in China has become increasingly prominent [2]. Under the dual impact of climate change and human activities, the runoff process in river basins has undergone profound spatiotemporal changes. The changes in river basin runoff are closely related to the increasingly severe drought and flood disasters [3], bringing huge economic losses to human society and even threatening the safety of human life and property [4]. In recent years, significant achievements have been made in global vegetation restoration, with China, India, Europe and other countries or regions being the most significant. While improving the ecological environment, this may further exacerbate the problem of water scarcity. In areas where water resources are scarce, it is necessary to study the interaction mechanism between vegetation and watershed water cycle for afforestation. Otherwise, the shortage of water resources will result in a low survival rate of trees. Moreover, vegetation growth consumes soil moisture through evaporation. If afforestation is not completed properly, it can alter the local water balance and worsen the ecological environment [5]. In recent years, the impact of human activities on the Luan River Basin has become increasingly strong. Under the influence of ecological engineering such as water and soil conservation, the vegetation coverage in the basin has been increasing. The contradiction between the supply and demand of water resources driven by urbanization and agricultural irrigation has intensified. The development and utilization rate of water resources in the basin has exceeded 86%. The sharp decrease in surface runoff and inflow into the sea has seriously affected the healthy and stable development of the regional economy [6]. Understanding the characteristics and mechanisms of runoff changes is of great significance for ensuring regional water security. Conducting research on the impact of vegetation restoration on water resources can provide a more comprehensive understanding of the relationship between vegetation restoration and water resources, which is conducive to objectively evaluating the hydrological benefits of vegetation restoration projects and providing a scientific basis for vegetation restoration practices.
As an important part of the terrestrial ecosystem, vegetation plays a role in connecting the atmosphere, water, soil, and human society [7,8,9]. From 2000 to 2017, China’s vegetation leaf area index significantly increased, accounting for 25% of the global net increase in leaf area [10]. Among various vegetation indices extracted from remote sensing data, the Normalized Vegetation Index (NDVI) is widely used in vegetation dynamics research due to its clear physical significance and simple inversion algorithms [11,12]. Rouse et al. [13] first proposed the Normalized Vegetation Index (NDVI) in 1973. They used a pixel binary model to process the reflected light of each pixel in the image into NDVI and found that this index is very consistent with the coverage and health status of plants. Subsequent studies have found a significant correlation between NDVI and plant density, as it has a long history, is simple, and relies on easily obtainable multispectral bands, which can reflect the distribution and change characteristics of regional vegetation. It is considered one of the effective indicators for monitoring land vegetation changes [14,15].
In the past, the research on influencing factors of runoff change was mainly qualitative research. Now, due to the continuous development of various statistical methods and hydrological models, the analysis of the impact of runoff change is gradually increasing [16]. At present, the main methods for attribution analysis of runoff evolution include mathematical statistics [17], hydrological simulation [18], and elastic coefficient method [19]. Among them, mathematical statistics mainly use mathematical methods such as regression analysis and neural networks or statistical models to summarize the primary drivers’ contributions to runoff shifts. This method is simple to calculate and requires long-series hydrological data. The hydrological simulation method is based on the basin hydrological model or land surface process model to quantitatively analyze the impact of each driving factor on runoff change. This method has a strong physical mechanism and can be simulated under different land use conditions and multiple climate scenarios, with high analysis accuracy. The flexibility coefficient method is designed to calculate changes in runoff as a result of weather variations and anthropogenic impacts based on the Budyko hypothesis and the concept of flexibility coefficients. The logical ramification of this method is well established; the parameters are easy to obtain; and the calculation is simple. Li et al., Nie et al. and Wang et al. [20,21,22,23] investigated the influencing factors of runoff change using VIC model, SWAT programs, and the cumulative rate of change of slope. Ji et al., Liang et al. and Huang et al. [24,25,26] used Budyko’s method to investigate the factors affecting runoff. Zhai et al. [27] determined the effect of weather fluctuation and anthropogenic action on runoff variability in the study area based on the Budyko elasticity coefficient method of measurement. Among them, the Budyko method is comparatively easier and has been confirmed by multiple studies to be stable and reliable.
Scholars have conducted research on the relationship between plants and runoff. He et al. [28] found that through simulating rainfall, compared to bare land, it takes a shorter time and a smaller amount of runoff to stabilize when covered with litter. Shao [29] conducted research on the interaction mechanism between vegetation and the watershed water cycle. It was found that the higher the plant cover, the higher the transpiration, the larger the ratio of subsurface runoff to total runoff, and the higher the average soil moisture. The impact of vegetation parameterization on the simulation results of the watershed water cycle becomes increasingly significant as the time scale decreases. Shi et al. [30] found that there is mainly an insignificant positive correlation between NDVI and surface runoff in the watershed. Ji et al., Zhang et al., Ning et al., Wang et al., Liu et al. and Gao et al. [31,32,33,34,35,36] studied the specific effects of tree growth on streamflow of different rivers.
Scholars have also achieved some results in the causation analysis of the Luan River runoff. Zhao et al. [37] examined the trends and abrupt changes of runoff coefficients in the Luan River Basin using the correlation coefficient method and the sliding t-test. Sun et al. [38] employed the SWAT for characterizing the month-to-month infill runoff procedure of Panjiakou Reservoir in the Luan River Basin under two future climate scenarios from 2028 to 2050 and analyzed the runoff changes under future climate scenarios. It was found that under the RCP2.6 scenario, the monthly average runoff increased by about 17 m3/s, while under the RCP8.5 scenario, the monthly average runoff increased by about 24 m3/s. Sun [39] analyzed the impact of ridge and ditch layout on slope runoff under different scenarios. Cross ridge tillage can significantly weaken the phenomenon of rainfall runoff under the rainstorm level, and the runoff yield increases with the increase in ridge spacing. However, under different ridge and furrow trends, the influence of ridge spacing on the runoff yield is different. Zhang [40] used the SWAT model to simulate the effects of diverse landscape utilization patterns on the runoff of the Luan River. It was found that the reaction of radial streams to land use/cover was influenced by forested land and geomorphological changes, with the effect of forested land being more significant. Fu [41,42] used long-term weather data from 1953 to 2011 to study the pattern of climate and river water in the Luan River Basin. Wu [43,44] found that land use change has led to spatial changes in runoff, evaporation, and surface runoff in the Luan River Basin. Chen et al. [45,46] studied the flow of the Luan River and found that anthropogenic factors should not be ignored.
Existing research has conducted attribution analysis on the impact of different factors such as climate, underlying surface, and human activities on Luan River runoff. A comprehensive understanding has been formed on the changes in runoff, weather change, and the contribution of human activities in the Luan River Basin. However, the characteristics of the influence of vegetation change on the runoff coefficient of the Luan River and its attribution still need to be further studied. Based on this, this article focuses on the issue of runoff evolution under the influence of strong vegetation cover, quantitatively analyzes the hydrological changes in the Luan River Basin from 1982 to 2018 and their response to NDVI and climate, and analyzes the changes in hydrological and meteorological factors, such as vegetation cover and runoff. This article first conducts trend analysis on the runoff of the Luan River and then uses the Mann–Kendall mutation test method and Pettitt mutation analysis method to find the mutation year of the runoff of the Luan River from 1982 to 2018. Based on the mutation year, the study period was divided into two time periods, and the influence of each factor on runoff variations was worked out using the Budyko model. The study can clarify the relationship between vegetation and water resources in the Luan River Basin. It provides a scientific basis and reference for water resources adjustment in the Luan River Basin.
2. Materials and Methods
2.1. Research Area
- a.
- Location
Luan River Basin (Figure 1) (115°40′~119°20′ E and 39°10′~42°35′ N) is the second largest river in Hebei Province, located in the northeast of North China, and belongs to an important water system in the north of the Haihe River Basin. It involves 7 cities and 27 counties in Inner Mongolia, Hebei Province, and Liaoning Province. Luan River has a total length of 888 km. The basin covers an area of 44,800 km2, of which 98% is mountainous and 2% is plain. Luan River Basin originates from Bashang Grasslands in Inner Mongolia, and its middle reaches flow through mountainous and hilly areas in northern Hebei, while its lower reaches mainly flow through plains [47,48].
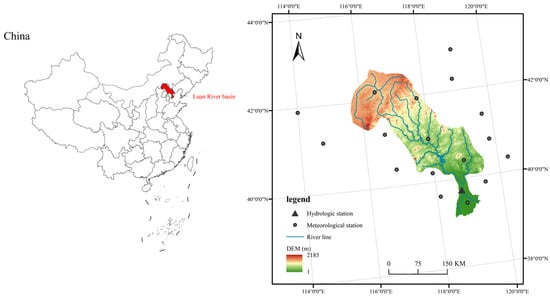
Figure 1.
The geographical location and elevation of the Luan River Basin in China.
- b.
- Weather and climate
This basin belongs to the temperate continental monsoon semi-arid zone. The average annual precipitation is 560 mm, mainly in summer (70~80%). The average annual temperature is 5–12 °C, with a maximum temperature of 35.7 °C and a minimum temperature of −35.1 °C, gradually decreasing from southeast to northwest. The average annual water surface evaporation is 950~1150 mm. The mean yearly runoff is 4.192 billion m3, and the annual water volume is mainly concentrated in summer [49,50].
- c.
- Land use and cover
The main soil type is loam and its derivatives [51]. The predominant land cover types in the watershed are cropland, woodland steppe, woodland, and grassland [52]. The terrain of the Luan River Basin varies greatly, with a general trend of terrain tilting from northwest to southeast, and the water system being distributed in a feather-like pattern [53]. The Luan River Basin has about 500 annual water tributaries, including 33 primary tributaries, all of which are over 20 km long. Among them, there are 10 primary tributaries with a drainage area greater than 1000 km2, all of which are mountain streams with relatively abundant water volume [54].
2.2. Data Sources
Runoff data of the Luan River Basin come from the Luanxian Hydrological Station.
Luan River Basin climate station data from the China Meteorological Administration (http://www.cma.gov.cn/ accessed on 1 July 2023). The dataset contains daily meteorological data from all stations in the research area from 1982 to 2018. The annual mean precipitation of the Luan River Basin was obtained by Kriging interpolation using annual precipitation data from 1982 to 2018 from all meteorological stations in the study area (Figure 2).
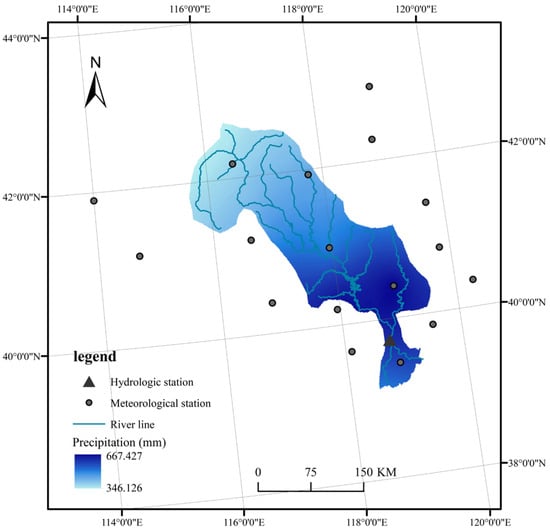
Figure 2.
Annual precipitation distribution in the Luan River Basin from 1982 to 2018.
The reference evapotranspiration of each meteorological station from 1982 to 2018 was calculated using the Penman–Monteith formula suggested by the FAO. Then, Kriging interpolation was used to obtain the annual reference evapotranspiration for the Luan River Basin.
The NDVI data in this article are sourced from https://www.ncei.noaa.gov/data/land-normalized-difference-vegetation-index/access/ accessed on 1 July 2023.
2.3. Research Methods
2.3.1. Mann–Kendall Trend Analysis Method
Commonly used non-parametric testing methods include Mann–Kendall trend analysis testing proposed by Mann [55] and Kendall [56]. Mann–Kendall trend analysis method is a non-parametric statistics test method. Its advantage is that samples cannot follow a specific distribution, nor be interfered with by a few outliers. The calculation is also relatively simple. This article uses the Mann–Kendall trend analysis method to analyze the trend of runoff, precipitation, reference evaporation, NDVI, and n in the Luan River Basin from 1982 to 2018.
2.3.2. Mann–Kendall Mutation Analysis Method
The Mann–Kendall mutation analysis method is one of the most commonly used methods for analyzing the trend of changes in meteorological and hydrological elements [57]. It has strong applicability and simple calculation. It can specify the start time of the mutation and indicate the mutation area [58]. This article uses the Mann–Kendall mutation analysis method to conduct a mutation analysis of the runoff in the Luan River Basin from 1982 to 2018.
2.3.3. Pettitt Mutation Analysis Method
The Pettitt mutation analysis method is also a non-parametric test statistical method, which can determine whether there is a mutation point in the calculated data sequence based on the mean change and indicate the time point to which the mutation point belongs. This method has simple calculation steps, clear results, and a good recognition effect for mutation points and is widely used. This article uses the Pettitt mutation analysis method to conduct a mutation analysis of the runoff in the Luan River Basin from 1982 to 2018.
2.3.4. Corrected Budyko Equation
This article adopts the Budyko model and takes into account the research of other scholars [19,59,60,61]. The following formulas mainly refer to the research of Ji et al. [36].
ET, Pr, and R denote the actual evaporation, precipitation, and runoff depth of the study area, respectively [62].
ET0 denotes the reference evapotranspiration in millimeters, calculated from the Penman–Monteith equation. The Budyko n parameter represents the anthropogenic factors. Anthropogenic factors affect the flow in the Luan watershed in various ways, such as through hydraulic engineering and forestation [63].
n = a ∗ NDVI + b
εP, εET0, εn, and εNDVI denote the elasticity coefficients of R with respect to Pr, ET0, n, and NDVI, respectively, and are calculated by the following equation [32].
Depending on the year of sudden change, the study period can be divided into S1 and S2, and the differences in precipitation (ΔPr), potential evapotranspiration (ΔET0), bottom surface characteristics (Δn), and NDVI (ΔNDVI) are calculated from S1 to S2. Where ΔRPr, Δ, ΔRn, and ΔRNDVI are the values of flow changes due to changes in precipitation, potential evapotranspiration, n, and NDVI, respectively [36].
, and represent the contribution of precipitation, potential evapotranspiration, NDVI, and anthropogenic factors to the flow, respectively, calculated using the following formulas [36].
3. Results
3.1. Trend Analysis of Various Factors
After obtaining the reference evapotranspiration, precipitation, and runoff depth of the study area, the Budyko parameter (n) can be calculated using the Budyko formula. In order to analyze the impact of changes in various factors on the runoff of the Luan River, we explored the temporal variation characteristics of various factors in the Luan River Basin.
According to Mann–Kendall trend analysis of various research elements (Table 1), it was found that the runoff of the Luan River significantly decreased at the 0.05 level, with a reduction rate of 1.2437 mm/a. The precipitation was increasing at a rate of 0.6977 mm/a. The reference evaporation rate decreased at a rate of 0.0977 mm/a. (n) Significant growth at the 0.05 level, with an annual growth rate of 0.0283. NDVI has significantly increased at the 0.01 level, with an annual growth rate of 0.0022. Figure 3 shows the changes in runoff, precipitation, and reference evaporation from 1982 to 2018.

Table 1.
Mann–Kendall trend analysis of various factors.
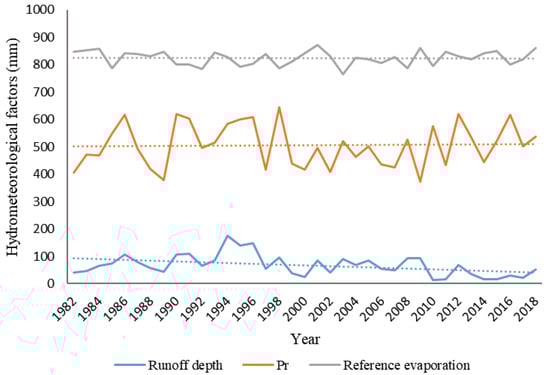
Figure 3.
Changes in runoff, precipitation, and reference evaporation from 1982 to 2018.
3.2. Analysis of Sudden Changes in Runoff
Through the Mann–Kendall mutation analysis method, a mutation analysis was conducted on the runoff of the Luan River from 1982 to 2018. The Mann–Kendall mutation analysis method is a non-parametric test method recommended by the World Meteorological Organization and has been widely used to analyze the changes in precipitation, runoff, temperature, and other elements of time series. The Mann–Kendall mutation test is generally believed to be reliable at a 0.05 significance level [57,58,64]. When two lines intersect and the intersection point falls within the 0.05 significance level range, it can be assumed that the time communicating with the intersection point is the time when the time series data undergo a mutation. The research results showed (Figure 4) that, with 2009 as the boundary, the runoff of the Luan River began to undergo mutations. In order to verify the mutation performance of the MK mutation analysis of runoff, the Pettitt mutation analysis was used to diagnose the mutation years of the same data. Figure 5 also showed that 2009 was the year of abrupt change in runoff. So, according to the findings of the two methodologies, it was concluded that the year 2009 is the year of mutation in the annual runoff of the Luan River.
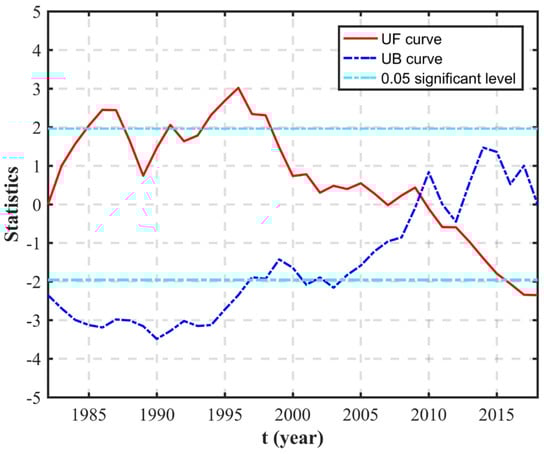
Figure 4.
Results of the 1982–2018 runoff depth Mann–Kendall mutation test.
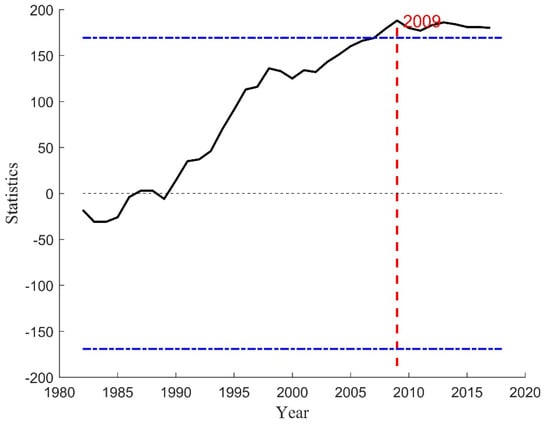
Figure 5.
Results of the 1982–2018 runoff depth Pettitt mutation test.
3.3. NDVI and (n) Fitting Analysis
From the data of NDVI and Budyko parameters, we plotted a 5-year moving average scatter plot of NDVI and Budyko parameters. As shown in Figure 6, we obtained the functional formula of NDVI and Budyko parameter (n), where the slope was 14.74, the intercept was −3.4105, and its decision coefficient was 0.3297 (p < 0.01).
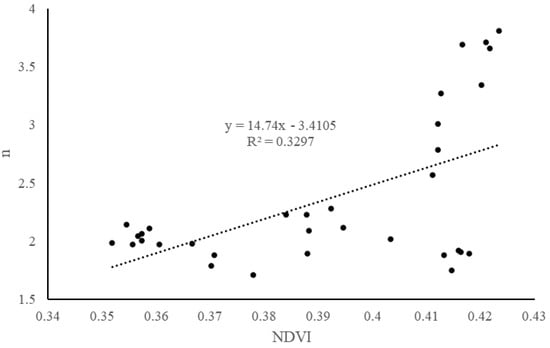
Figure 6.
Regression equations for NDVI and n.
3.4. The Effects of NDVI on Runoff
Depending on the results of Pettitt’s mutation test and MK’s mutation test, the research term was classified into S1 (1982–2009) and S2 (2010–2018), and the hydrometeorological elements and NDVI data of the Luan River Basin were found in different terms (Table 2).
Table 2.
Values of hydrometeorological elements and NDVI.
The R in the Luan River Basin decreased from S1 (79.29 mm) to S2 (30.01 mm), a decrease of 49.28 mm. Pr increased from S1 (496.13 mm) to S2 (531.39 mm), an increase of 35.26 mm. The ET0 increased from S1 (822.60 mm) to S2 (829.82 mm), an increase of 7.22 mm. NDVI increased from S1 (0.38) to S2 (0.42), an increase of 0.04. n increased from S1 (1.97) to S2 (3.73), an increase of 1.76.
The elasticity coefficients for Pr, ET0, NDVI, and n can be calculated from the differences between the two periods in Table 2. The variations in flow due to Pr, ET0, NDVI, and n were then calculated. The elastic coefficient of Pr (εP) R was 2.98 (Table 3), indicating that a 1% reduction in Pr results in a 2.98% reduction in runoff depth.
Table 3.
Attribution analysis of changes in flows.
The elastic coefficients R of ET0 (εET0), Budyko parameter n (εn), and NDVI (εNDVI) were −1.98, −1.89, and −4.64, respectively, indicating that when ET0, Budyko parameter n, and NDVI increase by 1%, the runoff depth decreases by 1.98%, 1.89%, and 4.64%, respectively. Finally, the contribution of ET0, Pr, n, and NDVI to the flow was calculated according to formulas (15–18). In the S2 period (2010–2018), the contributions of ET0, Pr, n, and NDVI to runoff reduction were 1.46%, −17.49%, 80.78%, and 35.25%, respectively. In conclusion, the variation of river flow in the study area was mainly affected by the changes in NDVI and subsurface.
4. Discussion
In Figure 4, UF statistics are a sequence of statistics calculated by the order of time series X, and UB statistics are a sequence of statistics calculated by the inverse order of time series X. Based on Figure 4 and Figure 5, 2009 was the year of abrupt runoff change. The use of two mutation detection methods can make the results more scientific and accurate. El Nino and La Nina phenomenon is a phenomenon that occurs in the equatorial Pacific Ocean due to negative/positive sea surface temperature (SST) [65]. Many scholars believe that the El Nino and La Nina phenomenon can affect the size of runoff. Kilicarslan et al. [66] believe that SST mainly affects the heat and water fluxes at the atmospheric lower boundary; thus, there is a significant connection between SST changes and extreme runoff. Colleoni et al. [67] found that SST has a significant impact on Mediterranean runoff. Chen et al. [68,69] studied the relationship between changes in river runoff in China and precipitation, sea surface temperature, and El Nino Southern Oscillation (ENSO), and the results showed a significant relationship between runoff and ENSO. Therefore, we believe that the El Nino and La Nina phenomenon from 2009 to 2010 [70] may have affected the climatic and hydrological factors of the Luan River, leading to a sudden change in the runoff of the Luan River in 2009. Li et al. [65] demonstrated this by studying the hydrological situation of the Luan River Basin from 1965 to 2012. They found that the severe drought in the Luan River Basin in 2009 was mainly caused by the negative phase of Arctic Oscillation (AO) and SST anomalies during this period. In addition, the Luan River Longhua Water Conservancy and Hydropower Project, built in 2009, may also be an important reason for the sudden change in Luan River runoff in 2009.
Zhou et al. [71] believe that the runoff and potential evaporation in the Luan River Basin showed a downward trend from 1961 to 2018. The results of this study are consistent with those of Zhou et al. (Table 1). The trend of increasing precipitation is consistent with the shift towards warm and humid regional climate in the context of global warming. The contribution rate of precipitation to the reduction of runoff is −17.49%, indicating that precipitation has a negative effect on the reduction of runoff. Overall, in the Luan River Basin, the inflow (precipitation) of water increases, while the outflow (ET and runoff) decreases. The missing portion of water in the middle may be interfered with by human activities. The contribution rate of human activities to runoff reduction is as high as 80.78%. For example, the construction and operation of reservoirs have changed the hydrological situation of downstream rivers. Reservoirs store water during high water periods, leading to a decrease in downstream runoff, while releasing water during low water periods increases downstream runoff. The Panjiakou and Daheiting reservoirs in the Luan River Basin release very little water during the rice irrigation period from May to September each year, which results in a long-term cutoff of the downstream river of the Daheiting reservoir [43]. Human beings use a large amount of runoff to obtain water to meet the needs of cities, agriculture, and industry. The dam adjusts water flow to generate electricity, reducing downstream runoff. The large-scale vegetation restoration has increased the water consumption of vegetation, which is the reason for the reduction of runoff and evaporation.
During the study period, NDVI showed an upward trend, which may be because the Chinese government vigorously implemented key projects such as “Grain for Green” to protect and expand forests, reduce land desertification, and prevent soil erosion. Based on this study, we found that the contribution rate of NDVI to runoff reduction was 35.25% (Table 3), which cannot be ignored. The increase in vegetation in the Luan River Basin would lead to a decrease in runoff. Some scholars’ research is consistent with the conclusions of this study. Zhang et al. [72] found that for every 10% increase in NDVI, the average runoff in the watershed decreases by 8.3%, and the impact of vegetation changes on runoff has significant spatial differences. The impact of NDVI changes on runoff is more significant in areas with drier climate and poorer vegetation conditions. Du et al. [73] combined the Budyko equation and found that natural runoff in a watershed is highly sensitive to vegetation change, with underlying surface changes characterized by vegetation change contributing 80% to runoff attenuation. Zhi et al. [74] found that vegetation cover change is gradually dominating runoff changes in the watershed, and increasing vegetation may lead to a decrease in water resources in the watershed. However, some scholars believe that the impact of vegetation coverage on runoff varies with the magnitude of annual rainfall. When the rainfall changes near the average annual rainfall, the runoff coefficient decreases with the increase in vegetation coverage [75]. The government should attach great importance to the impact of large-scale restoration projects on the natural runoff attenuation of rivers. It is suggested that natural restoration should be the main focus of vegetation restoration in the Luan River Basin in the future, and appropriate control should be exercised over artificial vegetation restoration projects.
The growth of vegetation is influenced by factors such as temperature and precipitation, and the growth status of vegetation may vary in different climatic conditions. The impact of vegetation on hydrological processes (interception, transpiration, and infiltration) may vary. Overall, when implementing vegetation restoration projects in regions with different climatic conditions, the impact of vegetation restoration on runoff may vary depending on the effectiveness of vegetation restoration [76]. Although this article strictly controls the quality of data and models, there are still some uncertainties. Due to the wide range of human activities involved, it is difficult to accurately estimate the impact of human activities. Secondly, the premise of the elasticity coefficient method assumed by Budyko is that all variables are independent and do not affect each other. However, in reality, the underlying surface, climate, and ecosystem form a complex whole, and these factors interact and influence each other, which can lead to errors in the model. The underlying surface change of the basin is mainly caused by human activities, such as water conservancy projects, land use changes, water and soil conservation, and the Grain for Green program. Under the influence of these human factors, the hydrological sequence changes accordingly. Human activities affect the underlying surface of a watershed, thereby affecting its runoff and runoff characteristics. This article separated the impact of vegetation on the underlying surface but did not separate the effects of dams, farmland, and organisms on the underlying surface. Further research can be conducted on this in the future. This study has certain guiding significance for vegetation restoration and water resource security in the Luan River Basin.
5. Conclusions
This study quantitatively analyzed the contribution rates of different factors to the runoff changes of the Luan River. Firstly, a trend analysis was conducted on the runoff, and then the Mann–Kendall mutation analysis method and Pettitt mutation analysis method were used to find the mutation year of the Luan River runoff from 1982 to 2018, with the mutation year being 2009. Based on the mutation year, the study period was divided into two periods: S1 (1982–2009) and S2 (2010–2018). The NDVI was separated from the underlying surface and calculated the impact of various factors on runoff changes based on the Budyko model. The research showed that:
- (1)
- The runoff reduction rate of the Luan River was 1.2437 mm/a. The precipitation was increasing at a rate of 0.6977 mm/a. The reference evaporation rate decreased at a rate of 0.0977 mm/a. The annual growth rate of (n) was 0.0283. The annual growth rate of NDVI was 0.0022.
- (2)
- The coefficient of determination in the functional equation (a = 14.74, b = −3.4105) for NDVI and Budyko parameter (n) was 0.3297 (p < 0.01).
- (3)
- The contributions of Pr, ET0, NDVI, and (n) to reduced flow were −17.49%, 1.46%, 35.25%, and 80.78%, respectively.
Studying the interaction mechanism between vegetation and watershed runoff can provide a basis for quantitative evaluation of the impact of human activities (such as deforestation or soil and water conservation projects) on water resources and provide a reference for evaluating the problems or effects of human activities on ecological environment changes and soil and water resource utilization.
Author Contributions
Conceptualization, J.H. and Y.Z.; methodology, G.J.; data curation, G.J.; writing—original draft preparation and review and editing, S.Y. and M.C.; project administration, Y.G. and W.C. All authors have read and agreed to the published version of the manuscript.
Funding
This research was funded by the National Key R&D Program of China (2021YFD1700900), the Special Fund for Top Talents of Henan Agricultural University (30501031), the Henan Soft Science Research Project (232400410328), and the Research Project of Henan Federation of Social Sciences (2023-ZZJH-189).
Data Availability Statement
Not applicable.
Conflicts of Interest
The authors declare no conflict of interest.
References
- Yu, Z.J. Study on the Change and Attribution of Tumen River Runoff Based on SWAT Model; Yanbian University: Yanji, China, 2022. [Google Scholar]
- Xia, J.; Shi, W. Research and prospect on water security in China under changing environment. J. Water Resour. 2016, 47, 292–301. [Google Scholar]
- Ji, G.; Lai, Z.; Yan, D.; Wu, L.; Wang, Z. Spatiotemporal patterns of future meteorological drought in the Yellow River Basin based on SPEI under RCP scenarios. Int. J. Clim. Chang. Strat. Manag. 2021, 14, 39–53. [Google Scholar] [CrossRef]
- Wang, Y.X. Analysis of Runoff Evolution and Attribution in the Nenjiang River Basin; Jilin University: Jilin, China, 2012. [Google Scholar]
- Yang, X.; Song, N.; Chen, L.; Wang, L. Ecological causal relationship between vegetation construction and habitat drought in arid areas. J. Appl. Ecol. 2023, 34, 1713–1720. [Google Scholar]
- Zhao, J.F. Analysis of the Impact of Strong Human Activities on Water Resources Quantity in Luan River Basin; Hebei Agricultural University: Baoding, China, 2022. (In Chinese) [Google Scholar]
- Ding, Y.; Li, Z.; Peng, S. Global analysis of time-lag and -accumulation effects of climate on vegetation growth. Int. J. Appl. Earth Obs. Geoinf. 2020, 92, 102179. [Google Scholar] [CrossRef]
- Wei, Z.F.; Wang, D.G.; Zhang, C.; Liu, X.F.; Zhang, H. Response of vegetation cover to climate change and human activities in Northwest China from 1999 to 2010. Desert China 2014, 34, 1665–1670. [Google Scholar]
- Zhong, L.; Ma, Y.; Xue, Y.; Piao, S. Climate Change Trends and Impacts on Vegetation Greening Over the Tibetan Plateau. J. Geophys. Res. Atmos. 2019, 124, 7540–7552. [Google Scholar] [CrossRef]
- Chen, C.; Park, T.; Wang, X.; Piao, S.; Xu, B.; Chaturvedi, R.K.; Fuchs, R.; Brovkin, V.; Ciais, P.; Fensholt, R.; et al. China and India lead in greening of the world through land-use management. Nat. Sustain. 2019, 2, 122–129. [Google Scholar] [CrossRef] [PubMed]
- Liu, B.; Sun, Y.L.; Wang, Z.L.; Zhao, T.B. Analysis of the relative roles of vegetation cover change and its influencing factors in North China. J. Nat. Resour. 2015, 30, 12–23. [Google Scholar]
- Fensholt, R.; Proud, S.R. Evaluation of Earth Observation based global long term vegetation trends—Comparing GIMMS and MODIS global NDVI time series. Remote Sens. Environ. 2012, 119, 131–147. [Google Scholar] [CrossRef]
- Rouse, J.W.; Haa, R.H.; Schell, J.A.; Deering, D.W. Monitoring Vegetation Systems in the Great Plains with Erts. NASA Spec. Publ. 1973, 351, 309–317. [Google Scholar]
- Leng, S.; Huete, A.; Cleverly, J.; Gao, S.; Yu, Q.; Meng, X.; Qi, J.; Zhang, R.; Wang, Q. Assessing the Impact of Extreme Droughts on Dryland Vegetation by Multi-Satellite Solar-Induced Chlorophyll Fluorescence. Remote Sens. 2022, 14, 1581. [Google Scholar] [CrossRef]
- Jia, W.; Liu, M.; Yang, Y.; He, H.; Zhu, X.; Yang, F.; Yin, C.; Xiang, W. Estimation and uncertainty analyses of grassland biomass in Northern China: Comparison of multiple remote sensing data sources and modeling approaches. Ecol. Indic. 2016, 60, 1031–1040. [Google Scholar] [CrossRef]
- He, Q.L.; Zhou, W.B.; Xia, W.; Li, W.Y. Spatial and temporal characterization of precipitation in Yan’an City over the past 60 years. J. Water Resour. Water Eng. 2018, 29, 31–37. [Google Scholar]
- Zhang, Q.; Liu, J.; Singh, V.P.; Gu, X.; Chen, X. Evaluation of impacts of climate change and human activities on streamflow in the Poyang Lake basin, China. Hydrol. Process. 2016, 30, 2562–2576. [Google Scholar] [CrossRef]
- Xu, Z.X.; Jiang, Y. Studies on the evolution and impact of runoff in changing environments: A review and outlook. J. Hydraul. Water Transp. Eng. 2022, 1, 9–18. [Google Scholar]
- Caracciolo, D.; Pumo, D.; Viola, F. Budyko’s based method for annual runoff characterization across different climatic areas: An application to United States. Water Resour. Manag. 2018, 32, 3189–3202. [Google Scholar] [CrossRef]
- Li, W.Z.; Liu, W.; Zhang, T.F.; Shi, X.H. Study on the contribution of climate and human activities to the change of runoff in the source area of the Yellow River. Glacial Permafr. 2018, 40, 985–992. [Google Scholar]
- Nie, N.; Zhang, W.; Liu, M.; Chen, H.; Zhao, D. Separating the impacts of climate variability, land-use change and large reservoir operations on streamflow in the Yangtze River basin, China, using a hydrological modeling approach. Int. J. Dig. Earth 2021, 14, 231–249. [Google Scholar] [CrossRef]
- Wang, S.; Yan, Y.; Yan, M.; Zhao, X. Quantitative estimation of the impact of precipitation and human activities on runoff change of the Huangfuchuan River basin. J. Geogr. Sci. 2012, 22, 906–918. [Google Scholar]
- Chen, L. Study on the Response of Water Resources to Climate Change in the Yellow River Basin; Xi’an University of Technology: Xi’an, China, 2017. [Google Scholar]
- Ji, G.; Wu, L.; Wang, L.; Yan, D.; Lai, Z. Attribution Analysis of Seasonal Runoff in the Source Region of the Yellow River Using Seasonal Budyko Hypothesis. Land 2021, 10, 542. [Google Scholar] [CrossRef]
- Liang, P.F.; Xin, H.J.; Li, Z.S.; Nan, F.S.; Tang, B.; Zhang, W.B. Attribution of runoff changes in the Cangshe River based on the Budyko hypothesis. Desert China 2023, 43, 210–219. [Google Scholar]
- Huang, X.X.; Li, R.J.; Gan, Y.D.; Wu, Y.S. Attribution analysis of runoff change in Buha River basin based on Budyko’s hy-pothesis. South-North Water Divers. Water Sci. Technol. 2023, 21, 480–490. [Google Scholar]
- Zhai, M.F.; Gao, F.; Liu, K.; Jiang, F. Characterization and attribution of runoff changes in the source area of the Ulungu River based on the Budyko hypothesis. Hydropower Energy Sci. 2023, 41, 44–48. [Google Scholar]
- He, Y.G.; Xin, Z.B.; Yu, X.X.; Fan, D.X. Influence of dead fall on slope flow and sand production by side forest land under simulated rainfall conditions. J. Soil Water Conserv. 2017, 31, 27–32+38. [Google Scholar]
- Shao, W.W. Study on the Interaction Mechanism between Vegetation and Watershed Water Cycle in Non-Wetted Areas of China; Tsinghua University: Beijing, China, 2009. [Google Scholar]
- Shi, Z.Y.; Zhao, Q.; Wang, Y.Y.; Zhang, L.P. Spatial and temporal evolution of vegetation cover and its relationship with runoff in the Yi River basin. Res. Soil Water Conserv. 2023, 30, 54–61. [Google Scholar]
- Ji, G.; Huang, J.; Guo, Y.; Yan, D. Quantitatively Calculating the Contribution of Vegetation Variation to Runoff in the Middle Reaches of Yellow River Using an Adjusted Budyko Formula. Land 2022, 11, 535. [Google Scholar] [CrossRef]
- Zhang, J.; Zhang, C.; Bao, Z.; Li, M.; Wang, G.; Guan, X.; Liu, C. Analysis of the effects of vegetation changes on runoff in the Huang-Huai-Hai River basin under global change. Adv. Water Sci. 2021, 32, 813–823. (In Chinese) [Google Scholar]
- Ning, Y.; Yang, X.; Sun, W.; Mu, X.; Gao, P.; Zhao, G.; Song, X. The trend of runoff change and its attribution in the middle reaches of the Yellow River. J. Nat. Resour. 2021, 36, 256–269. (In Chinese) [Google Scholar] [CrossRef]
- Wang, Y.; Liu, Z.; Qian, B.; He, Z.; Ji, G. Quantitatively Computing the Influence of Vegetation Changes on Surface Discharge in the Middle-Upper Reaches of the Huaihe River, China. Forests 2022, 13, 2000. [Google Scholar] [CrossRef]
- Liu, Y.; Chen, W.; Li, L.; Huang, J.; Wang, X.; Guo, Y.; Ji, G. Assessing the contribution of vegetation variation to streamflow variation in the Lancang River Basin, China. Front. Ecol. Evol. 2023, 10, 8055. [Google Scholar] [CrossRef]
- Gao, H.; Li, Q.; Xiong, G.; Li, B.; Zhang, J.; Meng, Q. Quantitative assessment of hydrological response to vegetation change in the upper reaches of Luanhe River with the modified Budyko framework. Front. Ecol. Evol. 2023, 11, 1178231. [Google Scholar] [CrossRef]
- Zhao, J.F.; Zhai, J.Q.; Liu, Y.C.; Zhao, Y.; Ma, M.Y.; Gu, B.; Bai, L.F.; Cao, J.P. Characteristics of spatial and temporal variations of runoff coefficient and influencing factors in Luan River Basin. Hydropower Energy Sci. 2022, 40, 26–29+34. [Google Scholar]
- Sun, A.H. Study on the Impact of Climate Change on the Adaptive Scheduling of Water Resources in Luan River; Tianjin University: Tianjin, China, 2021. [Google Scholar]
- Sun, C.W. Study on the Influence of Slope Ridge and Furrow Layout on the Flow Production on the Upper Slope of Luan River; Hebei University of Engineering: Handan, China, 2020. [Google Scholar]
- Zhang, L.L. Response of surface runoff change to land use/cover in Luan River Basin. China Water Transp. 2020, 20, 122–123. [Google Scholar]
- Fu, B.C. Study on the analysis of runoff changes in the Luan River Basin in the last 59 years. Water Resour. Sci. Econ. 2019, 25, 48–55. [Google Scholar]
- Zhou, J.Y.; Zhang, X.; Xu, Y.; Geng, X.J.; Song, X.H. Identification of attribution of runoff changes in the upper Luan River basin based on Budyko’s hypothesis. South-North Water Divers. Water Sci. Technol. 2020, 18, 15–30+47. [Google Scholar]
- Wu, J.Z. Research on the Impact of Land Use Change on Hydrological and Ecological Processes in Luan River Basin; Tianjin University: Tianjin, China, 2018. [Google Scholar]
- Shi, C.; Yuan, S.B.; Shi, C.Q.; Zhao, T.N. Impacts of climate change and human activities on runoff in the Luan River Basin. J. Soil Water Conserv. 2018, 32, 264–269. [Google Scholar]
- Chen, H.; Wei, Y.H.; Wang, Y.; Zhang, Y.Q.; Zuo, T.; Xing, W.H. Construction and application of VIC distributed hydrological model based on ECMWF model coupling in Luan River Basin. Arid Meteorol. 2017, 35, 776–783. [Google Scholar]
- Zhang, L.P.; Li, L.C.; Xia, J.; Wang, R.C. Quantitative impact analysis of climate fluctuations and human activities on runoff changes in the Luan River Basin. J. Nat. Resour. 2015, 30, 664–672. [Google Scholar]
- Liu, Y. An Analysis of the hydrology, geology and economic situation of Luan River Basin. J. Hebei Norm. Univ. Natl. 2012, 32, 24–26. (In Chinese) [Google Scholar]
- Dong, J.; Ye, Y.; Gu, J.; Cao, Y.; Duan, H.; Zhao, H.; Jiang, Y. Analysis of Multitemporal Characteristics of Remote Sensing Precipitation Descending in the Luanhe River Basin. J. Hydroelectr. Power 2022, 41, 77–91. (In Chinese) [Google Scholar]
- Fu, X.; Dong, Z.; Liu, C.; Shan, C.; Fang, Q.; Liu, Q. Analysis of Runoff Evolution and Driving Forces in the Luanhe River Basin. Hydroelectr. Energy Sci. 2014, 32, 19–24. [Google Scholar]
- Fu, J. Research on the Impact of Environmental Change on Regional Water Cycle Elements and Water Resources Evolution; Tianjin University: Tianjin, China, 2016. [Google Scholar]
- Zhang, X.; Xu, Y.; Hao, F.; Li, C.; Wang, X. Hydrological Components Variability under the Impact of Climate Change in a Semi-Arid River Basin. Water 2019, 11, 1122. [Google Scholar] [CrossRef]
- Sun, X.L. Study on Runoff Situation in Luan River Basin Coupled with CMIP5 Climate Model and VIC Hydrological Model; Hebei University of Engineering: Handan, China, 2022. [Google Scholar]
- Li, J.Z.; Feng, P. Trend analysis of runoff characteristics in the Luan River Basin. Arid. Zone Resour. Environ. 2009, 23, 79–85. [Google Scholar]
- Zeng, S.D.; Xia, J.; Du, H.; Zhang, L.P.; Chen, X.D.; Wang, R.C.; Aditya, S. Impacts of climate change, land use/cover change, and elevated CO2 concentration on runoff in the Luan River Basin. Adv. Water Sci. 2014, 25, 10–20. [Google Scholar]
- Mann, H.B. Nonparametric tests against trend. Econometrica 1945, 13, 246–259. [Google Scholar] [CrossRef]
- Kendall, M.G. Rank Correlation Methods. Br. J. Psychol. 1990, 25, 86–91. [Google Scholar] [CrossRef]
- Shi, H.L.; Hu, C.H.; Wang, Y.G.; Tian, Q.Q. Water and sediment change trend and its genesis analysis in Huaihe River Basin. J. Hydraul. Eng. 2012, 43, 9. [Google Scholar]
- Tang, G.; Bao, Y. Study on the sudden change points of water and sediment series based on ordered clustering analysis and Mann Kendall method. Jianghuai Water Conserv. Technol. 2015, 6, 35–37. [Google Scholar]
- Yang, H.; Yang, D.; Lei, Z.; Sun, F. New analytical derivation of the mean annual water-energy balance equation. Water Resour. Res. 2008, 44, 893–897. [Google Scholar] [CrossRef]
- Li, H.; Shi, C.; Zhang, Y.; Ning, T.; Sun, P.; Liu, X.; Ma, X.; Liu, W.; Collins, A.L. Using the Budyko hypothesis for detecting and attributing changes in runoff to climate and vegetation change in the soft sandstone area of the middle Yellow River basin, China. Sci. Total. Environ. 2019, 703, 135588. [Google Scholar] [CrossRef]
- Zhang, X.; Dong, Q.; Cheng, L.; Xia, J. A Budyko-based framework for quantifying the impacts of aridity index and other factors on annual runoff. J. Hydrol. 2019, 579, 124224. [Google Scholar] [CrossRef]
- Ji, G.; Yue, S.; Zhang, J.; Huang, J.; Guo, Y.; Chen, W. Assessing the Impact of Vegetation Variation, Climate and Human Factors on the Streamflow Variation of Yarlung Zangbo River with the Corrected Budyko Equation. Forests 2023, 14, 1312. [Google Scholar] [CrossRef]
- Li, D.; Pan, M.; Cong, Z.; Zhang, L.; Wood, E. Vegetation control on water and energy balance within the Budyko framework. Water Resour. Res. 2013, 49, 969–976. [Google Scholar] [CrossRef]
- Fu, C.; Wang, Q. Definition and detection method of Abrupt climate change. Atmos. Sci. 1992, 4, 482–493. [Google Scholar]
- Li, J.; Lei, Y.; Liu, X.; Mao, H.; Chen, F.; Engel, B. Quantifying the contribution of climate- and human-induced runoff decrease in the Luanhe river basin, China. J. Water Clim. Chang. 2016, 7, 430–442. [Google Scholar] [CrossRef]
- Kilicarslan, B.M.; Yucel, I.; Pilatin, H.; Duzenli, E.; Yilmaz, M.T. Improving WRF-Hydro runoff simulations of heavy floods through the sea surface temperature fields with higher spatiotemporal resolution. Hydrol. Process. 2021, 35, e14338. [Google Scholar] [CrossRef]
- Colleoni, F.; Cherchi, A.; Masina, S.; Brierley, C.M. Impact of global SST gradients on the Mediterranean runoff changes across the Plio-Pleistocene transition. Paleoceanography 2015, 30, 751–767. [Google Scholar] [CrossRef]
- Chen, W.; Wang, L.; Xue, Y.; Sun, S. Variabilities of the spring river runoff system in East China and their relations to precip-itation and sea surface temperature. Int. J. Climatol. 2009, 29, 1381–1394. [Google Scholar] [CrossRef]
- Xue, Y.; Ji, J.; Sun, S.; Wu, G.; Lau, K.-M.; Poccard, I.; Kang, H.-S.; Zhang, R.; Schaake, J.C.; Zhang, J.Y.; et al. Multiscale Variability of the River Runoff System in China and Its Long-Term Link to Precipitation and Sea Surface Temperature. J. Hydrometeorol. 2005, 6, 550–570. [Google Scholar] [CrossRef]
- Kim, W.; Yeh, S.-W.; Kim, J.-H.; Kug, J.-S.; Kwon, M. The unique 2009-2010 El Niño event: A fast phase transition of warm pool El Niño to La Niña. Geophys. Res. Lett. 2011, 38. [Google Scholar] [CrossRef]
- Zhou, J.; Lv, S.; Wu, C.; Zhang, Y.; Zhang, J. Analysis of Hydrological Processes in the Luanhe Mountain Basin Based on Trend Testing and Empirical Orthogonality. J. Northwest Univ. 2023, 53, 33–43. (In Chinese) [Google Scholar]
- Zhang, J.Y.; Zhang, C.F.; Bao, Z.X.; Li, M.; Wang, G.Q.; Guan, X.X.; Liu, C.S. Influence of vegetation cover change on runoff in the Huanghuaihai Basin. Adv. Water Sci. 2021, 32, 813–823. [Google Scholar]
- Du, Y.; Li, J.Z.; Niu, K.J.; Feng, P.; Hu, Q.F.; Zhang, Y.C. Vegetation changes and effects on natural runoff in the Yongding River mountainous area from 1982 to 2015. J. Water Resour. 2021, 52, 1309–1323. [Google Scholar]
- Zhi, T.; Zhang, H.B.; Xin, C.; Wei, X.C.; Dang, C.H. Changes in vegetation cover and its effect on runoff in the Baliu River basin. Water Resour. Hydropower Technol. 2021, 52, 40–52. [Google Scholar]
- Li, X.; Cui, S.; Guo, C.; Hu, J.; Wang, J.; Zhang, L. The driving response relationship between vegetation cover changes and regional runoff in the Songhuaba Basin. Water Resour. Plan. Des. 2023, 1, 47–50+63. [Google Scholar]
- Yan, W.H. Study on the Effect of Vegetation Restoration on Runoff in Karst Watershed; Guizhou Normal University: Guiyang, China, 2022. (In Chinese) [Google Scholar]
Disclaimer/Publisher’s Note: The statements, opinions and data contained in all publications are solely those of the individual author(s) and contributor(s) and not of MDPI and/or the editor(s). MDPI and/or the editor(s) disclaim responsibility for any injury to people or property resulting from any ideas, methods, instructions or products referred to in the content. |
© 2023 by the authors. Licensee MDPI, Basel, Switzerland. This article is an open access article distributed under the terms and conditions of the Creative Commons Attribution (CC BY) license (https://creativecommons.org/licenses/by/4.0/).