Article

The Impact of Wildfires on Soil CO2 Emission in Middle Taiga Forests in Central Siberia

by
Anastasia Makhnykina
1,2,*,
Alexey Panov
1 and
Anatoly Prokushkin
1,2,*
1
Sukachev Institute of Forest SB RAS, Krasnoyarsk 660036, Russia
2
Laboratory of Ecosystem Biogeochemistry, Siberian Federal University, Krasnoyarsk 660041, Russia
*
Authors to whom correspondence should be addressed.
Land 2023, 12(8), 1544; https://doi.org/10.3390/land12081544
Submission received: 15 June 2023 / Revised: 26 July 2023 / Accepted: 2 August 2023 / Published: 4 August 2023
(This article belongs to the Special Issue Monitoring GHG Emissions from Land Use Change and Disturbances)

Abstract

:
Boreal forest ecosystems are regions vulnerable to climate change. Such areas act as the main atmospheric carbon sinks in the world. Wildfires are among the drivers of ecosystem modification and functioning. Boreal wildfires emit an annual average of about 10% of global fire emissions. Taking into account recent climate warming and increases in the frequency of wildfires, boreal forests might switch their functional role from carbon sink to an additional source of atmospheric carbon. Soil respiration is the second largest component of the global carbon cycle and is highly sensitive to disturbance factors, including wildfires. To study the effect of wildfires on soil CO2 emission rates, the fire chronosequence was investigated. During the first few years following the fire, the soil CO2 emission rates were lower compared with the usual levels. It was found that 23 years after a fire, the site demonstrated transition behavior in soil emission rates between disturbed and completely recovered areas. The emission rates at the earliest successional stages are mainly controlled by soil moisture during the summer period. For the other successional stages, soil temperature had a huge impact on soil emission.

1. Introduction

The boreal zone covers around 35% of the world’s forested areas and is mainly located in Russia, Canada, Alaska and Northern Europe [1,2,3]. This zone represents the ecosystems most vulnerable to strong external factors such as climate change or anthropogenic impacts, which contain more than 60% of global forest soil carbon pools [4]; even small changes in external conditions may significantly change the carbon balance proportions, such as emission and assimilation fluxes, carbon pools, etc. [5,6].
In 2020, approximately one-third of annual anthropogenic CO2 emissions from the atmosphere was removed by global forests through increasing forest carbon (C) stock [7]. The global C stock of forests is evaluated at 662 Gt C, and 45% is concentrated in the soil organic matter (SOM) [8].
Generally, boreal forest soils of the Northern Hemisphere account for most of the net forest carbon (C) sinks in the world, releasing it slowly from decomposing organic matter [9]. However, a projected increase in forest disturbances (e.g., wildfires, storms, insect outbreaks) may significantly decrease C stocks in the forest ecosystems.
Natural disturbances have complex effects on forest ecosystems. They might increase biodiversity indicators, such as species richness [10], but at the same time put ecosystem functioning at risk, causing a reduction in a forest’s carbon storage [11]. At the present time, we observe changes in fire regimes, insect outbreaks, windstorms, droughts and other disturbances which are increasing in frequency and severity, leading to violations in the biological equilibrium in many regions around the world [12].
Wildfires are the main cause of transformation in ecosystems, contributing to the development and renovation of boreal forest structure and function [12]. Indeed, the ecological impacts of fire on vegetation and soils influences post-fire stand structure and species composition [13,14,15].
The mean time interval between the fires in boreal regions varies between 53 years in Siberia and 180 years in the northern part of North America [16]. Consequently, wildfires regulate the regional carbon balance of all these territories [5,17]. During the fire, large amounts of C are released to the atmosphere through the combustion of plant biomass and SOM.
Boreal wildfires released an annual amount of 182 Tg C, which comprises 9.1% of global fire emissions [18]. Forest fires strongly influence soil C dynamics [19,20,21]. Immediately after the fire, greenhouse gases (GHGs), including CO2, are rapidly emitted into the atmosphere [21,22].It has also been found that soil GHG fluxes that originate from the decomposition and respiration processes are affected by soil organic matter, soil microbial community and fine roots biomass; both soil temperature and water content continue to change for a long period of time after the fire [21,23,24,25].
The time of recovery of soil emission rates after wildfires is dependent on fire severity [26], geographical location [27] and environmental conditions. Usually, recovery takes 10 years after low-severity fires and up to 30 years after high-severity fires [28].
It is expected that boreal forests will be greatly influenced by climate change, possibly increasing natural disturbances even further in terms of occurrence and severity [29]. The newly released IPCC report reiterates that the global surface temperature rose by 1.09 °C (0.95 °C to 1.20 °C) from 2011 to 2020 when compared with pre-industrial periods [30], with greater levels of warming recorded in the Northern Extratropics [31]. Wildfires are projected to increase in frequency in both the boreal and Arctic zones as part of a continuing global warming trend [32].
Despite the currently growing number of studies analyzing the effects of fire on soil CO2 emissions in the boreal regions, there is no consensus on the progress of soil CO2 emissions after fire and responses to the main drivers at different successional stages [33]. In order to provide a better understanding of the effects of fire on boreal forests, we test hypotheses that soil CO2 emission levels depend on the length of time after the fire, and the recovery period takes around 30 years; soil temperature at the recently burned sites will be higher than at the sites with later fire instances; soil moisture will demonstrate opposing behavior and will be lower at the recently burned sites. We aimed to investigate the chronosequence of burned areas in the middle taiga forests in Central Siberia; sites 1, 14, 23, 46 and 121 years since the last fire with comparable ecological conditions and similar levels of fire severity were chosen for testing the impact of fire on soil CO2 emission and their recovery after the fire. Our main objectives were: (1) to estimate fire-induced changes in soil emission rates and in physical soil properties in each successional stage, (2) to quantify the relationship between soil CO2 emission and soil temperature and moisture for different successional stages, and (3) to explore soil organic matter recovery rates and their relation to soil CO2 fluxes along the fire succession.

2. Materials and Methods

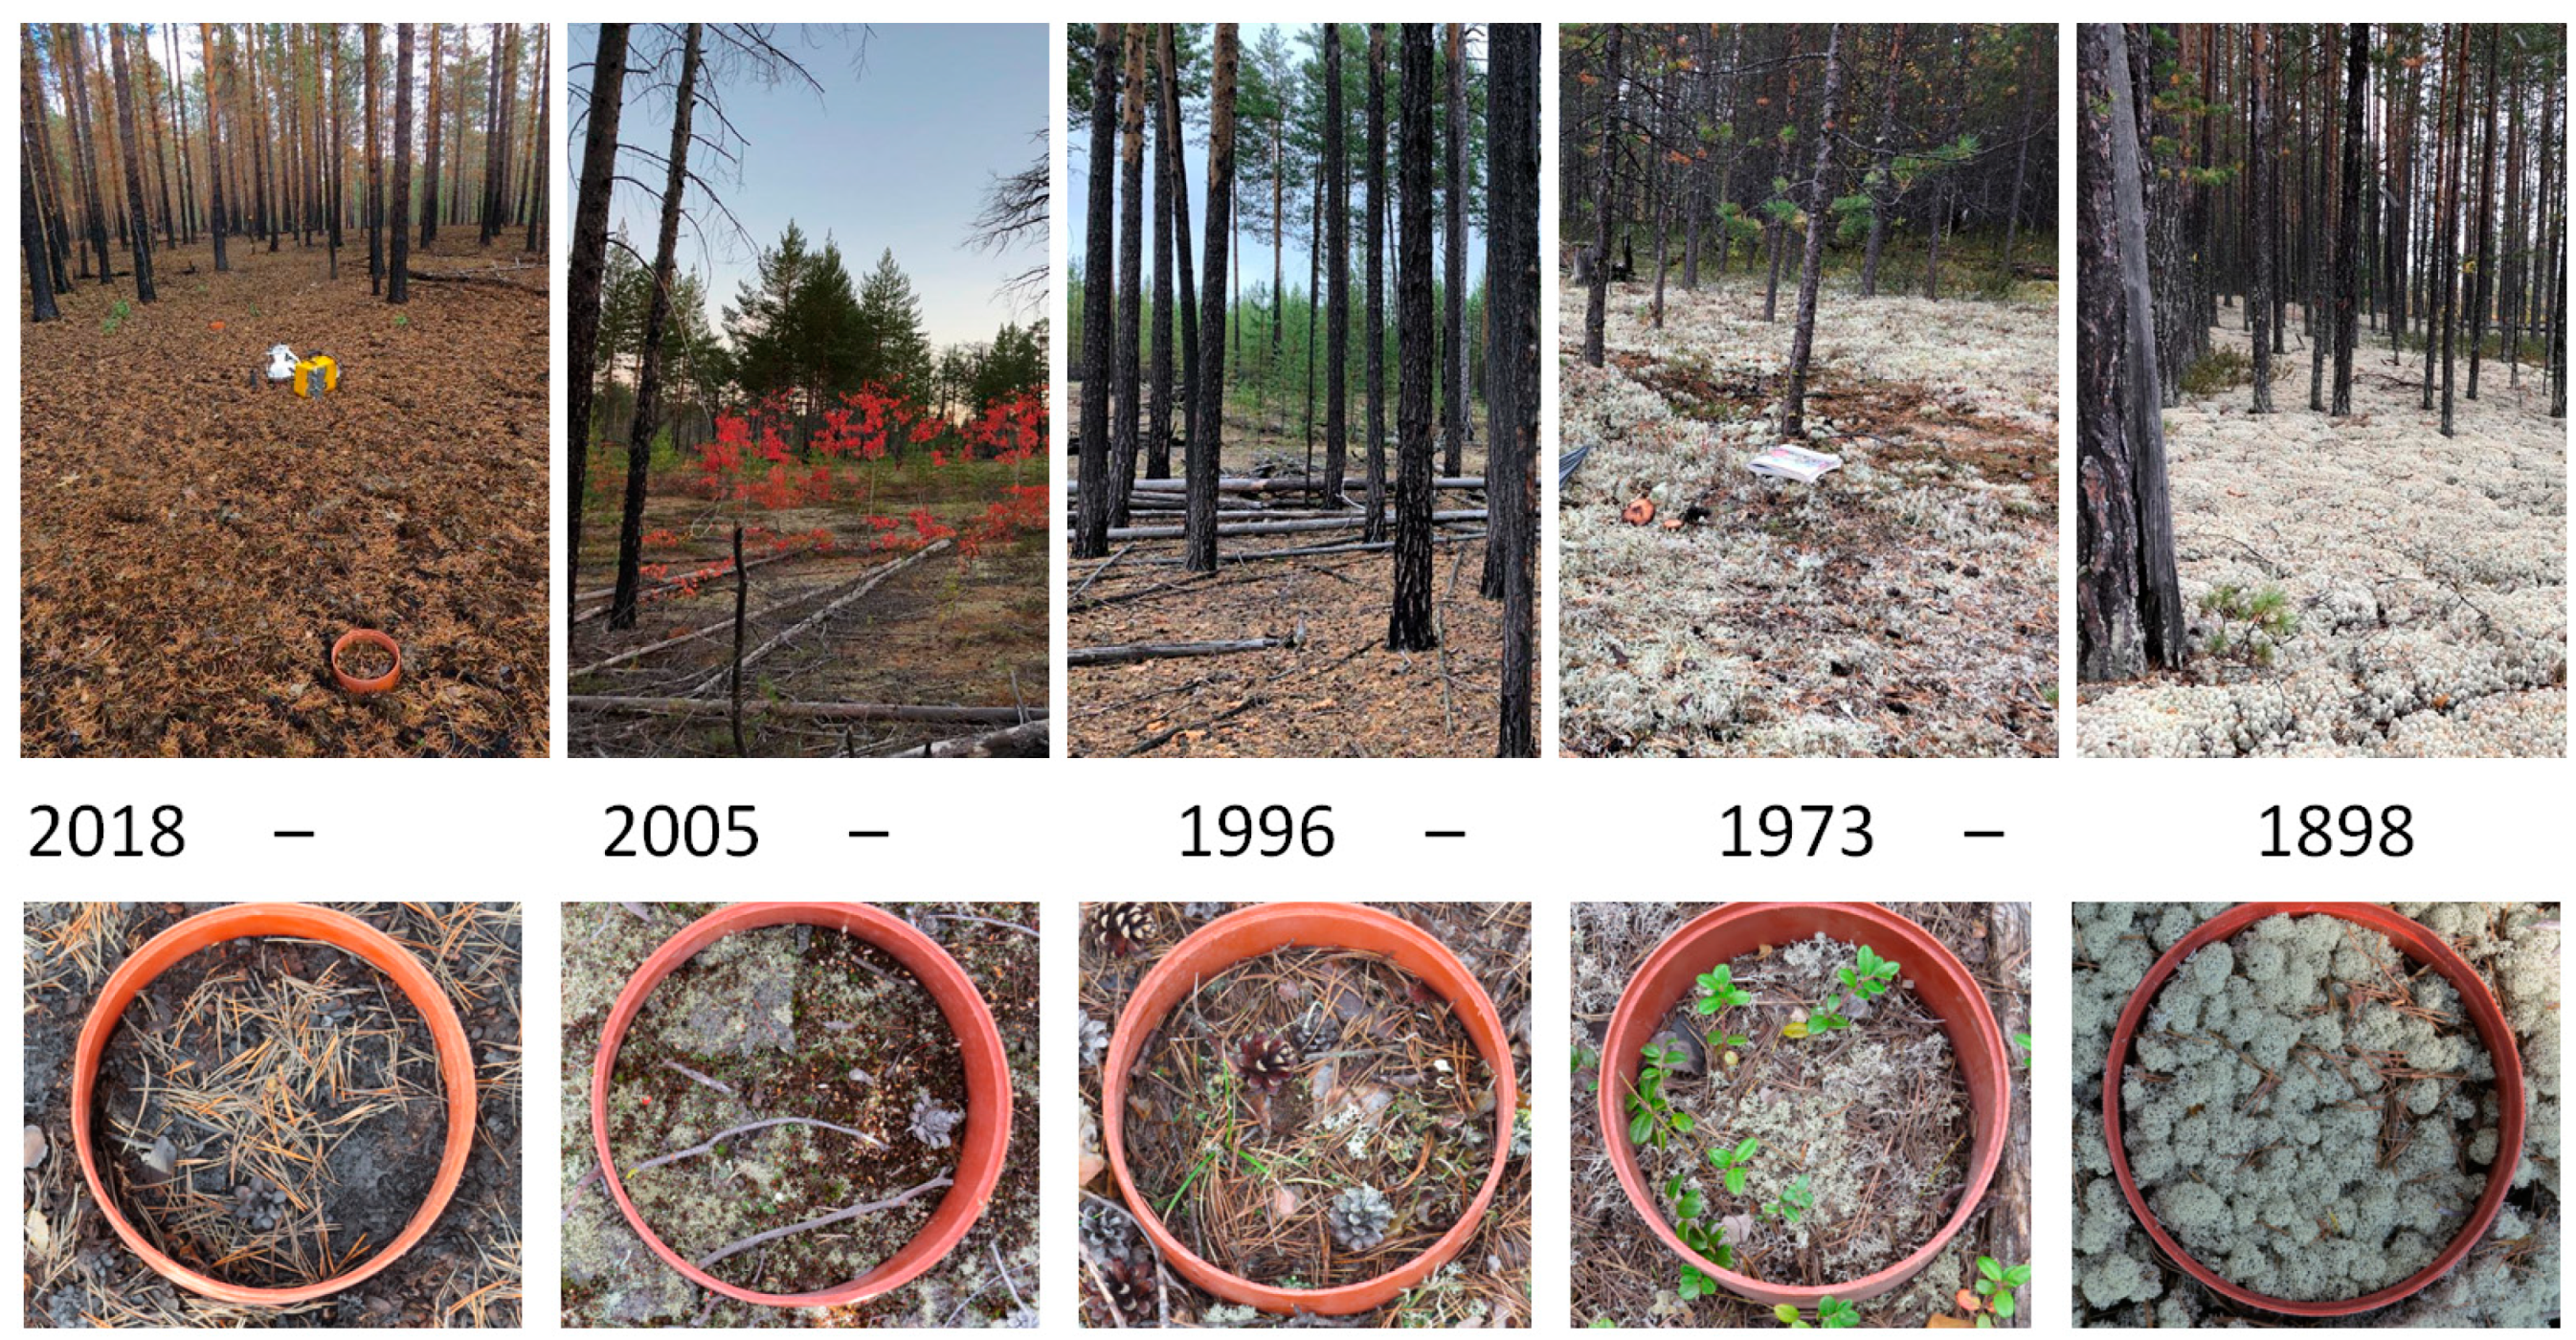
2.1. Study Sites Description

Our research is located within the middle taiga subzone of Central Siberia (60°47′ N, 89°21′ E). In the summer of 2019, a fire chronosequence was established in pine forest areas which had five different periods of time since the last fire (Figure 1): 1 year ago (2018), 14 years ago (2005), 23 years ago (1996), 46 years ago (1973) and an area which had experienced no fires for 121 years (1898). Four of the sites are mainly located close to the ZOTTO station at distances between 1 and 5 km, and one site (1973) is around 30 km from the research station.
The ecosystem where our study areas were located is the middle taiga subzone dominated by evergreen coniferous trees—Pinus sylvestris L. The ground vegetation consists mainly of lichens—Cladonia stellaris, Cladonia rangiferina, mosses—Polytrichum commune, Cetraria islandica, Pleurozium schreberi and dwarf shrubs Vaccinium vitis-idaea, Arctostaphylos uva-ursi (Figure 2, Table 1). The ground cover at the site 1 year after fire presented with burned vegetation.
Soils of the study region have been formed on glaciofluvial deposits and feature the predominance of sand in the upper part of the profile. Clayey horizons (lenses) are usually noted at depths over 1 m. Soils cover are illuvial–ferrous podzols with depths of 3–7 cm in the organic horizon. According to the World Reference Base (WRB) soil classification system, the soils of the study sites are Podzols.

2.2. Soil Measurements

Soil CO2 emission was measured from June to September during the summer season of 2019. This period of time was chosen due to the lack of snow, when biogeochemical processes were active, including soil CO2 emission. For the whole season, we carried out measurements 5 times at each site. Before the measurements were started, the polyvinylchloride (PVC) rings 20 cm in diameter were installed in each study site 1–1.5 m from each other: five rings were installed in each site. CO2 fluxes were measured using an LI 8100A infrared gas analyzer (Li-cor Biogeosciences Inc., Lincoln, NE, USA) during the daytime, during the period from 11:00 to 16:00 using 8100-103 Survey chamber.
Measurements were carried out in three repetitions in each collar, on the basis of which the average value was further calculated. The measurement time was 2 min, with a 30-s interval between measurements. As a result, we obtained 15 emission measurements during each sampling day.
During each CO2 flux measurement, soil temperature was measured at depths of 5, 10, and 15 cm using a Soil Temperature Probe Type E (Omega, GA, USA) and soil water content (SWC) was measured at a depth of 5 cm using a Theta Probe Model ML soil moisture sensor (Delta T Devices Ltd., Cambridge, UK).
The sampling of ground cover was carried out from 7 plots of 10 cm2 from each plot with subsequent processing in the laboratory. Soil sampling was carried out for the organic horizon (O-horizon) since the podzol soil type is characterized by low reserves of organic matter, which are mainly concentrated in the near-surface layer. Samples were processed and analyzed according to standard methods [34].

3. Results

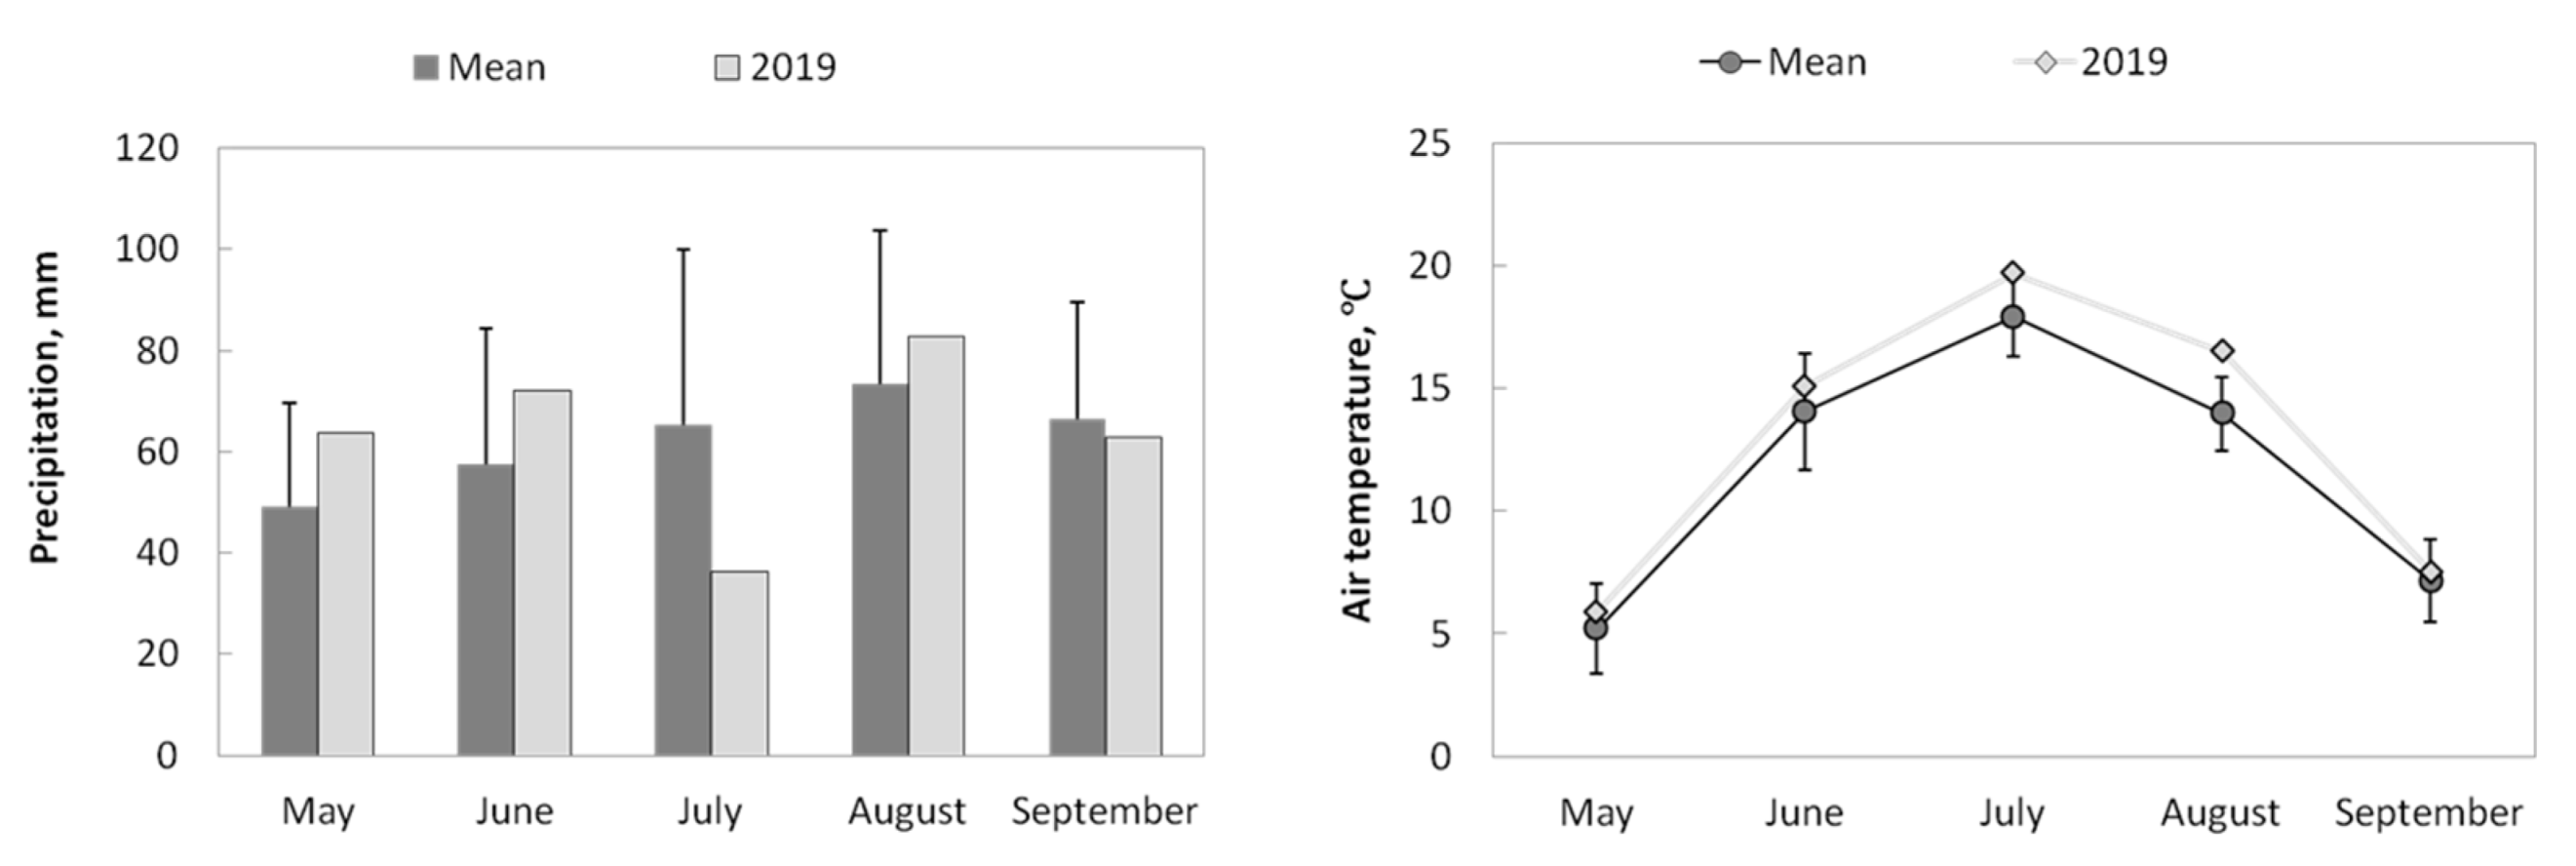
3.1. Seasonal Meteorological Characteristics

During 2019, the total precipitation was 318 mm (from May to September), and the mean air temperature was +12.9 °C. If we compare the sum of monthly precipitation (Figure 3) of 2019 with long-term mean values, we observe quite close numbers. The only exception was in July, when the sum of precipitation was 44% smaller than the long-term sum of precipitation.
The air temperature of the season was higher than mean long-term values by 1.3 °C. The hottest month was July, when the mean temperature was +19.7 °C (source: http://www.meteo.ru, accessed on 15 May 2023, Bor meteorological station). However, the biggest difference in the mean long-term temperature noticed in August was that mean air temperature in August was 20% higher compared with the long-term mean value. These meteorological conditions allow us to exclude extremes from the weather perspective, and the main differences in fluxes and soil properties will be related to the successional stage after fire.

3.2. Fire Impact on the Soil CO2 Emission and Environmental Factors

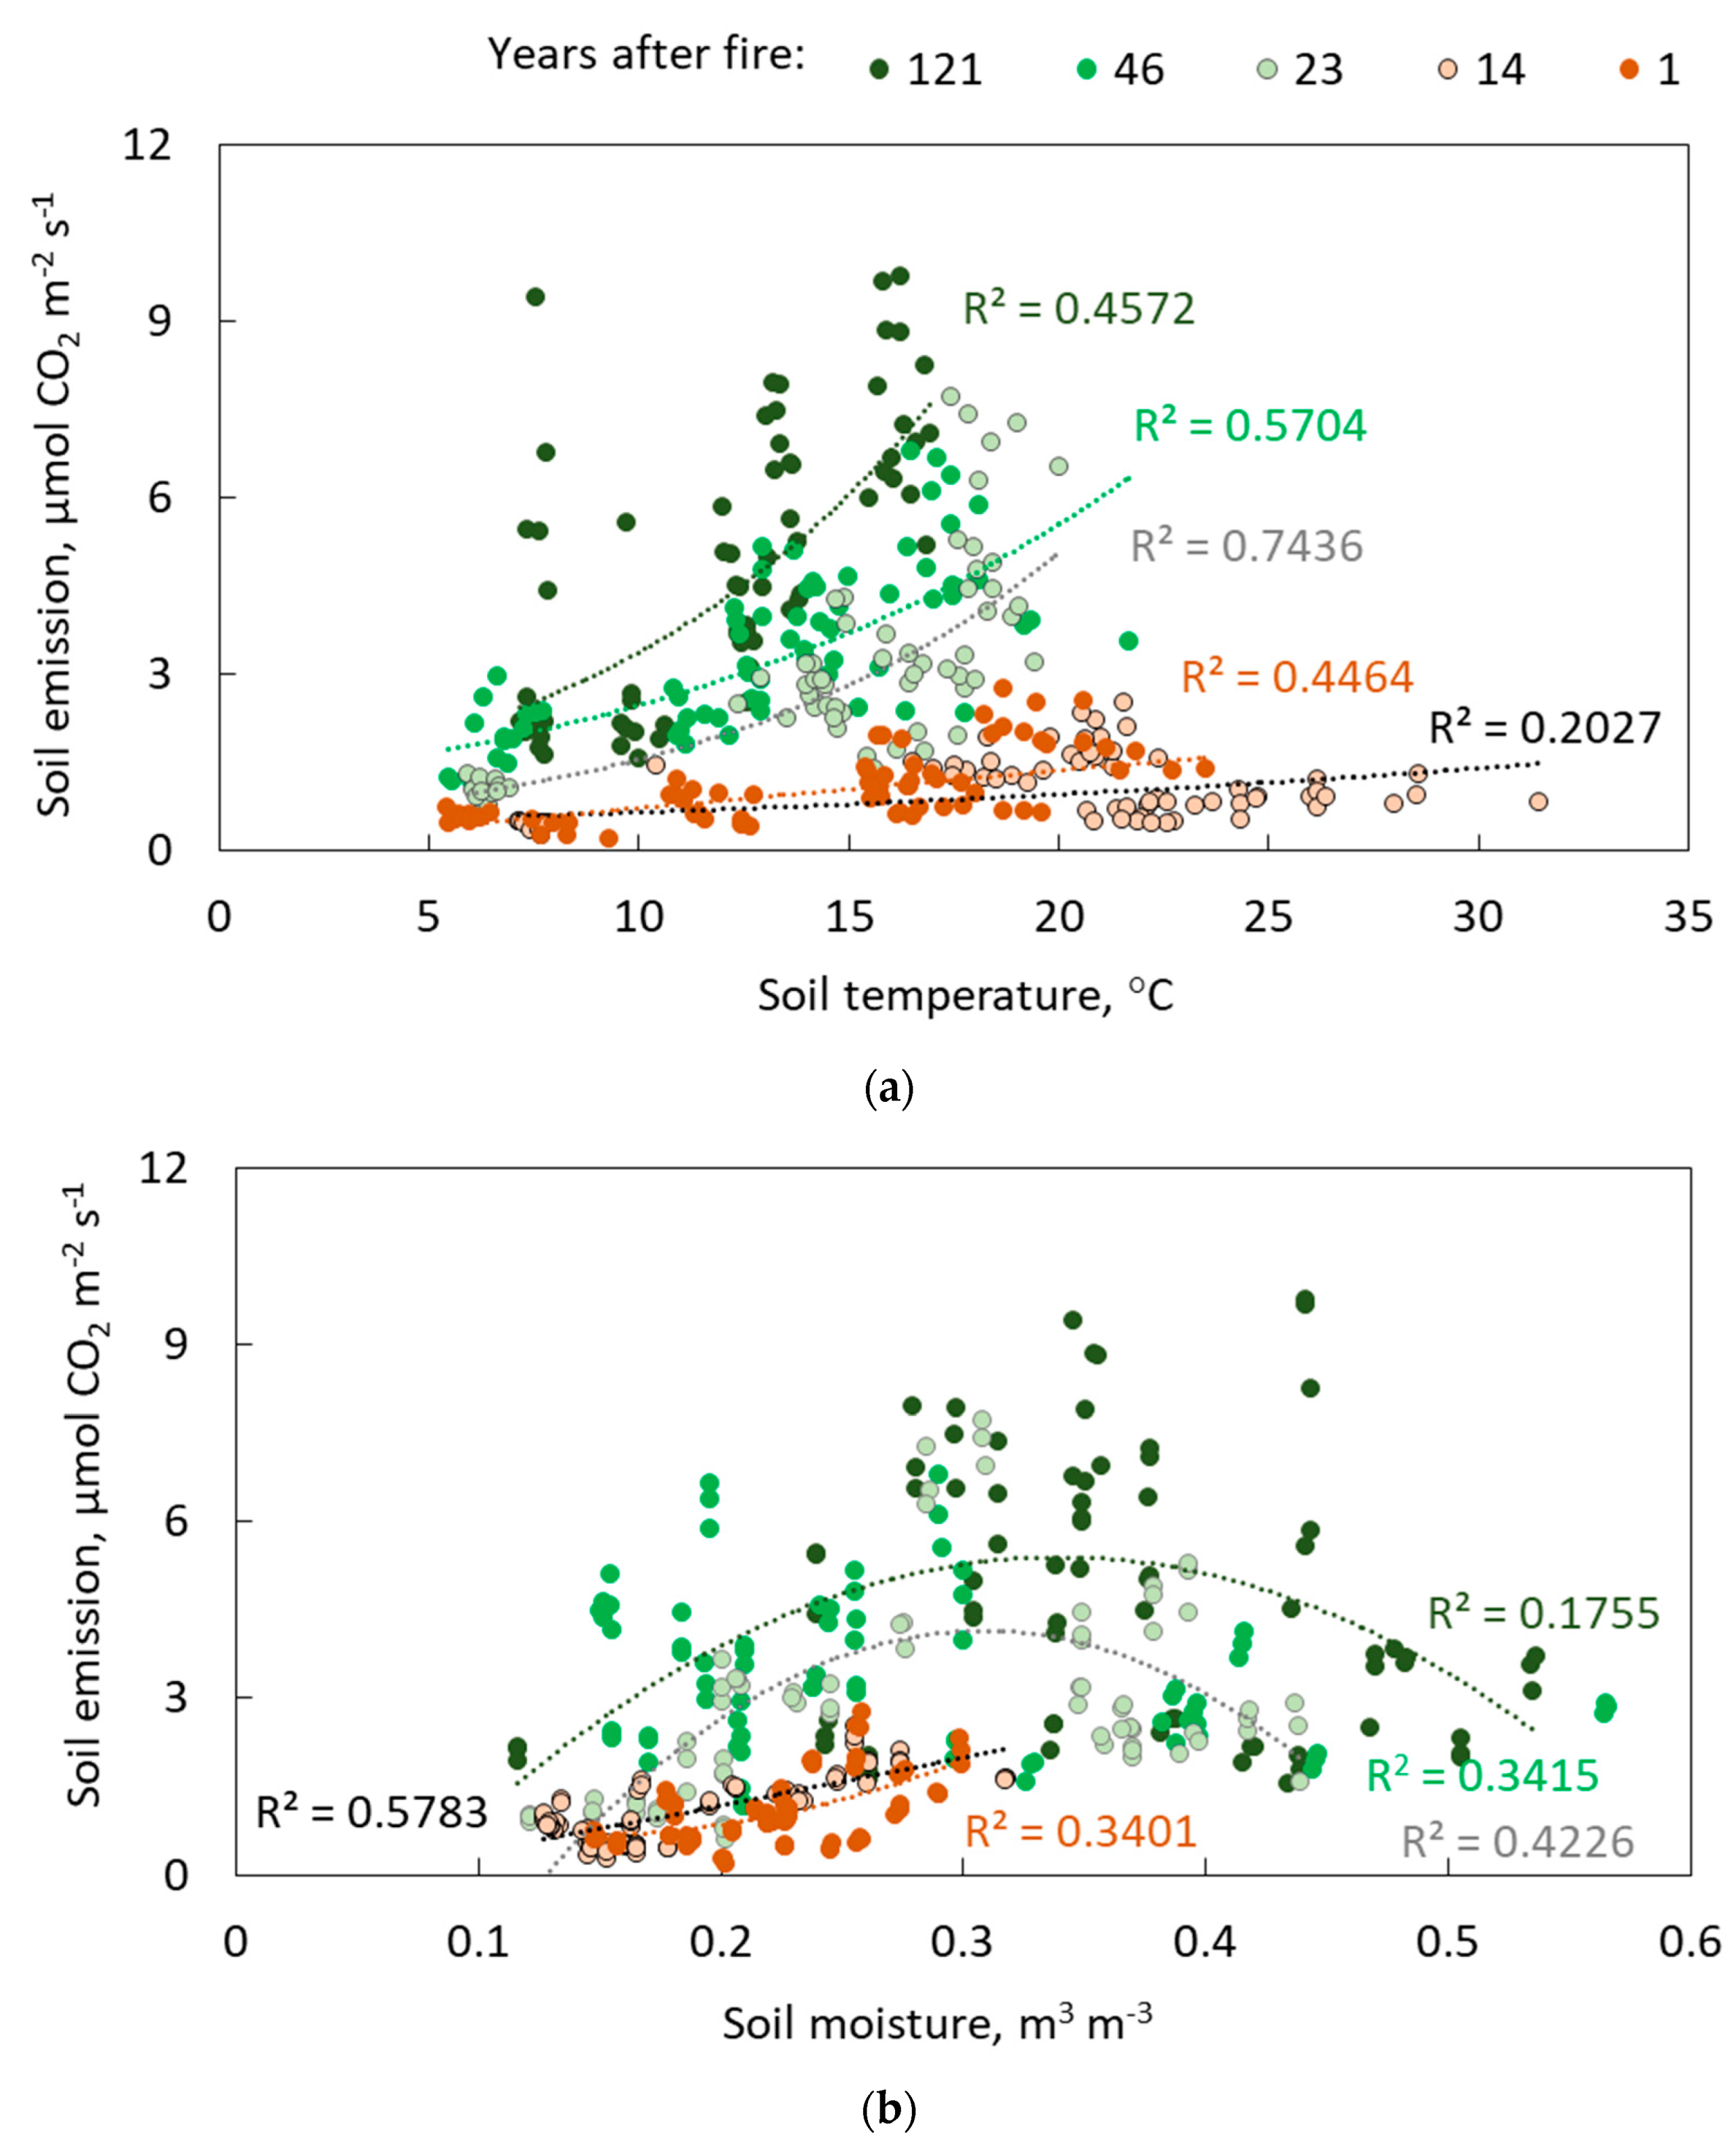
3.2.1. Soil Temperature and Moisture

Soil physical properties such as soil temperature and soil moisture represent the main consequences of the wildfire [35,36] and their values may suggest first estimates of recovery process for specific ecosystem. In this case, we monitored the lichen pine forests at various successional stages at intervals of 1 to 121 years since the last fire.
If we look at our succession stages (Figure 4), the highest soil temperature was detected at the site 14 years after fire. The coolest site for all depth was 121 years after fire with a well-developed lichen ground cover.
The difference in soil temperature 1 year after fire between three depths is 1 °C. The mean temperature was 14.4 ± 4.9 °C. The second succession stage 14 years after fire distinguishes higher temperature gradient with the depth. The soil temperature was around 20 °C at the 5 cm depth, 19.1 °C at 10 cm depth, and 18 °C at the greatest depth. Interestingly, that same site 14 years after fire demonstrates a higher temperature gradient than the site 1 year after fire.
At the site 23 years after the fire, the impact is still pronounced, and the temperature gradient is more than 1 °C with a depth during the season. Also, we found similarities in soil temperature values with the site 1 year after fire.
Soil temperature 46 years after fire characterized the most gradual temperature gradient with a depth around 0.2–0.4 °C. The mean soil temperature was around 13.2 °C at the 5 cm depth, 12.8 °C at 10 cm depth and 12.7 °C at 15 cm depth.
For site 121 years after fire, the soil temperature at the first depth is 12.3 ± 3.3 °C, at the second depth is 12 ± 3.2 °C and at the third depth is 11.8 ± 2.9 °C. Additionally, the mean temperature gradient as presented here equals just 0.5 °C.
Soil moisture is one of the main factors regulating all biogeochemical cycles in the boreal zone [37,38]. In our study sites (Figure 5) the lowest soil moisture was at sites 1 and 14 years after fire.
The site at 23 years following fire marked a transition to recovery within the fire-impacted area. The site with the longest time since fire showed the highest soil moisture values during the measurement period. The maximum soil moisture values were observed in the middle of June and the minimum values were observed in the middle of September.

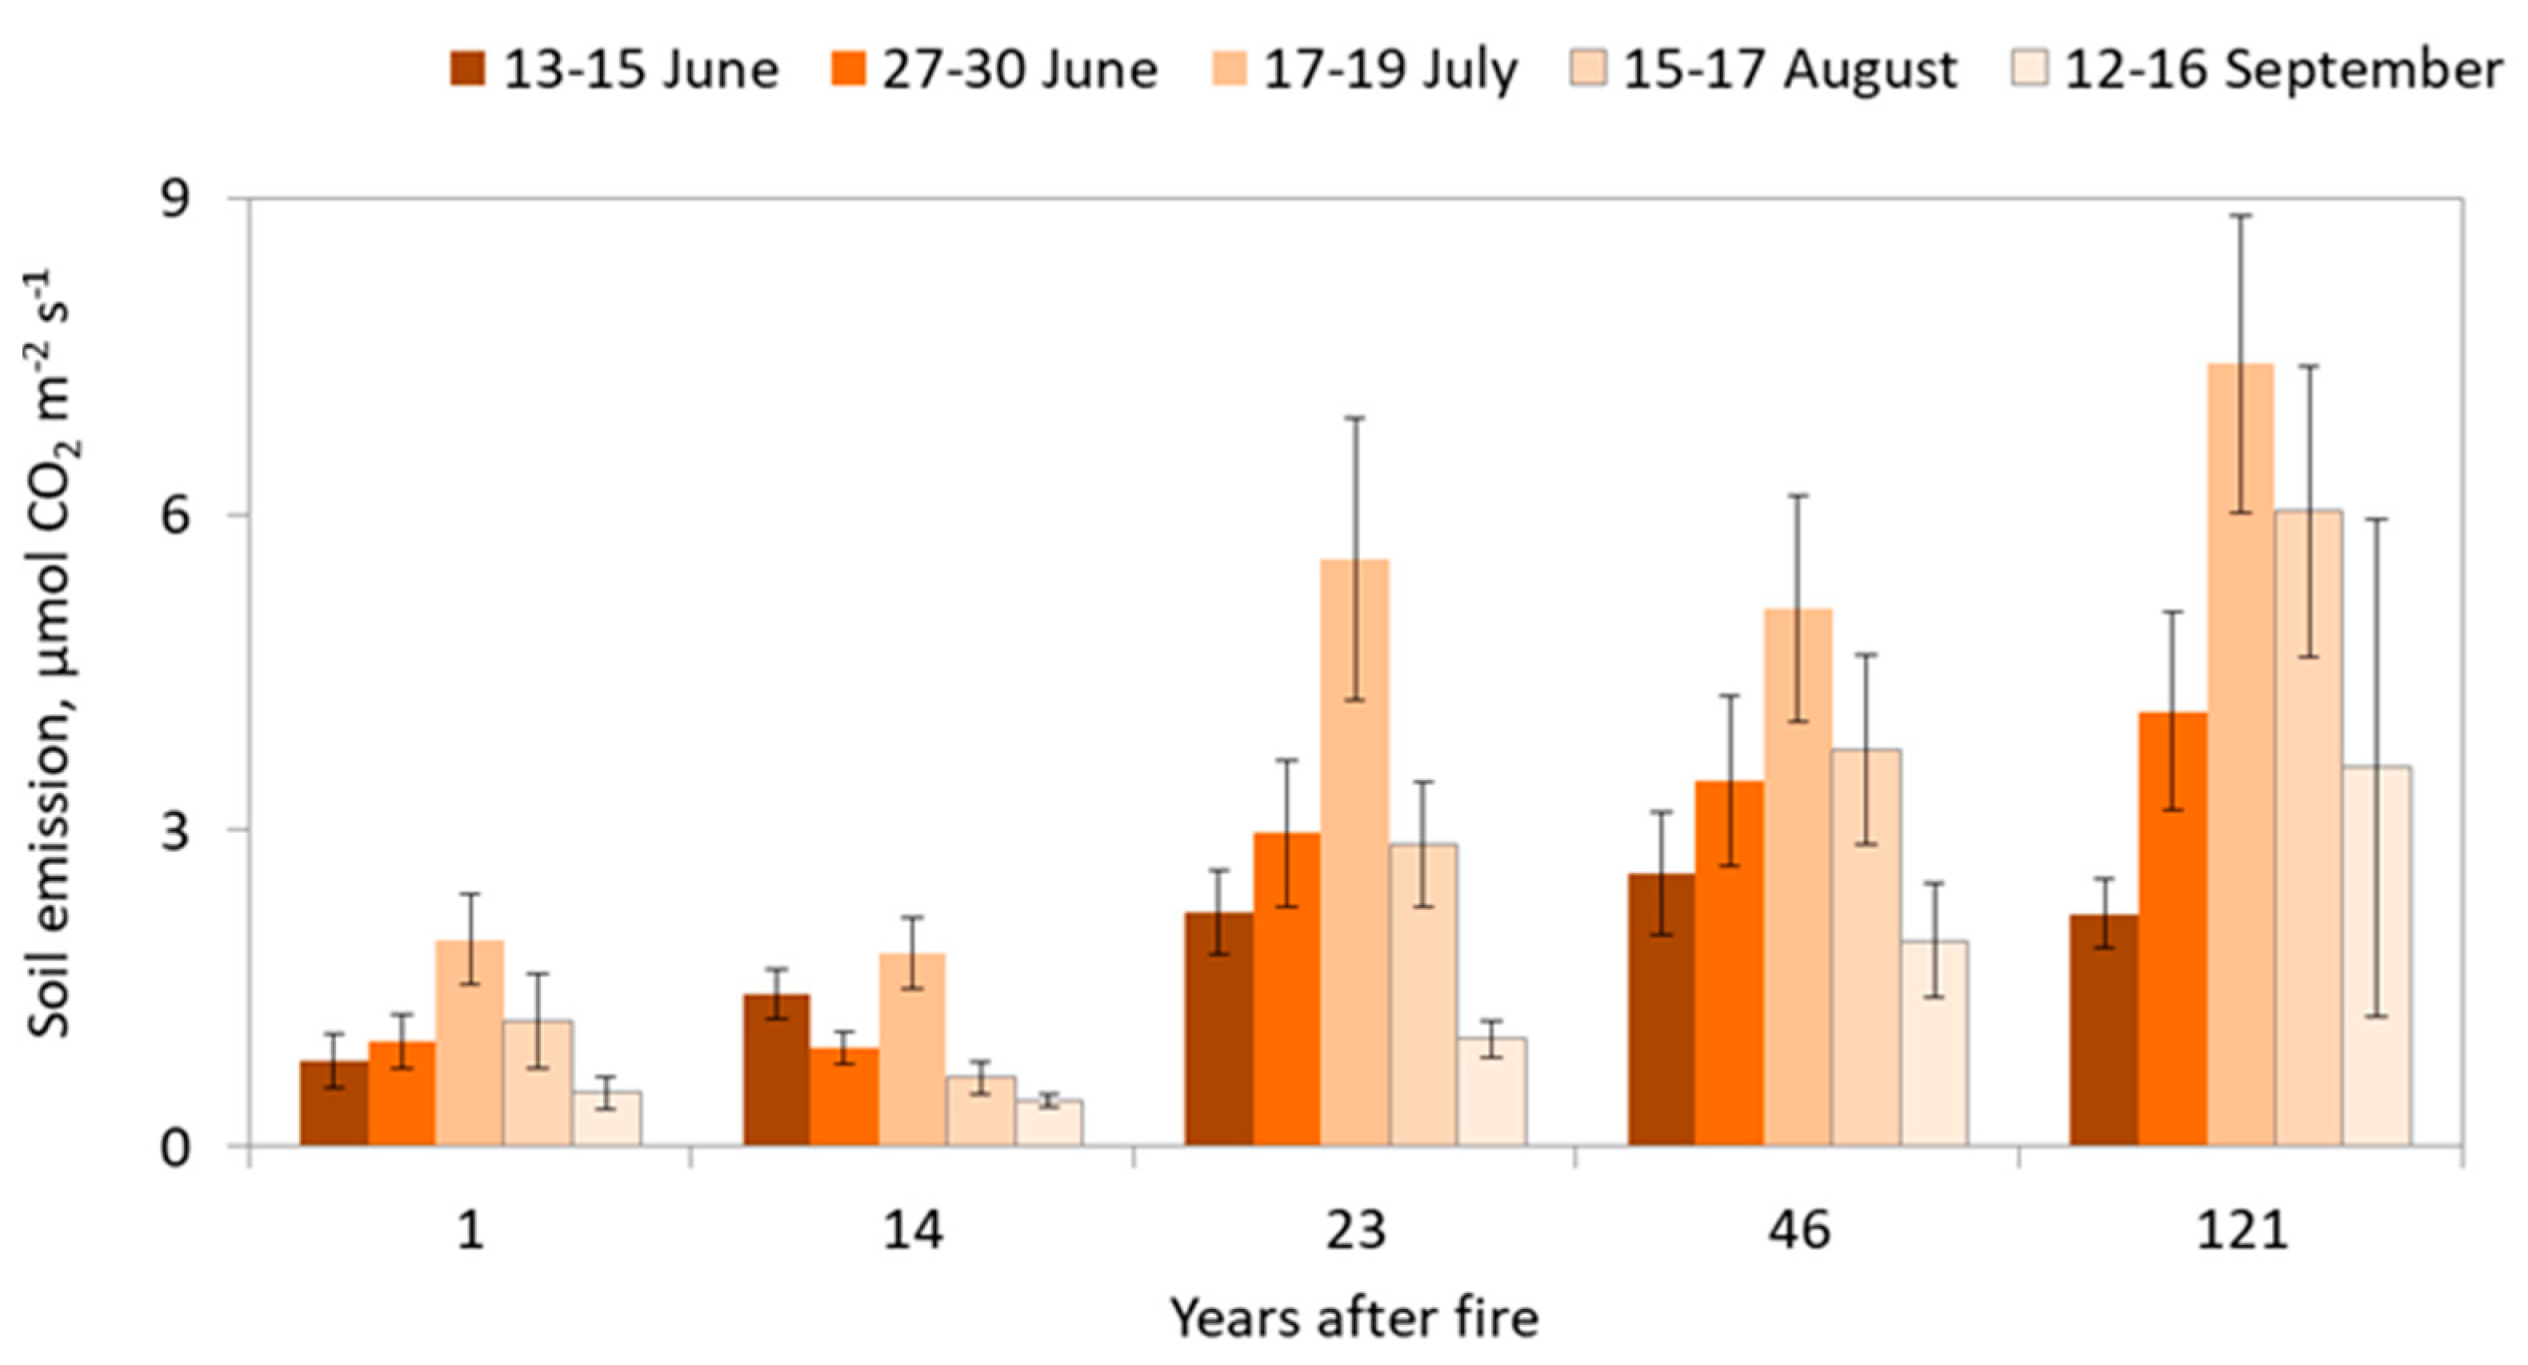
3.2.2. Soil Carbon Emissions

In the chronosequence, we analyzed soil CO2 emission fluxes even at the site 1 year after we observed the seasonal dynamic (Figure 6). The maximum fluxes at each site were established in the middle of July. The smallest soil CO2 emission rates were fixed in the middle of June and the middle of September.
Low CO2 emissions from the soil were characterized at the site 1 year after fire. Seasonal variation was also quite small, from 0.51 ± 0.15 µmol CO2 m−2 s−1 in the middle of September to 1.96 ± 0.43 µmol CO2 m−2 s−1 in the middle of July.
The site 14 years after fire demonstrated almost the same flux rates as the previous site and even smaller mean soil emission seasonal values at around 1.06 ± 0.55 µmol CO2 m−2 s−1. The highest soil CO2 emission is presented in July (1.84 ± 0.33 µmol CO2 m−2 s−1), and the lowest in September (0.44 ± 0.06 µmol CO2 m−2 s−1).
Unexpectedly, we found that, firstly, 14 years is not enough time for recovery after a strong wildfire; secondly, initial forest trees composition may play a crucial role in fire recovery; thirdly, the height above the sea level and natural microrelief characteristics could modify the emission rates in even small distances between sites.
As we mentioned before, when analyzing soil moisture conditions, the site 23 years after fire demonstrates the features of a well-organized undestroyed ecosystem. In terms of flux rates, we found the confirmation of our concept. The soil CO2 emission at this site during the summer measurements period varied from 1.02 ± 0.18 to 5.57 ± 1.33 µmol CO2 m−2 s−1. The maximum emission monitored in the middle of July.
Previously, it was found in this area that 25 years after heavy fire, the lichen pine forest obtained a sink of CO2 fluxes [39]. Additionally, this could partly explain the features we gained.
However, in another study of boreal forests [37], exactly 23 years after fire, soil CO2 emission rates in most of the forests affected by fires became indistinguishable from the forests.
The next successional stage 46 years after fire illustrated a well-defined seasonal dynamic. The seasonal cycle started in June from 2.59 ± 0.59 µmol CO2 m−2 s−1, then reached the maximum level of 5.10 ± 1.08 µmol CO2 m−2 s−1 in July, down to 1.95 ± 0.54 µmol CO2 m−2 s−1 in September.
At the site 121 years after fire, the highest soil CO2 emission was found. The seasonal variation moved from 2.20 ± 0.33 µmol CO2 m−2 s−1 in the middle of June up to 7.42 ± 1.4 µmol CO2 m−2 s−1 in the middle of July.
The patterns of CO2 flux over the chronosequence were similar to those of soil moisture. The regression analysis showed an increase in emission rates over time (R2 = 0.93). It was found the soil CO2 emissions from the most recent burn area were lower compared with the site 121 years after fire in four instances.

3.3. Soil Emission and Soil Physical Properties

Seasonal soil CO2 emissions are strongly correlated with soil temperature (Figure 7a) for all sites of chronosequence, indicating exponential dependence. At sites 1, 23, 46 and 121 years after fire, the coefficient of determination (R2) was higher than 0.4, meaning that soil temperature at these sites plays a significant role in soil emission dynamics during the summer season. The site 14 years after fire was the least sensitive to the soil temperature changes (R2 = 0.2).
Relations to soil moisture regime are opposite to soil temperatures at the burned sites. For sites longer than 14 years following fire, CO2 emissions first increased then decreased within increasing levels of soil moisture (Figure 7b). Surprisingly, the most recent burn site was similar to the latest successional stage response. The highest CO2 emissions appear to be around 0.3 m3 m−3 [40].

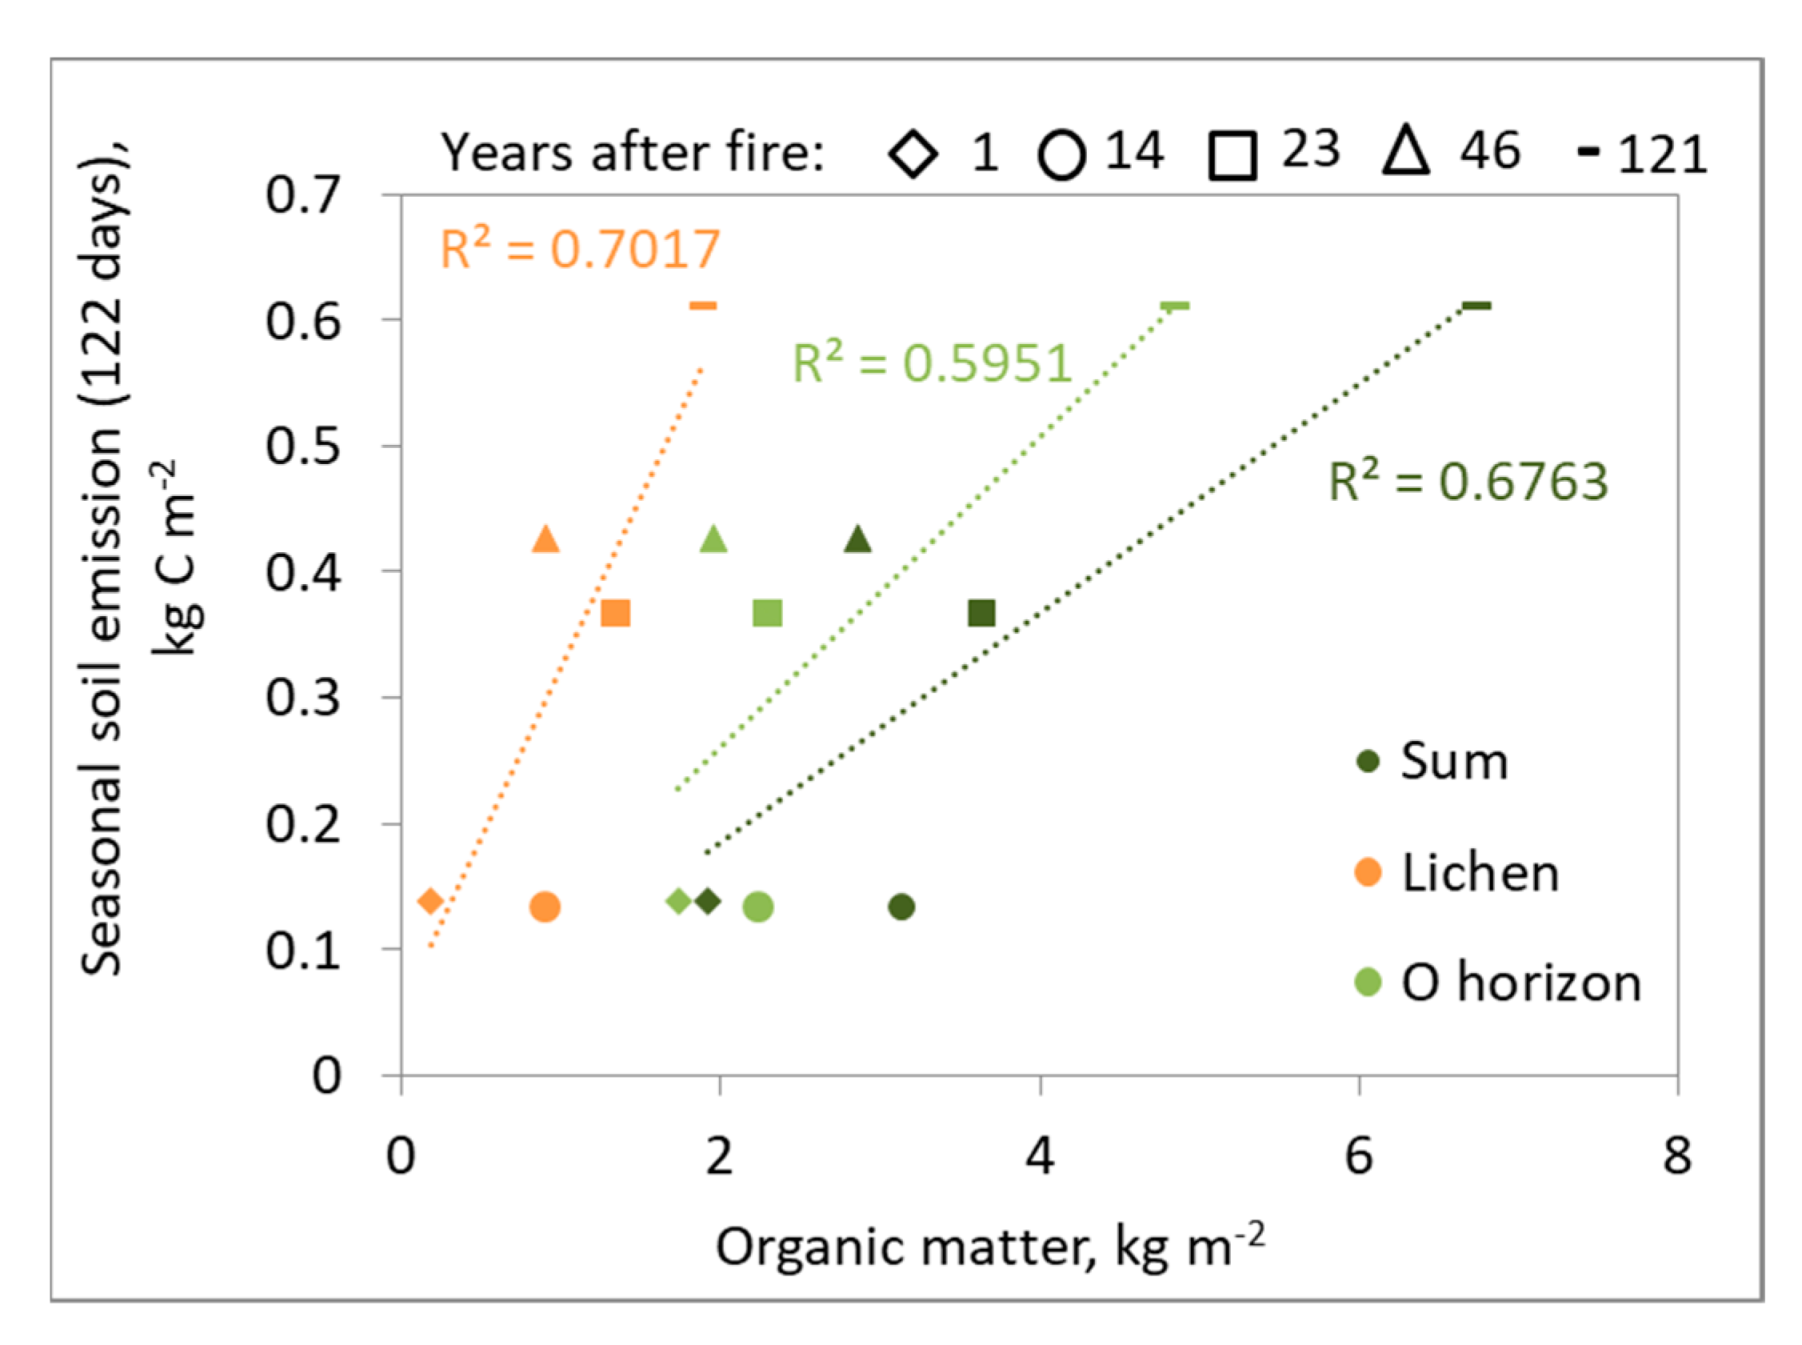
3.4. Soil Emission and Organic Matter

From the sites of the chronosequence, the lowest organic matter for the two studied fractions was determined at the area burned most recently (Table 2). The highest pools were observed at the site 121 years after fire. The O-horizon contained twice as much organic matter than lichen ground cover for the sites 14, 23, 46 and 121 years after fire. The site 1 year after fire demonstrates the bigger differences in organic matter pools: O-horizon contains 10 times more OM than lichen cover. However, in this case, it should be remembered that the site 1 year after fire contained almost no lichen in its ground cover. Usually, the first recovery stage of lichens after wildfire started 10 years after fire.
The soil emission rates controlled by the presence of ground cover consist mainly of lichens (Figure 8), even if their recovery takes a long time. The analysis showed that seasonal soil CO2 emissions had a lower correlation with organic matter in the O-horizon than in the lichen ground cover.

4. Discussion

4.1. Soil Emission and Times Since Fire

Some authors suggested that fire severity is the main driver of soil emission dynamics, especially in the mountain regions of the boreal zone. The soil emission in the high burning severity sites was significantly lower than that in the control plot [41]. In our study, the fire severity was similar at all the sites and the differences between them stem mainly from the time since the fire event.
In contrast to our study, in a Canadian boreal forest, CO2 emissions were three times higher at 16 years after a fire than at the site 32 years after fire. The main consequences of it could be the domination of heterotrophic component in the emission process in the younger scars [41].
Interestingly, for our study area containing pine forests, at the sites 1 and 14 years after fire, there are no significant differences in soil CO2 emissions. Firstly, one of the suggestions might be that 14 years is not enough time to recover emission rates due to the destroyed ground cover, dead roots, low microbiological activity, etc. The second reason could be an additional disturbing factor at the site 14 years after fire, which is windfall. This came after the fire in 2005, which created specific conditions for this site. Previously, for evergreen broad-leaf forests in China, it was found that forest gaps may decrease soil microbial community diversity, soil nutrients, and, as a consequence, the heterotrophic part of soil emission [42].
The defined time of ecosystem transition in 23 years after fire is the period which shows the characteristics and behavior of the site as an undisturbed ecosystem. Additionally, here it should be emphasized that previously, [37] exactly the same time period for recovery of the soil CO2 emission rates was identified in the boreal region.

4.2. Soil Properties in Different Stages of Fire Succession

Soil properties, along with other environmental conditions, greatly change after wildfire. The soil depth until which some differences could be observed depends on fire se-verity characteristic [36]. After stand-replacing fire in the permafrost region, the depth of active layer may reach approximately 1 m depth [35]. In another study, it was indicated the depth of the active layer increases after the wildfire for approximately 3–5 years, depending on the fire severity and site conditions due to changes in ground vegetation coverage and albedo, resulting in higher ground temperatures after disturbance [43]. Soil temperature is related to this process and increases after fire compared with the control area.
For our succession sites, soil temperature decreases from 1 to 121 years after fire (Figure 4). However, at the site 14 years after the fire, we observed the highest soil temperature in each depth. The specific origin conditions of this site may also explain this situation. Due to the presence of dead wood and coarse woody debris, the ground cover is receiving more solar radiation than the other sites. Most likely due to these conditions at this site, we fixed the higher temperature gradient with a higher depth compared to the other stages after the wildfire.
Soil moisture is another important factor affecting soil CO2 emissions [44]. In the study of Arctic areas, it was concluded that wildfires may reduce soil moisture by destroying vegetation cover and forest stand composition [45]. In most of our sites, except 121 years after fire, ground cover was partly or completely destroyed. Usually, the presence of ground vegetation cover may act as a layer of conservation of some permanent soil environmental condition [46]. Additionally, the lack of this layer will disturb the functioning of the whole ecosystem. Soil water is needed for life cycles of soil microorganisms, organic decomposition process and carbon sequestration as well [47]. In drought conditions, as an adaptation mechanism, the “Birch effect” has been observed, where additional CO2 is released to the atmosphere [48,49,50].
In our study, at the two sites 1 and 14 years after fire, we monitored low soil moisture levels (Figure 5). For the other sites, we can notice the optimal range of soil moisture values when soil emission is highest. After 23 years since fire, there is a border when the increased soil water content allows for the detection of an optimal soil moisture range for max efflux. During the summer season, moisture conditions have an especially strong role in regulating soil emission dynamics.

5. Conclusions

The study was directed to explore soil CO2 emission responses to wildfires as the main natural disturbance factor in the boreal region. We identified a four-fold reduction in soil CO2 efflux at the first successional stage of the fire chronosequence compared with one fourth of that in the 121 years since fire area. The next successional stage 14 years after fire demonstrated similar emission fluxes and highlighted that this period of time represented the still-destroyed stage of ecosystem functioning. The successional stage of 23 years after fire combines observable fire impact and features of the natural undisturbed area. Between 46 years and 121 years following the fire, the emission fluxes increased by 30%. Successional stages at 1 and 14 years were characterized by the lowest values of soil moisture and highest soil temperatures. Soil CO2 emissions reacted differently to the soil temperature and soil moisture changes across the fire chronosequence. At the successional stages 1, 23 years and older, soil temperature plays an important role in the regulation of soil emission fluxes. The soil moisture mostly modifies the fluxes at the site 14 years after fire. The presence of ground cover causes more soil CO2 emissions than the first organic horizon of mineral soil.
Our results suggest that wildfires have a huge impact on the soil CO2 emission dynamics and can completely change the functional role of the boreal region as a carbon sink in the global climate system.

Author Contributions

Conceptualization, A.M. and A.P. (Anatoly Prokushkin); methodology, A.M.; formal analysis, A.M. and A.P. (Anatoly Prokushkin); investigation, A.M. and A.P. (Anatoly Prokushkin); resources, A.P. (Alexey Panov), A.P. (Anatoly Prokushkin) and A.M.; writing—original draft preparation, A.M.; writing—review and editing, A.P. (Anatoly Prokushkin) and A.P. (Alexey Panov); visualization, A.P. (Alexey Panov). All authors have read and agreed to the published version of the manuscript.

Funding

This research was carried out as a part of the most important innovative project of national importance: “Development of a system for ground-based and remote monitoring of carbon pools and greenhouse gas fluxes in the territory of the Russian Federation, ensuring the creation of recording data systems on the fluxes of climate-active substances and the carbon budget in forests and other terrestrial ecological systems” (#123030300031-6). In situ observations and raw data processing were supported by the Russian Academy of Sciences within the framework of the state assignment (#FWES-2021-0041) of the Sukachev Institute of Forest Siberian Branch of the Russian Academy of Sciences.

Data Availability Statement

The data discussed in this paper are available upon request.

Acknowledgments

We thank the staff of the international research station “ZOTTO” for help in technical and transportation support.

Conflicts of Interest

The authors declare no conflict of interest.

References

  1. Kim, Y.; Tanaka, N. Effect of forest fire on the fluxes of CO2, CH4 and N2O in boreal forest soils, interior Alaska. J. Geophys. Res. 2003, 108, 10–12. [Google Scholar] [CrossRef]
  2. Conard, S.G.; Sukhinin, A.I.; Stocks, B.J.; Cahoon, D.R.; Davidenko, E.P.; Ivanova, G.A. Determining effects of area burned and fire severity on carbon cycling and emissions in Siberia. Clim. Chang. 2002, 55, 197–211. [Google Scholar] [CrossRef]
  3. Deluca, T.H.; Boisvenue, C. Boreal forest soil carbon: Distribution, function and modelling. Forestry 2012, 85, 161–184. [Google Scholar] [CrossRef]
  4. Kasishcke, E.S.; Stocks, J.B. Fire, Climate Change, and Carbon Cycling in the Boreal Forest. In Ecological Studies; Springer: New York, NY, USA, 2000; Volume 138, p. 461. [Google Scholar]
  5. Kasischke, E.S.; Christensen, N.L., Jr.; Stocks, B.J. Fire, global warming, and the carbon balance of boreal forests. Ecol. Appl. 1995, 5, 437–451. [Google Scholar] [CrossRef]
  6. Kim, Y.-S. Soil-atmosphere exchange of CO2, CH4 and N2O in northern temperate forests: Effects of elevated CO2 concentration, N deposition and forest fire. Eurasian J. For Res. 2013, 16, 1–43. [Google Scholar]
  7. Friedlingstein, P.; Jones, M.W.; O’Sullivan, M.; Andrew, R.M.; Bakker, D.C.E.; Hauck, J.; Le Quéré, C.; Peters, G.P.; Peters, W.; Pongratz, J. Global Carbon Budget 2021. Earth Syst. Sci. Data 2022, 14, 1917–2005. [Google Scholar] [CrossRef]
  8. FAO. Global Forest Resources Assessment 2020 Main Report. Rome. 2020. Available online: https://www.fao.org/documents/card/en/c/ca9825en (accessed on 20 April 2022).
  9. Fan, S.; Gloor, M.; Mahlman, J.; Pacala, S.; Sarmiento, J.; Takashi, T.; Peng, T. A large terrestrial carbon sink in North America implied by atmospheric and oceanic carbon dioxide data and models. Science 1998, 282, 442–446. [Google Scholar] [CrossRef]
  10. Thom, D.; Rammer, W.; Dirnböck, T.; Müller, J.; Kobler, J.; Katzensteiner, K.; Helm, N.; Seidl, R.; Mori, A. The impacts of climate change and disturbance on spatio-temporal trajectories of biodiversity in a temperate forest landscape. J. Appl. Ecol. 2017, 54, 28–38. [Google Scholar] [CrossRef] [Green Version]
  11. Thom, D.; Seidl, R. Natural disturbance impacts on ecosystem services and biodiversity in temperate and boreal forests. Biol. Rev. Camb. Philos. Soc. 2016, 91, 760–781. [Google Scholar] [CrossRef]
  12. Romeiro, J.M.; Eid, T.; Antón-Fernández, C.; Kangas, A.; Trømborg, E. Natural disturbances risks in European Boreal and Temperate forests and their links to climate change—A review of modelling approaches. For. Ecol. Manag. 2022, 509, 120071. [Google Scholar] [CrossRef]
  13. Whitman, E.; Parisien, M.A.; Thompson, D.K.; Hall, R.J.; Skakun, R.S.; Flannigan, M.D. Variability and drivers of burn severity in the northwestern Canadian boreal forest. Ecosphere 2018, 9, e02128. [Google Scholar] [CrossRef] [Green Version]
  14. Boucher, J.; Beaudoin, A.; Hébert, C.; Guindon, L.; Bauce, É. Assessing the potential of the differenced Normalized Burn Ratio (dNBR) for estimating burn severity in eastern Canadian boreal forests. Int. J. Wildland Fire 2017, 26, 32–45. [Google Scholar] [CrossRef]
  15. Lafleur, B.; Cazal, A.; Leduc, A.; Bergeron, Y. Soil organic layer thickness influences the establishment and growth of trembling aspen (Populus tremuloides) in boreal forests. For. Ecol. Manag. 2015, 347, 209–216. [Google Scholar] [CrossRef]
  16. de Groot, W.J.; Flannigan, M.D.; Cantin, A.S. Climate change impacts on future boreal fire regimes. For. Ecol. Manag. 2013, 294, 35–44. [Google Scholar] [CrossRef]
  17. Kashian, D.M.; Romme, W.H.; Tinker, D.B.; Turner, M.G.; Ryan, M.G. Carbon storage on landscapes with stand-replacing fires. Bioscience 2006, 56, 598–606. [Google Scholar] [CrossRef]
  18. van der Werf, G.R.; Randerson, J.T.; Giglio, L.; Collatz, G.J.; Mu, M.; Kasibhatla, P.S.; Morton, D.C.; DeFries, R.S.; Jin, Y.; van Leeuwen, T.T. Global fire emissions and the contribution of deforestation, savanna, forest, agricultural, and peat fires (1997–2009). Atmos. Chem. Phys. 2010, 10, 11707–11735. [Google Scholar] [CrossRef] [Green Version]
  19. Amiro, B.D.; Cantin, A.; Flannigan, M.D.; de Groot, W.J. Future emissions from Canadian boreal forest fires. Can. J. For. Res. 2009, 39, 383–395. [Google Scholar] [CrossRef]
  20. Dore, S.; Kolb, T.E.; Montes-Helu, M.; Sullivan, B.W.; Winslow, W.D.; Hart, S.C.; Kaye, J.P.; Koch, G.W.; Hungate, B.A. Long-termimpact of a stand replacing fire on ecosystem CO2 exchange of a ponderosa pine forest. Glob. Chang. Biol. 2008, 14, 1801–1820. [Google Scholar] [CrossRef]
  21. Sullivan, B.W.; Kolb, T.E.; Hart, S.C.; Kaye, J.P.; Hungate, B.A.; Dore, S.; Montes-Helu, M. Wildfire reduces carbon dioxide efflux and increases methane uptake in ponderosa pine forest soils of southwestern USA. Biogeochemistry 2011, 104, 251–265. [Google Scholar] [CrossRef]
  22. Nakano, T. Changes in Surface Methane Flux after a Forest Fire in West Siberia. In Symptom of Environmental Change in Siberian Permafrost Region; Hatano, R., Guggenberger, G., Eds.; Hokkaido University Press: Sapporo, Japan, 2006; pp. 55–63. [Google Scholar]
  23. Hart, S.C.; DeLuca, T.H.; Newman, G.S.; MacKenzie, M.D.; Boyle, S.I. Post-fire vegetative dynamics as drivers of microbial community structure and function in forest soils. For. Ecol. Manag. 2005, 220, 166–184. [Google Scholar] [CrossRef]
  24. Cairney, J.W.G.; Bastias, B.A. Influences of fire on forest soil fungal communities. Can. J. For. Res. 2007, 37, 207–215. [Google Scholar] [CrossRef]
  25. Köster, E.; Köster, K.; Berninger, F.; Pumpanen, J. Carbon dioxide, methane and nitrous oxide fluxes from podzols of a fire chronosequence in the boreal forests in Värriö, Finnish Lapland. Geoderma Reg. 2015, 5, 181–187. [Google Scholar] [CrossRef]
  26. Meigs, G.W.; Donato, D.C.; Campbell, J.L.; Martin, J.G.; Law, B.E. Forest fire impacts on carbon uptake, storage, and emission: The role of burn severity in the eastern cascades, Oregon. Ecosystems 2009, 12, 1246–1267. [Google Scholar] [CrossRef]
  27. Wear, D.N.; Coulston, J.W. From sink to source: Regional variation in U.S. forest carbon futures. Sci. Rep. 2015, 5, 16518. [Google Scholar] [CrossRef] [Green Version]
  28. Holden, S.R.; Berhe, A.A.; Treseder, K. Decreases in soil moisture and organic matter quality suppress microbial decomposition following a boreal forest fire. Soil Biol. Biochem. 2015, 87, 1–9. [Google Scholar] [CrossRef]
  29. Sutanto, S.J.; Vitolo, C.; Di Napoli, C.; D’Andrea, M.; Van Lanen, H.A.J. Heatwaves, droughts, and fires: Exploring compound and cascading dry hazards at the pan-European scale. Environ. Int. 2020, 134, 105276. [Google Scholar] [CrossRef]
  30. IPCC. Climate Change 2021: The Physical Science Basis. Working Group I Contribution to the Sixth Assessment Report of the Intergovernmental Panel on Climate Change; Masson-Delmotte, V., Zhai, P., Pirani, A., Connors, S.L., Péan, C., Berger, S., Caud, N., Chen, Y., Goldfarb, L., Gomis, M.S., Eds.; Cambridge University Press: Cambridge, UK, 2021. [Google Scholar] [CrossRef] [Green Version]
  31. IPCC. Refinement to the 2006 IPCC Guidelines for National Greenhouse Gas Inventories; Calvo Buendia, E., Tanabe, K., Kranjc, A., Baasansuren, J., Fukuda, M., Ngarize, S., Osako, A., Pyrozhenko, Y., Shermanau, P., Federici, S., Eds.; IPCC: Geneva, Switzerland, 2019. [Google Scholar]
  32. Ribeiro-Kumara, C.; Köster, E.; Aaltonen, H.; Köster, K. How do forest fires affect soil greenhouse gas emissions in upland boreal forests? A review. Environ. Res. 2020, 184, 109328. [Google Scholar] [CrossRef]
  33. Vogel, J.G.; Bronson, D.; Gower, S.T.; Schuur, E.A. The response of root and microbial respiration to the experimental warming of a boreal black spruce forest. Can. J. For. Res. 2014, 44, 986–993. [Google Scholar] [CrossRef]
  34. Russian GOST 26213-2021 (Russian): Soils. Methods for Determination of Organic Matter. Available online: https://www.dokipedia.ru/document/5374625 (accessed on 15 May 2023).
  35. Aaltonen, H.; Palviainen, M.; Zhou, X.; Köster, E.; Berninger, F.; Pumpanen, J.; Köster, K. Temperature sensitivity of soil organic matter decomposition after forest fire in Canadian permafrost region. J. Environ. Manag. 2019, 241, 637–644. [Google Scholar] [CrossRef]
  36. Ribeiro-Kumara, C.; Pumpanen, J.; Heinonsalo, J.; Metslaid, M.; Orumaa, A.; Jõgiste, K.; Berninger, F.; Köster, K. Long-term effects of forest fires on soil greenhouse gas emissions and extracellular enzyme activities in a hemiboreal forest. Sci. Total Environ. 2020, 718, 135291. [Google Scholar] [CrossRef]
  37. Hu, T.; Sun, L.; Hu, H.; Weise, D.R.; Guo, F. Soil respiration of the Dahurian larch (Larix gmelinii) forest and the response to fire disturbance in Da Xing’an Mountains, China. Sci. Rep. 2017, 7, 2967. [Google Scholar] [CrossRef] [Green Version]
  38. O’Donnell, J.A.; Turetsky, M.R.; Harden, J.W. Interactive effects of fire, soil climate, and moss on CO2 fluxes in black spruce ecosystems of interior Alaska. Ecosystems 2009, 12, 57–72. [Google Scholar] [CrossRef]
  39. Köster, E.; Köster, K.; Berninger, F.; Prokushkin, A.; Aaltonen, H.; Zhou, X.; Pumpanen, J. Changes in fluxes of carbon dioxide and methane caused by fire in Siberian boreal forest with continuous permafrost. J. Environ. Manag. 2018, 228, 405–415. [Google Scholar] [CrossRef] [Green Version]
  40. Makhnykina, A.V.; Prokushkin, A.S.; Menyailo, O.V.; Verkhovets, S.V.; Tychkov, I.I.; Urban, A.V.; Rubtsov, A.V.; Koshurnikova, N.N.; Vaganov, E.A. The impact of climatic factors on CO2 emissions from soils of middle-taiga forests in Central Siberia: Emission as a function of soil temperature and moisture. Russ. J. Ecol. 2020, 51, 46–56. [Google Scholar] [CrossRef]
  41. Smith, D.R.; Kaduk, J.D.; Balzter, H.; Wooster, M.J.G.; Mottram, N.; Hartley, G.; Lynham, T.J.; Studens, J.; Curry, B.J.; Stocks, J. Soil surface CO2 flux increases with successional time in a fire scar chronosequence of Canadian boreal jack pine forest. Biogeosciences 2010, 7, 1375–1381. [Google Scholar] [CrossRef] [Green Version]
  42. Chen, S.; Jiang, C.; Bai, Y.; Wang, H.; Jiang, C.; Huang, K.; Guo, L.; Zeng, S.; Wang, S. Effects of Forest Gap on Soil Microbial Communities in an Evergreen Broad-Leaved Secondary Forest. Forests 2022, 13, 2015. [Google Scholar] [CrossRef]
  43. Tsuyuzaki, S.; Kushida, K.; Kodama, Y. Recovery of surface albedo and plant cover after wildfire in a Picea mariana forest in interior Alaska. Clim. Chang. 2008, 93, 517. [Google Scholar] [CrossRef]
  44. Wirth, C.; Czimczik, C.I.; Schulze, E.-D. Beyond annual budgets: Carbon flux at different temporal scales in fire-prone Siberian Scots pine forests. Tellus 2002, 54B, 611–630. [Google Scholar] [CrossRef]
  45. Narita, K.; Harada, K.; Saito, K.; Sawada, Y.; Fukuda, M.; Tsuyuzaki, S. Vegetation and permafrost thaw depth 10 years after a tundra fire in 2002, Seward Peninsula, Alaska. Arct. Antarct. Alp. Res. 2015, 47, 547–559. [Google Scholar] [CrossRef] [Green Version]
  46. Hu, Y.; Zhang, F.; Luo, Z.; Badreldin, N.; Benoy, G.; Xing, Z. Soil and water conservation effects of different types of vegetation cover on runoff and erosion driven by climate and underlying surface conditions. Catena 2023, 231, 107347. [Google Scholar] [CrossRef]
  47. Lu, B.-Q.; Zang, S.-Y.; Song, L.-Q.; Sun, L.; Li, M.; Bing, D. Cooling and wetting of soil decelerated ground freezing–thawing processes of the active layer in Xing’an permafrost regions in Northeast China. Adv. Clim. Chang. Res. 2022, 14, 126–135. [Google Scholar] [CrossRef]
  48. Birch, H.F. Mineralisation of plant nitrogen following alternate wet and dry conditions. Plant Soil 1964, 20, 43–49. [Google Scholar] [CrossRef]
  49. Huxman, T.E.; Snyder, K.A.; Tissue, D.; Leffler, A.J.; Ogle, K.; Pockman, W.T.; Sandquist, D.R.; Potts, D.L.; Schwinning, S. Precipitation pulses and carbon fluxes in semiarid and arid ecosystems. Oecologia 2004, 141, 254–268. [Google Scholar] [CrossRef]
  50. Barron-Gafford, G.A.; Scott, R.L.; Jenerette, G.D.; Huxman, T.E. The relative controls of temperature, soil moisture, and plant functional group on soil CO2 efflux at diel, seasonal, and annual scales. J. Geophys. Res. 2011, 116, G01023. [Google Scholar] [CrossRef] [Green Version]
Figure 1. Map of the study sites: 1898—121 years after fire; 1973—46 years after fire; 1996—23 years after fire; 2005—14 years after fire; 2018–1 year after fire; ZOTTO—Zotino Tall Tower, International research station (http://www.zottoproject.org, accessed on 15 May 2023).
Land 12 01544 g001
Figure 2. Stands and ground vegetation on the study sites.
Land 12 01544 g002
Figure 3. Seasonal meteorological conditions (May–September). The mean values were calculated from 1936 for air temperature and from 1966 for precipitation for Bor meteorological station (http://www.meteo.ru, accessed on 15 May 2023). The error bars show the standard deviation.
Land 12 01544 g003
Figure 4. Soil temperature changes with the depth of fire chronosequence. Data represent the seasonal mean (25 measurements per season) with standard deviation bars.
Land 12 01544 g004
Figure 5. Seasonal soil moisture for fire chronosequence.
Land 12 01544 g005
Figure 6. Dynamic of the soil CO2 emissions during the summer season. Error bars present the standard deviation for each period of measurements.
Land 12 01544 g006
Figure 7. Dependencies of soil emission on soil temperature (a) and soil moisture (b).
Land 12 01544 g007
Figure 8. Relationship between organic matter of two fractions (lichens and O-horizon) and their sum with soil CO2 emissions on a seasonal scale.
Land 12 01544 g008
Table 1. Ecological conditions of the study sites. 10P—Pinus sylvestris, lichen pine forest.
SiteElevation, m a.s.l.Forest TypeGround CoverTree SpeciesStand Density, Trees per Ha
18987710PCladonia stellaris, Cladonia rangiferinaPinus sylvestris L.1703
19739410PCladonia stellaris, Cladonia rangiferina, Pleurozium schreberi, Vaccinium vitis-idaeaPinus sylvestris L.2212
19966210PCladonia stellaris, Cladonia rangiferina, Polytrichum commune, Cetraria islandica, Vaccinium vitis-idaeaPinus sylvestris L.1625
20059710PCladonia stellaris, Cladonia rangiferina, Polytrichum commune, Cetraria islandica, Vaccinium vitis-idaea, Arctostaphylos uva-ursiPinus sylvestris L.-
20189610P- Pinus sylvestris L.1448
Table 2. Organic matter in fractions, in kg m−2. Mean values presented with standard deviation (SD).
FractionYears after Fire
1142346121
Lichen0.18 ± 0.200.90 ± 0.641.34 ± 0.730.90 ± 0.511.52 ± 0.93
O-horizon1.74 ± 1.442.23 ± 0.812.29 ± 1.471.95 ± 1.093.73 ± 1.53
Disclaimer/Publisher’s Note: The statements, opinions and data contained in all publications are solely those of the individual author(s) and contributor(s) and not of MDPI and/or the editor(s). MDPI and/or the editor(s) disclaim responsibility for any injury to people or property resulting from any ideas, methods, instructions or products referred to in the content.

