Abstract
The planning of urban transportation infrastructure and land-related policies has a significant impact on the living conditions of urban residents and socio-economic development, particularly in emerging economies. As urbanization continues to advance, Metropolitan Areas (MAs) have become crucial for achieving industrial coordination, functional complementarity between cities, and integrated regional development. Applying Social Network Analysis (SNA), the gravity model, and Quadratic Assignment Procedure (QAP) analysis, this study investigated the spatial-temporal distribution patterns of High-Speed Railway (HSR) networks and economic networks in MAs in China and the dynamic coupling relationship between these two networks. The findings revealed that, although core cities in the Yangtze River Delta MA in China exert varying degrees of radiation and driving effects on the economic development of surrounding cities, the overall development remains immature with a noticeable disequilibrium phenomenon. The coupling relationship between the HSR networks and the economic networks also differs significantly among different MAs. It is expected that the findings and suggestions of this study will contribute to the improvement of urban planning and governance and facilitate coordinated development between urban transportation infrastructure and the economy in emerging economies.
1. Introduction
Metropolitan Areas (MAs), also known as metropolitan regions, are regions that consist of one or more principle cities and their surrounding suburbs and communities, which are economically and socially integrated. The specific criteria for defining an MA can vary by country or region for different purposes. The concept of the MA is closely tied to urbanization, which occurs when the regionalization of large cities reaches a particular stage of advancement [1]. Driven by regional integration, intercity economic complementarity and cooperation are enhanced in the context of megalopolization [2]. In 1957, French geographer Gottman introduced the concept of the “Megalopolis”, and in 1966, American scholar Friedman proposed the theoretical model of “Core-periphery”. These contributions were significant in the formation and development of economic theory and the evolution of the spatial structure of MAs.
A well-designed transportation network can facilitate the movement of resources and boost social and economic ties between cities in a region, leading to urbanization, the establishment of MAs, and the advancement of the regional economy [3,4]. The structure of an MA and the strong economic and social connections between its core and peripheral cities rely heavily on a well-built transportation network. As cities grow and MAs expand, the need for transportation infrastructure intensifies, driving the construction of new networks [5]. This reveals a reciprocal relationship between the economic growth of an MA and the construction of its transportation infrastructure, which changes dynamically as both aspects evolve. Against the background of regional economic integration, investigating the dynamic interplay between transportation network layout and regional economic development is worthwhile.
The construction of High-Speed Railway (HSR) represents a significant breakthrough in transportation infrastructure [6]. Compared to traditional transportation methods such as roads and conventional railways, it has greatly enhanced intercity accessibility, reduced travel time, and generated substantial impacts on production factors, social development, and economic growth [7]. In some developed countries, such as Germany, Spain, and Japan, HSRs have been successfully implemented and delivered positive outcomes [8,9,10]. However, due to vast differences in social structure, economic foundation, and policy support, this costly investment remains a subject of controversy in academia and industry, particularly in developing nations [11]. Therefore, examining HSRs as an emerging transport infrastructure in the context of developing countries is critical.
In recent years, China has made remarkable strides in the development of its HSR infrastructure, while also witnessing a substantial increase in its urbanization rate, which increased from 48.34% in 2009 to 65.22% in 2022 (data source: National Bureau of Statistics of China). As a result, large cities have continued to expand and develop, with their functions spilling over and their administrative boundaries becoming increasingly blurred [12]. This has led to intensified demands for spatial development across administrative regions. In response, China has been actively promoting the integrated construction of MAs in order to address the challenges arising from rapid urban economic development.
While many scholars have investigated the impact of HSR on China’s regional economic development, a consensus has yet to be reached on this issue. It may be attributed, in part, to the diverse range of research objects being examined. For instance, some studies investigated the overall economic impact of HSRs at a regional level, such as a country or an urban agglomeration, finding positive effects on the whole economy [13,14,15]. Conversely, other studies may adopt a narrower scope, analyzing the HSR’s economic benefits in prefecture-level or county-level cities. These studies often reveal the heterogeneity of the HSR’s economic impact, indicating that it may exacerbate regional economic differentiation [16,17,18]. Existing research lacks sufficient studies that take into account the perspective of MAs. Therefore, this study sought to fill this gap by analyzing the temporal and spatial differentiation characteristics of the economic and transportation networks within an MA, exploring the dynamic coupling relationship between the two networks, and comparing the results among different MAs. Our findings will facilitate the development of more precise and targeted policies for MA planning.
2. Literature Review
2.1. The Impact of HSRs on Regional Economic Development
The current body of literature places a significant emphasis on the relationship between HSRs and regional economic growth. Numerous publications have demonstrated the crucial role of HSRs in stimulating regional economic development. Some of the key aspects of this relationship include the following. Primarily, some studies have examined the impact of HSRs on accessibility and population mobility. For instance, Kim and Sultana [19] assessed the accessibility implications of each stage of the Korea Train eXpress (KTX) network expansion, discovering various impacts from each phase of HSR extension. Wang et al. [20] examined the accessibility effects of the evolving HSR network in Jiangsu Province from 2010 to 2030, concluding that accessibility levels across the region will increase by approximately 9.6% as the HSR network grows, with greater gains in the peripheral areas. Monzon et al. [21] found that new HSR lines have significantly increased the accessibility levels of the Spanish population to most destinations, with an average improvement of 48.6% between 1990 and 2015. Liu et al. [22] observed a reduction in the inequality of accessibility and connectivity between economic regions and megalopolises from a network perspective, with decreased disparities between core and non-core cities in the same megalopolises. Secondly, various studies have investigated the impact of HSR on industry agglomeration and urban economic efficiency. Shao et al. [23] examined the effect of HSR service intensity on service industry agglomeration in the Yangtze River Delta (YRD) region and discovered that a higher HSR service intensity has a greater impact on service industry agglomeration. Li et al. [15] used China’s city-level panel data to demonstrate that the opening of HSRs has a significant positive effect on urban economic efficiency, and this effect increases with the length of the HSR service. Similarly, Wang and Dong [24] used China’s county-level panel data to study the impact of HSR connection on local economic growth and discovered that HSR connection promotes economic growth, with the effect becoming increasingly pronounced over time as the HSR service operates. Thirdly, some literature found that the opening of HSRs narrows the gap in regional economic development. For example, Chen and Haynes [16] demonstrated that the development of the HSR has reduced regional economic disparity and promoted regional economic convergence in China.
Despite the positive effects of the opening of HSRs, several studies have indicated that it can also lead to negative impacts. For instance, in addition to the economic benefits, the introduction of an HSR can increase air pollution Chen and Haynes [16], Yang et al. [25]. Furthermore, the opening of HSRs has been found to exacerbate regional economic differentiation. Jin et al. [26] verified that the HSR promotes local economic growth in China, but could also widen economic disparity. Meanwhile, from an industrial structure standpoint, Hu et al. [2] discovered that, in China’s YRD region, the negative impact of the HSR opening on regional economic development is greater when the industrial structure tends to be agricultural. Conversely, the positive impact of HSRs is greater when the industrial structure evolves to be service-oriented. This exacerbates the economic differentiation between cities with distinct industrial structures. Yoo et al. [27] conducted research on an HSR in Japan, specifically the Shinkansen, and discovered that the anticipated economic outcomes of the HSR may have both positive and negative impacts. Their findings revealed that, while the HSR brought economic benefits to developed areas, underdeveloped regions experienced negative or insignificant economic growth due to the introduction of the HSR.
The conflicting opinions on the HSR may be attributed to the differences in the research objects selected in the relevant literature, as well as varying economic foundations and policy orientations. Additionally, the impacts of HSRs on regional economic development may differ depending on the development stage of the HSRs or the economy. These differences underscore the heterogeneous impact of HSRs on regional economic development, emphasizing the need to examine and compare the internal impact in a more comprehensive and detailed manner, rather than solely assessing the overall impact.
2.2. The Impact of Regional Economy on the Development of HSRs
Undoubtedly, HSRs have a significant impact on regional economic development. However, the current literature primarily focuses on the influence of HSRs on regional economic development, disregarding the impact of the regional economy on the development of HSRs. In reality, the emergence of HSR stations and the augmentation of HSR services are intricately linked to the development progress of the local economy and the level of socio-economic interconnectedness between the surrounding areas and the local region [28]. Some studies have examined the drivers of HSR passenger demand from the perspective of service-related and socioeconomic factors; for example, Hu et al. [2], Mandel et al. [29], Börjesson [30], Cascetta and Coppola [31] and Jiang et al. [32] explicitly investigated the influence of economic complementarity on HSR passenger demand. Their findings revealed a positive correlation between population size, economic output, and HSR passenger demand. Similarly, Guo et al. [33] suggested that prioritizing the city population should be a key consideration when planning new HSR lines. The results of their study offer a more all-encompassing research structure for examining the relationship between HSR networks and economic networks.
2.3. Relationship between HSR Network and Economic Network
Based on the aforementioned literature, it is evident that the relationship between the HSR network and the economic network is reciprocal and mutually influential. Nevertheless, only a limited number of studies have concentrated on the bilateral impact of these two networks. Guo et al. [34] and Lv and Chen [35] both adopted a network perspective to investigate the relationship between HSRs and the economy. The former studied five Chinese urban agglomerations and discovered a robust coupling relationship between the HSR and economic expansion. Moreover, the HSR was observed to play a more significant role in stimulating urban integration and development in areas with more advanced economies. The latter concentrated on Hubei Province in China and revealed that, although the province’s level of coupling and coordination between the two networks increased, local imbalances persisted.
Studying the correlation between HSRs and regional economic networks, whether at the provincial or urban agglomeration level, can enhance people’s understanding of the relationship as a whole and the variability of the coupling relationship across different cities or urban agglomerations. Recently, China’s focus on developing MAs has increased in line with the international trend of using them as regional units to participate in global competition and international division of labor [36]. However, as urban agglomerations encompass more cities than MAs, they encounter greater challenges in achieving integrated development. To address this issue, a more detailed analysis of urban agglomerations should concentrate on the smaller competitive unit within them—the MA. This analysis explores the temporal and spatial characteristics of the development of HSR networks and economic networks from a microscopic perspective, including their relationship. Together with existing research, this forms a complete research system from cities to MAs and then to the entire urban agglomeration, enabling a targeted grasp of the development characteristics and laws of the two networks at different hierarchical levels. Research at the metropolitan level is crucial for the integrated development of the regional economy, and this paper fills the gap in the existing literature by examining the coupling relationship between HSR networks and economic networks from a more microscopic perspective of the MA.
3. Background, Data, and Methodology
3.1. Background and Data
The YRD region is one of the most-economically active regions in China and had a population exceed 237 million by the end of 2022, with an urbanization rate of over 60%. The GDP of the YRD region reached CNY 29.03 trillion during the year 2022, with Shanghai, Jiangsu Province, Zhejiang Province, and Anhui Province contributing a GDP of RMB 4.47 trillion, 12.29 trillion, 7.77 trillion, and 4.50 trillion, respectively (data source: the National Bureau of Statistics of China). The YRD region has contributed nearly a quarter of China’s total economic output, despite only occupying less than 4% of the country’s land area. Table 1 presents the economy and population statistics of the YRD region and six metropolitan areas over the sample period.

Table 1.
Statistics of the YRD region and six metropolitan areas.
The regional integration of the YRD was recognized as a national strategy in China in November 2018. On 1 December 2019, the “Outline of the YRD Regional Integration Development Plan” was published, which included a strong emphasis on advancing the growth of the MAs. The YRD region includes six widely accepted MAs, namely Shanghai, Hangzhou, Nanjing, Hefei, Su-Xi-Chang, and Ningbo, as shown in Figure 1.
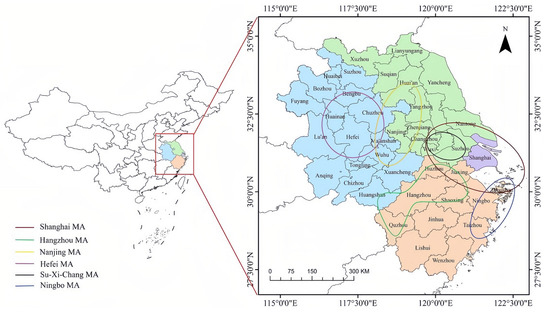
Figure 1.
Diagram of the MAs in the YRD Region of China.
The development of transportation infrastructure in the YRD region is also rapid. At present, the YRD region has formed a multi-directional external transportation corridor and inter-city integrated transportation network dominated by highways and rail transit. According to the “2020 YRD Transportation Integration Development Annual Report”, in 2019, highways accounted for 70.2% of the passenger transportation structure in the YRD; highways accounted for 59.3% of the freight transportation structure in the YRD. Factors such as talents, technology, and materials are flowing rapidly in the YRD, and the extensive highway network is indispensable. Not only are all roads connected, in recent years, the integration of transportation in the YRD has also made great efforts to open up provincial “dead-end roads”.
In terms of rail transit construction, according to the “YRD Multi-level Rail Transit Planning” issued by the National Development and Reform Commission in June 2021, by 2025, the YRD region will basically build a “YRD on track” and form a multi-level rail transit system consisting of trunk railways, intercity railways, urban (suburban) railways, and urban rail transit. The total mileage of rail transit will reach more than 22,000 km, with an increase of more than 8000 km.
The development of the HSR in the YRD region is impressive. At present, many HSRs such as Beijing–Shanghai HSR, Shanghai–Nanjing HSR, Shanghai–Hangzhou HSR, Nanjing–Hangzhou HSR, Hangzhou–Ningbo HSR, and Hangzhou–Changsha HSR have been opened to traffic. As of the end of 2021, the operating mileage of the HSR in the YRD region reached 6329 km, accounting for nearly half of the operating mileage of the YRD railway, and it is the densest HSR network area in China.
Due to the fast and steady growth of the economy, as well as the transportation networks, the YRD region provides an excellent environment for investigating the interdependent connection between these two networks. Meanwhile, given the availability of data, this work chose the HSR network in transportation networks as the research object. The aim of this research was to analyze how economic development and HSR networks are interconnected in the MAs. In light of the integrated development strategy of the YRD region, cross-regional barriers are reduced, which makes the performance of different MAs more comparable. This paper focused on analyzing the coupling relationship between the HSR network and economic network in each MA in the YRD region of China. Based on the availability of relevant data, the sample period spanned from 2009 to 2020.
According to the definition of the International Union of Railways, HSR refers to a railway system with an operating speed of 200 km per hour. At present, most of the newly built HSRs in various countries set the maximum speed at 250–350 km/h [37]. This paper followed the definition of China’s HSR, that is, newly-built EMU trains designed to run at 250 km/h (including reserved) and above and passenger-dedicated railways with an initial operating speed of no less than 200 km/h. The data related to the HSR were extracted from the National Railway Passenger Timetable and the website of the China Railway Customer Service Center (http://www.12306.cn/ (accessed on 11 December 2022)) over the sample period, while the population and economic data were obtained from the City Statistical Yearbooks of China.
3.2. Analysis Method of HSR Network
In this study, the spatial structure of the traffic network in each MA and in the YRD region were examined using the Social Network Analysis (SNA) method. The network was constructed by considering the prefecture-level and above cities as nodes and the traffic frequency between them as edges.
The network density, which measures the interconnectedness between nodes, was used as a metric to describe the density of the edges in the network. Its expression is:
where D represents the density of the HSR network, reflecting the concentration of HSRs in the region; N represents the number of nodes in the network, which corresponds to the number of prefecture-level and above cities in the region; L is used to denote the number of edges between two nodes, indicating the number of nodes that are directly linked by the HSR between any two cities in the region.
Degree centrality is a network metric that assesses the significance of nodes in a network. The degree of a node refers to the number of nodes directly linked to it. Nodes with a er degree have more connections and exert a greater influence in the network. However, the traditional degree centrality measure ignores the weights of the connections between nodes, i.e., the strength of the relationships between nodes that are connected multiple times. In the HSR network, the traffic frequency between cities represents the weight of the edge. To address this, this study used a weighted degree centrality measure to evaluate the structural properties of the metropolitan HSR network. The equation for weighted degree centrality is given by:
In this context, is a binary variable that takes the value 1 if there exists an HSR link between city i and city j, and 0 otherwise. The weight of the connection between city i and city j is denoted as , which represents the daily traffic frequency. In this study, both centrality and weighted centrality measures were assumed to have an equal impact on urban nodes, and a value of 0.5 was assigned to the adjustment parameter a, as proposed in the work of Opsahl et al. [38].
It can be seen from the above equation that the larger the network size, the higher the maximum possible value of degree centrality is. In order to eliminate the impact of network scale changes on degree centrality and make the importance of nodes in different regional transportation networks comparable, the above expression was standardized, and the expression is:
3.3. Analysis Method of Economic Network
The regional economic network connection can be measured by examining the interaction and relationships between economic entities and regions, which form the regional economic network. This is an important basis for measuring the level of regional economic development. This paper adopted the gravity model, which is the most-commonly used method to measure regional economic linkages. The method began in 1929 when Reilly borrowed Newton’s mechanics-gravity model. It was first introduced by tinbergen [39] and Pöyhönen [40] independently in the field of economics. Its general expression is:
where is the strength of the economic network connection between city i and city j; P represents the population of a city, which is measured by the permanent population in this paper; E represents the economy of a city, which is represented by the actual GDP of a city in this paper (deflating by taking 2008 as the base period); is the spherical distance between city i and city j; b is the gravitational attenuation index, which usually takes a value of 2 [34,41].
The general expression suggests an ideal equivalence relationship between the economic networks of two cities. However, in reality, a city with a higher level of economic development has a greater impact on the surrounding cities [42,43]. Therefore, it is directional in economic connections between regions, i.e., the economic attraction of city i to city j is different from its reverse economic radiation force. To address this, a parameter should be introduced to correct for this inequality. This parameter ensures that the GDP proportion of the two cities reflects the degree of mutual influence. The gravity model has been revised as follows:
Using this model, additional expressions related to the strength of the economic network connection can be derived:
where represents the total strength of the economic network connection between city i and other cities in the region, reflecting the economic network connection of all other cities in the region of city i. is the membership degree of city i’s economic network connection, reflecting the city i’s degree of importance in the regional economic network. In this paper, the city j with the highest value of is referred to as the primary choice for city i’s economic network connection within the region. This was calculated using Ucinet.
3.4. Analysis Method of Network Coupling Relationship
This study used the Quadratic Assignment Procedure (QAP) to examine the coupling relationship between the two networks of the HSR and the economy. The QAP is a non-parametric test method based on a random permutation, which is often used in the correlation study between two matrices [44]. It compares each grid value in the matrix, gives the correlation coefficient between the two matrices, and performs a non-parametric test on the coefficient at the same time.
As HSR networks and regional economies continue to grow, the spatio-temporal distribution and coupling relationship between these networks will also evolve. Thus, it is crucial to examine the dynamic coupling relationship between these networks, as it can reveal the trends and development processes of their relationship. The findings of such studies could help cities develop appropriate urban policies for both HSR infrastructure construction and economic development.
4. Results and Analysis
4.1. HSR Network Analysis
In April 2008, the Hening HSR (Hefei–Nanjing) was opened in eastern China’s YRD region with a speed of 250 km/h. The railway significantly reduced the travel time between Hefei, Nanjing, and Shanghai and facilitated the integration of the YRD region [45]. Since then, the HSR network has rapidly developed in the YRD, improving accessibility and promoting the flow of production factors between cities. China’s administrative divisions are categorized into municipalities directly under the Central Government, provincial capital cities, and prefecture-level cities. A directly controlled municipality refers to an urban administrative unit directly under the jurisdiction of the central government, which enjoys provincial-level administrative power. Municipalities directly under the Central Government such as Shanghai and provincial capitals such as Nanjing, Hangzhou, and Hefei are now connected to more surrounding cities as the HSR network continues to expand and densify, as shown in Figure 2.
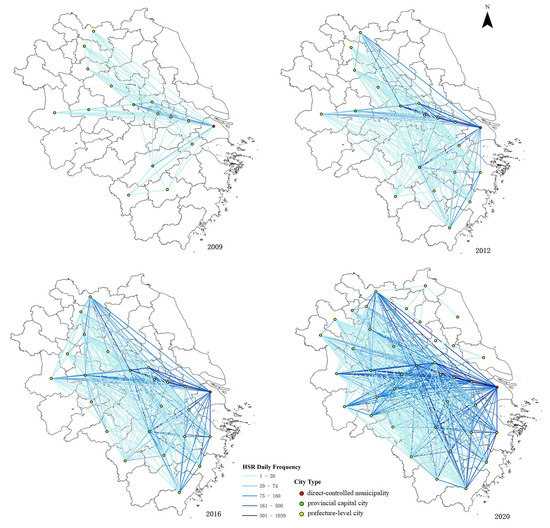
Figure 2.
Evolution of the frequency of HSRs in the YRD region.
By applying Equation (1), Figure 3 illustrates the changes in the HSR network density across the YRD region and the six MAs from 2009 to 2020. The figure shows a consistent increase in HSR density in the region, rising from 0.09 in 2009 to 0.51 in 2020. However, the Nanjing MA displays weak HSR connectivity, with the lowest network density in the region. Being the first inter-provincial MA in China and spanning Jiangsu and Anhui Provinces, different development policy ideas and administrative barriers hinder the coordination and cooperation necessary for resource utilization and production factor allocation, affecting regional HSR network development.
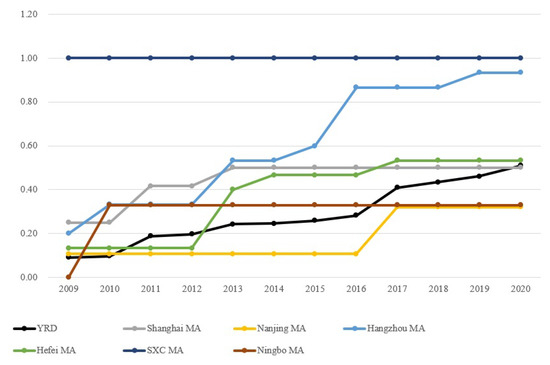
Figure 3.
HSR network density of the MA in the YRD of China.
The Su-Xi-Chang MA in Jiangsu Province was the first to achieve full connectivity of the HSR within the MA. The Hangzhou MA has the fastest-growing network density, which increased from 0.2 in 2009 to 0.93 in 2020, despite being composed of members from Zhejiang and Anhui Provinces. The Shanghai MA comprises cities from Jiangsu Province, Zhejiang Province, and the Shanghai area, with no new prefecture-level cities joining the HSR network since the network density reached 0.5 in 2013. Nantong and Zhoushan have not yet opened their HSR. The Hefei MA, consisting of all cities within Anhui Province, underwent rapid growth between 2009 and 2017. However, no new cities were added to the HSR network after its density reached 0.53 in 2017. The Ningbo MA comprises three cities from Zhejiang Province, and its HSR network density has remained at 0.33 since 2010 due to Zhoushan’s lack of HSR connections.
According to Equation (3), we calculated the standard degree centrality of the HSR network of cities at the prefectural level and above in the YRD region, respectively, in 2009, 2012, 2016, and 2020. The top ten cities are displayed in Table 2 for trend and comparative analysis. The results showed that the shortlisted cities were relatively stable, and the degree centrality of the HSR network in each city showed an upward trend year by year. Among them, Shanghai and Nanjing are important transportation hubs in the region. The cities of Suzhou, Wuxi, and Changzhou (also members of the Shanghai MA) that make up the Su-Xi-Chang MA and the city of Hangzhou in the Hangzhou MA also play an important role in the YRD HSR network. In addition, the city of Zhenjiang in the Nanjing MA, the cities of Hefei and Lu’an in the Hefei MA, the city of Ningbo in the Ningbo MA, and the cities of Xuzhou and Wenzhou, which are not planned into these six MAs, also entered the top ten lists.
Table 2.
Top 10 normalized degree centrality cities of HSR networks in YRD region.
As one of the four major municipalities directly under the central government in China, Shanghai has always been in a leading position in economic development in the country. As provincial capitals, Nanjing and Hangzhou are also the central cities of their respective metropolitan areas, and they are responsible for the important mission of radiating and driving the development of surrounding cities. The National Plan for the Development of Urban Agglomerations in the YRD requires that the Su-Xi-Chang MA comprehensively strengthen its connection and interaction with Shanghai. It can be seen from Table 1 that, although only three cities are included, the GDP of the Su-Xi-Chang MA has been higher than that of the Hangzhou MA and the Nanjing MA in recent years. Judging from the statistical results of the degree centrality of the HSR network, in the YRD region, the cities with strong HSR network importance are cities with high administrative levels and leading economic development in the region.
The degree centrality results for the HSR network in each MA are presented in Table 3. The results for the Su-Xi-Chang and Ningbo MAs are not presented in this table as the former one is included in the Shanghai MA and the latter one only has two cities that have had the HSR introduced. The results for these two MAs are also not reported in all subsequent tests. In the Shanghai MA, the degree centrality of the HSR network is highest in the central city of Shanghai, while the following Wuxi City and Suzhou City exhibit relatively similar levels of significance in this regard. These three cities exhibit a trend of initially increasing and then decreasing, with overall stability. In the Hangzhou MA, Hangzhou has the highest degree centrality, which is significantly higher than the second-ranked city in the later stages of the study. In 2020, Shaoxing is expected to surpass Jiaxing to become a secondary city of the HSR network. In the Nanjing MA, the cities of Nanjing and Zhenjiang have consistently held the first and second positions and have gradually increased in importance over time. In 2020, Ma’anshan in Anhui Province surpassed Chuzhou, also located in the same province as Nanjing, to become the third-most-important city in the HSR network. The HSR network in the Hefei MA is primarily dominated by the central city of Hefei, which holds the highest degree of centrality. According to the statistical findings, the central cities in the four major MA hold the most-significant influence within their respective regions’ HSR network.
Table 3.
Top 3 normalized degree centrality cities of HSR networks.
4.2. Economic Network Analysis
Generally, cities with higher administrative levels enjoy more plentiful production resources and greater policy support, resulting in higher prioritization for economic development [46]. These larger cities often act as the center of an urban agglomeration, which then radiates and drives the development of surrounding cities, ultimately leading to the formation of a highly integrated MA with shared resources.
Utilizing Equation (5), the gravitational value of economic ties between two cities within the four metropolitan regions of the YRD was determined for the years 2009, 2012, 2016, and 2020. The city with the strongest economic connection was identified for each city. Figure 4, Figure 5, Figure 6 and Figure 7 illustrate the changes in the gravity value of each MA over time. It is apparent that the spatial structures of the HSR network of the various MAs differ.
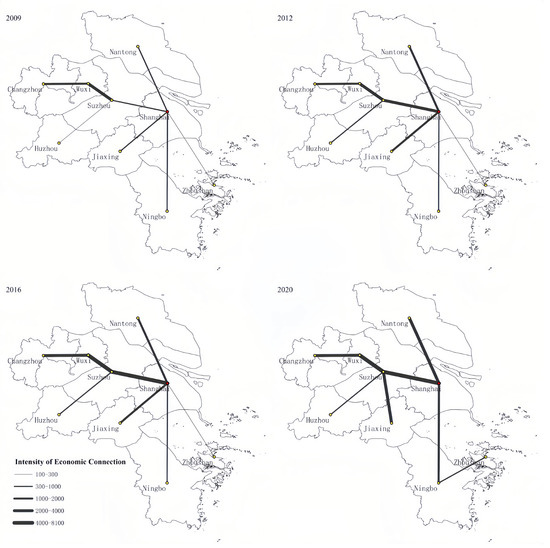
Figure 4.
Evolution of economic linkage value in Shanghai MA.
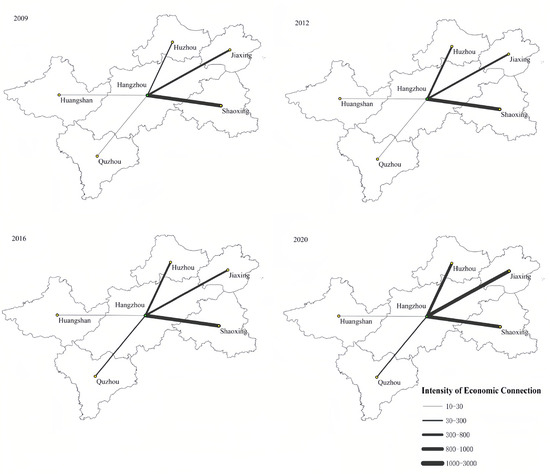
Figure 5.
Evolution of economic linkage value in Hangzhou MA.
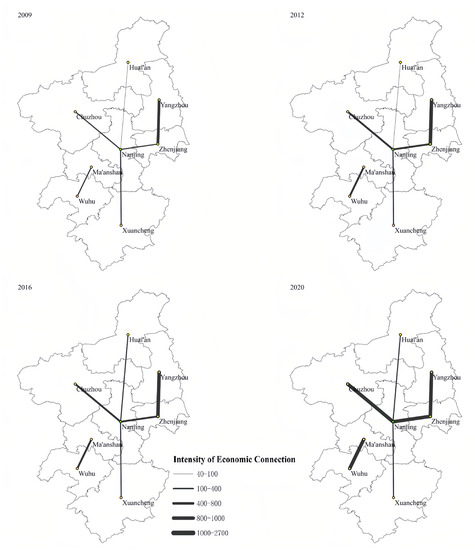
Figure 6.
Evolution of economic linkage value in Nanjing MA.
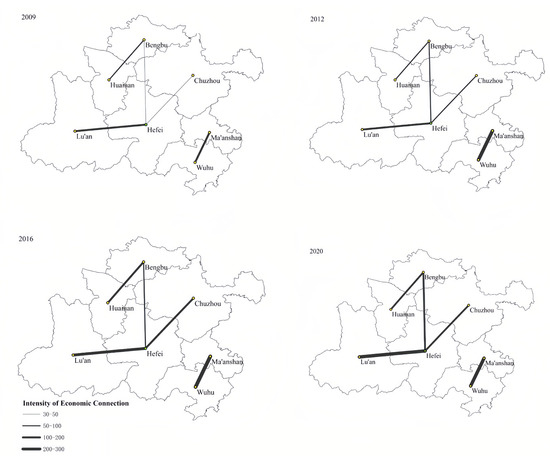
Figure 7.
Evolution of economic linkage value in Hefei MA.
In 2009, Shanghai acted as the central city within the Shanghai MA, as shown in Figure 4, maintaining close economic connections with neighboring cities. The significance of Wuxi and Suzhou within the economic network of the region cannot be ignored. Over time, the economic ties between Shanghai, Suzhou, and Wuxi with other nearby cities have continuously strengthened. By 2020, Suzhou had taken on an important role in the economic development of Jiaxing, replacing Shanghai, while Ningbo had surpassed Shanghai as the city with the closest economic ties to Zhoushan. It is evident that the significance of Suzhou is growing rapidly. It has the potential to become a sub-center that is second only to Shanghai and can take over some of the central city’s functions. The formation of the Suzhou sub-center or the Shanghai-Suzhou dual-core model will be conducive to the integrated development of the Shanghai MA.
The Hangzhou MA in Figure 5 displays clear characteristics of a single-center structure. Surrounding cities have been strengthening their economic ties with Hangzhou, the central city, with the exception of Huangshan, which is a trans-provincial city. In the Nanjing MA of Figure 6, approximately half of the cities have close economic ties with Nanjing, the central city. Zhenjiang, not Nanjing, has the closest economic ties with Yangzhou. Wuhu and Ma’anshan, which are inter-provincial cities, prioritize economic ties with each other rather than with the central city of Nanjing, resulting in weak ties between them. Consequently, Zhenjiang’s role is continually growing in the economic network of the Nanjing MA, while Wuhu and Ma’anshan are not well integrated into this network. These two cities also belong to the Hefei MA and the same province as the central city Hefei, but Hefei also has less impact on their economic development, as indicated in Figure 7.
In this paper, the economic network membership of prefecture-level and higher cities in the YRD region was calculated using Equation (7), and the top ten cities in 2009, 2012, 2016, and 2020 are displayed in Table 4. These cities have played significant roles in the region’s economic development. According to the results, Suzhou surpassed Shanghai in 2020, becoming the city with the most-advantageous economic location in the region and having the highest radiation intensity to the surrounding cities. Wuxi, Hangzhou, Nanjing, and Changzhou all maintained relatively stable economic membership and rankings, besides Shanghai and Suzhou. The importance of Nantong and Jiaxing in regional economic development increased in 2020. The cities with the highest economic importance in the YRD are mainly from the Shanghai MA and the Suxi-Changzhou MA (part of the Shanghai MA), followed by the Hangzhou MA and the Nanjing MA. Ningbo city in the Ningbo MA ranks eighth, while the Hefei MA has no city in the top ten in terms of degree of economic membership.
Table 4.
Top 10 preferred cities of economic connection in YRD region.
The results above examined and evaluated the complete economic connections between two cities, and therefore, the gravitational values mentioned are not directional. It is important to note that, due to variations in administrative levels, economic development foundations, and geographical locations, the gravitational impact of economic ties between two cities is not identical. This study employed the gravity Equation (5) to determine the gravity value of each city in the metropolitan region in relation to other cities. The evolution of the total foreign economic relationships of each city in the four metropolitan regions of the YRD from 2009 to 2020 is demonstrated in Figure 8, Figure 9, Figure 10 and Figure 11. As per the figures, there was an overall upward trend in the total external economic ties of cities within each MA, suggesting that the economic links between cities in the MA are progressively becoming stronger. This, in turn, will help to reinforce the integration and growth of the overall economy of the metropolitan region.
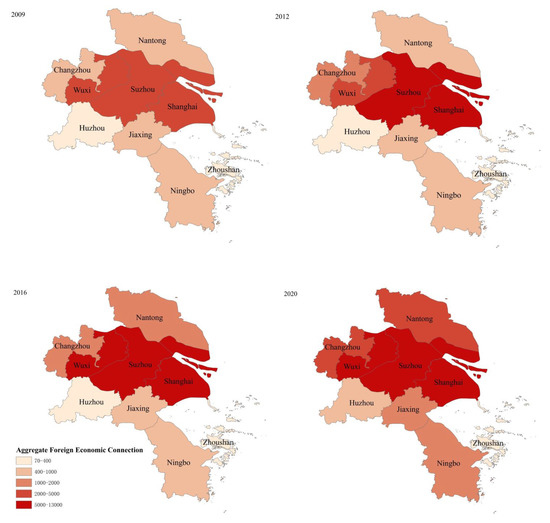
Figure 8.
Total foreign economic relations of prefecture-level cities within the Shanghai MA.
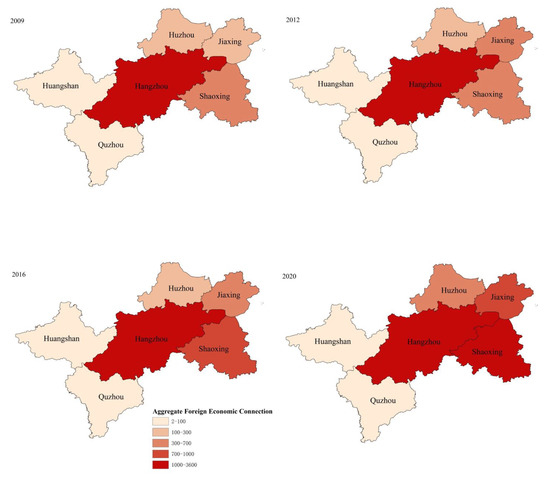
Figure 9.
Total foreign economic relations of prefecture-level cities within the Hangzhou MA.
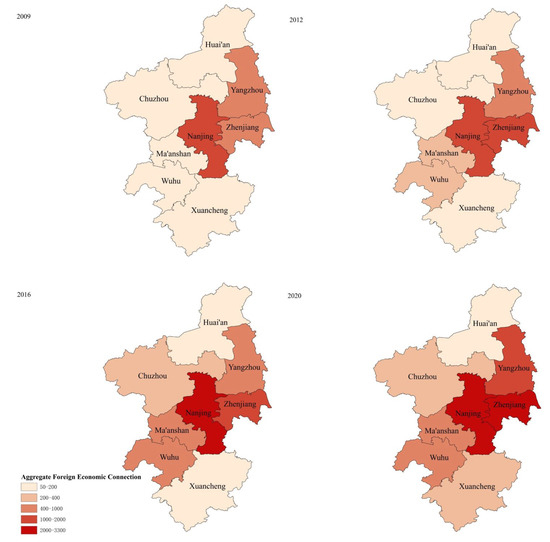
Figure 10.
Total foreign economic relations of prefecture-level cities within the Nanjing MA.
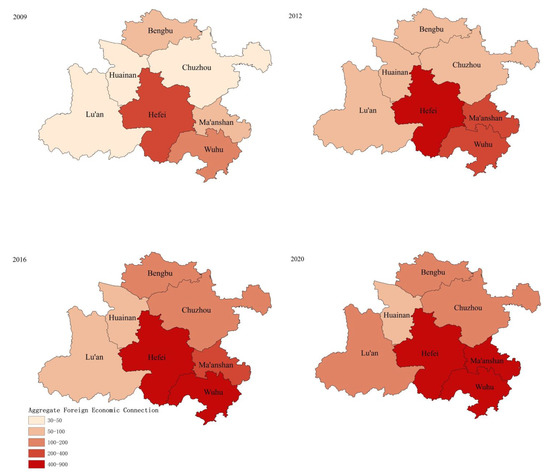
Figure 11.
Total foreign economic relations of prefecture-level cities within the Hefei MA.
Specifically, the Shanghai MA in Figure 8 is centered on Shanghai, a super-large city and a municipality under the Central Government, and extends outward to seven prefecture-level cities, including Suzhou, Wuxi, Nantong, Changzhou, Jiaxing, Ningbo, and Zhoushan. Although the total number of connections has grown considerably, it is evident that the foreign economic connections of Suzhou, Wuxi, Changzhou, and Nantong, which are part of Jiangsu Province, are higher than those of Huzhou, Jiaxing, and Ningbo, which belong to Zhejiang Province. Therefore, it is evident that there is a noticeable geographical phenomenon of strong economic ties in the north and weak ties in the south within the Shanghai MA. Furthermore, from an administrative perspective, the economic connections of cities under the jurisdiction of Jiangsu Province are robust, while those of cities under the jurisdiction of Zhejiang Province are weaker.
As shown in Figure 9, the Hangzhou MA has Hangzhou, the provincial capital, as its central city, and it extends to Shaoxing, Jiaxing, Huzhou, Quzhou, and Huangshan. Within the MA, Shaoxing, Jiaxing, and Huzhou, which are in the same province as Hangzhou, have seen a clear increase in their foreign economic ties. On the other hand, Quzhou City, which is not adjacent to these three cities despite being in Zhejiang Province, and Huangshan City, which belongs to Anhui Province, have not displayed significantly enhanced economic connections with other cities in the MA. This indicates that the economic links within the Hangzhou MA demonstrate a relatively clear trend of being stronger in the east and weaker in the west, considering the geographical space. Furthermore, in terms of administrative divisions, cities that are located within the same province as the central city and have advantageous locations show strong economic ties, while cities with inter-provincial locations have weaker economic connections.
The Nanjing MA of Figure 10 is centered on the provincial capital of Nanjing and extends to Zhenjiang, Yangzhou, Huai’an, Chuzhou, Ma’anshan, Wuhu, and Xuancheng. Economic connections between Nanjing and Zhenjiang, as well as Yangzhou, both within the same province, have increased significantly, while connections with Huai’an, which is not adjacent to Nanjing, remain relatively weak. The total foreign economic ties of Ma’anshan, Wuhu, Chuzhou, and Xuancheng have also increased to varying degrees. This indicates that, geographically, the economic connections within the Nanjing MA exhibit a clear pattern of central strength and peripheral weakness. Administratively, cities within the same province and with location advantages have stronger economic ties to the central city than inter-provincial cities. Meanwhile, cities within the same province as the central city, but without location advantages have weaker economic ties.
As indicated in Figure 11, the Hefei MA is centered on the provincial capital city of Hefei and radiates outwards to include cities such as Wuhu, Ma’anshan, Chuzhou, Bengbu, Huainan, and Lu’an. Among them, Wuhu and Ma’anshan have the most-prominent external economic connections, followed by Bengbu, Chuzhou, and Lu’an, with weaker performance observed in Huainan. As all cities in the Hefei urban agglomeration are located within Anhui Province, there are no political barriers across provinces, and the overall economic connections present a pattern of strong central linkage and weak peripheral linkage. However, compared to the aforementioned three urban agglomerations, as of 2020, the overall economic connections within the Hefei urban agglomeration are relatively balanced.
4.3. Network Coupling Relationship Analysis
This study focused on comparing the HSR network and urban economic gravity network of six MAs within the YRD region of China. By doing so, it aimed to reduce the impact of administrative divisions and geographical locations, which can cause heterogeneity, and make the network relationships between different regions more comparable.
As shown in Table 5, the results of the QAP analysis indicated a significant positive correlation between the development of HSR networks and economic growth in the YRD region as a whole, with a significant coupling relationship at the 1% level. This is consistent with the findings in Guo et al. [34].
Table 5.
Coupling relationship between HSR and economic networks (QAP values).
However, the results revealed significant differences in the performance of different MAs regarding the coupling relationship between the HSR and regional economic networks. Specifically, the development of the HSR network and economic growth in the Shanghai and Hangzhou MAs showed a significant positive correlation, with coupling coefficients significant at the level of 5% or 1% (except for the Hangzhou MA in 2009). Additionally, their correlation coefficients displayed a steady growth trend over time. In contrast, the Nanjing and Hefei MAs did not exhibit a significant coupling relationship between their HSR and economic networks. The results indicated that the development of the HSR network has stimulated regional economic growth in both the Shanghai and Hangzhou MAs. Furthermore, the integrated development of the respective economies of these two MA has facilitated the further development of the HSR network, creating a mutually beneficial development model.
In contrast, the Nanjing and Hefei MAs did not exhibit a significant coupling relationship between their HSR and economic networks. This indicates that the coupling relationship between the HSR and economic networks at the level of an urban agglomeration does not necessarily translate to similar performance in all subsets within the region. Hence, there is a need to narrow down the research scope from the largest urban agglomeration to the inner urban agglomeration level. This study addressed the gap in existing research by focusing on a microscopic level of MA.
Based on the socio-economic development indicators presented in Table 1, the Nanjing and Hangzhou MAs show similarities, yet their network coupling performances differ significantly. From the perspective of urban integration development, a comprehensive evaluation of the HSR and economic networks highlights the inferior performance of the Nanjing MA. One potential factor is the hindrance caused by cross-provincial administrative barriers, impeding the development of these networks and influencing their coupling relationship. Despite both MAs encompassing cities from Anhui Province, the proportion differs considerably, with half of the cities in the Nanjing MA originating from Anhui Province, compared to only one city in the Hangzhou MA. Therefore, achieving integrated development becomes more challenging in the presence of increased cross-regional administrative barriers and communication costs.
The Hefei MA comprises cities solely from Anhui Province, without any political barriers across administrative regions. Although Hefei is in the leading position in economic development in the province, it seems that it is still difficult to achieve the driving effect of Shanghai or Hangzhou on surrounding cities. Insufficient energy radiated and driven by the central city to surrounding areas may account for the inadequate coupling between the two networks in the Hefei MA and possibly in the Nanjing MA as well.
5. Conclusions
The MA has emerged as a critical type of urban spatial organization during the process of modern economic and social development. In the early stages of urbanization reform, the Chinese government primarily focused on county and city administrative units as the primary subjects of reform. However, in recent years, planning and reform initiatives centered on the development of urban agglomerations, and MAs have been continually introduced. The MA serves as a globally competitive unit for regional economies, an organic component that facilitates the development of urban agglomerations, and an essential assurance for the integrated and sustainable development of regional economies.
It is evident that focusing on the development of MAs is crucial. From an academic standpoint, this research employed methods such as social network analysis, gravity models, and the QAP method to examine the development pattern and dynamic coupling between the transportation and economic networks of the MAs, providing a comprehensive description of the spatio-temporal distribution features of MA development. The perspective and methodology adopted in this study enhance the research and discussion of MA development in the field of regional economics. From a practical perspective, the findings of this research can reveal the current state and spatial distribution traits of MA integration, facilitating the identification of urgent needs during the development process, the resolution of problems, and the formulation of targeted recommendations.
The conclusions of this study encompass the following aspects. Firstly, with regard to the transportation network, the HSR network in the YRD region and various MAs is continuously expanding, with an increase in service frequency and network density. The Hangzhou MA has the highest network density, while the Nanjing MA has the lowest. The most-significant hub cities in the HSR network covering the YRD are cities with high administrative levels or those with leading economic development. In the HSR network of the four MAs, the central cities are the most-important hub cities. Secondly, in terms of economic links, the Hangzhou MA exhibits a typical single-center structure. Except for the trans-provincial city of Huangshan, the central city of Hangzhou has progressively strengthened its economic connections with neighboring cities. The central cities of some MAs lack economic links with some cities, such as the Hefei MA and the Nanjing MA, where Ma’anshan and Wuhu, belonging to both MAs, exhibit weak links with the central cities in both. In the Shanghai MA, the functions of central cities in the economic network are gradually being assumed by surrounding cities. Cities such as Suzhou, Ningbo, and Wuxi are increasingly playing prominent roles in the economic network. Thirdly, the geographical and spatial distribution of foreign economic ties varies among MAs in terms of their total amounts. However, a general pattern can be observed: cities located outside the central province of an MA tend to have significantly lower total foreign economic ties compared to cities within the same province as the central city. Moreover, the Shanghai MA, which covers three administrative divisions, exhibits higher total foreign economic connections among cities in Jiangsu Province compared to cities in Zhejiang Province.
Based on the test results and analysis of this study, it is evident that the MA in the YRD region of China has undergone significant development, with a continuous improvement in the accessibility between cities and strengthened economic ties. The central city in the plan has played a crucial role in driving the economic development of surrounding cities to varying degrees, providing further evidence of the plan’s rationality. However, the study also revealed that the development of the MAs in the YRD region is still not fully mature, requiring improved integrated development. Moreover, there are still significant challenges that persist, including cross-provincial administrative barriers, inequality in development caused by inequality in administrative levels, and lack of driving force in central cities.
The planning of MAs that span across administrative regions is unavoidable. On the one hand, some inter-provincial cities have a natural location advantage as they are bordered by economically developed cities. On the other hand, inter-provincial planning of MA facilitates the integrated development of a wider range of urban agglomerations. The integration of governance is a prerequisite for achieving economic integration development. The planning and development of MAs should explore and innovate cross-administrative governance to break down political barriers. Similarly, the problem of development caused by the “pyramid” administrative division framework also requires more innovations in governance methods and policy guidance to resolve.
Undoubtedly, the planned central city serves as the economic development hub of an MA. One strategy is to optimize the industrial structure by establishing a reasonable industrial structure gradient, forming complete industrial chains and advantageous industrial clusters to address the low economic driving ability of some central cities. Additionally, creating an inclusive and open development environment and cultivating new economic growth poles in the MA can help alleviate the burden of megacities driving economic development in surrounding cities and assist less capable cities.
Author Contributions
Conceptualization, G.M., J.H. and R.Z.; data curation, G.M.; formal analysis, G.M., J.H. and R.Z.; investigation, G.M., J.H. and R.Z.; methodology, G.M. and J.H.; project administration, G.M., J.H. and R.Z.; resources, G.M., J.H. and R.Z.; software, G.M.; supervision, G.M. and J.H.; validation, G.M.; visualization, G.M.; writing—original draft, G.M.; writing—review and editing, G.M., J.H. and R.Z. All authors have read and agreed to the published version of the manuscript.
Funding
This research was funded by the Fundamental Research Funds for the Central Universities: 2021ECNU-HWCBFBLW004.
Institutional Review Board Statement
Not applicable.
Informed Consent Statement
Not applicable.
Data Availability Statement
Upon request.
Conflicts of Interest
The authors declare no conflict of interest.
References
- LeGates, R.T.; Stout, F. The City Reader; Routledge: London, UK, 2011; pp. 189–190. [Google Scholar]
- Hu, J.; Ma, G.; Shen, C.; Zhou, X. Impact of Urbanization through High-Speed Rail on Regional Development with the Interaction of Socioeconomic Factors: A View of Regional Industrial Structure. Land 2022, 11, 1790. [Google Scholar] [CrossRef]
- Antrop, M. Landscape change and the urbanization process in Europe. Landsc. Urban Plan. 2004, 67, 9–26. [Google Scholar] [CrossRef]
- Glaeser, E.L.; Kahn, M.E.; Rappaport, J. Why do the poor live in cities? The role of public transportation. J. Urban Econ. 2008, 63, 1–24. [Google Scholar] [CrossRef]
- Maparu, T.S.; Mazumder, T.N. Transport infrastructure, economic development and urbanization in India (1990–2011): Is there any causal relationship? Transp. Res. Part A Policy Pract. 2017, 100, 319–336. [Google Scholar] [CrossRef]
- Yuan, X.; Li, X. The evolution of the industrial value chain in China’s high-speed rail driven by innovation policies: A patent analysis. Technol. Forecast. Soc. Chang. 2021, 172, 121054. [Google Scholar] [CrossRef]
- Liu, L.; Zhang, M. High-speed rail impacts on travel times, accessibility, and economic productivity: A benchmarking analysis in city-cluster regions of China. J. Transp. Geogr. 2018, 73, 25–40. [Google Scholar] [CrossRef]
- Heuermann, D.F.; Schmieder, J.F. The effect of infrastructure on worker mobility: Evidence from high-speed rail expansion in Germany. J. Econ. Geogr. 2019, 19, 335–372. [Google Scholar] [CrossRef]
- Guirao, B.; Casado-Sanz, N.; Campa, J.L. Labour opportunities provided by Spanish high-speed rail (HSR) commuting services in a period of financial crisis: An approach based on regional wage disparities and housing rental prices. Reg. Stud. 2020, 54, 539–549. [Google Scholar] [CrossRef]
- Komikado, H.; Morikawa, S.; Bhatt, A.; Kato, H. High-speed rail, inter-regional accessibility, and regional innovation: Evidence from Japan. Technol. Forecast. Soc. Chang. 2021, 167, 120697. [Google Scholar] [CrossRef]
- Chen, C.L.; Vickerman, R. Can transport infrastructure change regions’ economic fortunes? Some evidence from Europe and China. Reg. Stud. 2017, 51, 144–160. [Google Scholar] [CrossRef]
- Fang, C. Important progress and future direction of studies on China’s urban agglomerations. J. Geogr. Sci. 2015, 25, 1003–1024. [Google Scholar] [CrossRef]
- Kim, K.S. High-speed rail developments and spatial restructuring: A case study of the Capital region in South Korea. Cities 2000, 17, 251–262. [Google Scholar] [CrossRef]
- Ahlfeldt, G.M.; Feddersen, A. From periphery to core: Measuring agglomeration effects using high-speed rail. J. Econ. Geogr. 2018, 18, 355–390. [Google Scholar] [CrossRef]
- Li, Y.; Chen, Z.; Wang, P. Impact of high-speed rail on urban economic efficiency in China. Transp. Policy 2020, 97, 220–231. [Google Scholar] [CrossRef]
- Chen, Z.; Haynes, K.E. Impact of high-speed rail on regional economic disparity in China. J. Transp. Geogr. 2017, 65, 80–91. [Google Scholar] [CrossRef]
- Xu, W.; Huang, Y. The correlation between HSR construction and economic development–Empirical study of Chinese cities. Transp. Res. Part A Policy Pract. 2019, 126, 24–36. [Google Scholar]
- Jiao, J.; Wang, J.; Zhang, F.; Jin, F.; Liu, W. Roles of accessibility, connectivity and spatial interdependence in realizing the economic impact of high-speed rail: Evidence from China. Transp. Policy 2020, 91, 1–15. [Google Scholar] [CrossRef]
- Kim, H.; Sultana, S. The impacts of high-speed rail extensions on accessibility and spatial equity changes in South Korea from 2004 to 2018. J. Transp. Geogr. 2015, 45, 48–61. [Google Scholar] [CrossRef]
- Wang, L.; Liu, Y.; Sun, C.; Liu, Y. Accessibility impact of the present and future high-speed rail network: A case study of Jiangsu Province, China. J. Transp. Geogr. 2016, 54, 161–172. [Google Scholar] [CrossRef]
- Monzon, A.; Lopez, E.; Ortega, E. Has HSR improved territorial cohesion in Spain? An accessibility analysis of the first 25 years: 1990–2015. Eur. Plan. Stud. 2019, 27, 513–532. [Google Scholar] [CrossRef]
- Liu, S.; Wan, Y.; Zhang, A. Does China’s high-speed rail development lead to regional disparities? A network perspective. Transp. Res. Part A Policy Pract. 2020, 138, 299–321. [Google Scholar] [CrossRef] [PubMed]
- Shao, S.; Tian, Z.; Yang, L. High speed rail and urban service industry agglomeration: Evidence from China’s Yangtze River Delta region. J. Transp. Geogr. 2017, 64, 174–183. [Google Scholar] [CrossRef]
- Wang, Y.; Dong, W. How China’s high-speed rail promote local economy: New evidence from county-level panel data. Int. Rev. Econ. Financ. 2022, 80, 67–81. [Google Scholar] [CrossRef]
- Yang, Q.; Wang, Y.; Liu, Y.; Liu, J.; Hu, X.; Ma, J.; Wang, X.; Wan, Y.; Hu, J.; Zhang, Z.; et al. The impact of China’s high-speed rail investment on regional economy and air pollution emissions. J. Environ. Sci. 2023, 131, 26–36. [Google Scholar] [CrossRef] [PubMed]
- Jin, M.; Lin, K.C.; Shi, W.; Lee, P.T.; Li, K.X. Impacts of high-speed railways on economic growth and disparity in China. Transp. Res. Part A Policy Pract. 2020, 138, 158–171. [Google Scholar] [CrossRef]
- Yoo, S.; Kumagai, J.; Kawasaki, K.; Hong, S.; Zhang, B.; Shimamura, T.; Managi, S. Double-edged Trains: Economic outcomes and regional disparity of high-speed railways. Transp. Policy 2023, 133, 120–133. [Google Scholar] [CrossRef]
- Lao, X.; Zhang, X.; Shen, T.; Skitmore, M. Comparing China’s city transportation and economic networks. Cities 2016, 53, 43–50. [Google Scholar] [CrossRef]
- Mandel, B.; Gaudry, M.; Rothengatter, W. A disaggregate Box-Cox Logit mode choice model of intercity passenger travel in Germany and its implications for high-speed rail demand forecasts. Ann. Reg. Sci. 1997, 31, 99–120. [Google Scholar] [CrossRef]
- Börjesson, M. Forecasting demand for high speed rail. Transp. Res. Part A Policy Pract. 2014, 70, 81–92. [Google Scholar] [CrossRef]
- Cascetta, E.; Coppola, P. High Speed Rail (HSR) induced demand models. Procedia-Soc. Behav. Sci. 2014, 111, 147–156. [Google Scholar] [CrossRef]
- Jiang, X.; Zhang, L.; Chen, X.M. Short-term forecasting of high-speed rail demand: A hybrid approach combining ensemble empirical mode decomposition and gray support vector machine with real-world applications in China. Transp. Res. Part C Emerg. Technol. 2014, 44, 110–127. [Google Scholar] [CrossRef]
- Guo, Y.; Cao, L.; Song, Y.; Wang, Y.; Li, Y. Understanding the formation of City-HSR network: A case study of Yangtze River Delta, China. Transp. Policy 2022, 116, 315–326. [Google Scholar] [CrossRef]
- Guo, Y.; Li, B.; Han, Y. Dynamic network coupling between high-speed rail development and urban growth in emerging economies: Evidence from China. Cities 2020, 105, 102845. [Google Scholar] [CrossRef]
- Lv, Y.; Chen, Y. Research on the Evolution Characteristics and Synergistic Relationship between HSR Network and Economic Network in Hubei Province. Sustainability 2022, 14, 9076. [Google Scholar] [CrossRef]
- Huggins, R.; Izushi, H.; Prokop, D.; Thompson, P. The Global Competitiveness of Regions; Routledge: London, UK, 2014; pp. 68–70. [Google Scholar]
- Ren, X.; Wang, F.; Wang, C.; Du, Z.; Chen, Z.; Wang, J.; Dan, T. Impact of high-speed rail on intercity travel behavior change. J. Transp. Land Use 2019, 12, 265–285. [Google Scholar]
- Opsahl, T.; Agneessens, F.; Skvoretz, J. Node centrality in weighted networks: Generalizing degree and shortest paths. Soc. Netw. 2010, 32, 245–251. [Google Scholar] [CrossRef]
- Tinbergen, J. Shaping the World Economy; Suggestions for an International Economic Policy; Twentieth Century Fund: New York, NY, USA, 1962; pp. 192–193. [Google Scholar]
- Pöyhönen, P. A tentative model for the volume of trade between countries. Weltwirtschaftliches Archiv. 1963, 90, 93–100. [Google Scholar]
- Krings, G.; Calabrese, F.; Ratti, C.; Blondel, V.D. Urban gravity: A model for inter-city telecommunication flows. J. Stat. Mech. Theory Exp. 2009, 2009, L07003. [Google Scholar] [CrossRef]
- Fan, Y.; Zhang, S.; He, Z.; He, B.; Yu, H.; Ye, X.; Yang, H.; Zhang, X.; Chi, Z. Spatial pattern and evolution of urban system based on gravity model and whole network analysis in the Huaihe River Basin of China. Discret. Dyn. Nat. Soc. 2018, 2018. [Google Scholar] [CrossRef]
- Henderson, J.V. Cities and development. J. Reg. Sci. 2010, 50, 515–540. [Google Scholar] [CrossRef]
- Zhang, W.; Zhuang, X.; Lu, Y.; Wang, J. Spatial linkage of volatility spillovers and its explanation across G20 stock markets: A network framework. Int. Rev. Financ. Anal. 2020, 71, 101454. [Google Scholar] [CrossRef]
- An, Y.; Wei, Y.D.; Yuan, F.; Chen, W. Impacts of high-speed rails on urban networks and regional development: A study of the Yangtze River Delta, China. Int. J. Sustain. Transp. 2022, 16, 483–495. [Google Scholar] [CrossRef]
- Ma, L.J. Urban administrative restructuring, changing scale relations and local economic development in China. Political Geogr. 2005, 24, 477–497. [Google Scholar] [CrossRef]
Disclaimer/Publisher’s Note: The statements, opinions and data contained in all publications are solely those of the individual author(s) and contributor(s) and not of MDPI and/or the editor(s). MDPI and/or the editor(s) disclaim responsibility for any injury to people or property resulting from any ideas, methods, instructions or products referred to in the content. |
© 2023 by the authors. Licensee MDPI, Basel, Switzerland. This article is an open access article distributed under the terms and conditions of the Creative Commons Attribution (CC BY) license (https://creativecommons.org/licenses/by/4.0/).