1. Introduction
The Carpathians represent a complex natural environment with limits and subdivisions that were subjected to numerous geomorphic classifications that separate heterogeneous units characterised by common lithological, structural, or geomorphic traits [
1]. The longest sector of this European mountain range is in Romania; it contains up to 40.9% of the total Carpathian surface and comprises 27.8% of the country’s territory. The general physiographic disposition of the chain and the local morphometry condition the hydrological, climatic, and biological characteristics in terms of horizontal and vertical zonation [
2]. The influence of landscape [
3,
4] and climate changes [
1,
5,
6] are also important in these areas. The relationship between landscape and forests is an important area of research in forest ecology. The identification of regional and landscape features of forest structure and biodiversity is necessary for the organization of sustainable forest management and the conservation of forest resources and wildlife.
Forestry in all countries is conducted on a forest-typological basis. Therefore, the identification of forest-typological features is very important for the organization of sustainable forest management. This is due to the fact that the relationship between forest vegetation and landform features does not only differ but may also be opposite.
Most European countries utilize systems of forest types developed for practical use in forestry. World forest-types classifications are currently being successfully used, and their experience is important for sustainable forest management in the European Union but also in Russia or North America [
7]. Thus, forest types represent an approach to collect and organize various information regarding the forests of a given territory according to a useful typology required for a specific application such as planning forestry activities, estimating the productivity of forest sites, and so on.
The spruce (
Picea abies L.) is one of the most widespread and iconic species in Eurasia, with preferences for moist and cool climates, fertile soils, and relative shade tolerance. At the same time, the land configuration and the forest composition can play a determining role, on the one hand, on the species’ productivity and, on the other hand, on the resistance and resilience to climate change [
8].
The methods of statistical analysis used in the evaluation of volume and production represent a subject of maximum importance [
9,
10,
11]. Thus, empirical growth models could be developed to predict the growth and yield of plantation tree species, and the accurate estimation of site quality is an important component of these models [
8,
12]. Other procedures are based on the use of methods involving remote sensing [
12,
13,
14] or combined methods [
15]. A method that has often been encountered recently is the one based on the use of historical data to evaluate the quality of the site [
9,
16]. In this way, models can be built based on data that describe the site index (SI) considering that the measurements grouped at different ages are specified [
9]. In the case of the present study, we generalised this method in a comparative study that considered age and altitude intervals. The goal was to investigate the existence of some differences that could be proved mathematically along some transects.
There is much debate on the issue of the productivity of pure (i.e., spruce) versus mixed stands (i.e., beech, silver fir, and spruce). As early as the 18th century, Hartig (1751) showed the superiority of pure forests compared to mixed forests although a century later, Cota (1828) proved the opposite [
17,
18]. Recent studies [
19,
20] have concluded that silviculture can accelerate spruce growth in mixture with beech especially on poor sites, while beech growth can be stimulated in mixture stands especially on excellent sites. However, in mixed stands, even if one species will experience a decline in growth, the other species will compensate, leading to high productivity at stand level. The forest sector in Romania contributes with a percentage of 3.5 to 4.5% of the gross national product (GNP) and is thus economically very important. The Norway spruce is the main species used in the timber industry in Romania [
9,
21,
22]. The natural Norway spruce forests are spread across upper mountain slopes (1300–1800 m), where they perform multiple functions and are especially recognised for their economic value [
23,
24,
25,
26].
Concerning populations from the Romanian Carpathians, the data analysis from two locations regarding radian increment showed a large inter-populational variability, while for wood density, the variability was lower [
27,
28]. At the same time, geneticists are trying to improve the resistance of the Norway spruce by promoting the provenances and intraspecific varieties that show superior resistance to windstorms and snow breaks [
29]. Recent studies showed that the narrow-crowned Norway spruce ideotype could be used by researchers and professional workers on forest restoration and afforestation activities in environmental conditions that are favourable for Norway spruce [
30,
31]. Based on our results and the literature review, some scientists argue that the future performance of spruce in the greater Carpathian region is highly uncertain and that monocultures of this species should be replaced or admixed with more drought-resilient mixtures, including silver fir, European beech, and other broad-leaved species [
32].
Whether mixed stands are more productive than the pure stands is an old, controversial question that remains open [
19].
The purpose of this research aimed to answer several questions: (i) Are there any differences in the growth and volume of spruce trees at altitudes between the eastern and the western clines of the Eastern Carpathians? (ii) Are there any differences in the growth and volume of spruce trees by altitude between the northern and southern climes of the Southern Carpathians? (iii) Are there different growths in volume in pure spruce stands compared to mixed stands?
2. Materials and Methods
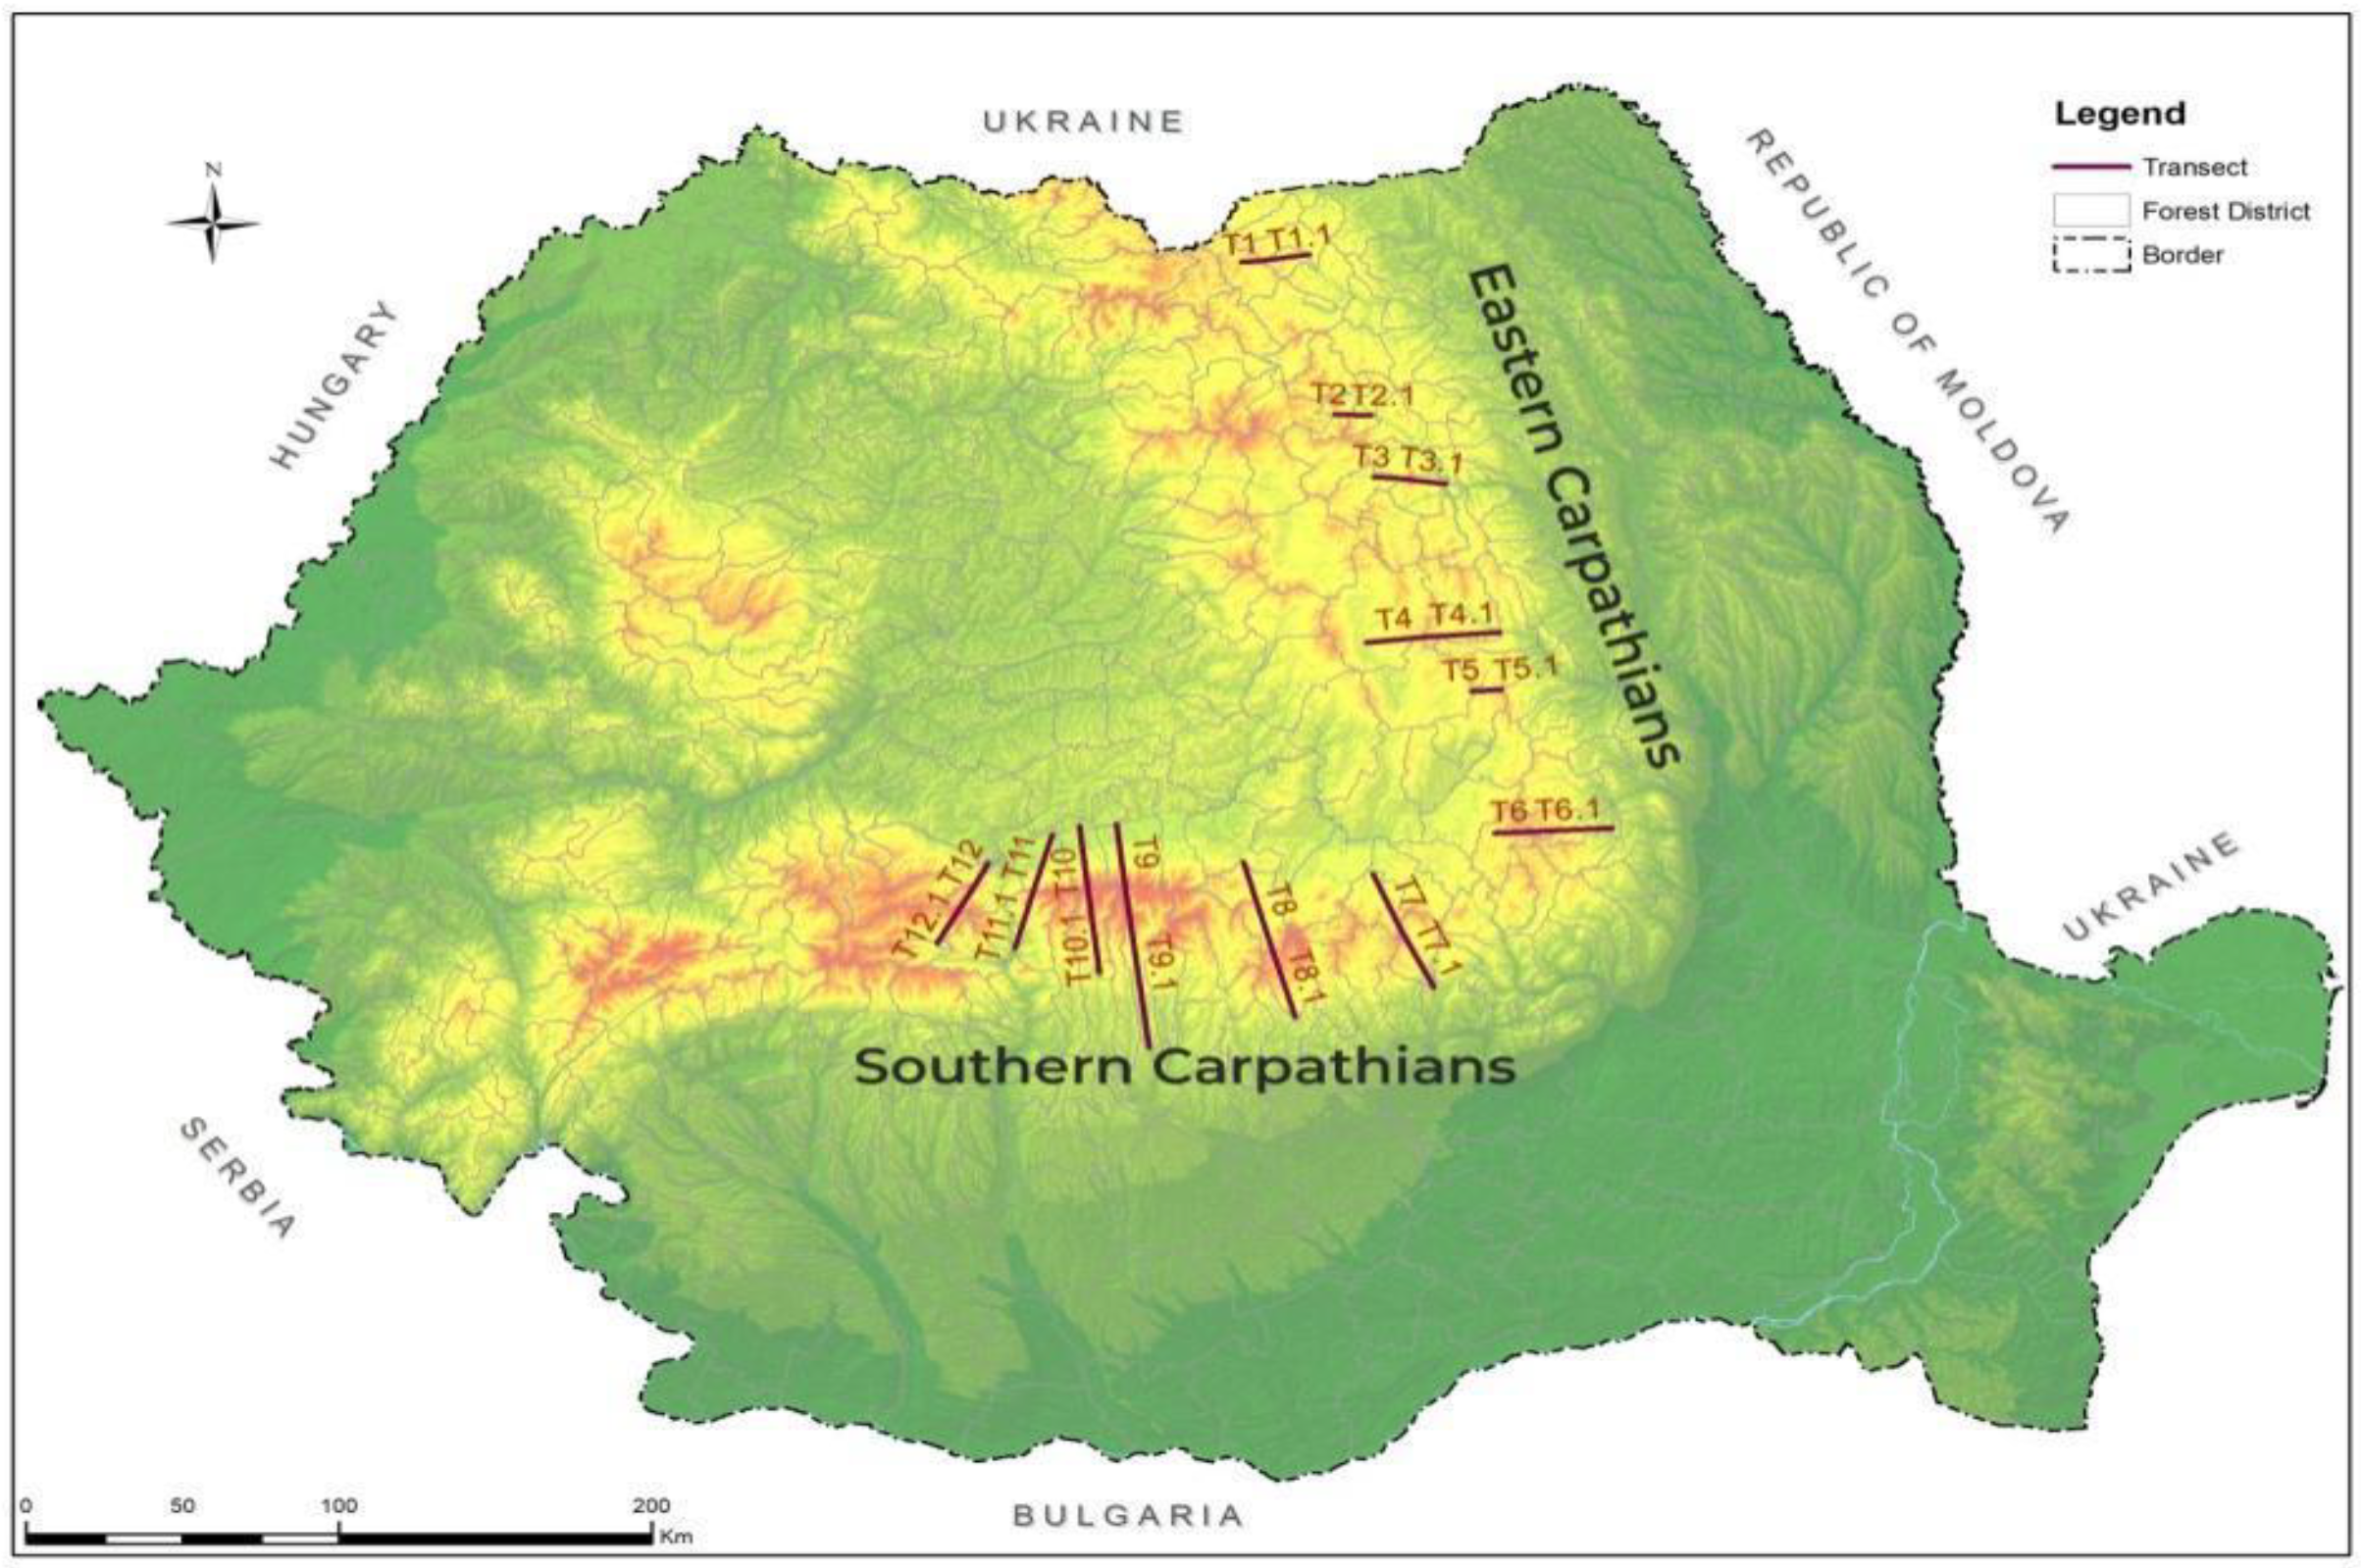
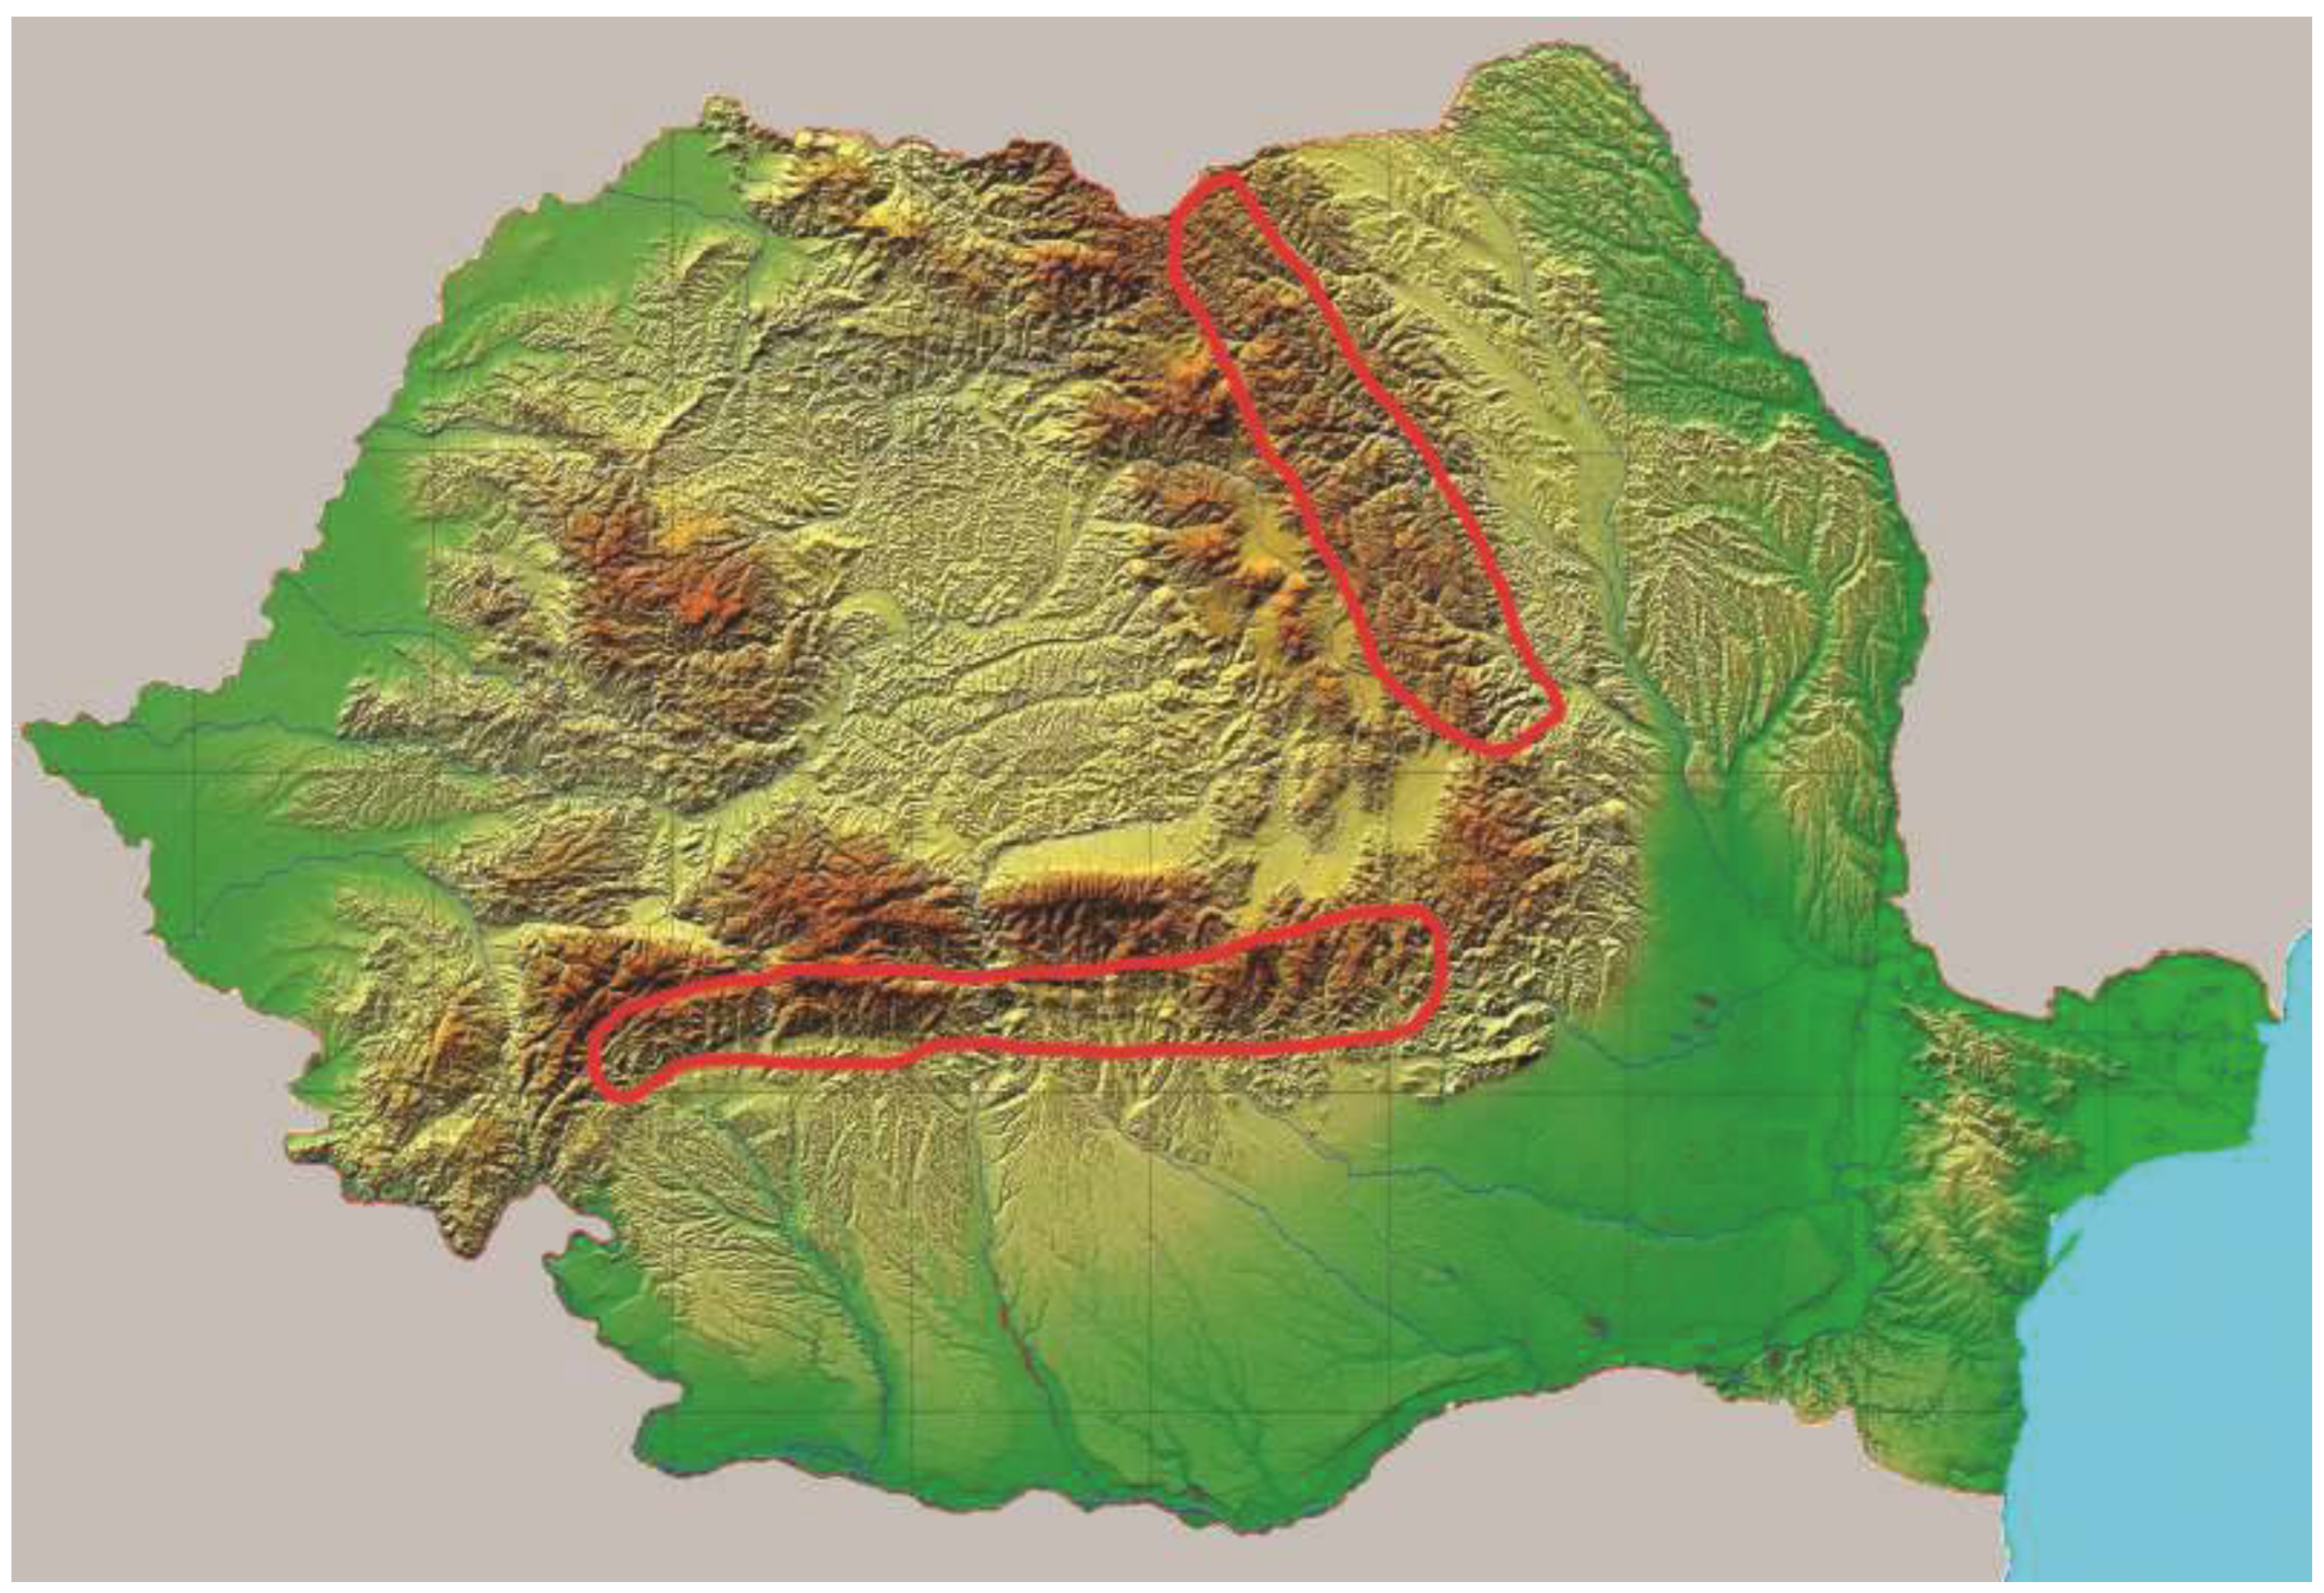
The Romanian Carpathians are split into three groups: the Eastern Carpathians, Western Carpathians, and the Southern Carpathians. From the point of view of establishing altitudinal transects, Romania has the great advantage of having one group of Carpathians oriented in the north–south direction (Eastern Carpathians) and another group oriented in the east–west direction (Southern Carpathians). In Romania, the Eastern Carpathians are called Oriental Carpathians, and the Southern Carpathians are called Meridional Carpathians. The data were extracted from the forest management plans of these areas (25 forest management plans) carried out during the period 1980–2005 [
33] (
Figure 1).
In Romania, the establishment and application of forest management measures are based on the correct determination of the fundamental natural type of forest and the type of site [
34]. At the same time, forest types reflect the geoclimatic diversity, and their distribution depends especially on the climate, soil, altitude, and landforms. According to the technical norms for forest management (2000), in Romania, there are 10 different groups of forest types chosen according to the tree species or the group of edifying species, the first of which is represented by spruce or spruce forest types [
35]. These spruce forests are the ones we focus on in the present article.
The stand description records the ecological, dendrometrical, silvicultural, and phytosanitary characteristics of interest for the design of forest management planning as well as indicates the measures required in the next decade for each compartment, taking into account the condition of the stand and its assigned functions. For the study and description of each stand, the following determinations were made: natural forest type and current forest character, stand elements with all related taxonomic elements, and species proportion, production class, consistency, seedling proportion, silvicultural interventions, etc., according to specific forest guidelines. In this article, we use database characteristics regarding the type of forests, type of forest sites, composition, age, aspect, altitude, surface, and volume.
For each stand element as well as for the whole stand, the volume was determined via the inventory procedure, using the volume models and tables procedure. The benefit of this procedure is that it provides data on each stand volume per surface (hectare), with minimal forest inventory costs.
There are two main stand categories:
For harvestable stands to be included in the ten-year management plan, the volume is determined either by full inventories (stands with a consistency of 0.1–0.3 or a total area of 3 ha maximum) or by statistical inventories (by 500 m2 circles);
For young stands or those not included in the ten-year management plan, they are inventoried with simplified methods such as the relascopy procedure (Bitterlich method), which make it possible to determine the basal area per hectare of each stand; it is a simple, handy, and quick method (Bitterlich).
Consequently, according to the national management planning guidelines, all data were processed using a specific application program (i.e., AS 2010, latest version). In order to achieve the aim and the objectives stated in the present study, the volume of spruce stands was taken into account and grouped into six transects both in the north–south direction in the Southern Carpathians and in the east–west direction in the Eastern Carpathians (
Figure 2). These transects were numbered beginning from the north of the Eastern Carpathians and ending with the west of the Southern Carpathians. In order to obtain the most complete information on the volumes of spruce in the two mountain ranges, the data were first grouped east–west and then north–south. There were four groups marked according to the orientation of the main cardinal points N, E, S, and W on each side of the Carpathians (both meridional and eastern) and another four subgroups according to the orientation of the intermediate cardinal points NE, SE, SW, and NW. Thus, for the Eastern Carpathians, two groups were formed: one eastern (T1.1, T2.1, T3.1, T4.1, T5.1, T6.1) and one western (T1, T2, T3, T4, T5, T6), and for the northern and southern group, the northern half, respectively; the first three transects from north to south (T1 and T1.1, T2 and T2.1, T3 and T3.1); and the southern half of the first transects were considered from north to south: T4 and T4.1, T5 and T5.1, and T6 and T6.1, respectively (
Figure 2). In the same way, the transects from the Southern Carpathians were grouped into the northern part (T7, T8, T9, T10, T11, T12) and the southern part (T7.1, T8.1, T9.1, T10.1, T11.1, T12.1) against an imaginary horizontal axis, and the eastern group (T7 and T7.1, T8 and T8.1, T9, T9.1) and the western group (T10 and T10.1, T11 and T11.1, T12 and T12. 1) against the vertical axis, represented by the course of the Olt River (
Figure 2).
On average, more than 8000 records were analysed for volume values, with their large number ensuring a good statistical representativeness of the results [
36]. In each of the eight databases, procedures for the preliminary analysis of the recorded data were initially applied. In this way, due to the large number of records, statistical tests could be successfully applied [
36,
37]. Thus, the average values and the median values for each age range could be calculated for each database separately.
The volume was distributed according to age and altitude. The grouping of the volume values by altitudes was carried out in compliance with the Hahn–Shapiro law [
36]. In this way, the distribution interval could be established, as well as the number of classes, by calculating the amplitude of variation and knowing the number of measurements; the validation of these class numbers was conducted using Kolker’s law and Sturges’ formula, respectively [
36,
37]. The number of classes was determined according to those previously exposed to the value of 17, resulting in an interval of 100 m. The procedure was as follows: for example, for the altitude of 1400 m, all the values of the volume of spruce stands of a certain age located at altitudes between 1351 and 1450 m were taken into account. The number of values for a subgroup of transects was very large; for the Eastern Carpathians, it was 11,549 for transects 1–3 of the NE subgroup; 7895 for transects 1–3 of the NV subgroup; 11,264 for transects 4–6 of the SE subgroup; and 8797 for transects 4–6 of the SV subgroup. For the Southern Carpathians, it was 4044 values for transects 7–9 of the NE subgroup; 5325 values for transects 10–12 of the NV subgroup; 3745 for transects 7–9 of the SE subgroup; and 6188 for transects 10–12 of the SV subgroup. The totals were as follows: 22,813 for the eastern Eastern Carpathian group, 16,732 for the western Eastern Carpathian group, 7789 for the eastern Southern Carpathian group, and 11,733 for the western Southern Carpathian group.
The statistical analysis involved grouping records into classes and applying procedures for the comparative analysis of means. For each individual case, the distributions were analysed, and tests were applied to determine the main modes [
36]. As it is known, whenever we have extremes, which are very high or very low scores compared to the data set, the median is a better indicator than the mean [
24]. In the situation where the frequency of one category is much higher compared to the frequency of the other categories, the best indicator of the central tendency is the mode [
24,
36]. In our case, all of the distributions were predominantly unimodal, which could be approximated with normal distributions [
36,
37]. As recognized in the literature, a normal distribution is a unimodal distribution with a single category with maximum frequency, a fact that determined the use of average values in the statistical analyses [
24,
36].
After the preliminary descriptive research of the specific databases, comparative analysis tests were applied [
24]. The simplest analysis test applied was Student’s
t-test. As it is well known, Student’s
t-test is a method of testing hypotheses about the means of samples drawn from a normally distributed population when the population standard deviation is unknown [
12,
36]. In this way, hypotheses may be analysed by successively considering pairs of samples related to the same altitude domain from areas located on the same transects. In this way, comparisons were made between the average values that were evaluated; in case the null hypothesis H0 was rejected, and the Student’s
t-test gave a significant result, the values for the standard deviation and the values resulting from the homogeneity tests were also calculated as Levene and Brown–Forsythe tests. In general, Levene’s test is used to evaluate the equality of variances for a variable calculated for two or more groups [
36]. Thus, Levene’s test evaluates the hypothesis of equality of variances because, as it is known from the literature, if the
p-value resulting from Levene’s test is lower than a certain level of significance (usually 0.05), it is unlikely that the differences obtained in the sample variances were produced based on random sampling from a population with equal variances. Therefore, in this case, if the
p-value resulting from Levene’s test was lower than 0.05, then the null hypothesis of equal variances was rejected, and it was concluded that there was a difference between the variances in the population.
The methodology used is based on the preliminary analysis of the data from the databases used and the correlations. Next, the methods of analysis of the variant—MANOVA—were considered. Last but not least, the results of the PCA type method were taken into account for a differentiation of the possible processes involved.
3. Results
In order not to excessively increase the volume of the study, we decided to present only the data that were significant from the comparisons between the groups made within the two mountain ranges.
3.1. Volume Differences
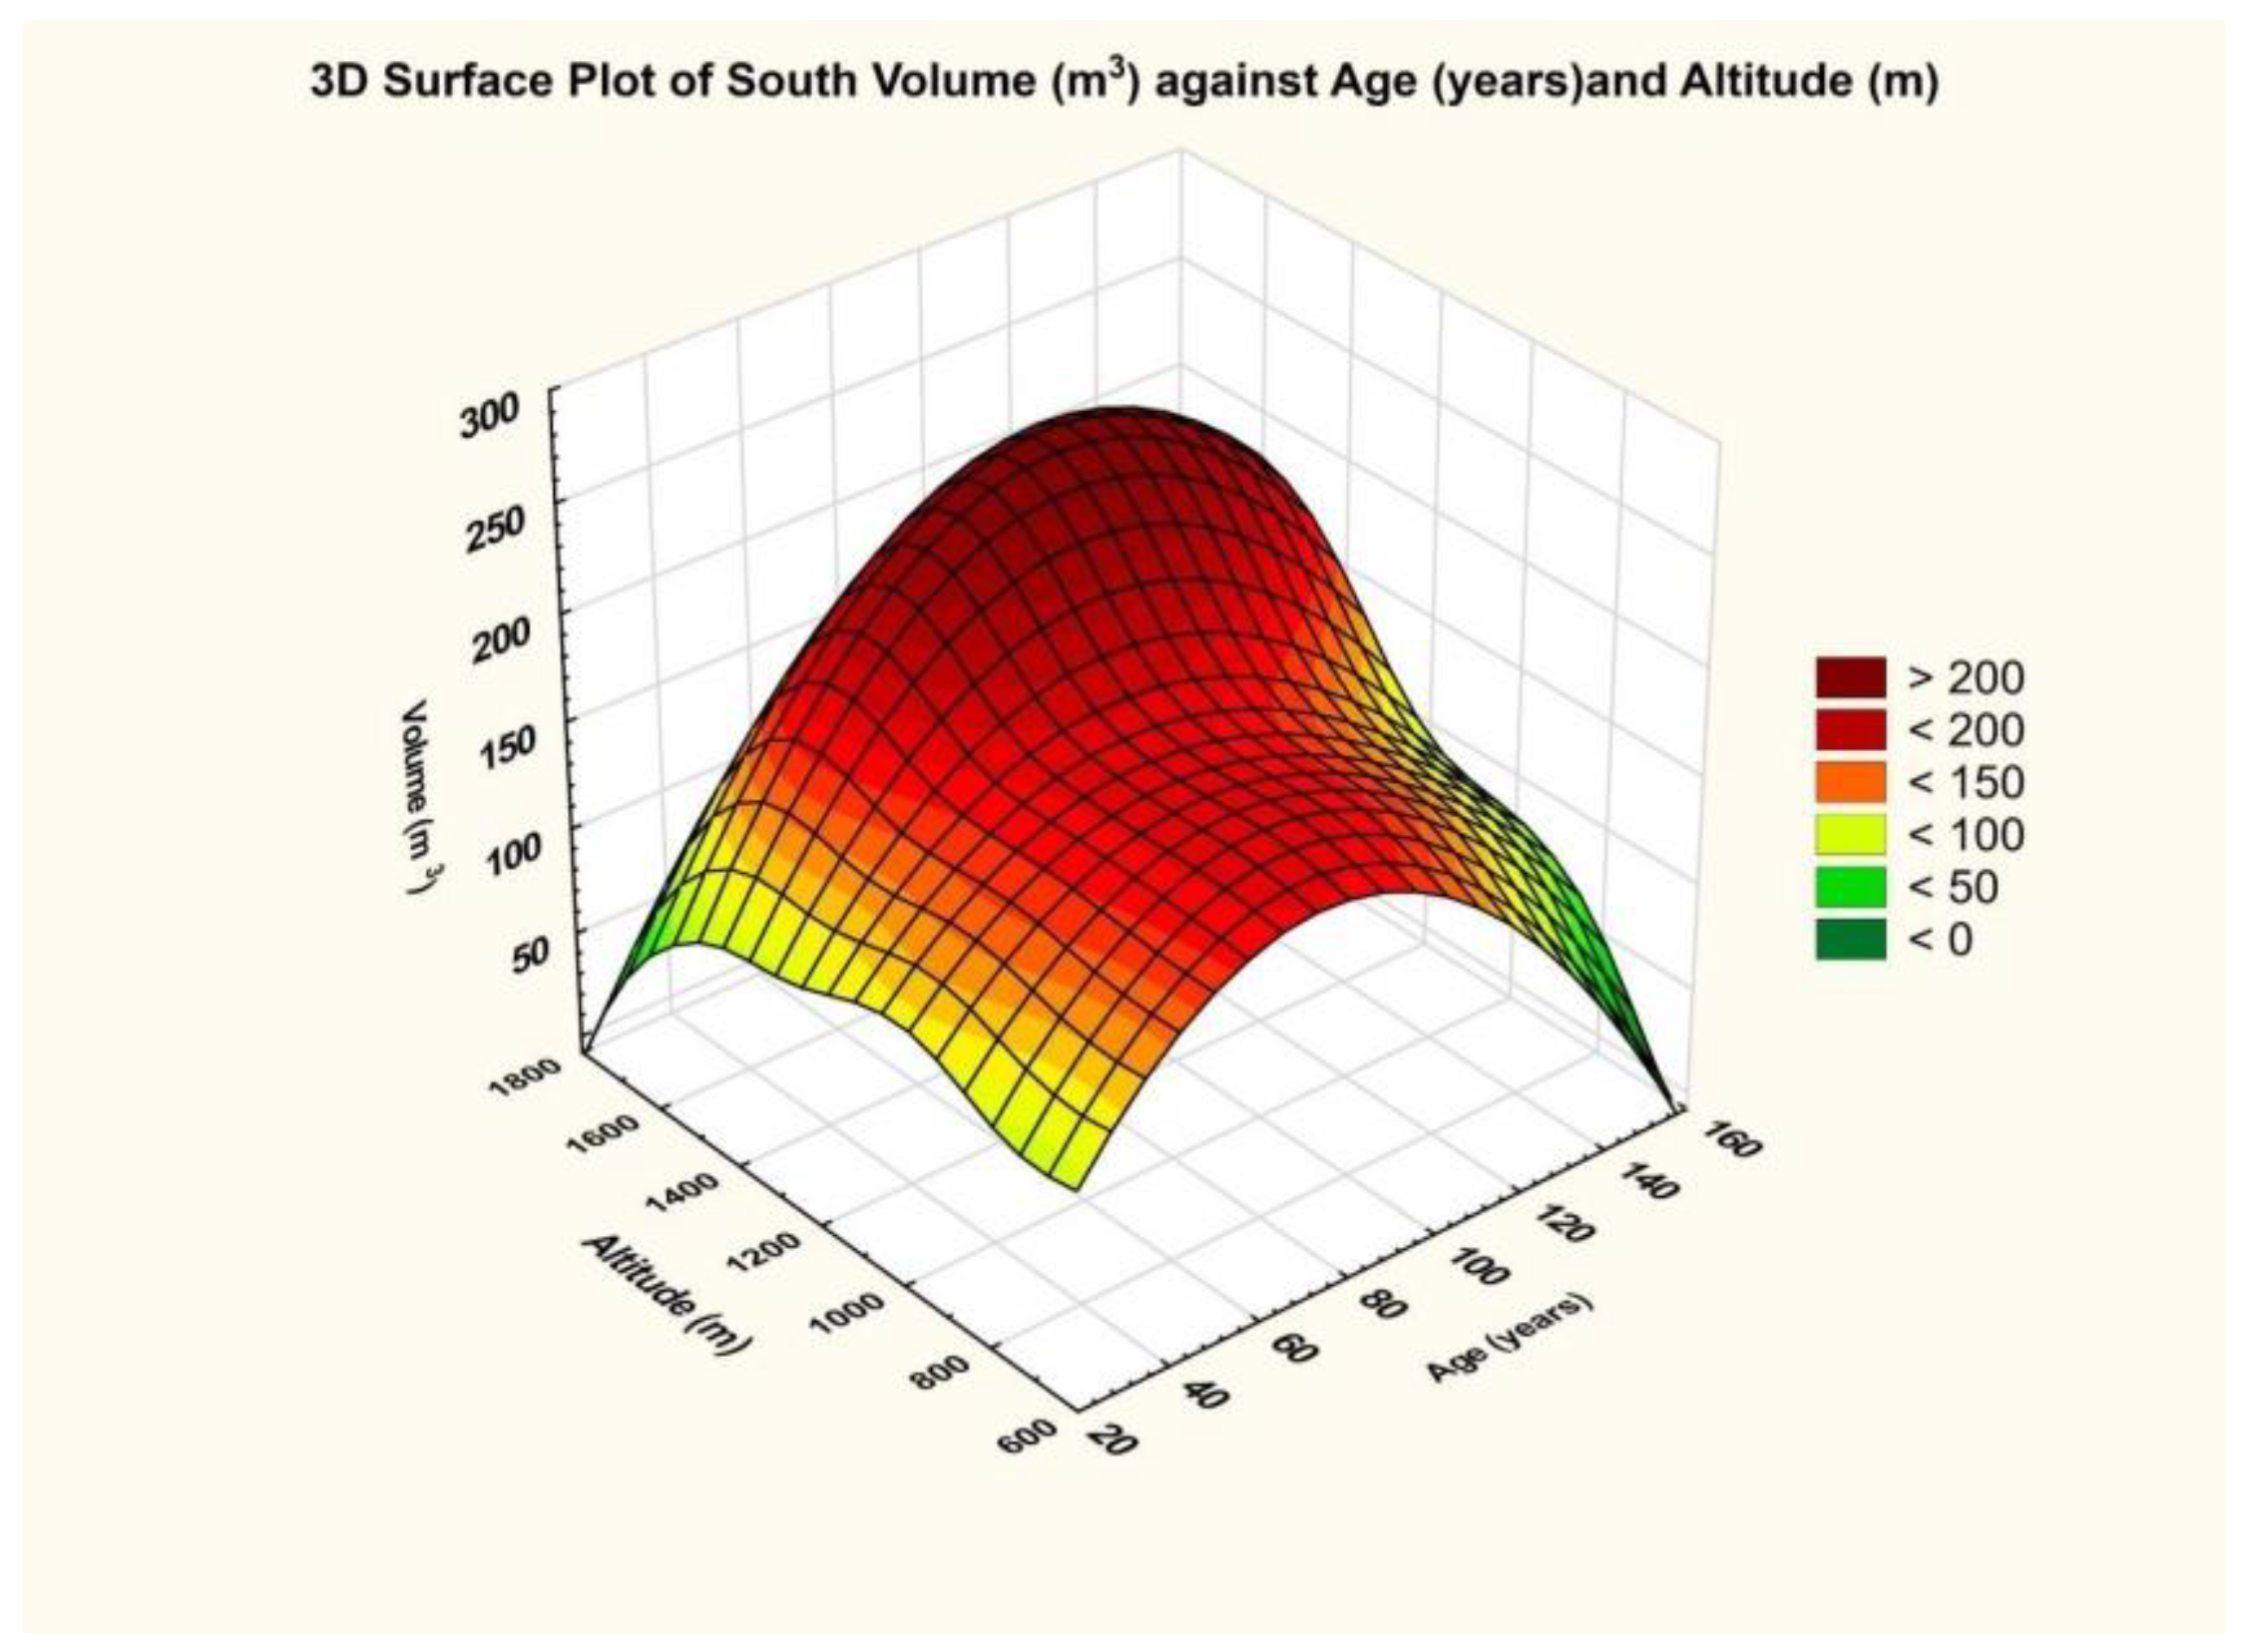
Thus, an example of calculation is presented for the Southern Carpathians, more precisely for the western part facing the Olt River. This group was divided into subgroup SV (South Volume) and subgroup NV (North Volume) (
Table 1).
Table 1 shows the average values of the volume, the standard deviation, and the average error.
One can observe that if we consider the two sets of data globally, there are no significant differences; i.e., values for standard errors cover the insignificant difference between mean values. However, in the SV part, the volume is slightly higher than in the NV part of the Southern Carpathians.
The final results regarding the volume differences reported on the mountain ranges are shown in
Table 2 and
Table 3.
3.2. Influence of Altitude and Age on Volume
Calculation examples: Eastern Carpathians (Orientals), northern group, eastern part—NE subgroup.
The final result is that for the database related to the eastern area, the dependence on altitude is significant (
p = 0.003), and the dependence on age is unimportant and insignificant (
p = 0.142). Furthermore, considering the evaluation scale of the partial coefficient eta squared, namely 0.01—small effect size, 0.06—medium effect size, and 0.14 or higher—large effect size, it turned out that the effect generated by altitude was of high intensity, and that generated by age on volume size was weak. This fact results from the graph below, which shows an approximately rectilinear trend for the maximum curve in relation to altitude (
Figure 3).
The final result is that for the database related to the southern area of the Southern Carpathians, the dependence on altitude was significant, and the dependence on age was insignificant.
Moreover, considering the evaluation scale of the partial coefficient eta squared, namely 0.01—small effect size, 0.06—medium effect size, and 0.14 or higher—large effect size, it turned out that the effect generated by altitude on volume size was more intense than that of age. Age had little effect.
The influence of altitude (ALT) and age (AGE) on the volume of the western-side stands for the Eastern Carpathians can be observed in
Figure 4.
The final results regarding the volume differences reported on the subgroups of the Eastern and Southern Carpathians mountain ranges are shown in
Table 3.
3.3. Differentiation of Volume by Altitude
Analysis on altitudes from Eastern Carpathians between southern (T4 and T4.1, T5 and T5.1, and T6 and T6.1) and northern groups (T1 and T1.1, T2 and T2.1, T3 and T3.1) can be observed in
Table 4.
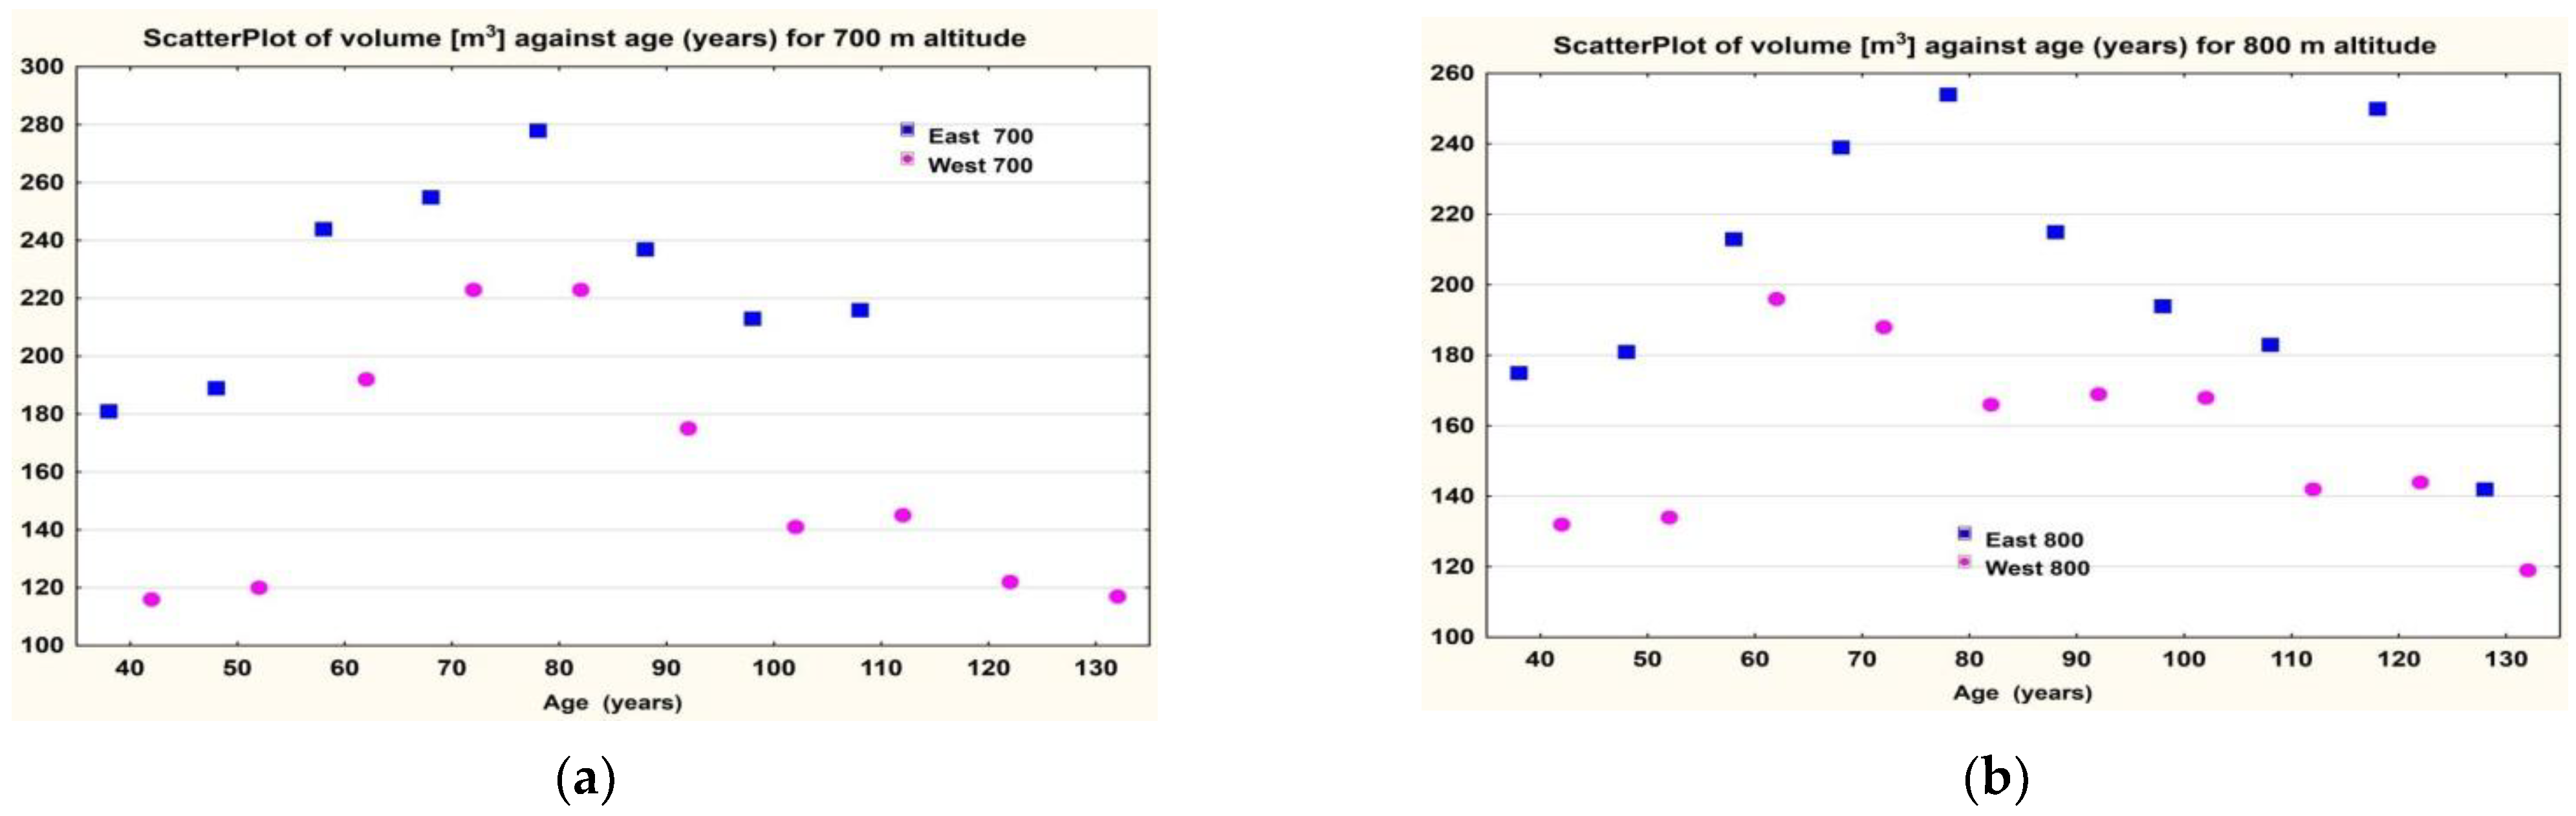
In the Eastern Carpathians, it turned out that at the same altitudes, the volumes were higher on the eastern cline than on the western one at altitudes of 700–1000 (
Figure 5).
Analysis on southern altitudes Analysis on altitudes from Southern Carpathians between western (T10 and T10.1, T11 and T11.1, T12 and T12. 1) and eastern groups (T7 and T7.1, T8 and T8.1, T9, T9.1) can be observed in
Table 5.
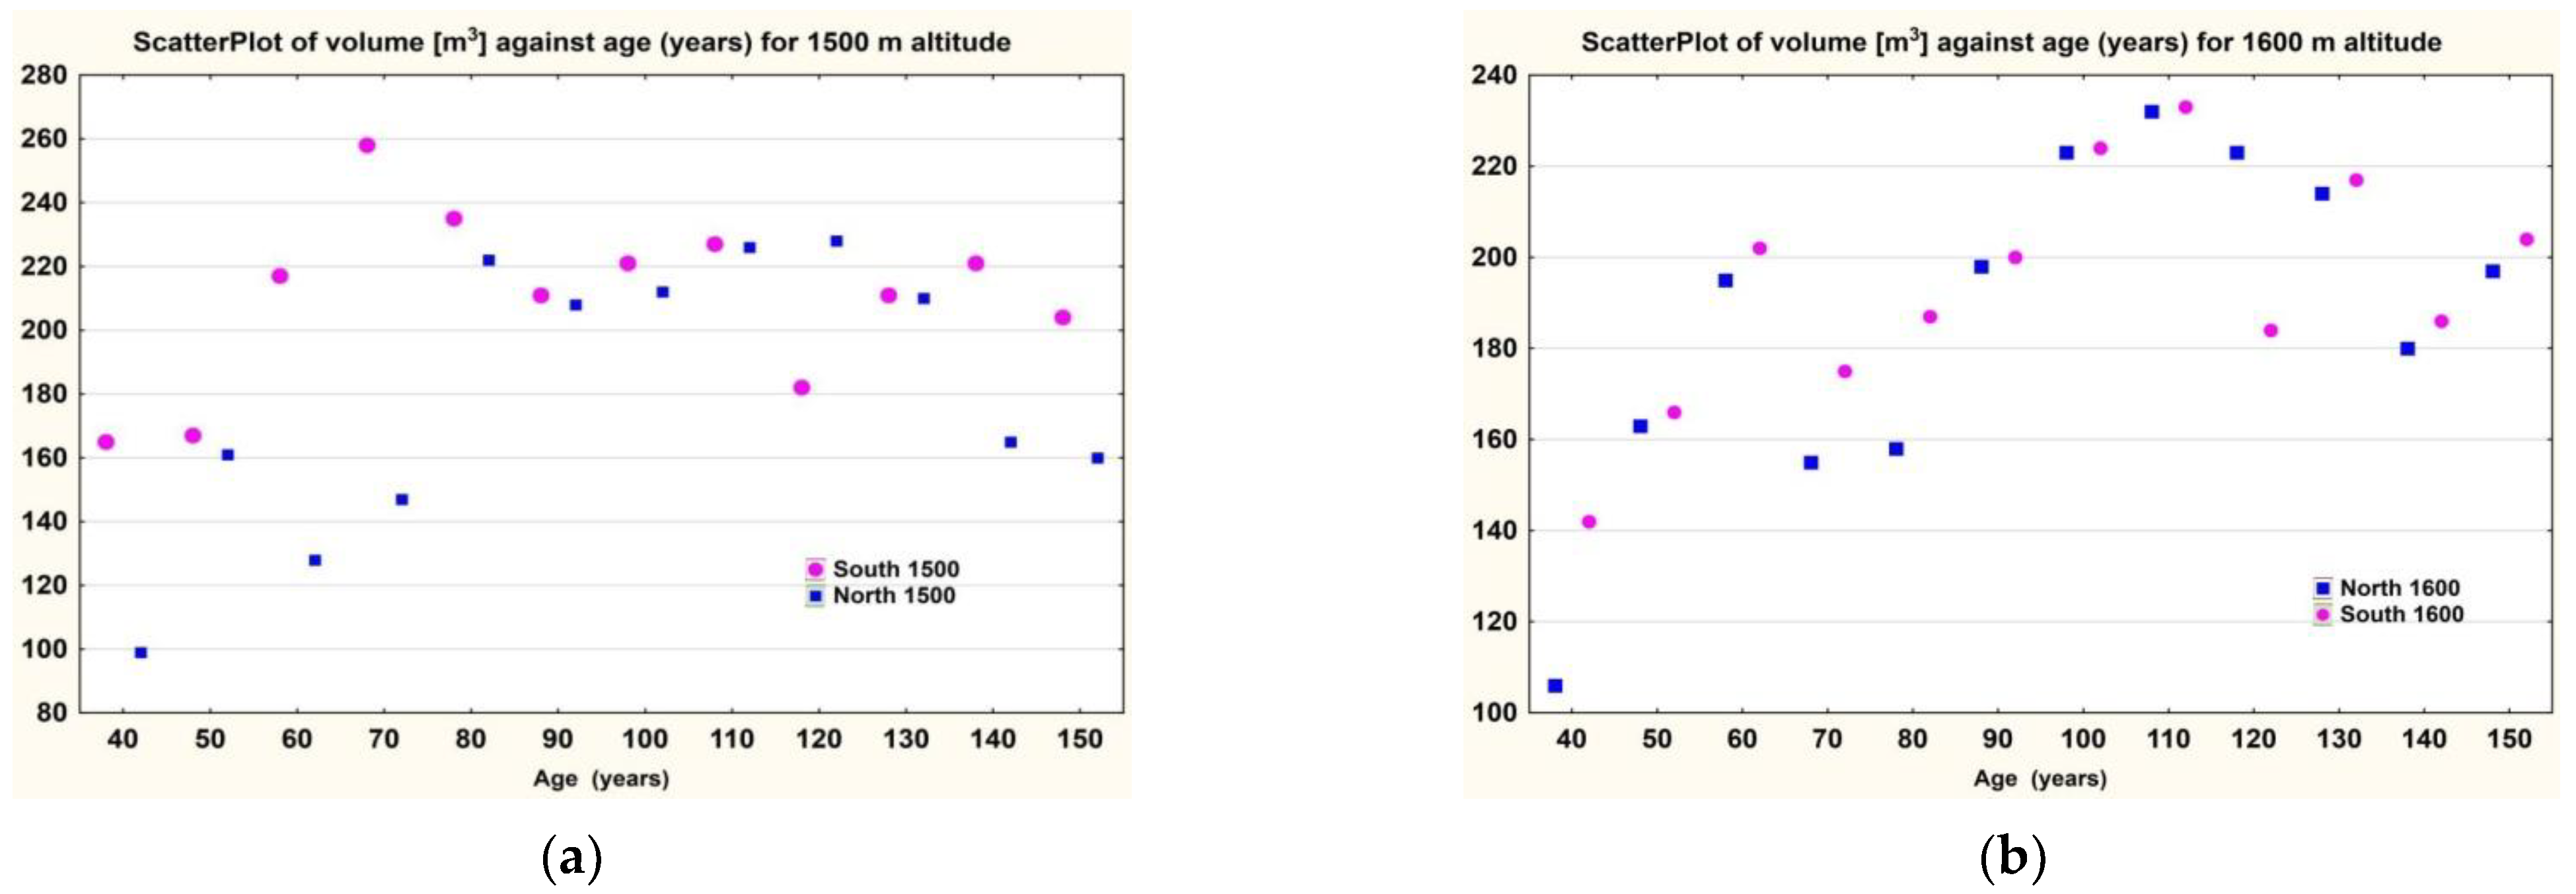
In the case of the Southern Carpathians, for altitudes between 1300 and 1600, the volume of trees in the southern cline was greater than that of the trees in the northern cline (
Figure 6a,b).
In the case of the north–south Southern Carpathians (West of Olt), a fairly large influence of altitude on the size of the volume can be observed—eta squared = 0.375177 for the northern cline and eta squared = 0.451284 for the southern cline (see
Supplementary Materials SC4 and respectively SC6). The similarity between the PCA diagrams for both the northern cline and the southern cline denotes (see
Supplementary Materials Figure SC3 and Figure SD3, respectively) the fact that there is a non-stationary dynamic-balance-type configuration. The representative points are concentrated in the maximum areas, with the two studied factors—age and altitude—having antagonistic influences (see
Supplementary Materials Figures SC4 and SD4, respectively). The fact that this aspect is also observed in the case of the global database—partial eta squared = 0.137289 for the northern cline, for example (see
Supplementary Materials Tables SE4 and SE6, respectively)—reveals an original aspect for this area.
The unstable dynamic balance is mostly visible in the case of the
Table 4 transect—the Eastern Carpathians east–west (see
Supplementary Materials Figures SF3 and SF4, respectively). For the eastern cline, age and altitude have complementary contributions. From this point of view, the structure of the surface plot graphics is different. Obviously, in the case of this transect, different mechanisms are involved since for the first cline, the age and the size of the volume are orthogonal, and for the second cline, the age and the volume are opposite (see
Supplementary Materials Figures SG3 and SG4, respectively).
In the case of forests with a mixed composition, a change in the diagram is also observed, which obviously implies a different mechanism specific to each type of forest (see
Supplementary Materials Figures SJ3 and SJ4, respectively).
As a conclusion, the spruce from the Eastern Carpathians had more growth on the eastern cline at altitudes of 700–1000 m. In the Southern Carpathians, this situation was present on the southern cline at altitudes between 1300 m and 1600 m (
Figure 7).
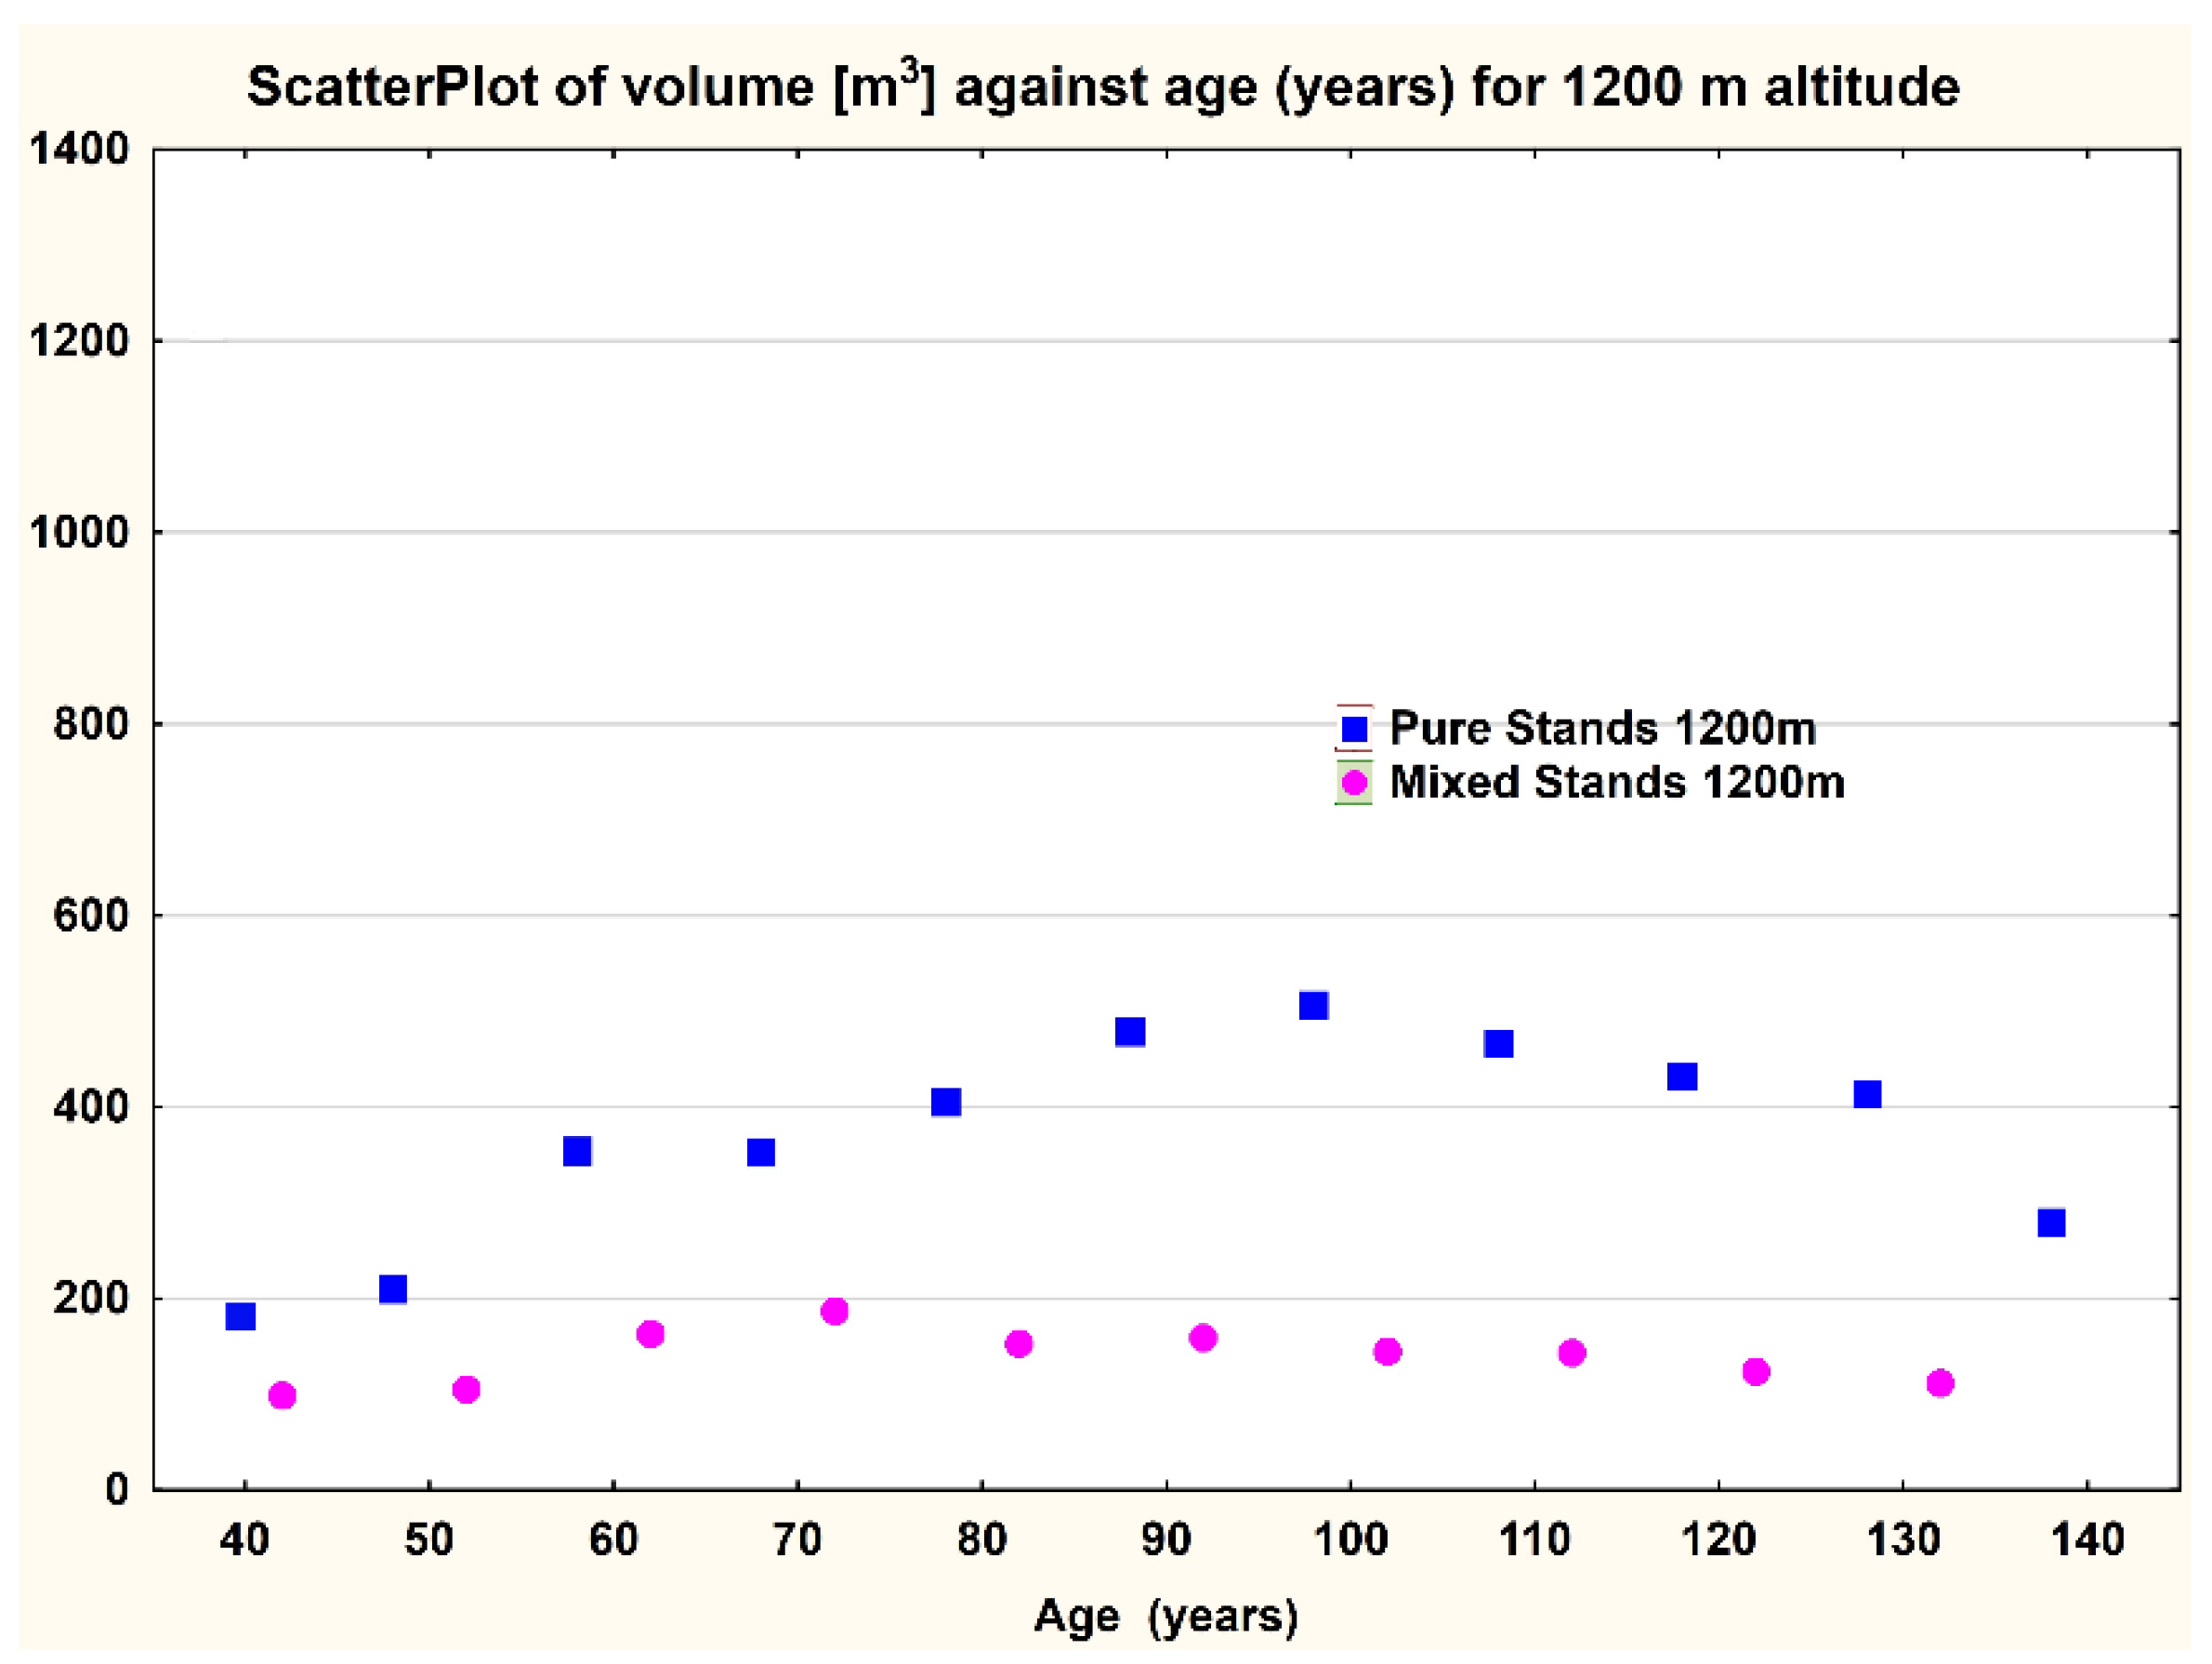
3.4. Are There Any Differences (in Terms of Spruce Volume) between Pure Spruce Stands and Mixed Ones?
Due to the relatively small number of pure spruce tree forests, the calculations were no longer completed per cline (N–S and E–W) but for the total mountain chain (Southern and Eastern).
There were 4896 values taken into account for pure spruce stands in the Southern Carpathians and 14,837 values for mixed spruce stands in the Southern Carpathians.
All of the differences were significant; the pure spruce stands had higher growth than the mixed ones at the same age and altitude (e.g.,
Figure 6).
This is valid both for the Eastern Carpathians (
Table 6, Eastern Carpathians extracted) and for the Southern Carpathians (
Figure 8).
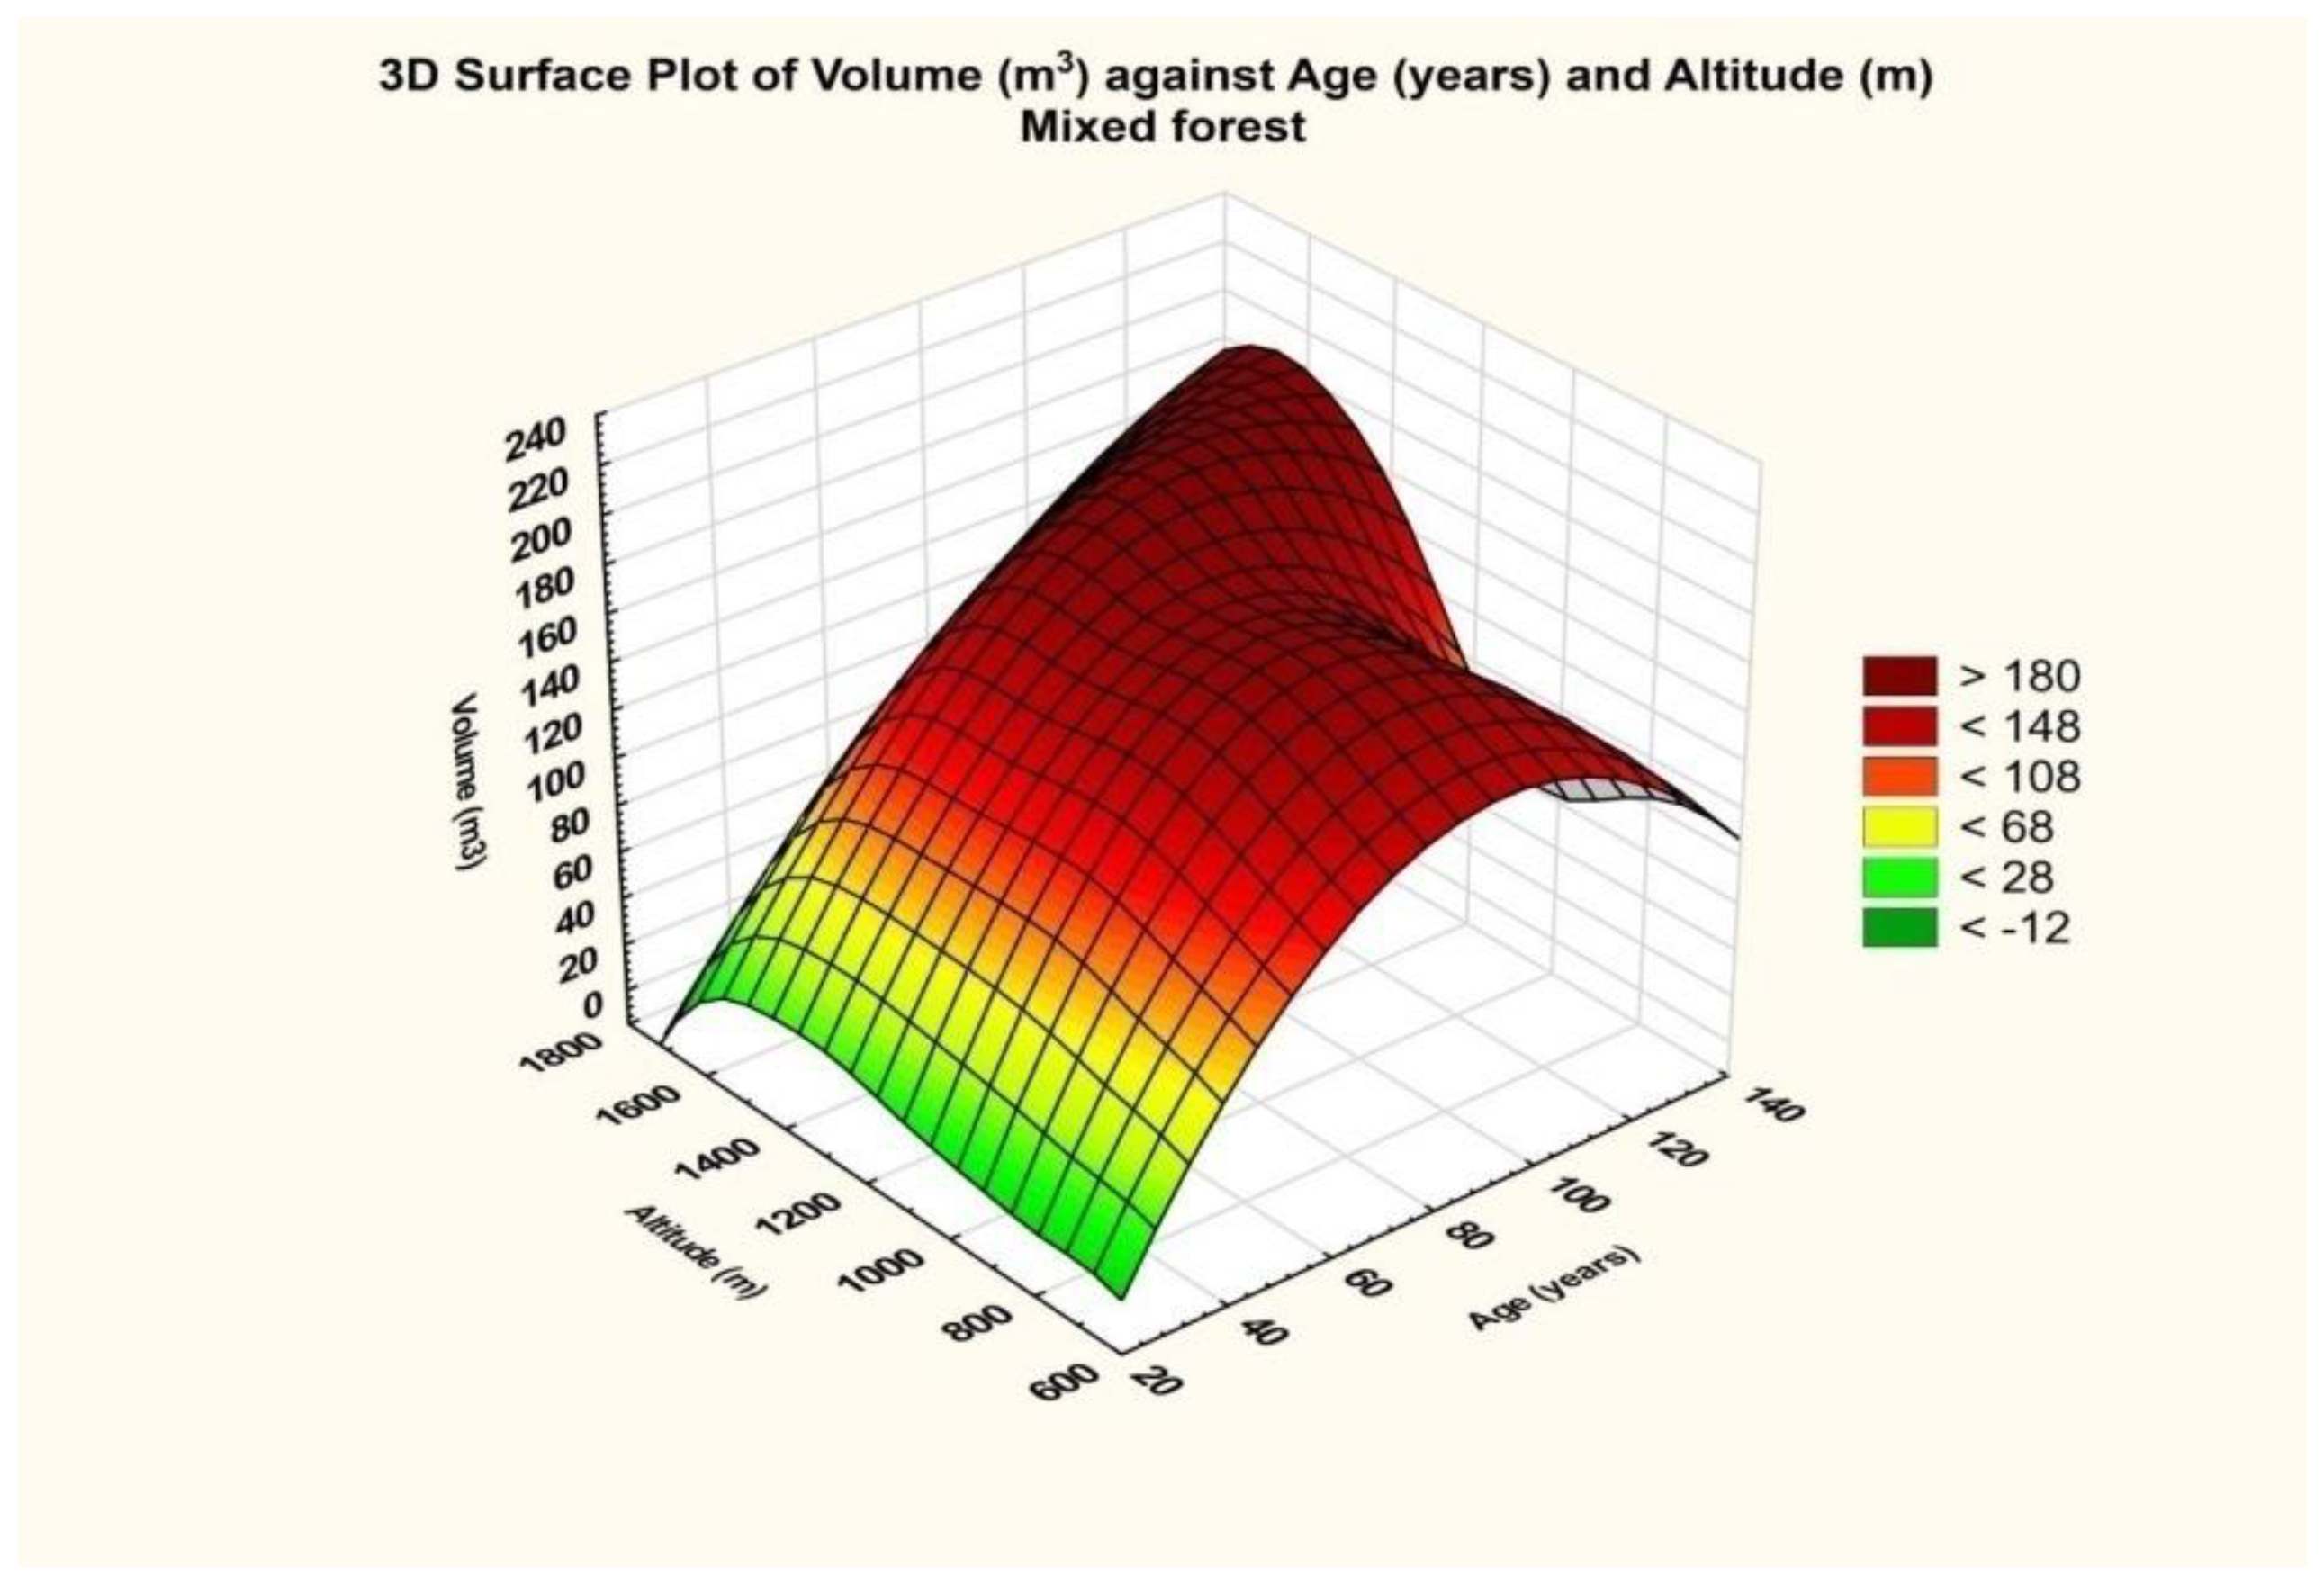
The final result is that for the database related to mixed stands, the dependence on altitude was significant (p = 0.00), and so was the dependence on age (p = 0.033).
Taking into consideration the evaluation scale of the partial coefficient eta squared, namely 0.01—small effect size, 0.06—medium effect size, and 0.14 or higher—large effect size, it turned out that the effect generated by altitude was of high intensity, and that generated by age on volume size was intense but of a smaller size. This fact results from the graph below (
Figure 9), which shows an approximately rectilinear trend for the maximum curve in relation to altitude.
The final result is that for the database related to the eastern area, the dependence on altitude was insignificant (p = 0.085), and so was the dependence on age (p = 0.398).
Provided we take into consideration the evaluation scale of the partial coefficient eta squared, namely 0.01—small effect size, 0.06—medium effect size, and 0.14 or higher—large effect size, it turns out that the effect generated by altitude was of high intensity, and that generated by age on volume size is weak. This fact also results from the graph above, which shows an approximately rectilinear tendency for the maximum curve in relation to the altitude.
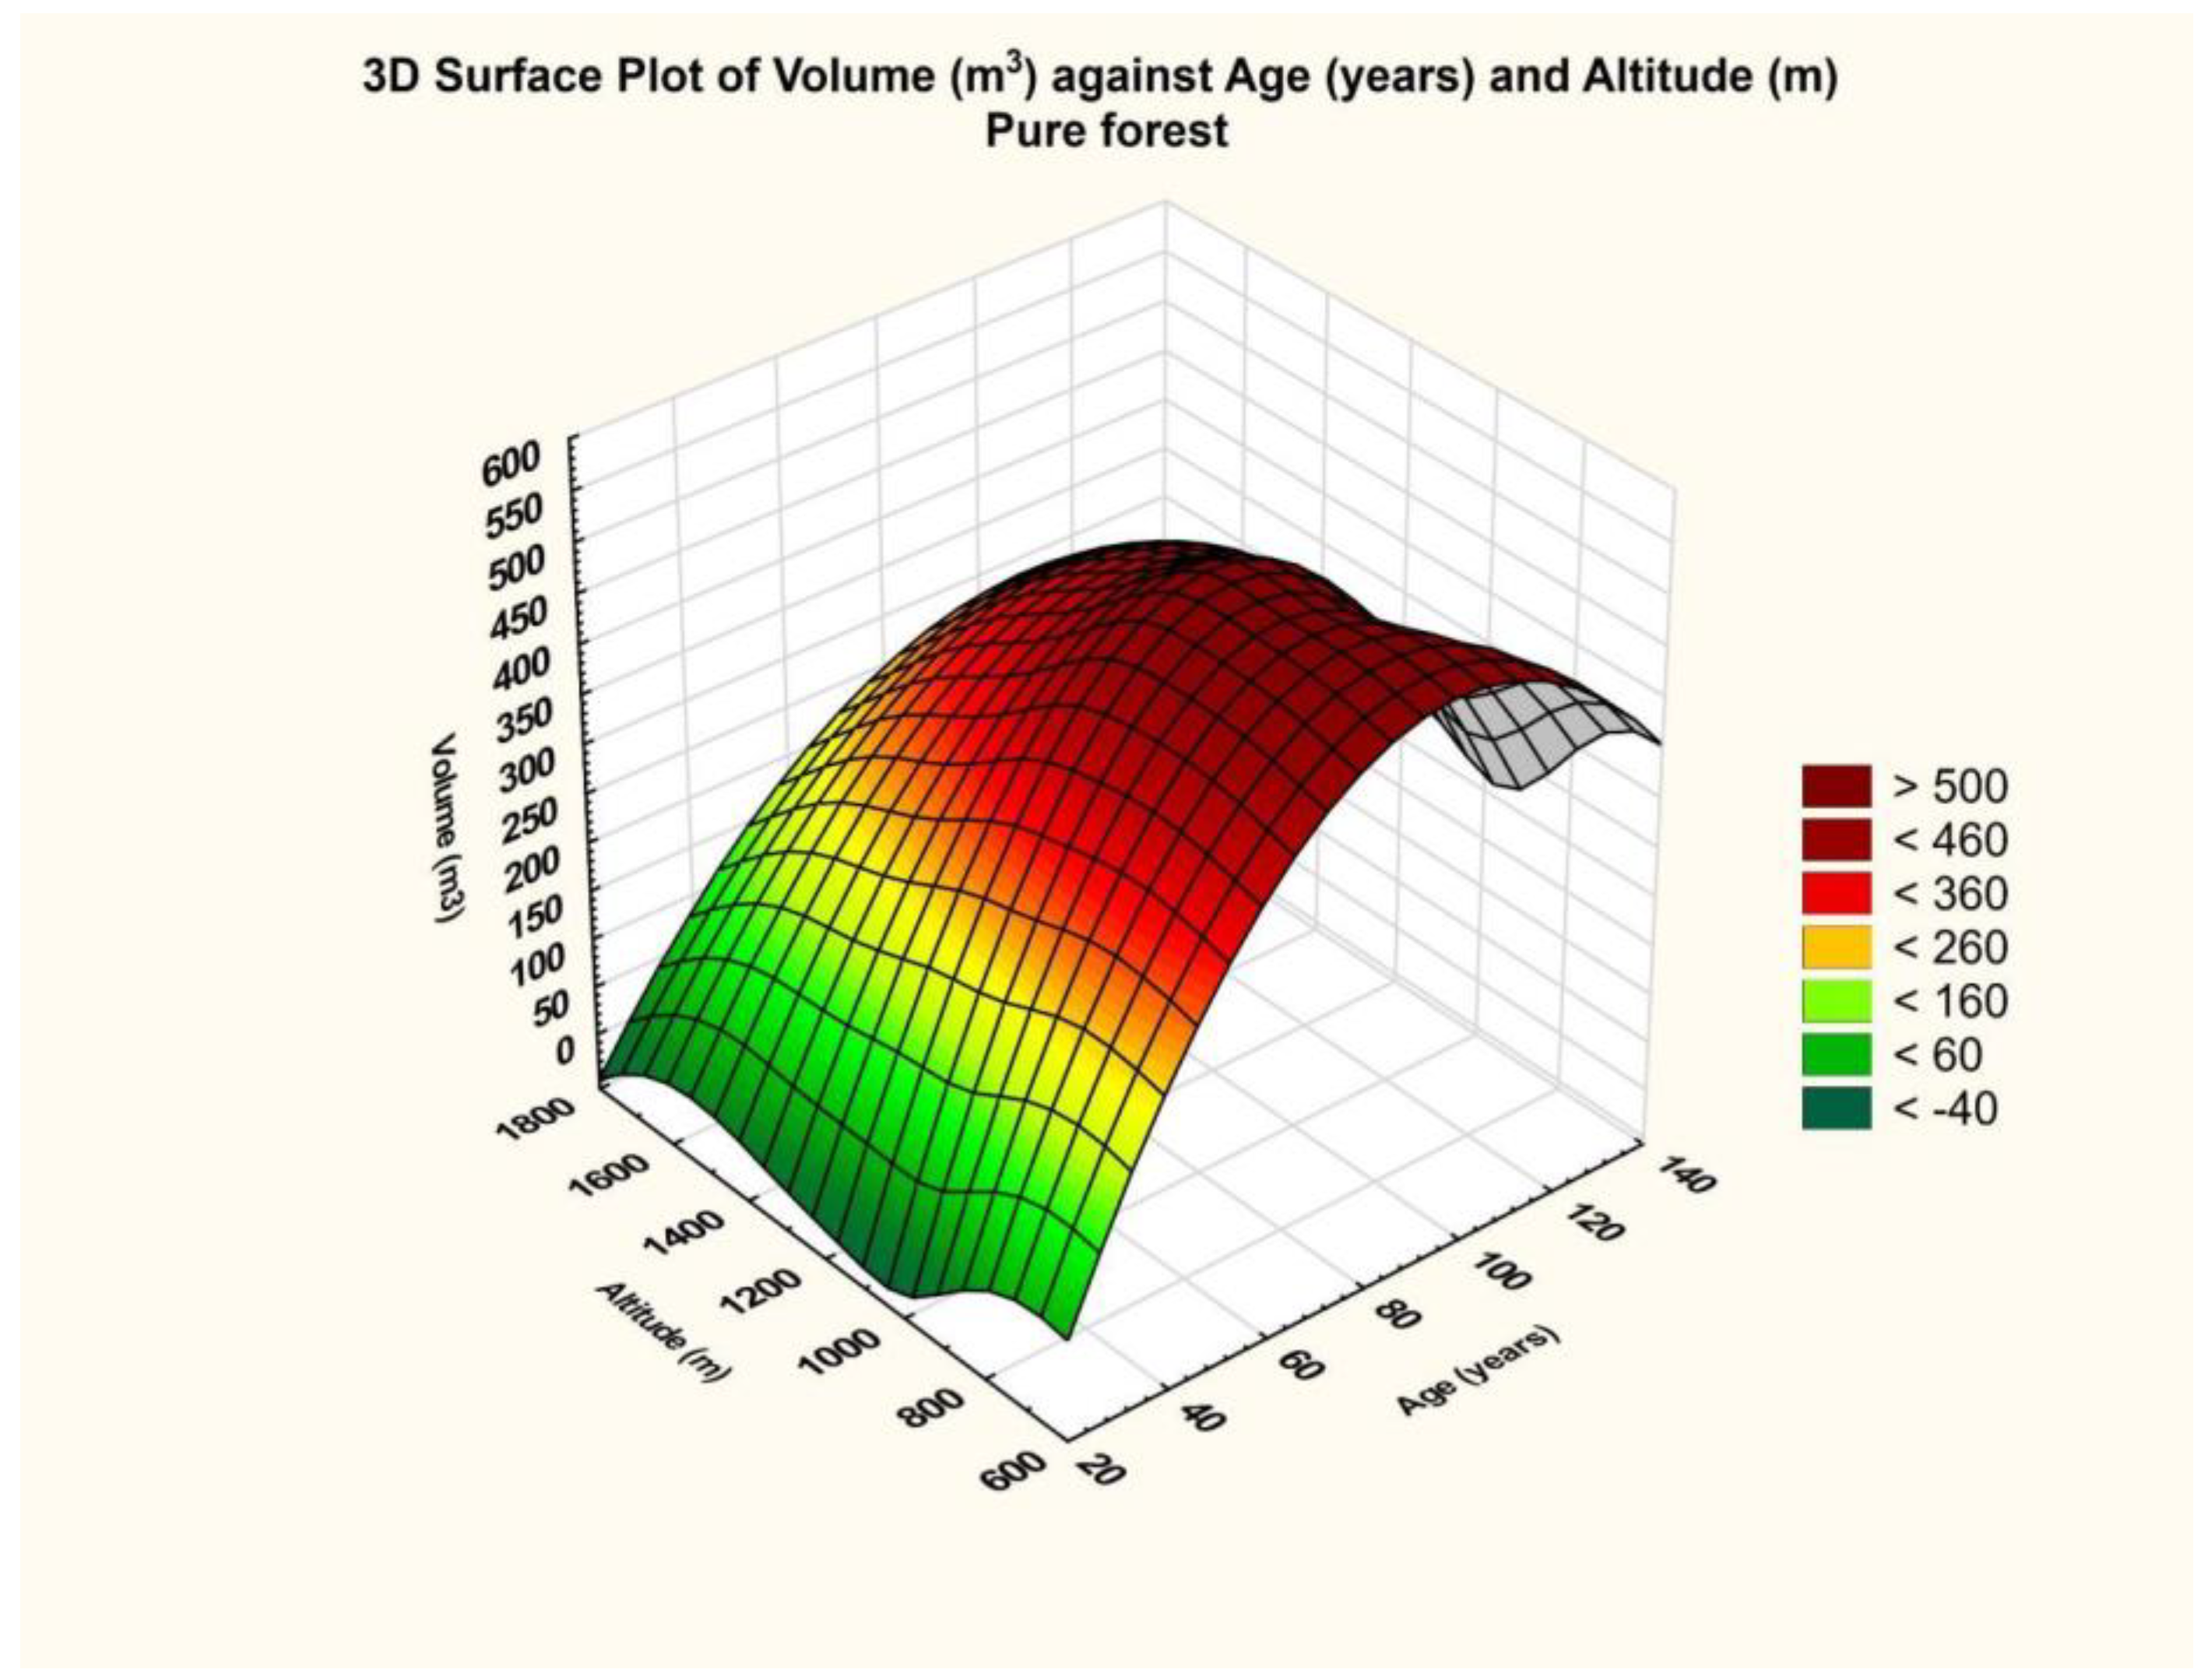
For pure stands, the results are presented in
Table 7.
The final result is that for the database related to the western area, the altitude dependence was significant (p = 0.00). The same cannot be said about the dependence on age, which was insignificant (p = 0.00).
Furthermore, considering the evaluation scale of the partial coefficient eta squared, namely 0.01—small effect size, 0.06—medium effect size, and 0.14 or greater—large effect size, it turns out that the effect generated by altitude was intense, and the effect generated by age on volume size was also intense. This fact results from the graph above (
Figure 10), which shows a maximum, and the curvature along the altitude axis is more pronounced.
4. Discussion
The transect method is used in numerous biological studies [
38,
39,
40,
41,
42]. In the forestry domain, the transect method has been used for monitoring animal populations [
43,
44,
45,
46] as well as vegetation [
47,
48,
49]. In our case, the distribution of the Carpathians in Romania allows us to analyse some transects located on the east–west and north–south directions in relatively homogeneous climatic conditions. This leads to conclusions regarding the growth differences in these areas for its most widespread species—the Norway spruce.
The Norway spruce belongs to the forest tree species with the largest natural range. Its growth differences based on altitudes were also analysed by numerous researchers. From a genetic perspective, the highest differentiation among their origins was revealed on plots located at their minimum and maximum altitudes (350 and 950 m) [
50]. From a biometric perspective, spruce stand volume decreased by more than 50% between 1260 and 1434 m a.s.l. This means an increase in altitude of 100 m, while the stand volume decreased by nearly 200 m
3 [
51]. In the Czech Republic, Krejza et al. (2021) studied the growth and stress reaction of spruce to climatic conditions, analysing stem diameter variation along an elevation gradient (381–995 m a.s.l.); they concluded that the current climatic conditions in the central European region are not suitable for growing Norway spruce at lower and middle elevations and that forest management needs to react immediately to this situation [
52].
On the other hand, the presence of resonance spruce in large numbers in a mixture of fir and beech demonstrates the great plasticity of this species, which at altitudes of 1200–1400 m and 1600–1800 m in the Romanian Carpathians can record better growth and wood of superior quality [
53].
Unlike previous studies, we analysed the volumes realised by spruce stands of the same age at the same altitudes but in mountain clines differentiated by exposition. In this way, we found that the volumes from the Eastern Carpathians at the same altitudes are higher on the eastern cline than on the western one at altitudes of 700–1000 m. Furthermore, in the Southern Carpathians, the volume of trees in the southern cline is greater than that of trees in the northern cline for altitudes between 1300 and 1600 m.
The explanation of this interesting scientific fact as well as its exceptional practical applicability consists of the influence of climatic and orographic factors. In the case of the Eastern Carpathians, the climate from the eastern cline is gentler, with higher temperatures and precipitation.
As van der Maaten-Theunissen also observed, spruce growth at low altitudes is positively related to precipitation and negatively related to temperature during the growing season [
54]. The supply of precipitation water is the main factor that limits growth at low altitudes (up to 600 m). A weak or non-relationship between the weather and radial growth is present between 600 and 800 m, while at altitudes over 800 m, such as mountains and the Alps, significant associations between temperature, radiation, and tree growth for both spruce and beech species are observed [
55].
Higher growth is more related to the average monthly temperature and precipitation. Lower temperatures have a higher impact on northern as well as high-altitude locations. On the other spectrum, precipitation is known to increase in southern locations as well as at low altitudes [
56].
Altitude was found to be responsible for significant growth and temperature differences. Unlike trees from the upper forest limit, trees situated on the upper limit registered positive reactions to temperatures, especially autumn ones. Temporal variations were represented by a slight decrease in influences posed by autumn temperatures (mainly October ones) and an increase in spring temperatures (mainly May) [
57].
By analysing the climate–growth correlation, we could see some spruce network sensitivity to drought. Elevation is the main factor responsible for these responses. As such, spruce trees from lower altitudes are negatively influenced by high temperatures and drought, while the warm climate from higher altitudes has a positive effect [
58].
In the case of the Southern Carpathians, the field’s orography plays a primordial role in differentiating the growth of spruce stands. The north climate is characterised by steep slopes and a relatively narrow spruce longitudinal distribution, while the southern cline has smaller slopes and larger geographical distributions. These conditions lead to higher volume growth in the Norway spruce stands of the same age when compared with the northern cline.
In the case of beech (
Fagus sylvatica L.), an experiment conducted in Postavaru Mountain from the Southern Carpathians demonstrated that north-facing slope trees were significantly slenderer (higher H for any given D) than south-facing slope trees. At the same time, the north-facing slope trees had significantly longer-branching systems compared to south-facing slope trees [
59].
In another study conducted in the Eastern Carpathians, Irantzu Primicia et al., revealed that the Norway spruce trees were particularly sensitive to summer precipitation under forecasted climate warming scenarios, while trees located at high-elevation sites may be favoured by warmer conditions. Old trees or trees under high-competition pressure located at low-elevation sites will be the most vulnerable to drought [
60]. Some forest types (e.g.,
Picea abies (L.); karst forests) in the Southern Carpathians will notably increase their standing biomass due to climate change as compared to other types such as Quercus forests [
61].
In one study regarding growth variations in the Norway spruce across latitudinal and altitudinal gradients in central and northern Europe, Harri Mäkinen et al., discovered that the limiting effect of low temperatures was more significant at northern as well as high-altitude sites, while the importance of precipitation increased in the south and at low altitudes [
56].
Considering all of the significant differences in the case of the present study, pure spruce stands were found to have higher growth than the mixed ones at the same age and altitude both in the Eastern Carpathians and in the Southern Carpathians. Similar results were obtained in Austria, where Norway spruce grows better in pure stands than in an otherwise comparable mixed-species stand [
62]; in Norway [
63], Poland [
64], and Germany, beech growth can be promoted by a mixture of spruce, particularly on excellent sites [
19].
Dissimilarly, in low-land Central Europe, other studies confirm that mixed stands of spruce and beech produce 20% more biomass per hectare than pure stands [
65]. On the other hand, the susceptibility of spruce (three times higher) compared to beech depends on its sensitivity to repeated gusts of wind [
66]. Thus, strategies such as avoiding sensitive areas (on wind-exposed sites) or promoting mixed stands may be more effective. Past studies found that even a 10% mixture of deciduous or coniferous trees such as Douglas fir and fir can reduce the vulnerability of stands to storms provided that the soil properties are favourable for rooting [
66]. Indeed, recent studies have confirmed that terrain configuration and forest composition can influence the stability of spruce stands, the most affected being stands located on slopes exposed to wind gusts and then monocultured with spruce stands [
8].
5. Conclusions
The conclusions of this study can be summarised as follows: (i) in the Eastern Carpathians at the same altitudes, the volumes are higher on the eastern than on the western cline at altitudes of 700–1000 m; (ii) in the case of the Southern Carpathians, for altitudes between 1300 and 1600 m, the volume of trees in the southern cline is greater than that of trees in the northern cline; (iii) pure spruce stands have higher growth than mixed stands at the same age and altitude, with this being true in the cases of both the Eastern and Southern Carpathians.
For the eastern clines of Romania’s Eastern Carpathians (Oriental Carpathians) and Romania’s Southern Carpathians (Meridional Carpathians), in production stands, it is recommended that the spruce species be included in composition schemes due to its better growth. However, if there are protected areas where the soil consists of rocks, or the risk of wind damage is high, it is better to use mixed stands (spruce with beech) because they provide better stability.
At the same time, for production stands (not protection), we recommend pure spruce compositions due to the larger volume achieved by this species.
However, following the conditions of forestry strategies, mixed stands should be promoted in the future because a more varied or mixed composition of the stands could compensate for certain climatic and anthropogenic changes in the future. In this sense, a sustainable forest management can be developed to continuously ensure ecosystem goods and services while also minimizing the inevitable effect of climate change.


 ,
, 


