


Understanding Geodiversity for Sustainable Development in the Chinchiná River Basin, Caldas, Colombia

 ,
,  , and
, and 
Abstract
:1. Introduction
2. Geosystemic Framework
3. Materials and Methods
4. Results
4.1. Geology
4.1.1. Geological Diversity of the Chinchiná River Basin
- Igneous subclass
- Metamorphic subclass
- Sedimentary subclass
- Volcanosedimentary subclass
4.1.2. Geological Sub-Index of the Chinchiná River Basin
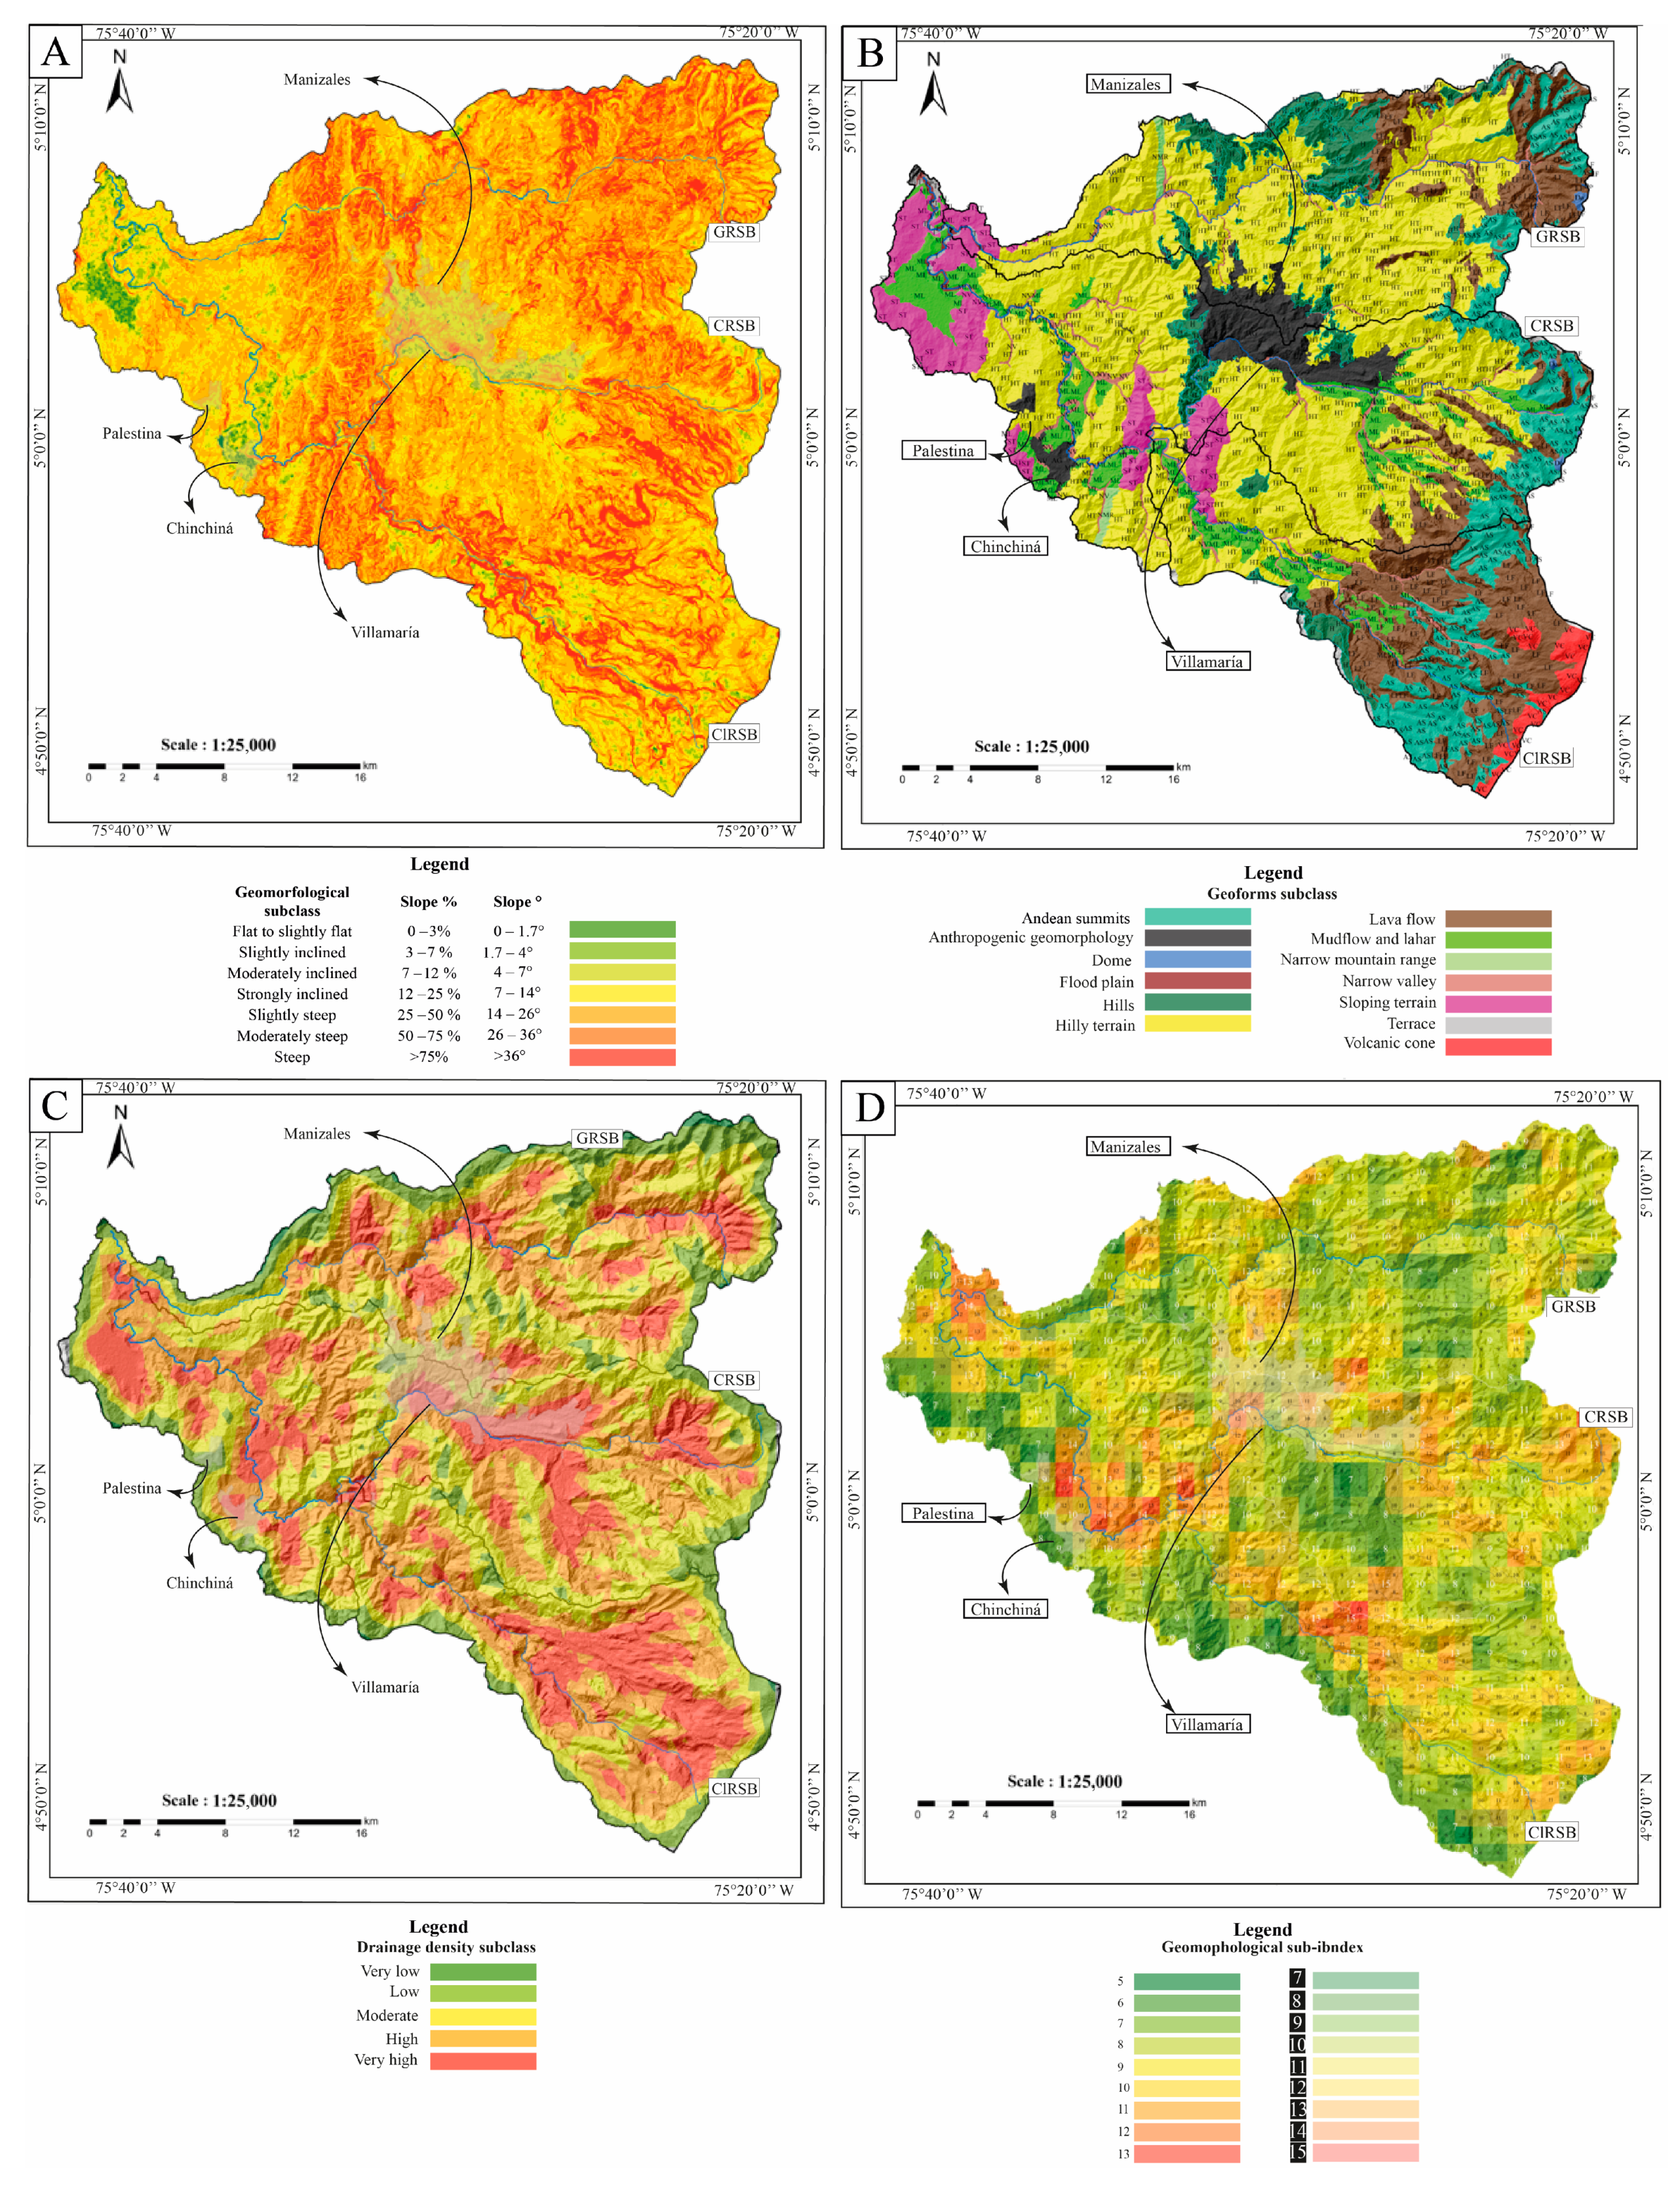
4.2. Geomorphology
4.2.1. Geomorphological Diversity of the Chinchiná River Basin
- Slope ranges subclass
- Landforms subclass
- Drainage density subclass
4.2.2. Geomorphological Sub-Index of the Chinchiná River Basin
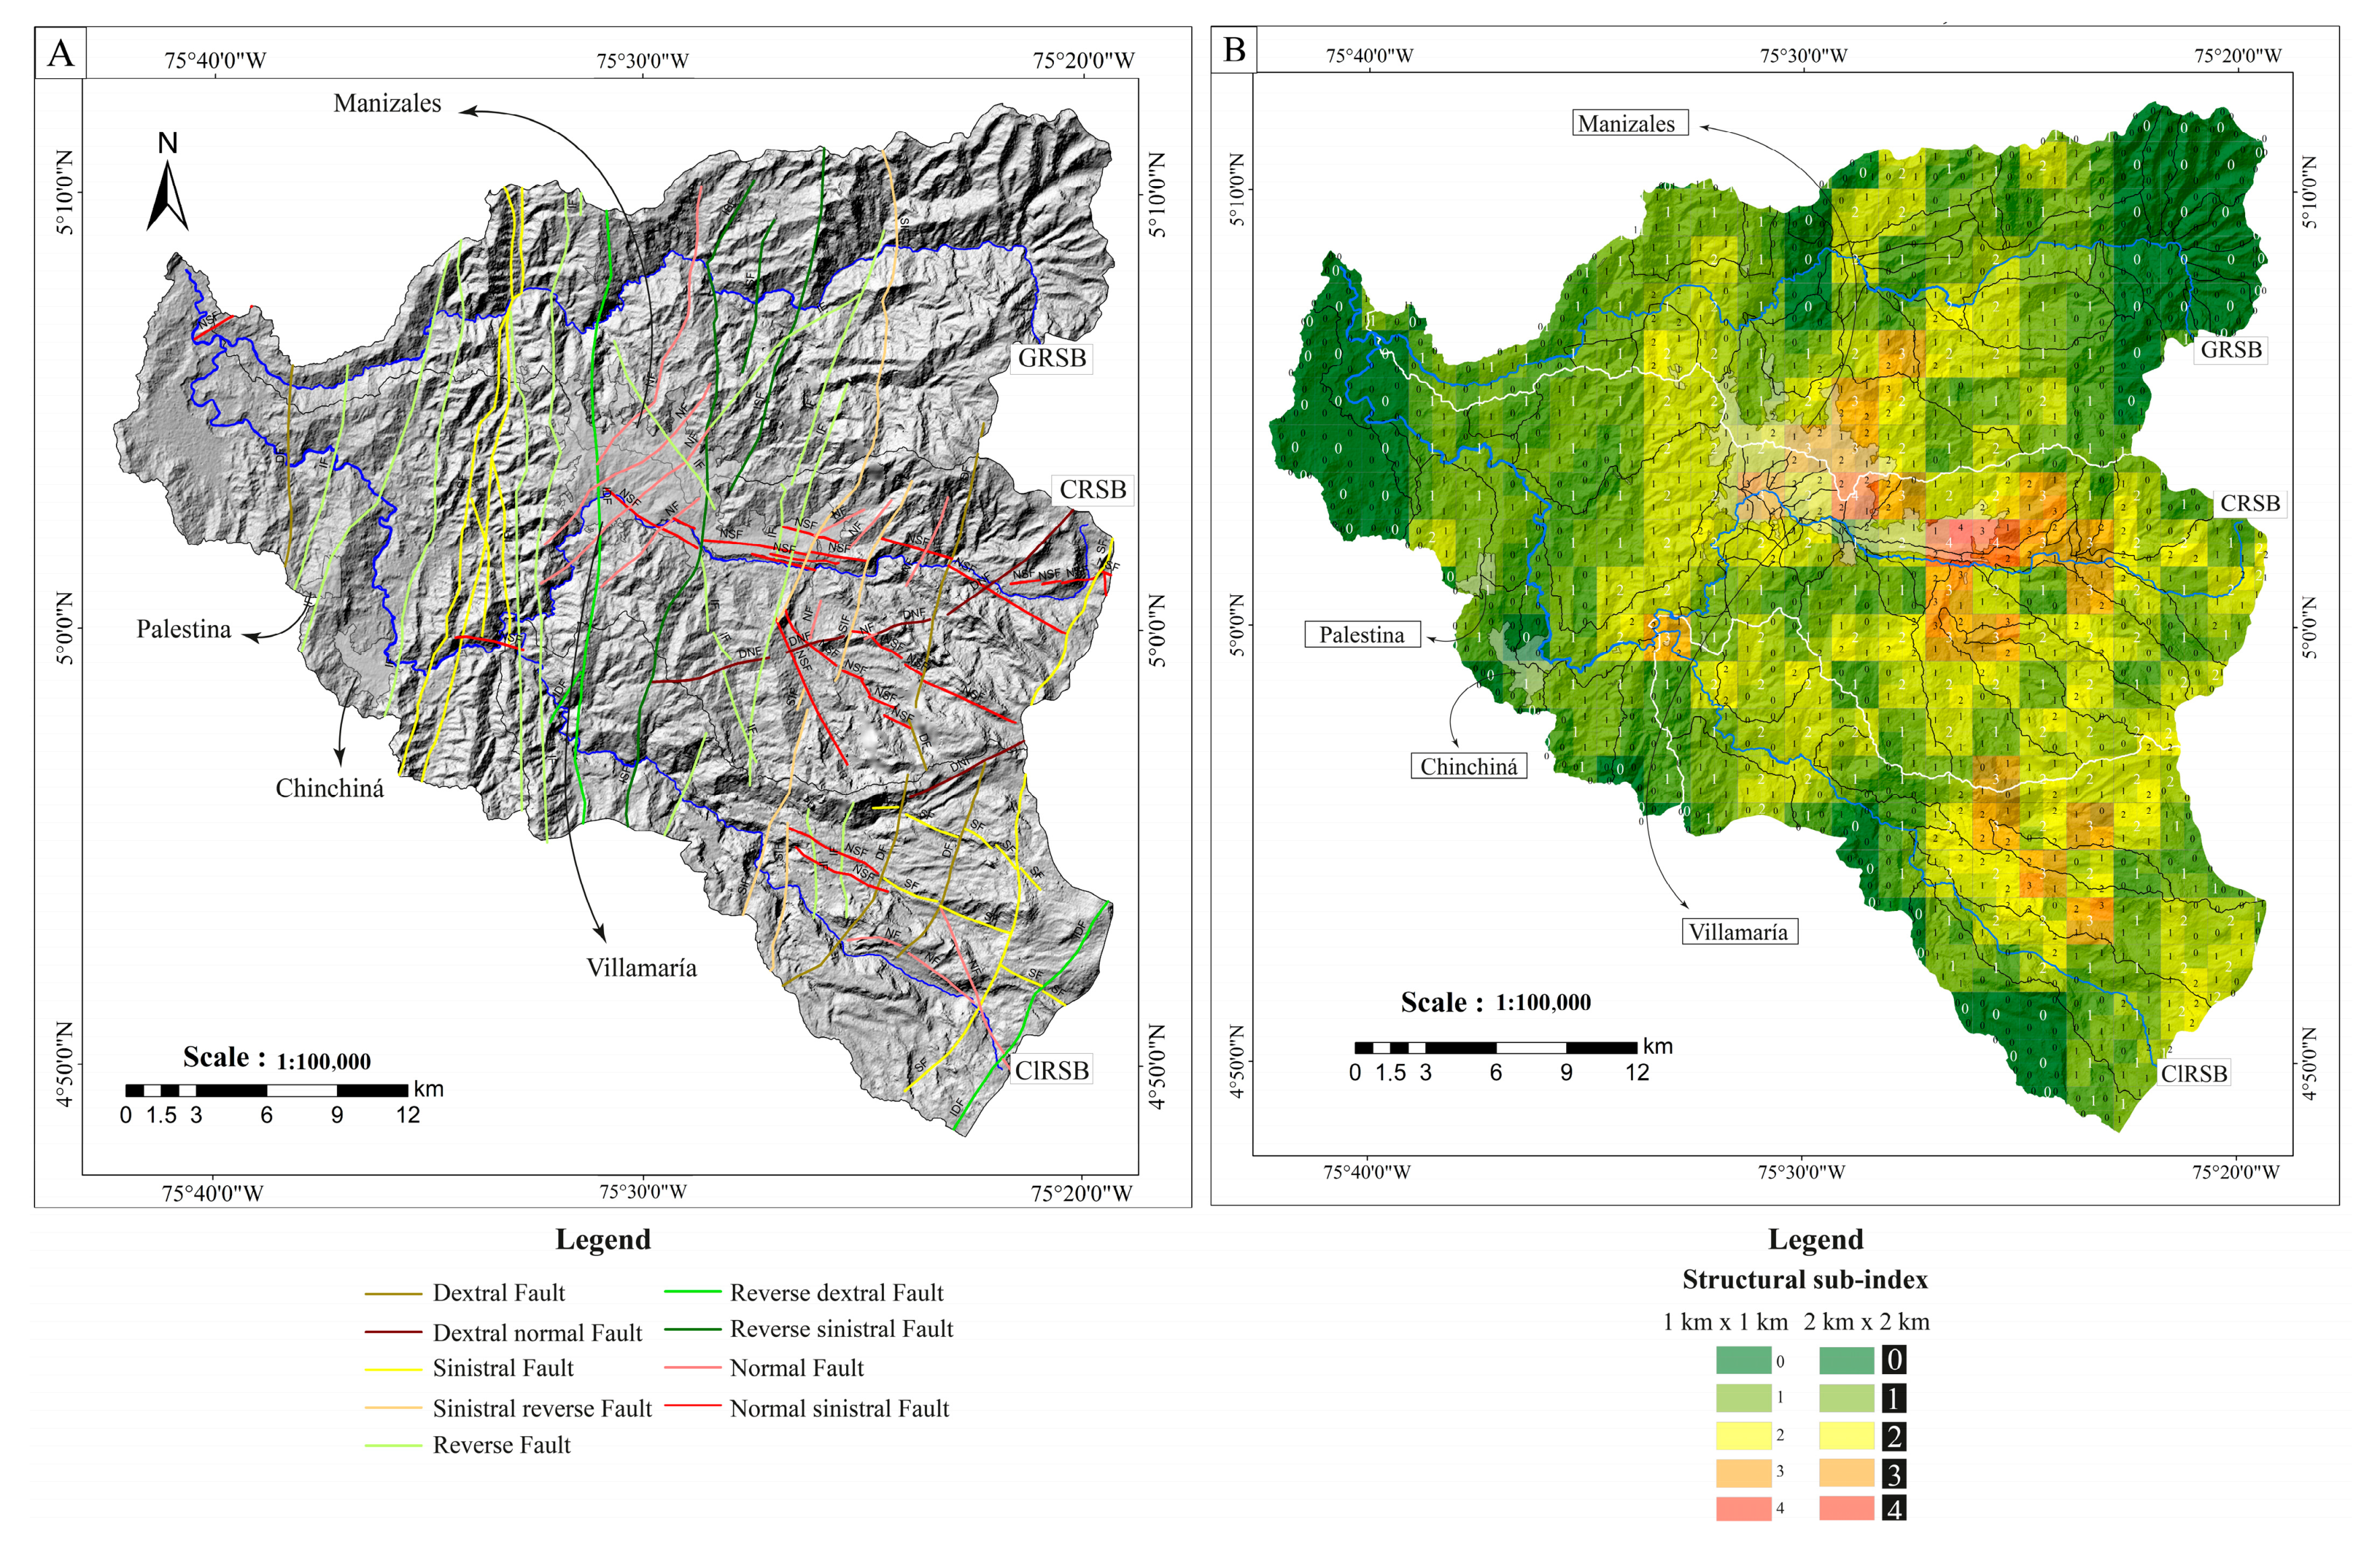
4.3. Structural Geology
4.3.1. Structural Geological Diversity of the Chinchiná River Basin
4.3.2. Structural Geological Sub-Index of the Chinchiná River Basin
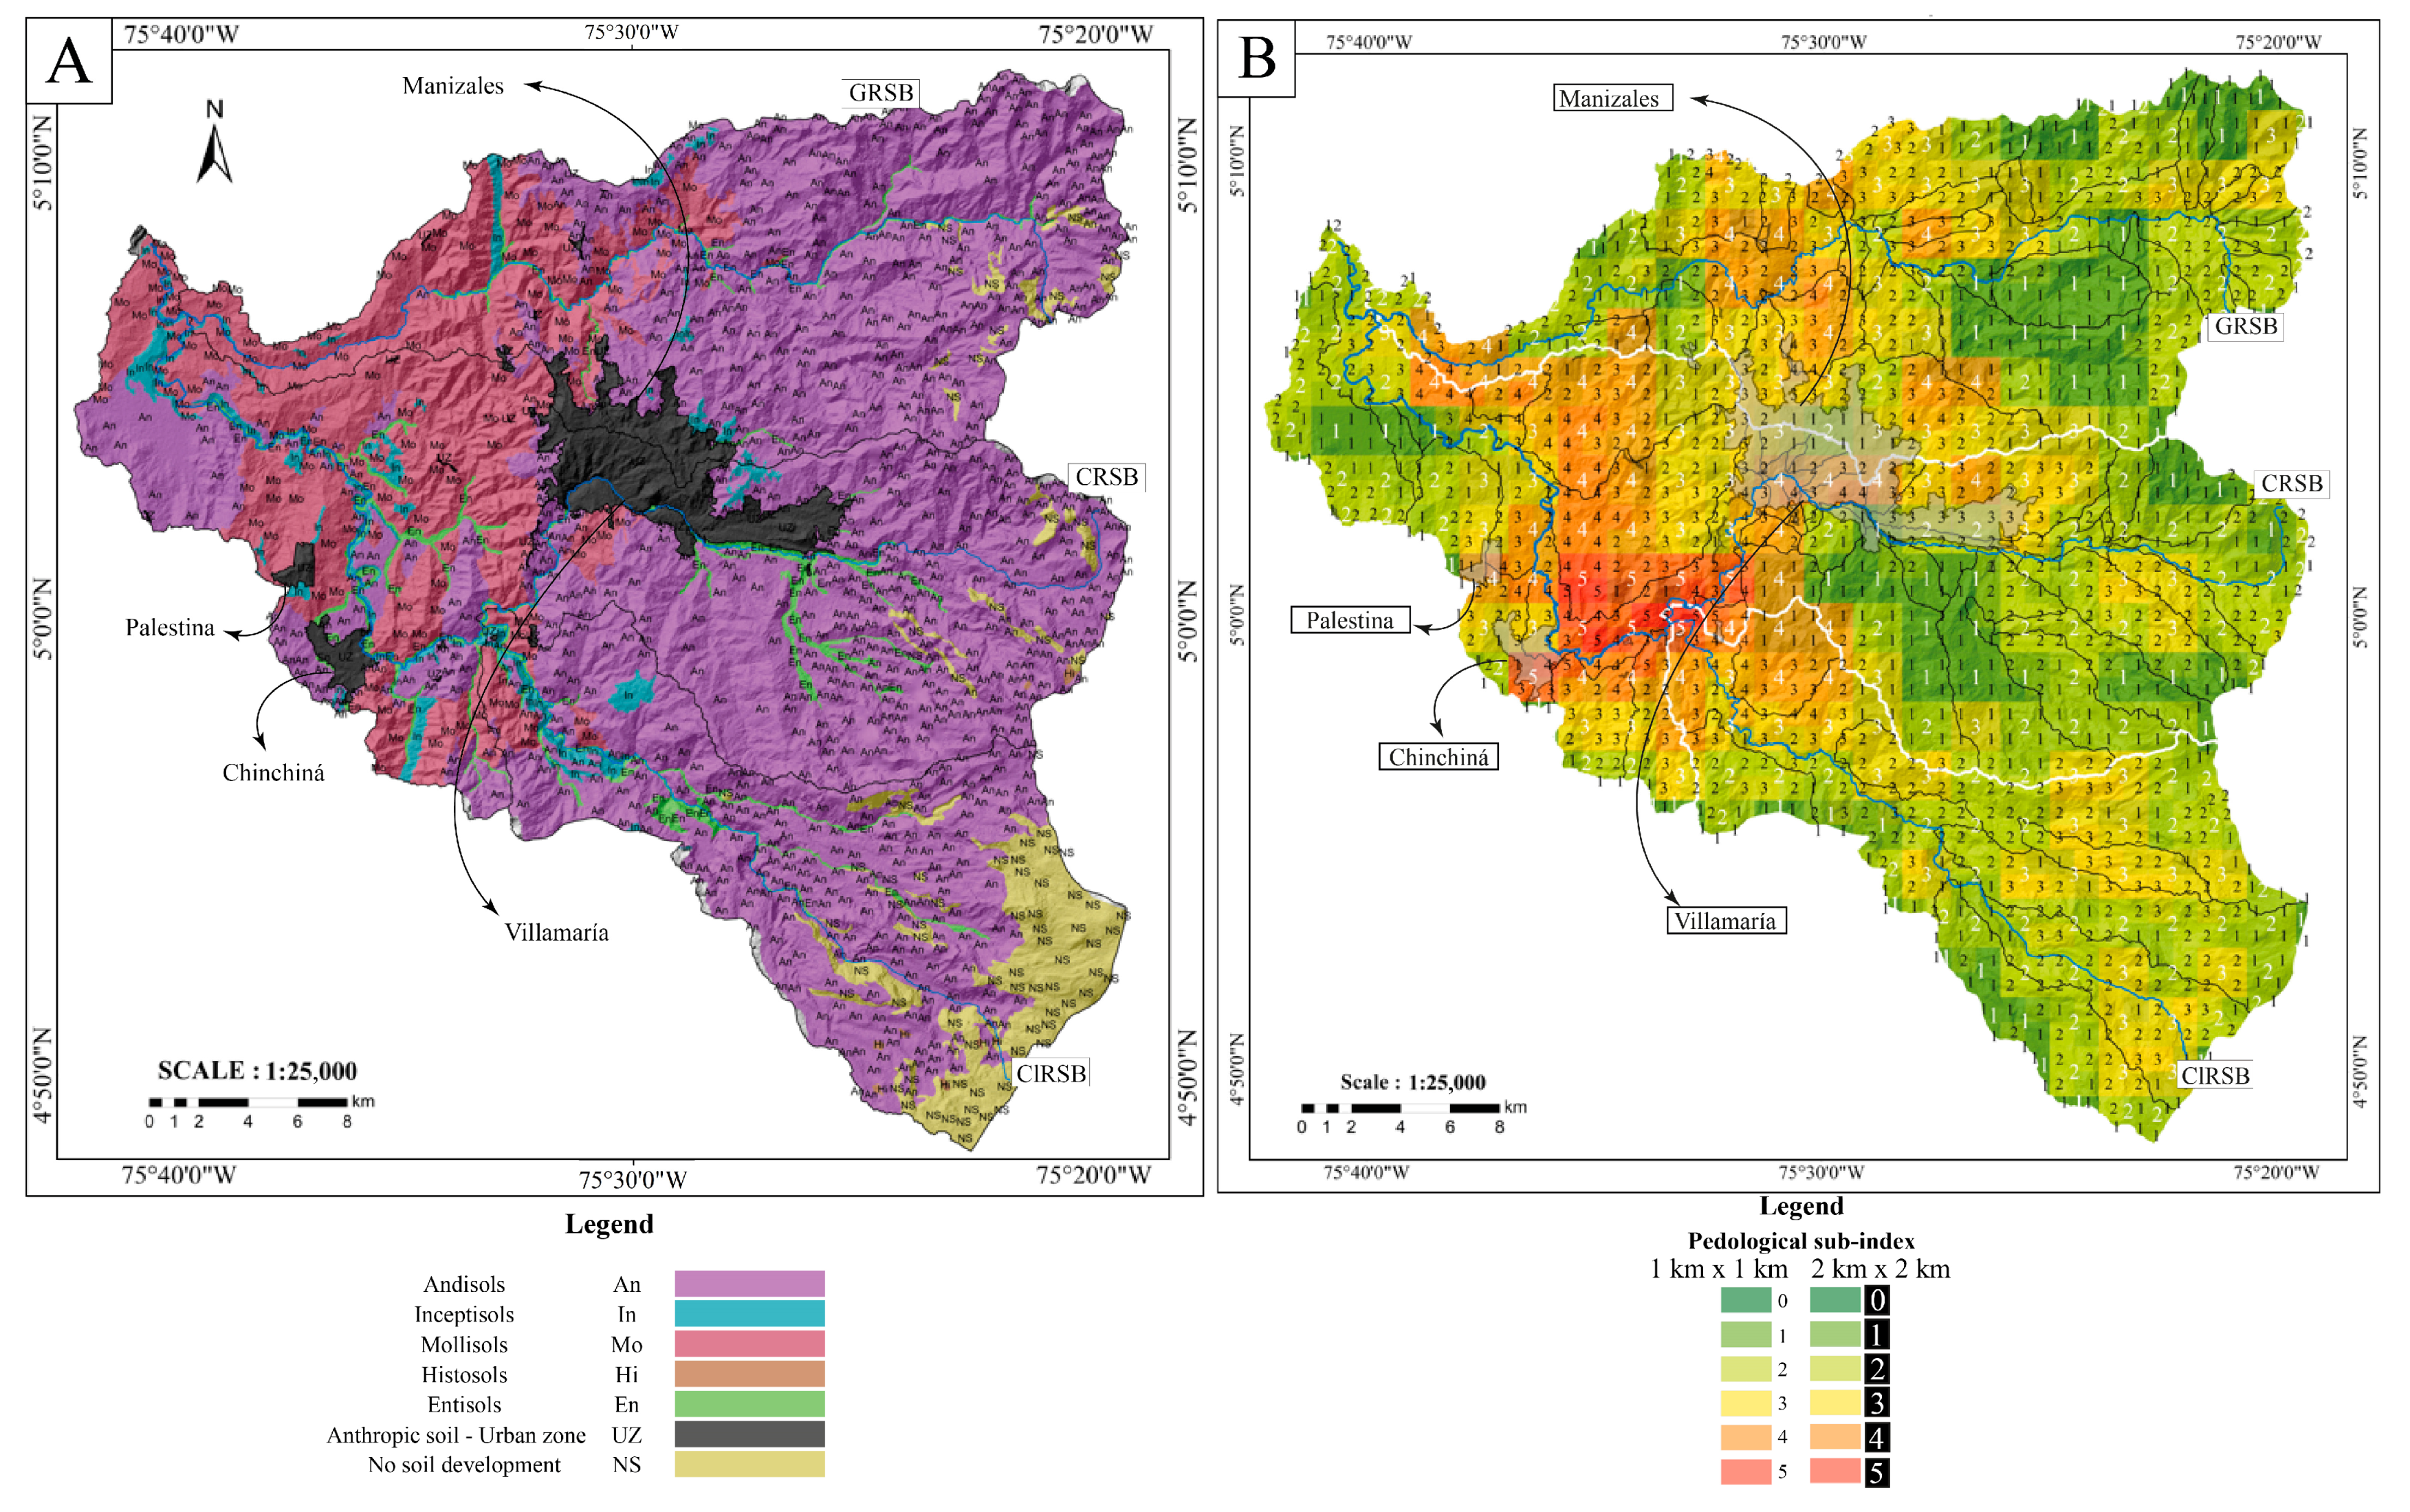
4.4. Pedology
4.4.1. Pedological Diversity of the Chinchiná River Basin
4.4.2. Pedological Sub-Index of the Chinchiná River Basin
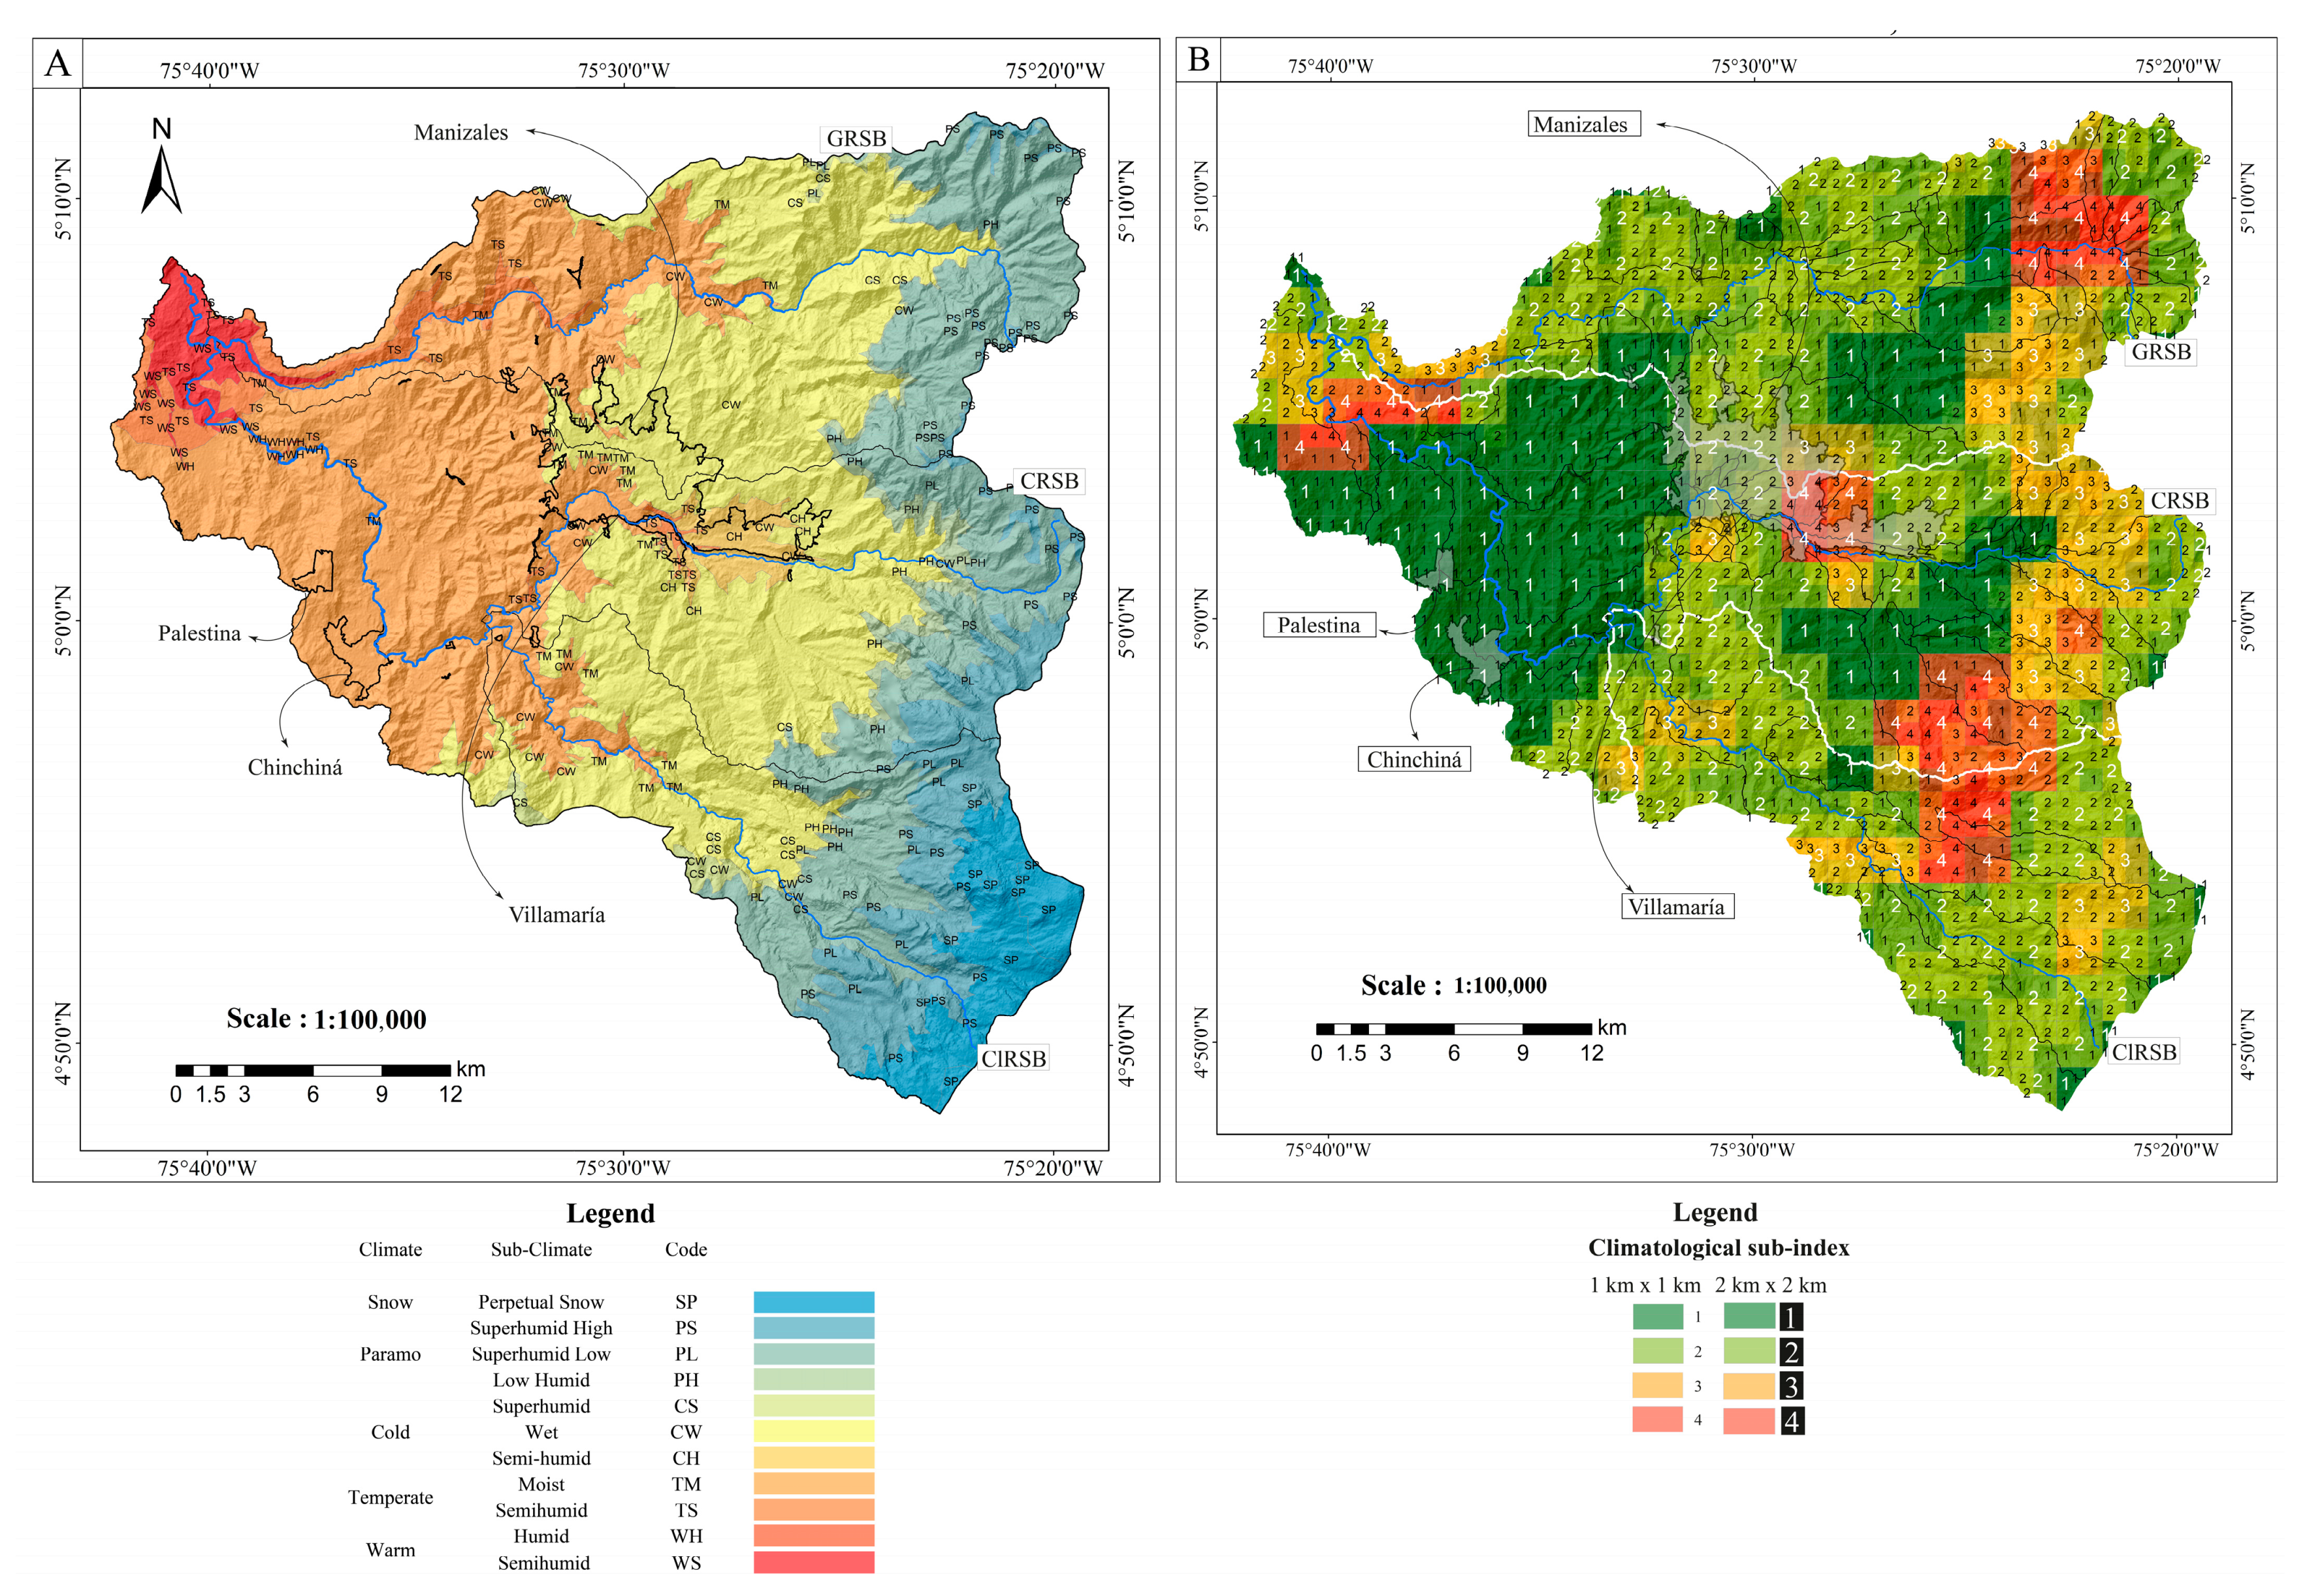
4.5. Climatology
4.5.1. Climatological Diversity of the Chinchiná River Basin
- Snow
- Paramo
- Cold
- Temperate
- Warm
4.5.2. Climatological Sub-Index of the Chinchiná River Basin
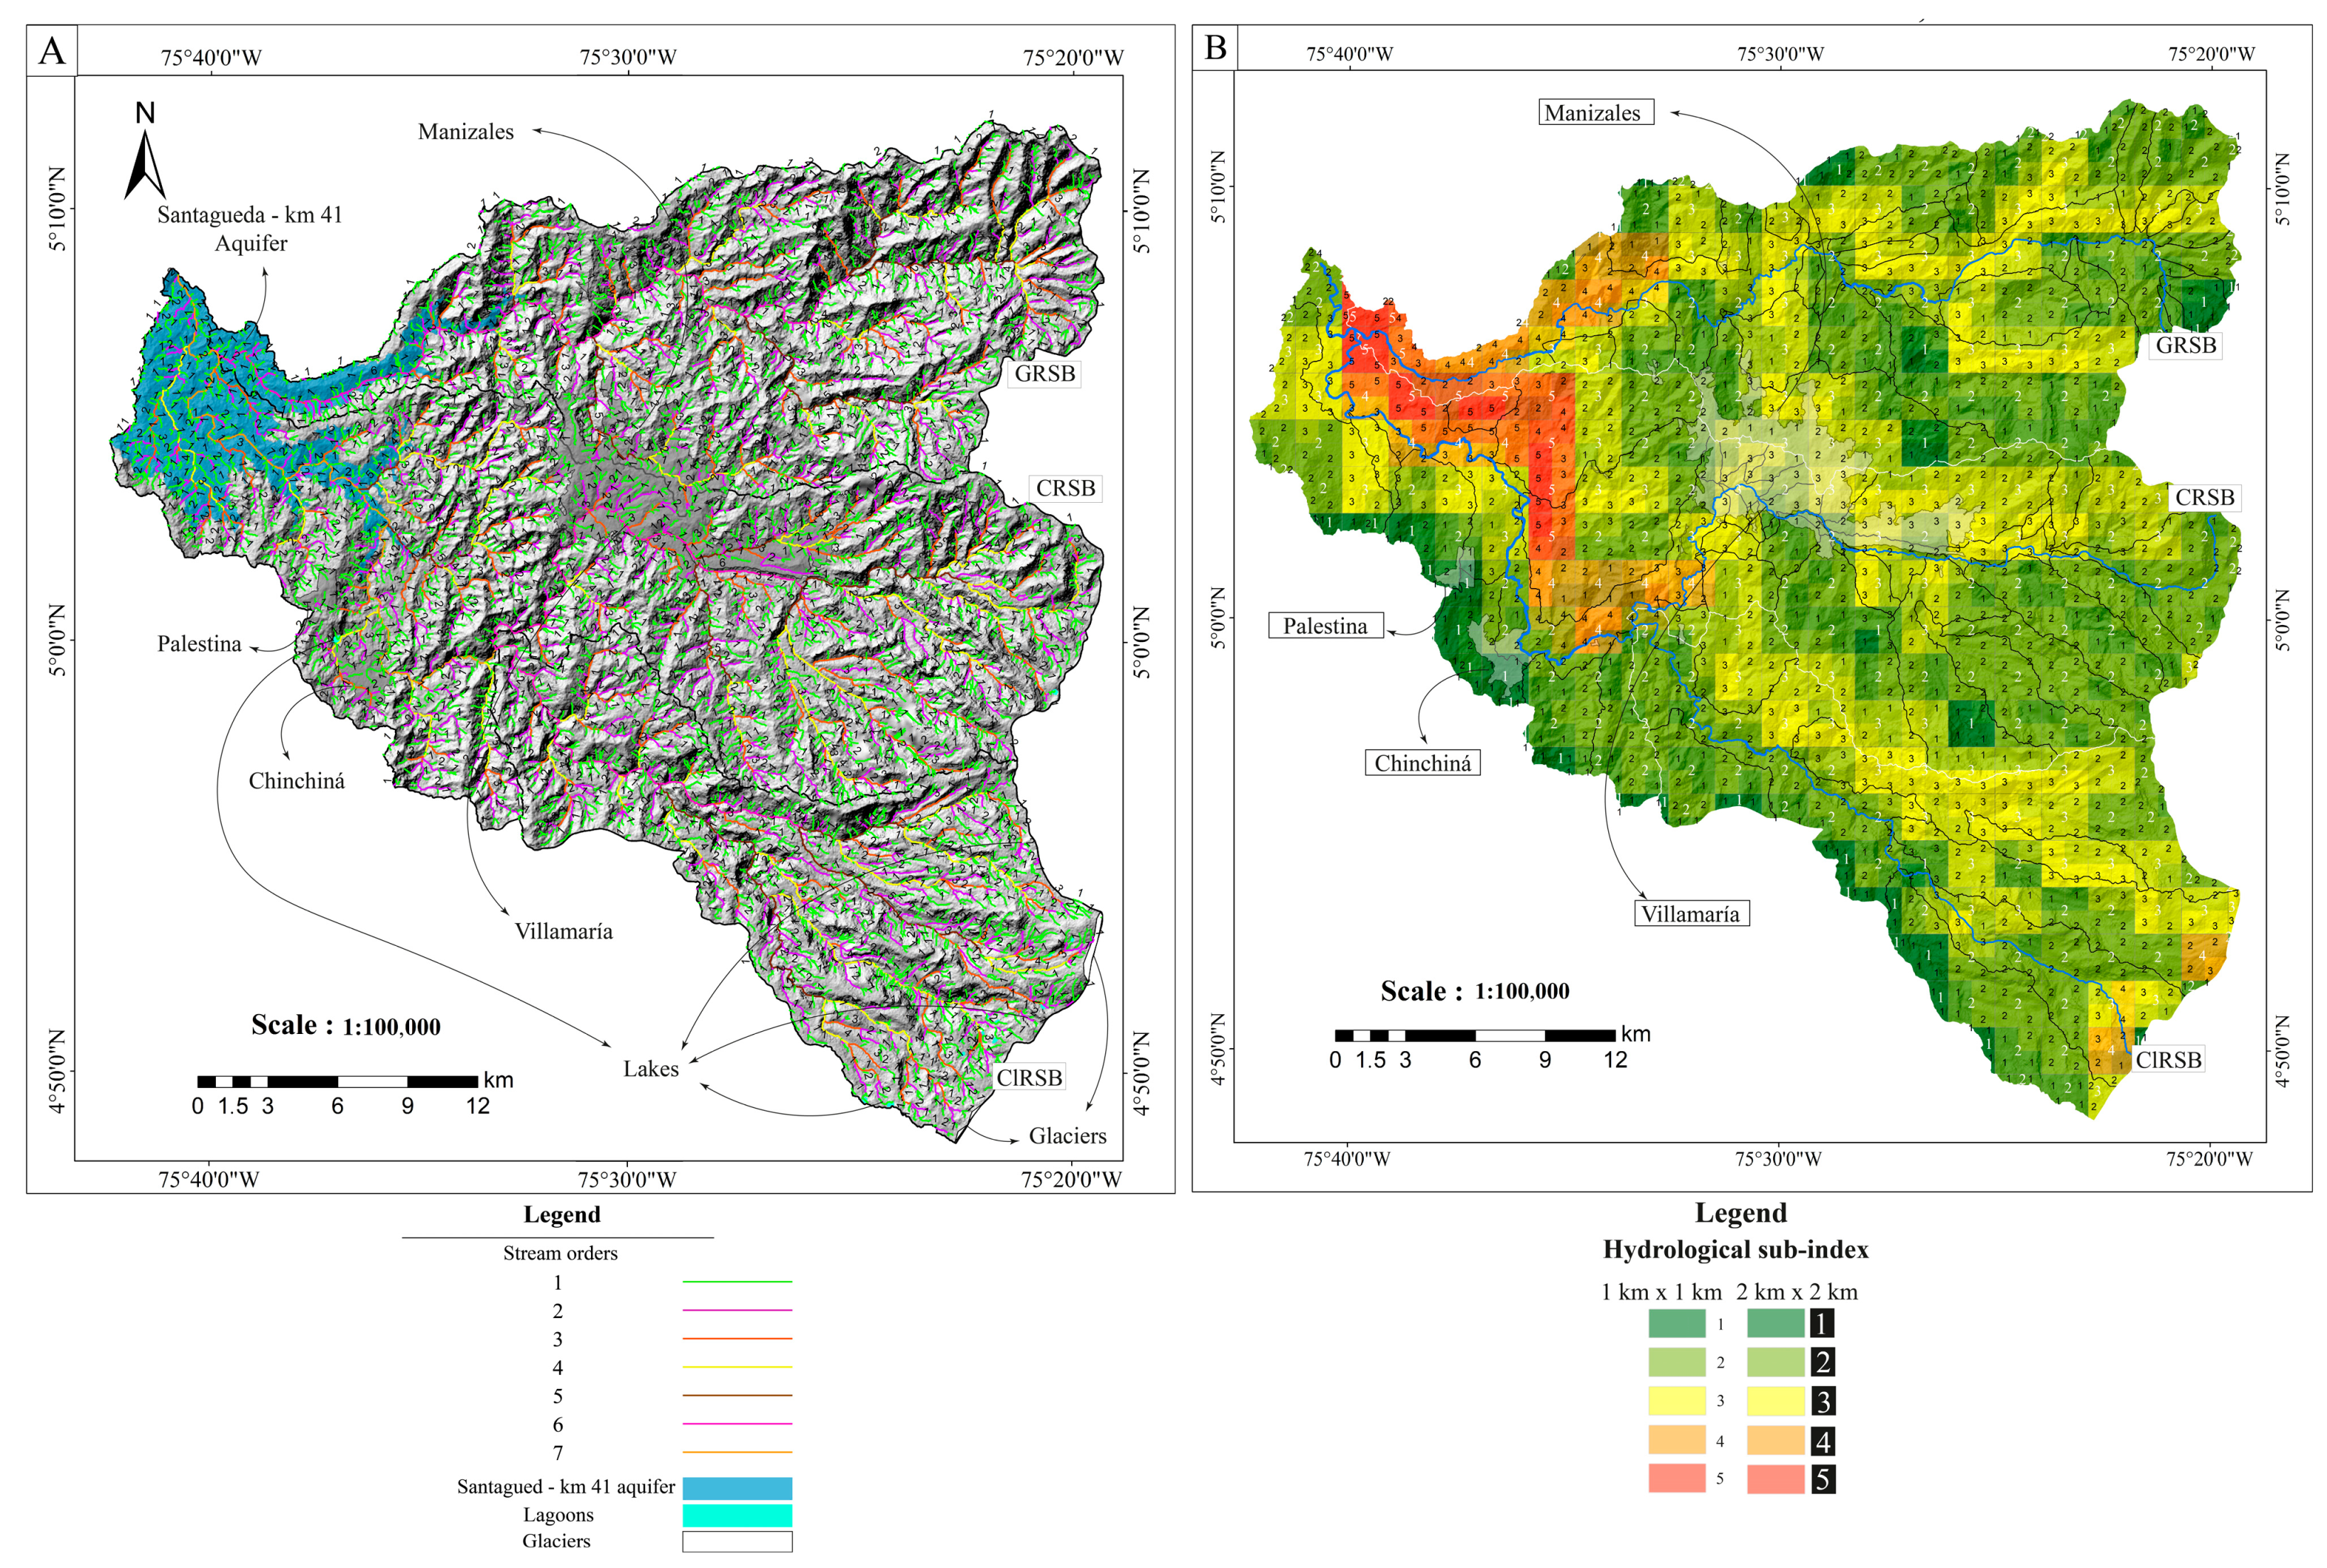
4.6. Hydrology
4.6.1. Hydrological Diversity of the Chinchiná River Basin
4.6.2. Hydrological Sub-Index of the Chinchiná River Basin
4.7. Volcanology
4.7.1. Volcanological Diversity of the Chinchiná River Basin
4.7.2. Volcanological Sub-Index of the Chinchiná River Basin
4.8. Geothermal
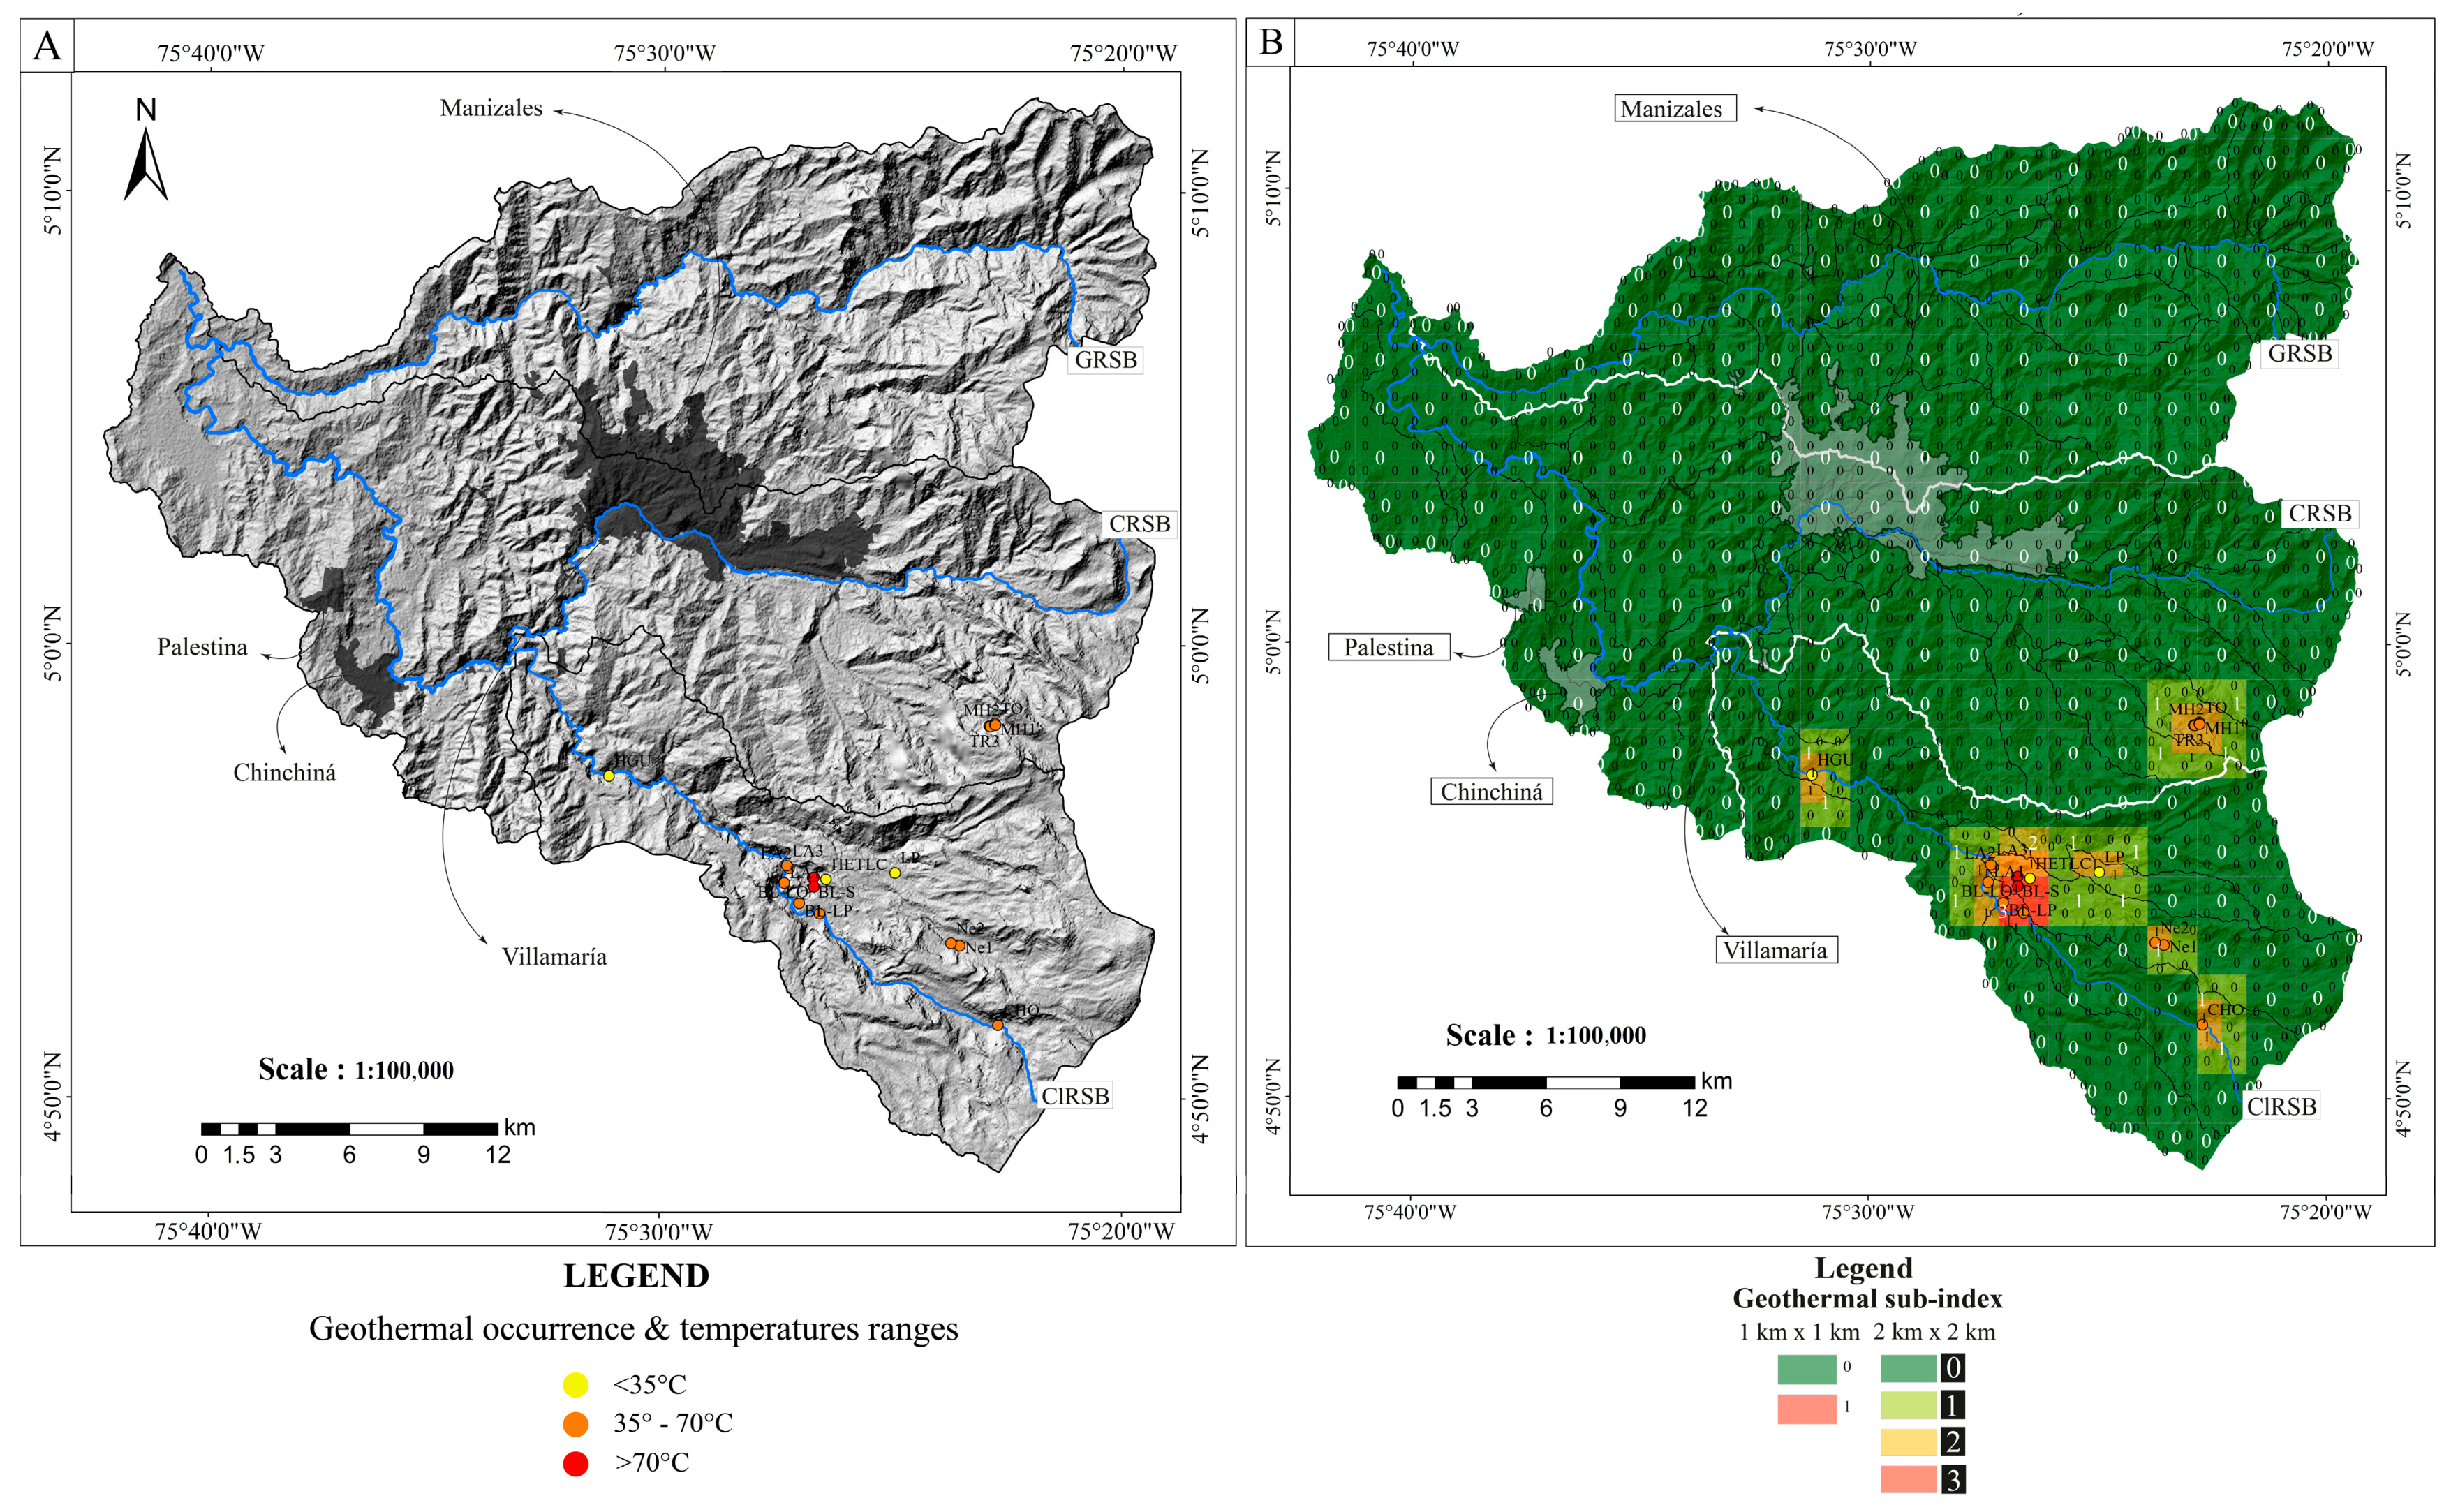
4.8.1. Geothermal Diversity of the Chinchiná River Basin
4.8.2. Geothermal Sub-Index of the Chinchiná River Basin
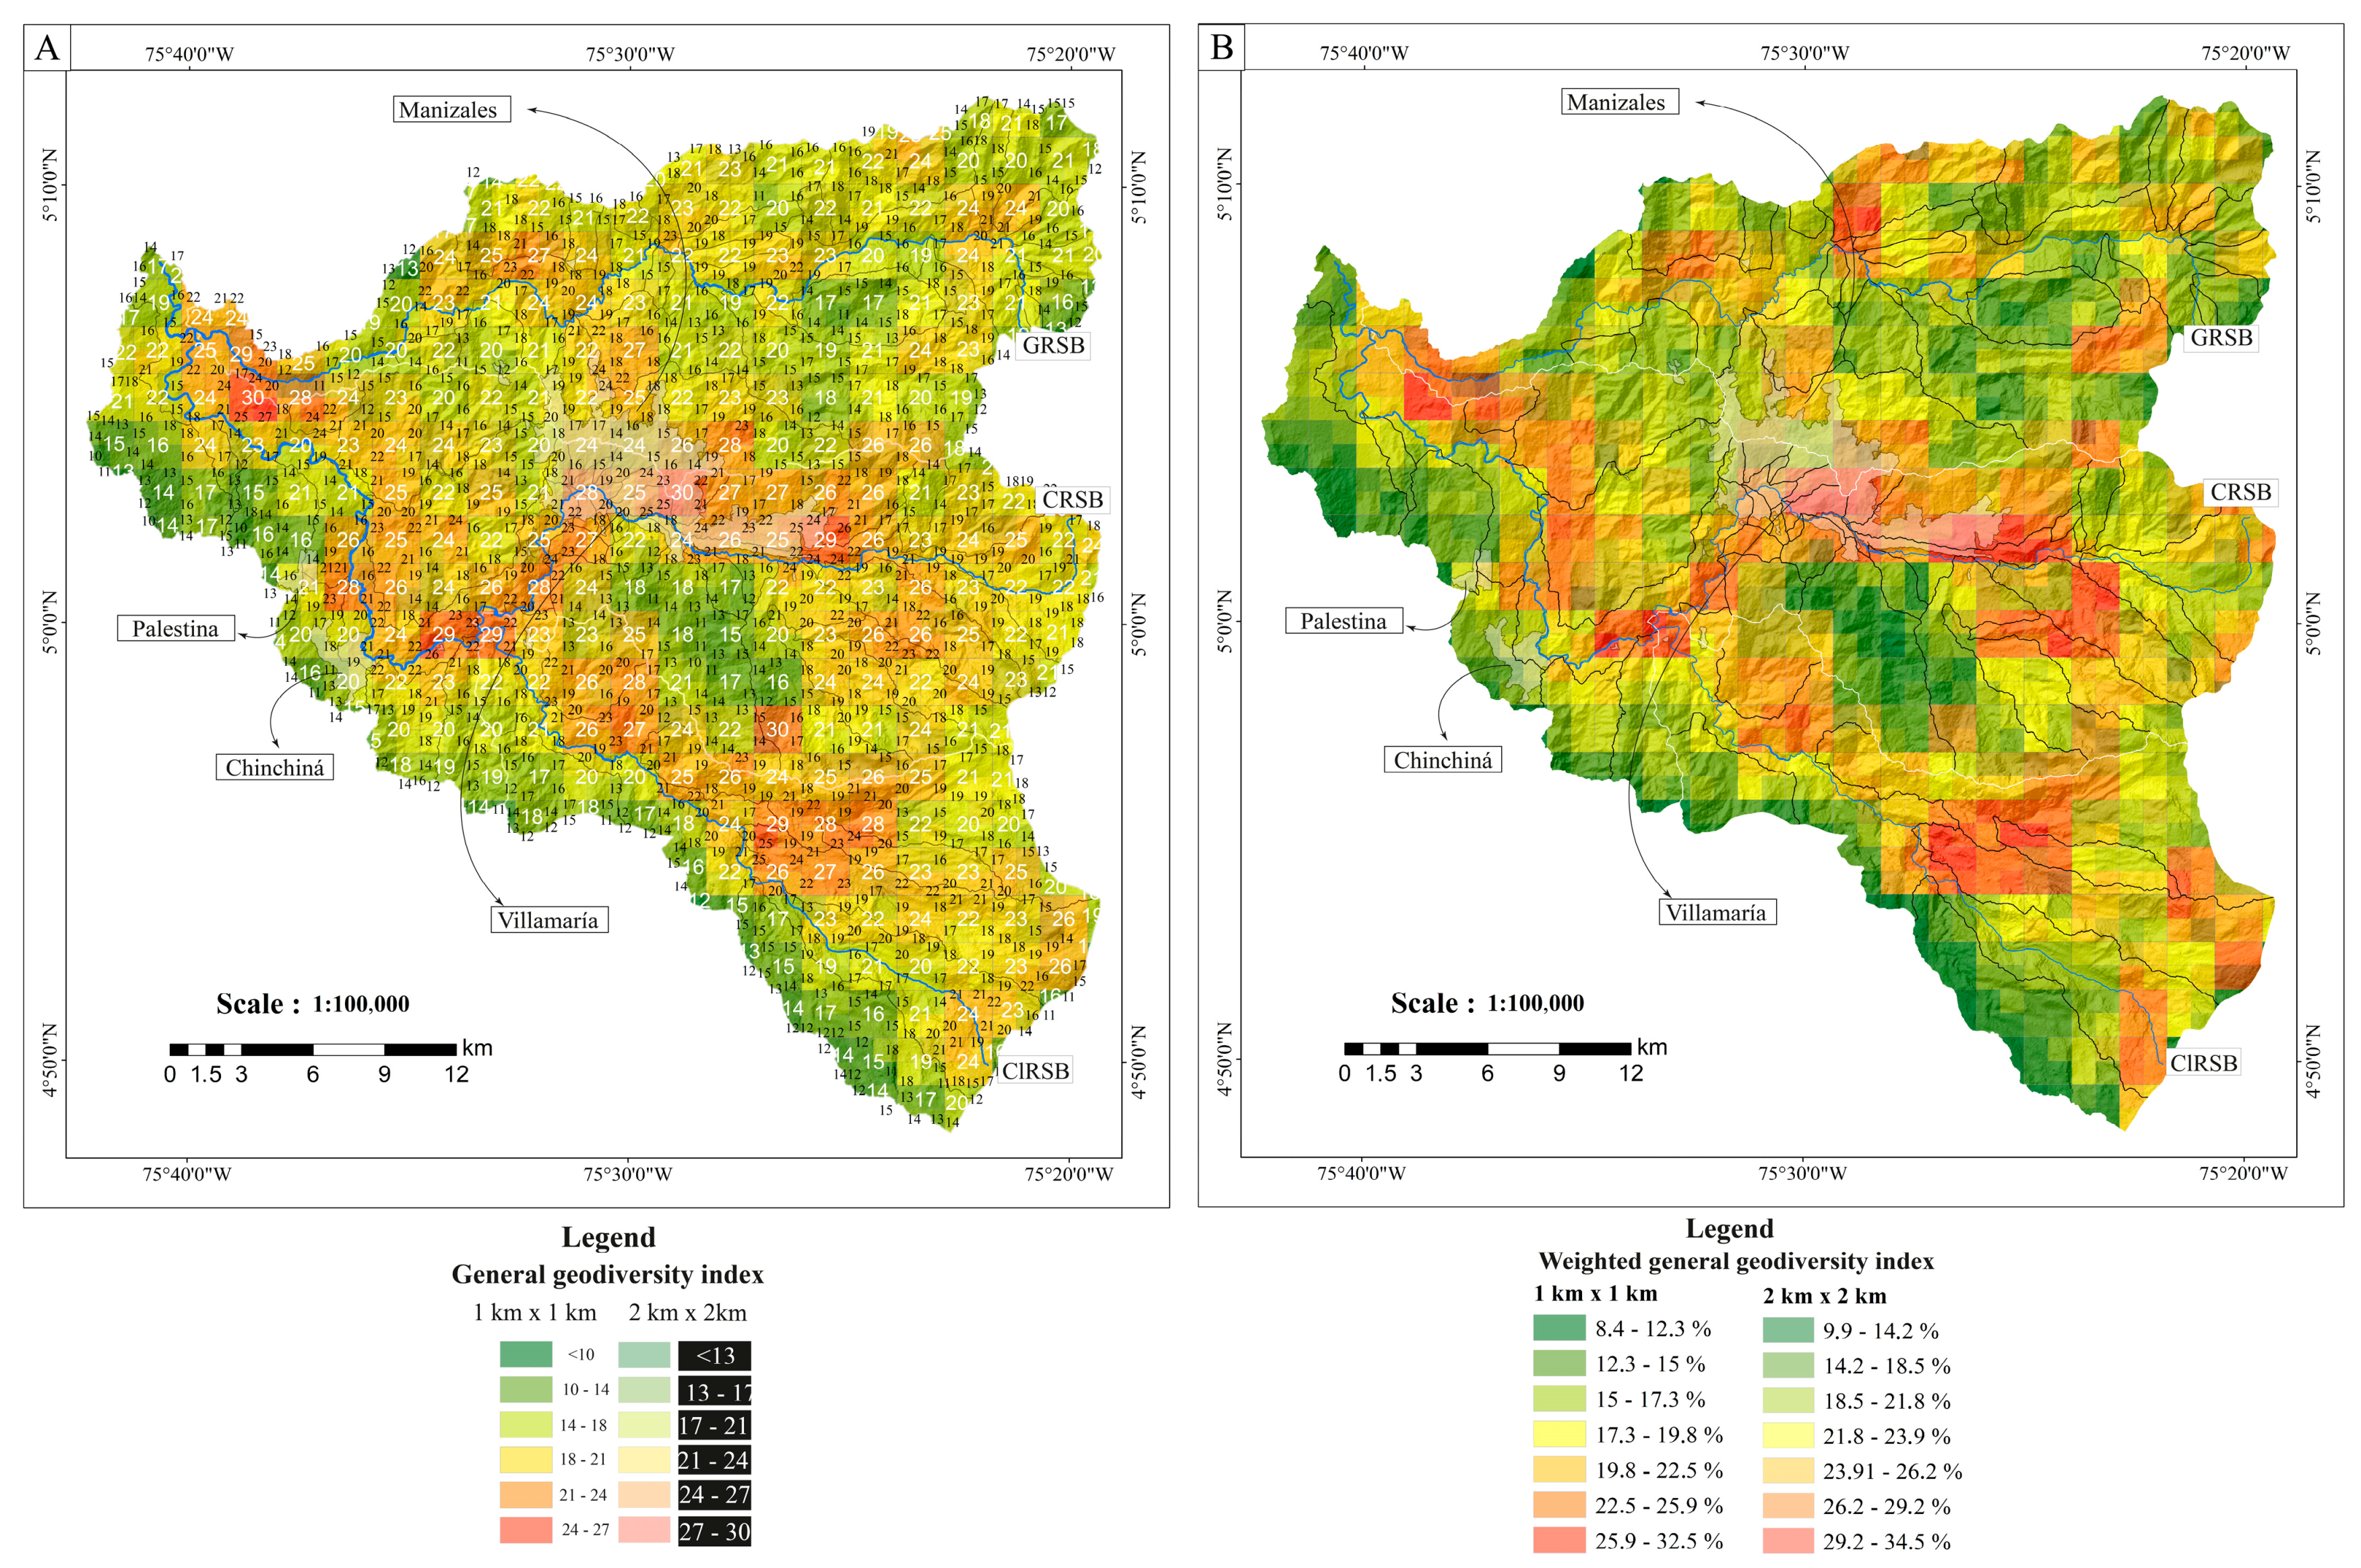
4.9. General Geodiversity Index
5. Discussion
5.1. Methodological Constraints
5.1.1. Quality and Scale of Information
5.1.2. Weighting of Classes
5.1.3. Influence of Grid Size
5.2. Geodiversity Patterns and Relationships between Geodiversity Classes of the Chinchiná River Basin
5.2.1. Lithological Sub-Index Patterns
5.2.2. Geomorphological Sub-Index Patterns
5.2.3. Pedological Sub-Index Patterns
5.2.4. Climatological Sub-Index Patterns
5.2.5. Hydrological Sub-Index Patterns
5.2.6. Volcanological Sub-Index Patterns
5.2.7. Geothermal Sub-Index Patterns
5.2.8. Structural Geology Sub-Index Patterns
5.3. Final Remarks
5.4. Geodiversity as a Foundation for Sustainability
6. Conclusions
Author Contributions
Funding
Data Availability Statement
Acknowledgments
Conflicts of Interest
References
- Kozłowski, S. Geodiversity. The concept and scope of geodiversity. Przegląd Geol. 2004, 52, 833–837. [Google Scholar]
- Carcavilla Urquí, L.; Lopez-Martínez, J.; Durán-Valsero, J.J. Patrimonio Geológico y Geodiversidad: Investigación, Conservación, Gestión y Relación con los Espacios Naturales Protegidos (No. 7); IgmE: Madrid, Spain, 2007. [Google Scholar]
- Serrano, E.; Ruiz-Flaño, P. Geodiversity: A theoretical and applied concept. Geogr. Helv. 2007, 62, 140–147. [Google Scholar] [CrossRef]
- Gray, M. The confused position of the geosciences within the “natural capital” and “ecosystem services” approaches. Ecosyst. Serv. 2018, 34, 106–112. [Google Scholar] [CrossRef]
- Brilha, J.; Gray, M.; Pereira, D.; Pereira, P. Geodiversity: An integrative review as a contribution to the sustainable management of the whole of nature. Environ. Sci. Policy 2018, 86, 19–28. [Google Scholar] [CrossRef]
- Hjort, J.; Gordon, J.E.; Gray, M.; Hunter, M.L., Jr. Why geodiversity matters in valuing nature’s stage. Conserv. Biol. 2015, 29, 630–639. [Google Scholar] [CrossRef] [PubMed]
- Van Ree, C.C.; van Beukering, P.J. Geosystem services: A concept in support of sustainable development of the subsurface. Ecosyst. Serv. 2016, 20, 30–36. [Google Scholar] [CrossRef]
- Gray, M. Geodiversity: Valuing and Conserving Abiotic Nature; John Wiley & Sons: Hoboken, NJ, USA, 2004. [Google Scholar]
- Gray, M. Geodiversity: Developing the paradigm. Proc. Geol. Assoc. 2008, 119, 287–298. [Google Scholar] [CrossRef]
- Gordon, J.E.; Barron, H.F. The role of geodiversity in delivering ecosystem services and benefits in Scotland. Scott. J. Geol. 2013, 49, 41–58. [Google Scholar] [CrossRef]
- Gordon, J.E.; Barron, H.F.; Hanson, J.D.; Thomas, M.F. Engaging with geodiversity—Why it matters. Proc. Geol. Assoc. 2012, 123, 1–6. [Google Scholar] [CrossRef]
- Yu, Y.; Yang, J. The Role and Practice of Geodiversity in Serving Ecosystems in China. Sustainability 2022, 14, 4547. [Google Scholar] [CrossRef]
- Van Ree, C.C.D.F.; Van Beukering, P.J.H.; Boekestijn, J. Geosystem services: A hidden link in ecosystem management. Ecosyst. Serv. 2017, 26, 58–69. [Google Scholar] [CrossRef]
- Zwoliński, Z.; Najwer, A.; Giardino, M. Methods for assessing geodiversity. In Geoheritage; Elsevier: Amsterdam, The Netherlands, 2018; pp. 27–52. [Google Scholar]
- Benito-Calvo, A.; Pérez-González, A.; Magri, O.; Meza, P. Assessing regional geodiversity: The Iberian Peninsula. Earth Surf. Process. Landf. 2009, 34, 1433–1445. [Google Scholar] [CrossRef]
- Zwoliński, Z. The routine of landform geodiversity map design for the Polish Carpathian Mts. Landf. Anal. 2009, 11, 77–85. [Google Scholar]
- Hjort, J.; Luoto, M. Geodiversity of high-latitude landscapes in northern Finland. Geomorphology 2010, 115, 109–116. [Google Scholar] [CrossRef]
- Ruban, D.A. Quantification of geodiversity and its loss. Proc. Geol. Assoc. 2010, 121, 326–333. [Google Scholar] [CrossRef]
- Pellitero, R.; González-Amuchastegui, M.J.; Ruiz-Flaño, P.; Serrano, E. Geodiversity and geomorphosite assessment applied to a natural protected area: The Ebro and Rudron Gorges Natural Park (Spain). Geoheritage 2011, 3, 163–174. [Google Scholar] [CrossRef]
- Silva, J.P.; Pereira, D.I.; Aguiar, A.M.; Rodrigues, C. Geodiversity assessment of the Xingu drainage basin. J. Maps 2013, 9, 254–262. [Google Scholar] [CrossRef]
- Pereira, D.I.; Pereira, P.; Brilha, J.; Santos, L. Geodiversity assessment of Paraná State (Brazil): An innovative approach. Environ. Manag. 2013, 52, 541–552. [Google Scholar] [CrossRef]
- Argyriou, A.V.; Sarris, A.; Teeuw, R.M. Using geoinformatics and geomorphometrics to quantify the geodiversity of Crete, Greece. Int. J. Appl. Earth Obs. Geoinf. 2016, 51, 47–59. [Google Scholar] [CrossRef]
- Forte, J.P.; Brilha, J.; Pereira, D.I.; Nolasco, M. Kernel density applied to the quantitative assessment of geodiversity. Geoheritage 2018, 10, 205–217. [Google Scholar] [CrossRef]
- Vörös, F.; Pál, M.; van Wyk de Vries, B.; Székely, B. Development of a New Type of Geodiversity System for the Scoria Cones of the Chaîne des Puys Based on Geomorphometric Studies. Geosciences 2021, 11, 58. [Google Scholar] [CrossRef]
- Zakharovskyi, V.; Németh, K. Scale influence on qualitative–quantitative geodiversity assessments for the geosite recognition of Western Samoa. Geographies 2022, 2, 476–490. [Google Scholar] [CrossRef]
- Scammacca, O.; Bétard, F.; Aertgeerts, G.; Heuret, A.; Fermet-Quinet, N.; Montagne, D. Geodiversity assessment of French Guiana: Challenges and implications for sustainable land planning. Geoheritage 2022, 14, 83. [Google Scholar] [CrossRef]
- Pérez-Escobar, O.A.; Zizka, A.; Bermúdez, M.A.; Meseguer, A.S.; Condamine, F.L.; Hoorn, C.; Hooghiemstra, H.; Pu, Y.; Bogarín, D.; Boschman, L.M.; et al. The Andes through time: Evolution and distribution of Andean floras. Trends Plant Sci. 2022, 27, 364–378. [Google Scholar] [CrossRef] [PubMed]
- Carrascal, D.R.; Maya, M.D.P.A.; Elena, M.; Lagoueyte, G.; Jaramillo, P.A.Z. Increased climatic stress on high-Andean ecosystems in the Cordillera Central of Colombia. About SCOPE 2011, 182. [Google Scholar]
- IDEAM. Zonificación y Codificación de Unidades Hidrográficas e Hidrogeológicas de Colombia; Publicación aprobada por el Comité de Comunicaciones y Publicaciones de IDEAM: Bogotá, Colombia, 2013. [Google Scholar]
- Perez-Valvuena, G.J.; Arrieta-Arrieta, A.M.; Contreras-Anaya, J.G. Río Cauca: La Geografía Económica de su Área de Influencia. In Documentos de Trabajo Sobre Economía Regional; Banco de la Republica de Colombia, Centro de estudios regionales (CEER): Bogotá, Colombia, 2015. [Google Scholar]
- Etayo–Serna, F.; Barrero, D.; Lozano, H.; Espinosa, A.; González, H.; Orrego, A.; Ballesteros, I.; Forero, H.; Ramírez, C.; Zambrano–Ortiz, F.; et al. Mapa de Terrenos Geológicos de Colombia; Publicaciones Geológicas Especiales del Ingeominas: Bogotá, Colombia, 1983; Volume 14, pp. 1–135. [Google Scholar]
- Restrepo, J.J.; Toussaint, J.F. Terranes and continental accretion in the Colombian Andes. Episodes 1988, 11, 189–193. [Google Scholar] [CrossRef]
- Toussaint, J.F.; Restrepo, J.J. Acreciones sucesivas en Colombia: Un nuevo modelo de evolución geológica. In V Congreso Colombiano de Geología. Memoirs, I.; Cartec Ltd.a: Bucaramanga, Colombia, 1989; pp. 127–146. [Google Scholar]
- Restrepo, J.J.; Toussaint, J.F. Tectonostratigraphic Terranes in Colombia: An Update First Part: Continental Terranes. In He Geology of Colombia, Volume 1. Proterozoic—Paleozoic; Gómez, J., Mateus–Zabala, D., Eds.; Servicio Geológico Colombiano, Publicaciones Geológicas Especiales: Bogotá, Colombia, 2020. [Google Scholar]
- Trenkamp, R.; Kellogg, J.N.; Freymueller, J.T.; Mora, H.P. Wide plate margin deformation, southern Central America and northwestern South America, CASA GPS observations. J. South Am. Earth Sci. 2002, 15, 157–171. [Google Scholar] [CrossRef]
- Kobayashi, D.; LaFemina, P.; Geirsson, H.; Chichaco, E.; Abrego, A.A.; Mora, H.; Camacho, E. Kinematics of the western Caribbean: Collision of the Cocos Ridge and upper plate deformation. Geochem. Geophys. Geosystems 2014, 15, 1671–1683. [Google Scholar] [CrossRef]
- Mora-Páez, H.; Kellogg, J.N.; Freymueller, J.T.; Mencin, D.; Fernandes, R.M.; Diederix, H.; LaFemina, P.; Cardona-Piedrahita, L.; Lizarazo, S.; Peláez-Gaviria, J.-R.; et al. Crustal deformation in the northern Andes–A new GPS velocity field. J. South Am. Earth Sci. 2019, 89, 76–91. [Google Scholar] [CrossRef]
- Kellogg, J.N.; Camelio, G.B.F.; Mora-Páez, H. Cenozoic tectonic evolution of the North Andes with constraints from volcanic ages, seismic reflection, and satellite geodesy. In Andean Tectonics; Elsevier: Amsterdam, The Netherlands, 2019; pp. 69–102. [Google Scholar]
- Gómez-Tapias, J.; Núñez-Tello, A.; Mateus-Zabala, D.; Alcárcel-Gutiérrez, F.A.; Lasso-Muñoz, R.M.; Marín-Rincón, E.; Marroquín-Gómez, M.P. Physiographic and geological setting of the Colombian territory. Geol. Colomb. 2020, 1, 1–6. [Google Scholar]
- Monsalve–Bustamante, M.L.; Gómez, J.; Pinilla-Pachon, A.O. The volcanic front in Colombia: Segmentation and recent and historical activity. Geol. Colomb. 2020, 4, 97–159. [Google Scholar]
- Gómez, J.; Montes, N.E.; Nivia, A.; Diederix, H.; Compiladores. Mapa Geológico de Colombia 2015. Escala 1:1,000,000. Servicio Geológico Colombiano, 2 hojas. Bogotá. 2015. [Google Scholar] [CrossRef]
- Stern, C.R. Active Andean volcanism: Its geologic and tectonic setting. Rev. Geológica Chile 2004, 31, 161–206. [Google Scholar] [CrossRef]
- Martínez, L.; Valencia, L.; Ceballos, J.; Narváez, B.; Pulgarín, B.; Correa, A.; Navarro, S.; Murcia, H.; Zuluaga, I.; Rueda, J.; et al. Geología y estratigrafía del Complejo Volcánico Nevado del Ruiz. In Informe Final, Bogotá—Manizales—Popayán; Servicio Geológico Colombiano: Bogotá, Colombia, 2014; 853p. [Google Scholar]
- Murcia, H.; Borrero, C.; Németh, K. Overview and plumbing system implications of monogenetic volcanism in the northernmost Andes’ volcanic province. J. Volcanol. Geotherm. Res. 2019, 383, 77–87. [Google Scholar] [CrossRef]
- International Commission on Geoheritage of the International Union of Geological Sciences (IGC-IUGS), Designations. 2023. Available online: https://iugs-geoheritage.org/geoheritage_sites/nevado-del-ruiz-quaternary-volcanic-complex (accessed on 7 September 2023).
- Botero-Gómez, L.A.; Osorio, P.; Murcia, H.; Borrero, C.; Grajales, J.A. Campo Volcánico Monogenético Villamaría-Termales, Cordillera Central, Andes colombianos (Parte I): Características morfológicas y relaciones temporales. Boletín Geol. 2018, 40, 85–102. [Google Scholar] [CrossRef]
- Osorio, P.; Botero-Gómez, L.A.; Murcia, H.; Borrero, C.; Grajales, J.A. Campo Volcánico Monogenético Villamaría-Termales, Cordillera Central, Andes colombianos (Parte II): Características composicionales. Boletín Geol. 2018, 40, 103–123. [Google Scholar] [CrossRef]
- Marín-Cerón, M.I.; Leal-Mejia, H.; Mesa-García, J. Late Cenozoic to modern-day volcanism in the northern Andes: A geochronological, petrographical, and geochemical review. In Geology and Tectonics of Northwestern South America: The Pacific-Caribbean-Andean Junction; Cediel, F., Shaw, R.P., Eds.; Springer International Publishing: Berlin/Heidelberg, Germany, 2019; pp. 3–95. [Google Scholar]
- Ceballos-Hernández, J.A.; Martínez-Tabares, L.M.; Valencia-Ramírez, L.G.; Pulgarín-Alzate, B.A.; Correa–Tamayo, A.M.; Narváez-Marulanda, B.L.; Gómez, J.; Pinilla-Pachon, A.O. Geological evolution of the Nevado del Ruiz Volcanic Complex. Geol. Colomb. 2020, 4, 267–296. [Google Scholar]
- Salazar-Muñoz, N.; de la Ossa, C.A.R.; Murcia, H.; Schonwalder-Ángel, D.; Botero-Gómez, L.A.; Hincapié, G.; da Silva, J.C.; Sánchez-Torres, L. Andesitic (SiO2: ~60 wt%) monogenetic volcanism in the northern Colombian Andes: Crystallisation history of three Quaternary volcanoes. J. Volcanol. Geotherm. Res. 2021, 412, 107194. [Google Scholar] [CrossRef]
- Vargas-Arcila, L.; Murcia, H.; Osorio-Ocampo, S.; Sánchez-Torres, L.; Botero-Gómez, L.A.; Bolaños, G. Effusive and evolved monogenetic volcanoes: Two newly identified (~800 ka) cases near Manizales City, Colombia. Bull. Volcanol. 2023, 85, 42. [Google Scholar] [CrossRef]
- Vargas-Arcila, L. Caracterización de Los Volcanes Las Margaritas 1 y 2, Campo Volcánico Monogenético Tapias-Guacaica, Colombia. Bachelor’s Thesis, Universidad de Caldas, Caldas, Colombia, 2020. [Google Scholar]
- Raigosa-Riobó, S. Aporte a Los Estudios Cartográficos, Composicionales y Geocronológicos del Campo Volcánico Monogéntico Tapias-Guacaica Municipio de Neira, Caldas, Colombia. Bachelor’s Thesis, Universidad de Caldas, Caldas, Colombia, 2021. [Google Scholar]
- Florez, A. Geomorphology of the Manizales—Chinchiná Area Cordillera Central, Colombia. Ph.D. Thesis, University of Amsterdam, Amsterdam, The Netherlands, 1986. [Google Scholar]
- Botero-Gómez, L.A. Control Estructural y Relación Temporal de los Volcanes Pertenecientes al Campo Volcánico Monogenético Villamaría-Termales, Caldas, Colombia. Master’s Thesis, Universidad de Caldas, Caldas, Colombia, 2022. [Google Scholar]
- Ortiz, I.; Alfaro, C. Inventario Nacional de Manantiales Termales. Fase 2011; Informe Técnico: Bogotá, Colombia, 2011; 131p. [Google Scholar]
- Taborda, A.; Portela, J.P.; Lopez-Sanchez, J.; Daniele, L.; Moreno, D.; Blessent, D. Temperature estimation of the Nevado del Ruiz Volcano geothermal reservoir: Insight from western hot springs hydrogeochemistry. J. Geochem. Explor. 2022, 240, 107049. [Google Scholar] [CrossRef]
- Inguaggiato, C.; Censi, P.; Zuddas, P.; Londoño, J.; Chacón, Z.; Alzate, D.; Brusca, L.; D’alessandro, W. Geochemistry of REE, Zr and Hf in a wide range of pH and water composition: The Nevado del Ruiz volcano-hydrothermal system (Colombia). Chem. Geol. 2015, 417, 125–133. [Google Scholar] [CrossRef]
- Jaramillo-Robledo, A. Clima Andino y Café en Colombia; Chinchiná: Cenicafé, Colombia, 2005; 196p. [Google Scholar]
- Ocampo-López, O.L. Análisis de Vulnerabilidad de la Cuenca del Río Chinchiná para Condiciones Estacionarias y de Cambio Climático. Master’s Thesis, Universidad Nacional de Colombia, Caldas, Colombia, 2012. [Google Scholar]
- CORPOCALDAS; ASOCARS; Universidad Nacional de Colombia. Plan de Ordenación y Manejo Ambiental de la Cuenca Hidrográfica del Río Chinchiná en el Departamento de Caldas—Colombia; Colombian Government: Caldas, Colombia, 2013. [Google Scholar]
- Ceballos, J.L. Manifestación de Cambio Climático—Los Glaciares de Colombia. Revista La Tadeo (Cesada a Partir De 2012), (74). Recuperado a Partir de. 2009. Available online: https://revistas.utadeo.edu.co/index.php/RLT/article/view/516 (accessed on 25 June 2022).
- Valentin, C.D. Desarrollo de una Herramienta de ArcGis Para el Cálculo de la Geodiversidad en Latinoamérica, y su Análisis Estadístico y de Correlación con las Amenazas en un Caso de Estudio. Master’s Thesis, Universidad Autónoma de Mexico, Mexico City, Mexico, 2021. [Google Scholar]
- Caballero, H.; Zapata, G. Geología y Geoquimica de la Plancha 224 Pereira; Informe 1931; INGEOMINAS: Medellín, Colombia, 1984. [Google Scholar]
- Gonzalez, H. Geologia de las Planchas 206 Manizales y 225 Nevado del Ruiz; Memoria explicative; Instituto de Investigación e Información Geocientifica, Minero-Ambiental y Nuclear, INGEOMINAS: Medellín, Colombia, 2001; 89p.
- Estrada, J.J.; Viana, R.; Gonzalez, H. Geologia de la Plancha 205 Chinchiná; Memoria explicative; Instituto de Investigación e Información Geocientifica, Minero-Ambiental y Nuclear, INGEOMINAS: Medellín, Colombia, 2001; 93p.
- IGAC; CORPOCALDAS. Estudio Semidetallado de Suelos de los Municipios de Manizales, Chinchiná, Palestina, Neira y Villamaría; Escala 1:25.000. Republica de Colombia; Colombian Government: Caldas, Colombia, 2013.
- Aguirre-Sánchez, R.; López-Isaza, J.A. Cartografía Geológica y Petrografía del Stock de Manizales y su Relación con sus Rocas Encajantes. Bachelor’s Thesis, Universidad de Caldas, Caldas, Colombia, 2003. [Google Scholar]
- Montenegro-Rippe, C.A. Caracterización Petrológica del Stock de Manizales. Master’s Thesis, Universidad Nacional de Colombia, Bogotá, Colombia, 2017. [Google Scholar]
- Álvarez, J.A. Geología del Complejo Ofiliolítico de Pácora y secuencias relacionadas de Arco de Islas (Complejo quebrada Grande), Colombia. Boletín Geológico 1995, 35, 5–49. [Google Scholar] [CrossRef]
- Rodríguez, G.; Arango, M.I. Reinterpretación geoquímica y radiométrica de las metabasitas del Complejo Arquía. Boletín Geol. 2013, 35, 65–81. [Google Scholar]
- Leal-Mejía, H.; Shaw, R.P.; Melgarejo i Draper, J.C. Spatial-temporal migration of granitoid magmatism and the Phanerozoic tectono-magmatic evolution of the Colombian Andes. In Geology and Tectonics of Northwestern South America: The Pacific-Caribbean-Andean Junction; Springer: Berlin/Heidelberg, Germany, 2019; pp. 253–410. [Google Scholar]
- Maya, M.; González, H. Unidades litodémicas en Cordillera Central de Colombia. Bol. Geol. Boletín Geológico 1995, 35, 44–57. [Google Scholar] [CrossRef]
- Moreno-Sanchez, M.; Pardo-Trujillo, A. Stratigraphical and sedimentological constraints on western Colombia: Implications on the evolution of the Caribbean plate. In The Circum-Gulf of Mexico and the Caribbean: Hydrocarbon Habitats, Basin Formation and Plate Tectonics; American Association of Petroleum Geologists: Tulsa, OK, USA, 2003. [Google Scholar]
- Villagómez, D.; Spikings, R. Thermochronology and tectonics of the Central and Western Cordilleras of Colombia: Early Cretaceous–Tertiary evolution of the northern Andes. Lithos 2013, 160, 228–249. [Google Scholar] [CrossRef]
- Moreno Sánchez, M.; Gómez Cruz, A.D.J.; Castillo González, H. Ocurrencias de fosiles Paleozoicos al este de la parte norte de la Cordillera Central y discusion sobre su significado geologico. Boletín Cienc. Tierra 2008, 22, 39–47. [Google Scholar]
- Pardo-Trujillo, A.; Moreno, M.; Gómez, A.D.J. The Nogales Formation in the edge of the central mountain chain (cauca valley departament): A key piece to understand the Cretaceous evolution of west colombian. Boletín Cienc. Tierra 2008, 22, 133. [Google Scholar]
- Ossa, J.A. Cartografía Detallada de un Área del Proyecto Geotérmico. Bachelor’s Thesis, Facultad de Ciencias Exactas y Naturales, Programa de Geología, Universidad de Caldas, Manizales, Colombia, 2018; 91p. [Google Scholar]
- Acuña, B.; Guerrero, C. Cartografía y Análisis Cinemático de la Falla Cauca—Almaguer al Occidente de la Ciudad de Manizales. Bachelor’s Thesis, Facultad de Ciencias Exactas y Naturales, Programa de Geología, Universidad de Caldas, Manizales, Colombia, 2017; 76p. [Google Scholar]
- Mejía Toro, E.L. Caracteristicas Cinemáticas y Condiciones de Deformación de un Segmento de la Falla Palestina al NE del Volcán Nevado del Ruiz. Master’s Thesis, Universidad Nacional de Colombia, Departamento de Geociencias, Medellín, Colombia, 2012. [Google Scholar]
- Arango, M. Análisis Deformativo y Cinemático de la Falla Santa Rosa. Sector Cerro Gualí—Mariquita. Bachelor’s Thesis, Facultad de Ciencias Exactas y Naturales, Programa de Geología, Universidad de Caldas, Manizales, Colombia, 2016; 64p. [Google Scholar]
- Pareja, E.; García, R. Análisis Estructural de la Falla NEREIDAS, en el sector de Nereidas, Villamaría—Caldas. Bachelor’s Thesis, Facultad de Ciencias Exactas y Naturales, Programa de Geología, Universidad de Caldas, Manizales, Colombia, 2013. [Google Scholar]
- Gómez, E.; Marín, J.S. Análisis de Paleoesfuerzos Mediante Datos de Fallas Estriadas en el “Stock” Chinchiná—Santa Rosa, Alrededores de Manizales. Bachelor’s Thesis, Facultad de Ciencias Exactas y Naturales, Programa de Geología, Universidad de Caldas, Manizales, Colombia, 2014; 62p. [Google Scholar]
- Vega, E.J. Aporte al Modelo Geológico del Valle de las Nereidas, Villamaría. Bachelor’s Thesis, Universidad de Caldas, Facultad de Ciencias Exactas y Naturales, Programa de geología, Manizales, Colombia, 2014. [Google Scholar]
- USDA Taxonomy. A Basic System of Soil Classification for Making and Interpreting Soil Surveys. In Handbook No. 436; US Department of Agriculture: Washington, WA, USA, 1999. [Google Scholar]
- Zapata, O.E.C.; Serna, R.J. Contribución al Modelo Hidrogeológico del Sistema Acuífero de Santágueda, Departamento de Caldas. Bachelor’s Thesis, Facultad de Ciencias Exactas y Naturales, Programa de Geología, Universidad de Caldas, Manizales, Colombia, 2012. [Google Scholar]
- Bartuś, T. Basic unit size in the analysis of the distribution of spatial landscape elements on the basis of the lithostratigraphic geodiversity of the Ojców National Park (Poland). Geol. Geophys. Environ. 2017, 43, 95. [Google Scholar] [CrossRef]
- Lopes, C.; Teixeira, Z.; Pereira, D.I.; Pereira, P. Identifying Optimal Cell Size for Geodiversity Quantitative Assessment with Richness, Diversity and Evenness Indices. Resources 2023, 12, 65. [Google Scholar] [CrossRef]
- Blanco-Quintero, I.F.; García-Casco, A.; Toro, L.M.; Moreno, M.; Ruiz, E.C.; Vinasco, C.J.; Morata, D. Late Jurassic terrane collision in the northwestern margin of Gondwana (Cajamarca Complex, eastern flank of the Central Cordillera, Colombia). Int. Geol. Rev. 2014, 56, 1852–1872. [Google Scholar] [CrossRef]
- Villagómez, D.; Spikings, R.; Magna, T.; Kammer, A.; Winkler, W.; Beltrán, A. Geochronology, geochemistry and tectonic evolution of the Western and Central cordilleras of Colombia. Lithos 2011, 125, 875–896. [Google Scholar] [CrossRef]
- Hoyos, I.; Dominguez, F.; Cañón-Barriga, J.; Martínez, J.A.; Nieto, R.; Gimeno, L.; Dirmeyer, P.A. Moisture origin and transport processes in Colombia, northern South America. Clim. Dyn. 2018, 50, 971–990. [Google Scholar] [CrossRef]
- Poveda, G.; Mesa, O.J. On the existence of Lloró (the rainiest locality on Earth): Enhanced ocean-land-atmosphere interaction by a low-level jet. Geophys. Res. Lett. 2000, 27, 1675–1678. [Google Scholar] [CrossRef]
- Urrea, V.; Ochoa, A.; Mesa, O. Seasonality of rainfall in Colombia. Water Resour. Res. 2019, 55, 4149–4162. [Google Scholar] [CrossRef]
- Fox, N.; Graham, L.J.; Eigenbrod, F.; Bullock, J.M.; Parks, K.E. Incorporating geodiversity in ecosystem service decisions. Ecosyst. People 2020, 16, 151–159. [Google Scholar] [CrossRef]
- Buytaert, W.; Vuille, M.; Dewulf, A.; Urrutia, R.; Karmalkar, A.; Célleri, R. Uncertainties in climate change projections and regional downscaling in the tropical Andes: Implications for water resources management. Hydrol. Earth Syst. Sci. 2010, 14, 1247–1258. [Google Scholar] [CrossRef]
- Sevink, J.; Hofstede, R. Los árboles como elemento importante del páramo. In Avances en Investigación para la Conservación de los Páramos Andinos; CONDESAN: Lima, Perú, 2014. [Google Scholar]


| Geodiversity Classes | Differentiation Criteria of Subclasses | Geodiversity Subclasses | Abiotic Elements | Sub-Index Parameters | Information Source |
|---|---|---|---|---|---|
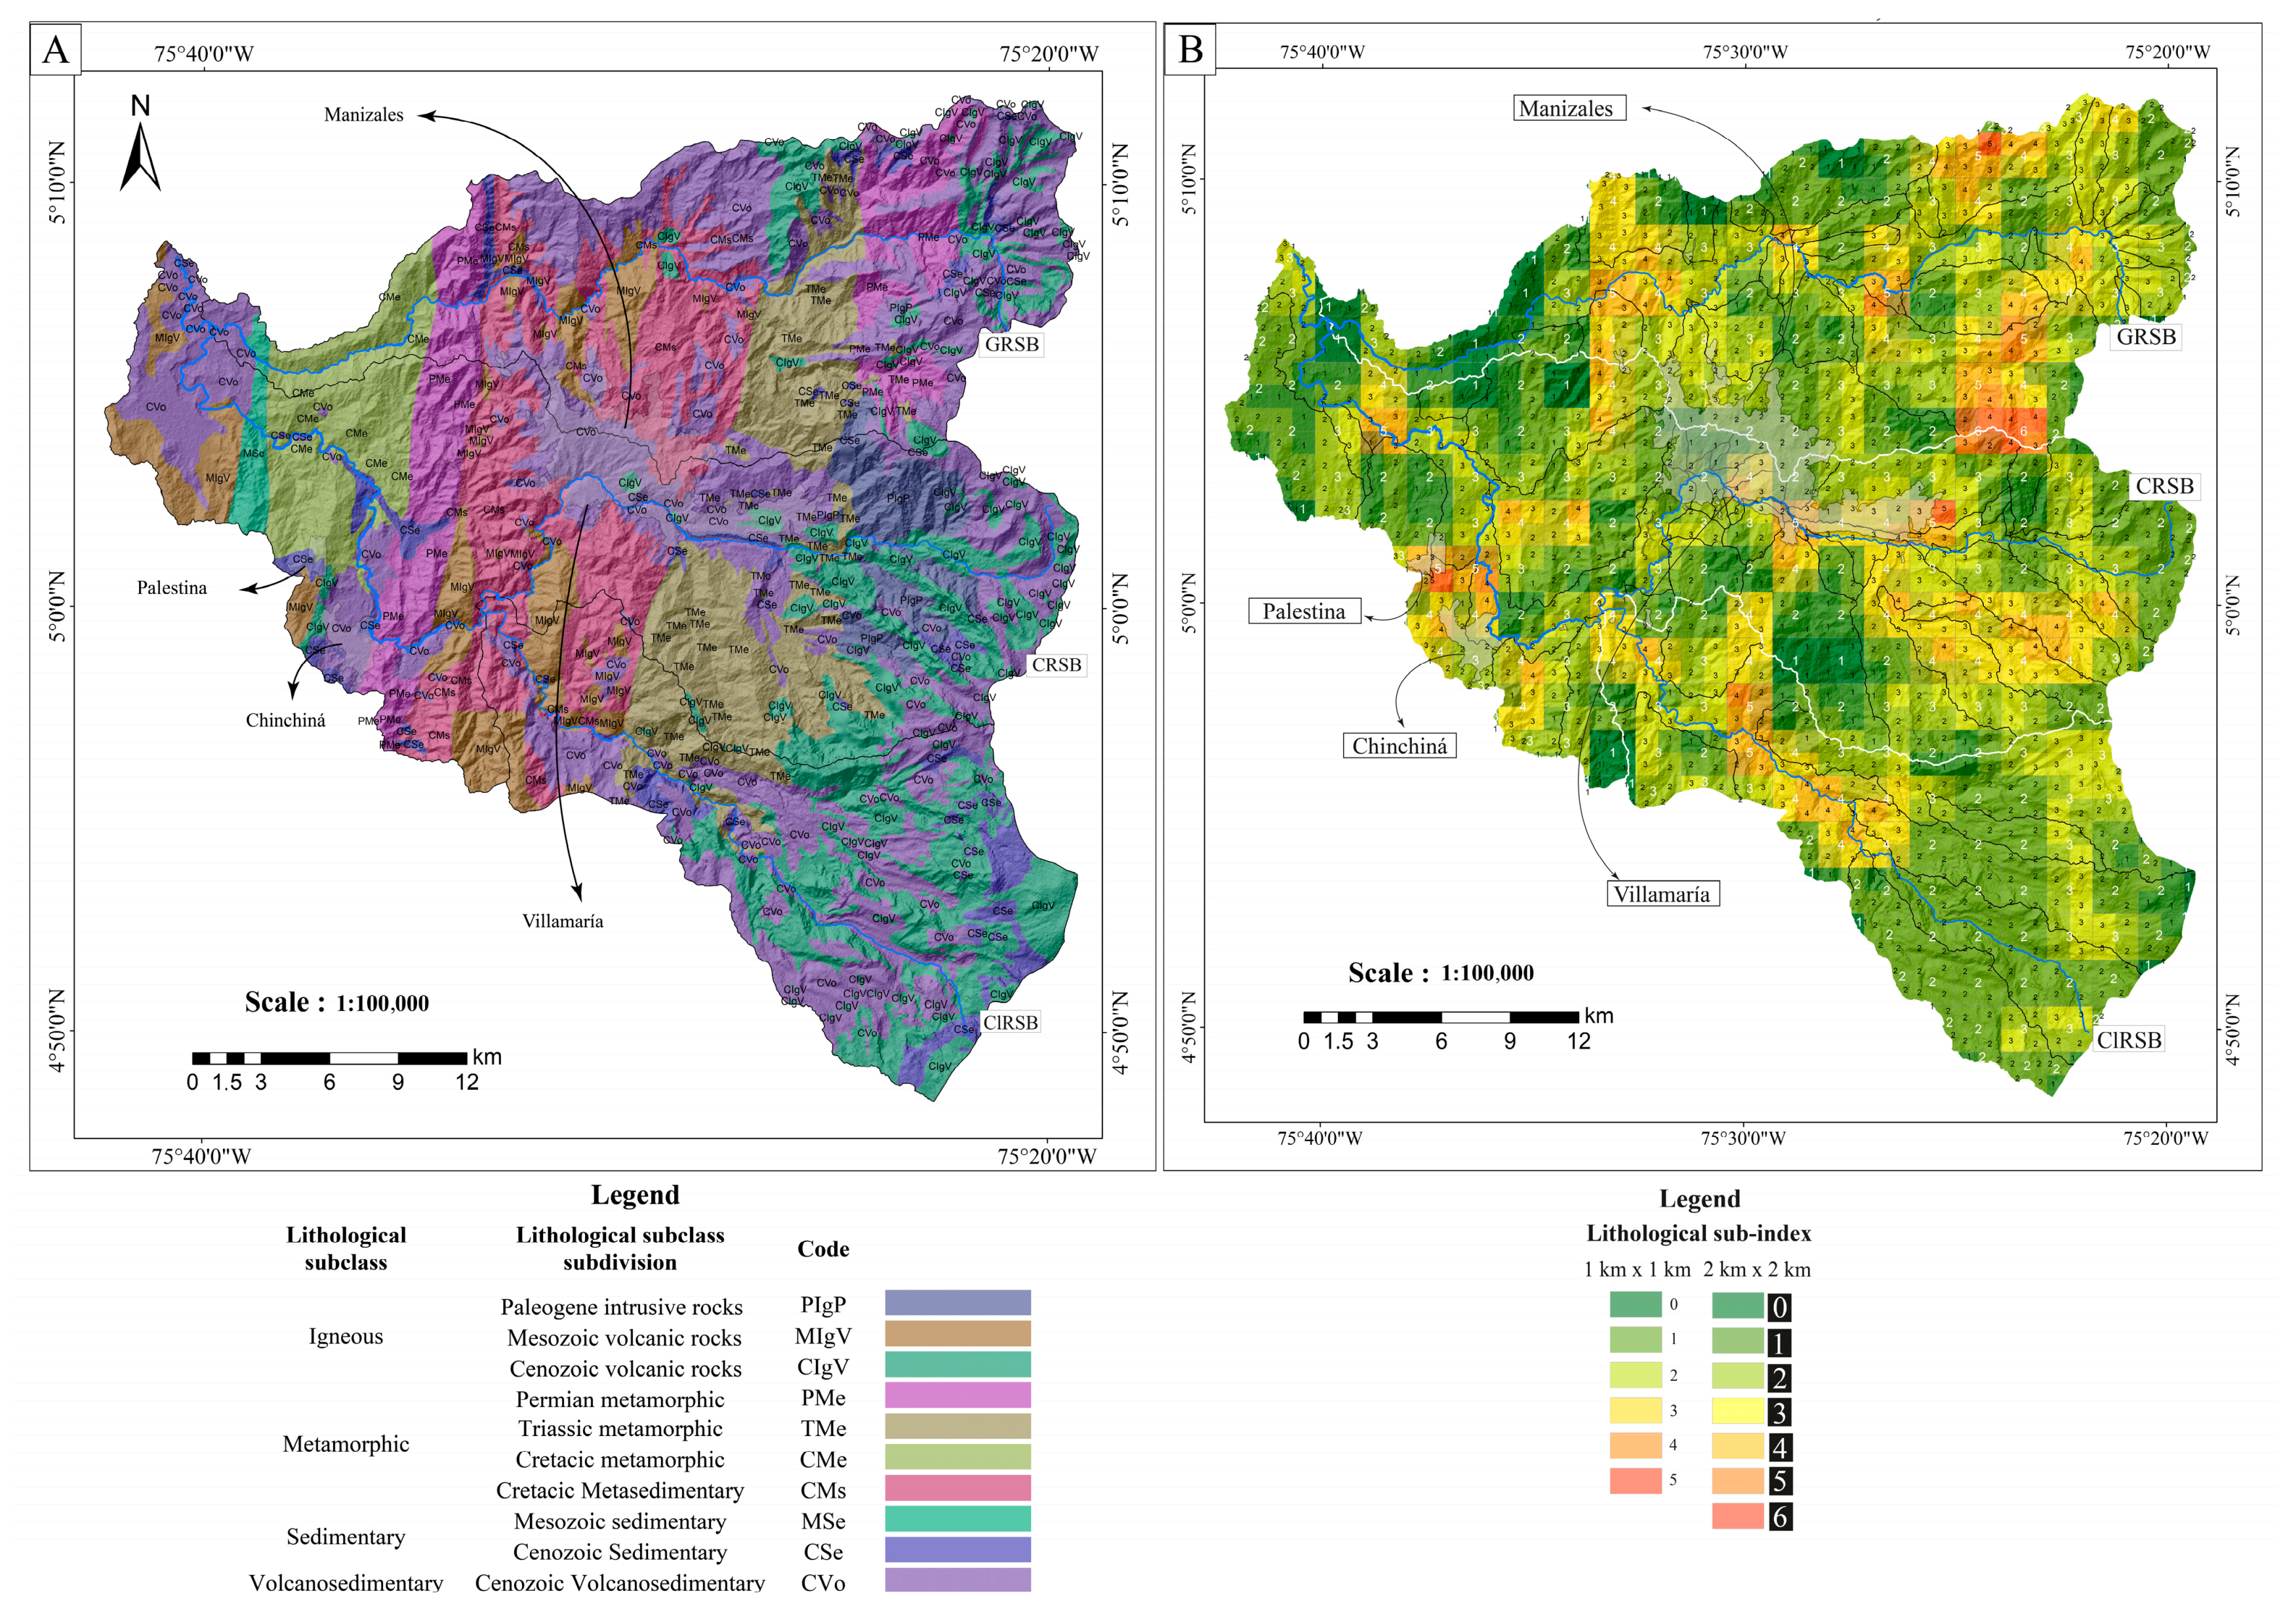
| Lithological | Age, composition, and/or genesis of the rocks and deposits | Igneous Metamorphic Sedimentary Volcanosedimentary | Paleogene intrusive rocks Mesozoic volcanic rocks Cenozoic volcanic rocks Permian metamorphic rocks Triassic metamorphic rocks Cretaceous metamorphic rocks Cretaceous metasedimentary rocks Mesozoic sedimentary rocks Cenozoic sedimentary deposits Cenozoic volcanosedimentary deposits | Defined as the number of abiotic lithological elements represented on the geological map per unit area | The lithological map was acquired from Colombian Geological Survey [64,65,66]; additionally, the andesitic bodies of the Villamaría Termales monogenetic volcanic field and the Tapias Guacaica monogenetic volcanic field were included [46,47,51], and the scale of this map is 1:100,000. |
| Geomorphological | Morphometric parameters | Slopes ranges Landforms Drainage density | Flat to slightly flat (0–1.7°) Slightly inclined (1.7–4°) Moderately inclined (4–7°) Strongly inclined (7–14°) Slightly steep (14–26°) Moderately steep (26–36°) Steep (>36°) Andean summits Dome Flood Plain Hills Hilly Terrain Lava Flow Mudflow and lahar Narrow Valley Narrow mountain range Sloping terrain Terrace Volcanic cone Anthropogenic geomorphology Very low Low Medium High Very High | Corresponds to the number of different abiotic geomorphological elements per unit area | The slopes’ ranges and drainage densities were developed utilizing ArcGIS software 10.8 using the 12.5 m DEM; the landforms were adapted from [67], and the scale of this map is 1:25,000. |
| Structural | Fault kinematics and the strike and/or dip movement component | Dextral Sinestral Reverse Normal | Dextral Dextral normal Sinestral Sinestral inverse Reverse Reverse dextral Reverse sinestral Normal Normal sinestral | It was defined as the number of faults per unit area | The structural map was adapted from [55], and the scale of the map is 1:100,000 |
| Pedological | Chemical, physical, and mineralogical composition | Soil order No soil formation Urban soil | Andisols Inceptisols Mollisols Histosols Entisols No soil formation Urban soil | The calculation of this index was made by counting the pedological order in the soil map per unit area | The pedological map was adapted and modified from [67], and the scale of this map is 1:25,000 |
| Climatological | Elevation, mean annual temperature, and mean annual total precipitation | Snow Paramo Cold Temperate Warm | Permanent snow cover Superhumid high paramo Superhumid low paramo Low humid paramo Cold Superhumid Cold wet Temperate moist Temperate semihumid Warm humid Warm semihumid | Corresponds to the number of abiotic climatical elements per unit area | The climatic zones were taken from [61] |
| Hydrographical | Surface and groundwater conditions | Stream order Aquifers Lakes Glaciers | Seven stream orders One aquifer Four lake areas Two glaciers | The highest order of hierarchy present in each unit area was divided by two (approximating it to the nearest whole number if it is a decimal), and we added the presence of aquifers, glaciers, and lakes | The stream orders were developed via ArcGIS software 10.8 using the 12.5 m DEM, and applying the Strahler method, while the aquifer information was taken from www.corpocaldas.gov.co (accesed on 16 february 2023), and the lakes and glaciers were identified during field work; the scale of this map is 1:100,000. |
| Volcanological | Type of volcano | Polygenetic Monogenetic | Five polygenetic Twenty two monogenetic | This class works as the counting of volcanoes per unit area | The volcanological map was developed from information collected in several studies [46,47,50,51,52,53], and the scale of this map is 1:100,000 |
| Geothermal | Temperature ranges | <35 °C 35–70 °C >70 °C | Three hot springs below 35 °C Eleven hot springs between 35 °C and 70 °C Two hot springs upward from 70 °C | It is defined as the counting of hot springs’ temperature ranges per unit area | The geothermal diversity map was derived from [56] |
| Geodiversity Class | Total Abiotic Elements | Class Sub-Index | Sub-Index Equivalence per Total Abiotic Elements per Class | Sub-Index Equivalence in Total Geodiversity |
|---|---|---|---|---|
| Lithological | 1 | 10% | 1.25% | |
| 2 | 20% | 2.5% | ||
| 10 | 3 | 30% | 3.75% | |
| 4 | 40% | 5% | ||
| 5 | 50% | 6.25% | ||
| 6 | 60% | 7.5% | ||
| Geomorphological | 5 | 20% | 2.5% | |
| 6 | 24% | 3% | ||
| 7 | 28% | 3.5% | ||
| 8 | 32% | 4% | ||
| 9 | 36% | 4.5% | ||
| 25 | 10 | 40% | 5% | |
| 11 | 44% | 5.5% | ||
| 12 | 48% | 6% | ||
| 13 | 52% | 6.5% | ||
| 14 | 56% | 7% | ||
| 15 | 60% | 7.5% | ||
| Structural | 9 | 1 | 11% | 1.4% |
| 2 | 22% | 2.8% | ||
| 3 | 33% | 4.2% | ||
| 4 | 44% | 5.6% | ||
| Pedological | 7 | 1 | 14.3% | 1.8% |
| 2 | 28.6% | 3.6% | ||
| 3 | 42.9% | 5.4% | ||
| 4 | 57.1% | 7.1% | ||
| 5 | 71.4% | 8.9% | ||
| Climatological | 11 | 1 | 9.09% | 1.13% |
| 2 | 18.18% | 2.72% | ||
| 3 | 27.27% | 3.40% | ||
| 4 | 36.36% | 4.54% | ||
| Hydrological | 1 | 14.3% | 1.7% | |
| 2 | 28.6% | 3.5% | ||
| 7 | 3 | 42.9% | 5.35% | |
| 4 | 57.1% | 7.14% | ||
| 5 | 71.4% | 8.9% | ||
| Volcanological | 1 | 50% | 6.2% | |
| 2 | 2 | 100% | 12.4% | |
| Geothermal | 1 | 33.33% | 4.16% | |
| 3 | 2 | 66.66% | 8.3% | |
| 3 | 100% | 12.5% |
| Lithological Elements | Area—% 1 km × 1 km Sub-Index | Area—% 2 km × 2 km Sub-Index |
|---|---|---|
| 1 | 195 km2—18.6% | 45 km2—4.3% |
| 2 | 538 km2—51.5% | 393 km2—37.4% |
| 3 | 265 km2—25.2% | 351 km2—33.4% |
| 4 | 50 km2—18.6% | 207 km2—19.7% |
| 5 | 3 km2—0.30% | 47 km2—4.5% |
| 6 | 0 km2—0% | 8 km2—0.8% |
| Total | 1051 km2—100% | 1051 km2—100% |
| Geomorphological Elements | Slope Ranges (%) | Slope Ranges (°) | Area—% |
|---|---|---|---|
| Flat-to-slightly flat slopes | 0–3% | 0°–1.7° | 2 km2—0.2% |
| Slightly inclined slopes | 3–7% | 1.7°–4° | 8 km2—0.8% |
| Moderately inclined slopes | 7–12% | 4°–7° | 25 km2—2.4% |
| Strongly inclined slopes | 12–25% | 7°–14° | 189 km2—18% |
| Slightly steep slopes | 25–50% | 14°–26° | 500 km2—47% |
| Moderately steep slopes | 50–75% | 26°–36° | 231 km2—22% |
| Steep slopes | >75% | >36° | 96 km2—9% |
| Total | 1051 km2—100% |
| Landform | Description | Area—% |
|---|---|---|
| Andean summits | High mountain relief, including the Central Cordillera tallest peaks, which are typically associated with volcanoes. These summits exhibit glacial features. | 105 km2—10% |
| Anthropogenic geomorphology | Corresponds to the cities and towns within the basin, where an urban landscape prevails. | 49 km2—4.7% |
| Dome | Relief of lava material, with an approximately cylindrical base and slopes that range from very steep to subvertical. | 1.5 km2—0.1% |
| Flood plain | Constitutes the valley’s lowest landform, aligning with the margins of the river’s course and constantly receiving and depositing alluvial sediment from the riverbed. | 2.3 km2—0.2% |
| Hills | Corresponds to ancient volcanic–detritic deposits, being highly altered and moderately dissected and forming undulating and elongated units. | 64 km2—6.1% |
| Hilly terrain | These features exhibit the distinctive longitudinal and transverse forms found in mountain landscapes. The slopes are extended and straight and possess moderate-to-steep gradients. | 478 km2—45.1% |
| Lava flow | This relief is shaped by the accumulation of lava that descended from an emission center along the slope and subsequently solidified as it cooled. | 166 km2—15.8% |
| Mudflow and lahar | Corresponds to deposits originating from the high Andean peaks, resulting from a combination of volcanic, glacial, fluvial, and landslide processes. They settle in the middle and lower regions of the basin, obstructing valleys and forming extended terraces with generally gently sloping, flat-to-undulating surfaces. | 70 km2—6.7% |
| Narrow montain range | It features a stepped pattern of triangular facets marked by uneven scarps, narrow sub-acute ridges, and straight slopes, with gradients ranging from steep to moderately steep, as well as exhibiting mild laminar erosion. | 3.6 km2—0.3% |
| Narrow valley | These are mountain tributaries that flow directly into the Cauca River. They primarily consist of alluvial formations, which are relatively small in size and typically exhibit elongated shapes with flat–concave topography. Their slopes are generally flat to gently inclined. | 33.5 km2—3.2% |
| Sloping terrain | These surfaces are linked to structural relief and defined by broad, smooth folds and gently tilted faulted layers. | 59 km2—5.6% |
| Terrace | This flat-to-slightly inclined relief is the outcome of two morphogenetic phases. Firstly, an accumulation phase, during which coarse and subsequently fine materials were deposited, occurred, followed by a phase of fluvial erosion, which shaped the slopes. | 1.7 km2—0.2% |
| Volcanic cone | This relief takes on a conical shape, featuring straight slopes with a concave appearance. The middle part of the slope is steep, though it gradually becomes gentler toward the base. | 14.5 km2—1.4% |
| Total | 1051 km2—100% |
| Drainage Density | Area—% |
|---|---|
| Very low | 5.6 km2—0.6% |
| Low | 120 km2—11.5% |
| Moderate | 328 km2—31.3% |
| High | 392 km2—37.4% |
| Very high | 202 km2—19.2% |
| Total | 1051 km2—100% |
| Geomorphological Elements | Area—% 1 km × 1 km Sub-Index | Area—% 2 km × 2 km Sub-Index |
|---|---|---|
| 5 | 5 km2—0.5% | - |
| 6 | 78 km2—7.4% | - |
| 7 | 167 km2—15.9% | 35 km2—3.3% |
| 8 | 255 km2—24.3% | 82 km2—7.8% |
| 9 | 260 km2—24.7% | 134 km2—12.7% |
| 10 | 168 km2—16% | 252 km2—24% |
| 11 | 80 km2—7.6% | 211 km2—20.1% |
| 12 | 31 km2—2.9% | 223 km2—21.2% |
| 13 | 7 km2—0.7% | 65 km2—6.2% |
| 14 | - | 36 km2—3.4% |
| 15 | - | 13 km2—1.2% |
| Total | 1051 km2—100% | 1051 km2—100% |
| Structural Geology Subclass | Abiotic Structural Elements | Fault Length—% |
|---|---|---|
| Dextral | Dextral faults | 42.6 km—7% |
| Dextral normal faults | 22.4 km—3.7% | |
| Sinistral | Sinistral faults | 104 km—17% |
| Sinistral reverse faults | 47 km—7.7% | |
| Reverse | Reverse faults | 171 km—28% |
| Reverse dextral faults | 40.4 km—6.6% | |
| Reverse sinestral fault | 50 km—8.2% | |
| Normal | Normal faults | 63 km—10.3% |
| Normal sinistral faults | 70 km—11.5% | |
| Total | 610.4 km—100% |
| Structural Geological Elements | Area—% 1 km × 1 km Sub-Index | Area—% 2 km × 2 km Sub-Index |
|---|---|---|
| 0 | 402 km2—38.2% | 158 km2—12% |
| 1 | 522 km2—49.7% | 462 km2—44% |
| 2 | 112 km2—10.7% | 343 km2—32.6% |
| 3 | 14 km2—1.3% | 76 km2—7.2% |
| 4 | 1 km2—0.1% | 12 km2—1.1% |
| Total | 1051 km2—100% | 1051 km2—100% |
| Pedological Elements | Area—% 1 km × 1 km Sub-Index | Area—% 2 km × 2 km Sub-Index |
|---|---|---|
| 1 | 394 km2—37% | 168 km2—16% |
| 2 | 417 km2—40% | 377 km2—36% |
| 3 | 172 km2—16% | 311 km2—30% |
| 4 | 59 km2—6% | 163 km2—16% |
| 5 | 9 km2—1% | 32 km2—3% |
| Total | 1051 km2—100% | 1051 km2—100% |
| Climatological Elements | Area—% 1 km × 1 km Sub-Index | Area—% 2 km × 2 km Sub-Index |
|---|---|---|
| 1 | 537 km2—51.1% | 275 km2—26.2% |
| 2 | 399 km2—38% | 495 km2—47.1% |
| 3 | 72 km2—6.9% | 157 km2—14.9% |
| 4 | 43 km2—4.1% | 124 km2—11.8% |
| Total | 1051 km2—100% | 1051 km2—100% |
| Hydrological Elements | Area—% 1 km × 1 km Sub-Index | Area—% 2 km × 2 km Sub-Index |
|---|---|---|
| 1 | 255 km2—24.3% | 63 km2—6% |
| 2 | 529 km2—50.4% | 516 km2—49.1% |
| 3 | 213 km2—20.3% | 371 km2—35.3% |
| 4 | 30 km2—2.9% | 64 km2—6.1% |
| 5 | 23 km2—2.2% | 37 km2—3.5% |
| Total | 1051 km2—100% | 1051 km2—100% |
| Volcanological Elements | Area—% 1 km × 1 km Sub-Index | Area—% 2 km × 2 km Sub-Index |
|---|---|---|
| 0 | 967 km2—91.1% | 917 km2—87.2% |
| 1 | 87 km2—8.3% | 105 km2—10% |
| 2 | 7 km2—0.7% | 21.7 km2—2.1% |
| 3 | - | 7.5 km2—0.7% |
| Total | 1051 km2—100% | 1051 km2—100% |
| Geothermal Elements | Area—% 1 km × 1 km Sub-Index | Area—% 2 km × 2 km Sub-Index |
|---|---|---|
| 0 | 1031 km2—98% | 983 km2—93.5% |
| 1 | 20 km2—2% | 60 km2—5.7% |
| 2 | - | 4 km2—0.4% |
| 3 | - | 4 km2—0.4% |
| Total | 1051 km2—100% | 1051 km2—100% |
| General Geodiversity Index | Area—% 1 km × 1 km Sub-Index | Area—% 2 km × 2 km Sub-Index |
|---|---|---|
| 10 | 4 km2—0.4% | - |
| 11 | 14 km2—1.3% | - |
| 12 | 28 km2—2.7% | - |
| 13 | 47 km2—4.5% | 2 km2—% |
| 14 | 94 km2—8.9% | 9 km2—% |
| 15 | 138 km2—13.1% | 22 km2—% |
| 16 | 127 km2—12.1% | 28 km2—% |
| 17 | 112 km2—10.7% | 42 km2—% |
| 18 | 134 km2—12.7% | 30 km2—% |
| 19 | 118 km2—11.2% | 36 km2—% |
| 20 | 70 km2—6.7% | 108 km2—% |
| 21 | 68 km2—6.5% | 136 km2—% |
| 22 | 50 km2—4.8% | 151 km2—% |
| 23 | 21 km2—2% | 114 km2—% |
| 24 | 16 km2—1.5% | 130 km2—% |
| 25 | 7 km2—0.7% | 66 km2—% |
| 26 | 2 km2—0.2% | 84 km2—% |
| 27 | 1 km2—0.1% | 28 km2—% |
| 28 | - | 32 km2—% |
| 29 | - | 19 km2—% |
| 30 | - | 12 km2—% |
| Total | 1051 km2—100% | 1051 km2—100% |
Disclaimer/Publisher’s Note: The statements, opinions and data contained in all publications are solely those of the individual author(s) and contributor(s) and not of MDPI and/or the editor(s). MDPI and/or the editor(s) disclaim responsibility for any injury to people or property resulting from any ideas, methods, instructions or products referred to in the content. |
© 2023 by the authors. Licensee MDPI, Basel, Switzerland. This article is an open access article distributed under the terms and conditions of the Creative Commons Attribution (CC BY) license (https://creativecommons.org/licenses/by/4.0/).
Share and Cite
Arias-Díaz, A.; Murcia, H.; Vallejo-Hincapié, F.; Németh, K. Understanding Geodiversity for Sustainable Development in the Chinchiná River Basin, Caldas, Colombia. Land 2023, 12, 2053. https://doi.org/10.3390/land12112053
Arias-Díaz A, Murcia H, Vallejo-Hincapié F, Németh K. Understanding Geodiversity for Sustainable Development in the Chinchiná River Basin, Caldas, Colombia. Land. 2023; 12(11):2053. https://doi.org/10.3390/land12112053
Chicago/Turabian StyleArias-Díaz, Alejandro, Hugo Murcia, Felipe Vallejo-Hincapié, and Károly Németh. 2023. "Understanding Geodiversity for Sustainable Development in the Chinchiná River Basin, Caldas, Colombia" Land 12, no. 11: 2053. https://doi.org/10.3390/land12112053
APA StyleArias-Díaz, A., Murcia, H., Vallejo-Hincapié, F., & Németh, K. (2023). Understanding Geodiversity for Sustainable Development in the Chinchiná River Basin, Caldas, Colombia. Land, 12(11), 2053. https://doi.org/10.3390/land12112053