Article

Assessment of Soil Fertility Status under Soil Degradation Rate Using Geomatics in West Nile Delta

by
Mohamed A. E. AbdelRahman
1,
Mohamed M. Metwaly
2,
Ahmed A. Afifi
3,
Paola D’Antonio
4 and
Antonio Scopa
4,*
1
Division of Environmental Studies and Land Use, National Authority for Remote Sensing and Space Sciences (NARSS), Cairo 11769, Egypt
2
Data Reception, Analysis and Receiving Station Affairs Division, National Authority for Remote Sensing and Space Sciences, Cairo 11769, Egypt
3
Soils and Water Use Department, National Research Centre, Giza 12622, Egypt
4
Scuola di Scienze Agrarie, Forestali, Alimentari ed Ambientali (SAFE), Università degli Studi della Basilicata, Viale dell’Ateneo Lucano, 10, 85100 Potenza, Italy
*
Author to whom correspondence should be addressed.
Land 2022, 11(8), 1256; https://doi.org/10.3390/land11081256
Submission received: 21 July 2022 / Revised: 3 August 2022 / Accepted: 4 August 2022 / Published: 6 August 2022
(This article belongs to the Special Issue Soil Management for Sustainable Agriculture and Ecosystem Services)

Abstract

:
The presence of a noticeable rate of degradation in the land of the Nile Delta reduces the efficiency of crop production and hinders supply of the increasing demand of its growing population. For this purpose, knowledge of soil resources and their agricultural potential is important for determining their proper use and appropriate management. Thus, we investigated the state of soil fertility by understanding the effect of the physical and chemical properties of the soil and their impact on the state of land degradation for the years 1985, 2002 (ancillary data), and 2021 (our investigation). The study showed that there are clear changes in the degree of soil salinity as a result of agricultural management, water conditions, and climatic changes. The soil fertility is obtained in four classes: Class one (I) represents soils of a good fertility level with an area of about 39%. Class two (II) includes soils of an average fertility level, on an area of about 7%. Class three (III) includes soils with a poor level of fertility, with an area of about 17%. Class four (IV) includes soils of a very poor level of fertility with an area of about 37% of the total area. Principal component analysis (PCA) has revealed that the parameters that control fertility in the studied soils are: C/N, pH, Ca, CEC, OM, P, and Mg. Agro-pedo-ecological units are important units for making appropriate agricultural decisions in the long term, which contribute to improving soil quality and thus increasing the efficiency of soil fertility processes.

1. Introduction

Soil salinization, and physical and biological degradation are among the most prominent global environmental challenges because they have a negative impact on agricultural output and fair development. The agriculture of Nile Delta has many problems related to productivity [1], yet it remains the main economic activity and source of field crops for the population [2,3]. The assessment of soil fertility and degradation is therefore fundamental in order to help find the optimal conditions for plant growth [4]. Both organic and mineral components of soil create an interactive natural environment that fosters plant growth [5]. Its physical, chemical, and biological characteristics enable it to supply nutrients in adequate proportion and balance for plant growth [6,7,8]. This serves as the foundation for all input-based high-production systems. [9]. The demand for land for agricultural production has also increased due to Egypt’s rising population. However, detailed information on the level of soil fertility/degradation in Egypt is still quite limited [10,11,12,13]. For the purpose of guiding agricultural management decisions, Egyptian farmers need the most recent information on soil quality [14]. The main economic activity is agriculture as a source of field crops for the population. Soil fertility and degradation are among the most important productivity problems facing agriculture in the Nile Delta. Therefore, it is still necessary to evaluate the state of the land and the dynamics of its changing properties to suggest optimum conditions for plant growth as one of the most important inputs to increase productivity [11,12,13].
Currently, technological advancements in the geospatial field have introduced greater ease for choice makers by presenting a list of alternatives for problem structuring [15,16] of actual global issues of a multidimensional nature, and evaluating alternatives by outlining the link between input and output maps [17]. The ever-growing availability of earth observation data and the well-established use of GIS leads to the development of automated workflows and toolboxes for environmental management [18,19,20]. They enable time savings, objective and non-biased judgments, and a systematic and spatially clear evaluation framework. [18,19]. With the fast development of GIS and computer technology, this approach has been widely employed in research programs. Currently, the most significant uses of GIS are in assessment, providing ecological capability maps, land management, and land planning [20]. This integrated strategy allows for the incorporation of expert judgments into geographical data. This integrated strategy has been employed in a number of research projects to deal with situations in which multi-criteria judgments were evaluated using geographical data [21]. Mapping soil deterioration is a time-consuming and labor-intensive process. Modeling degradation processes allows for the prediction of deterioration [22,23]. El-Beheira Governorate is one of the area’s most vulnerable to land degradation [24].
Soil is the deposit factor for fertility, which is the fruit of the interaction between climate and vegetation, and since the soil cannot be restored to become rich in nutrients through time, knowing the causes of the actual degradation can accelerate the appropriate agricultural management related to improving soil fertility through good management of soil quality determinants. Thus, the identification of areas with low values of soil fertility indicates the long-term progression of degradation. Based on the foregoing, this study intends to assess fertility and degradation for sustainable land management.

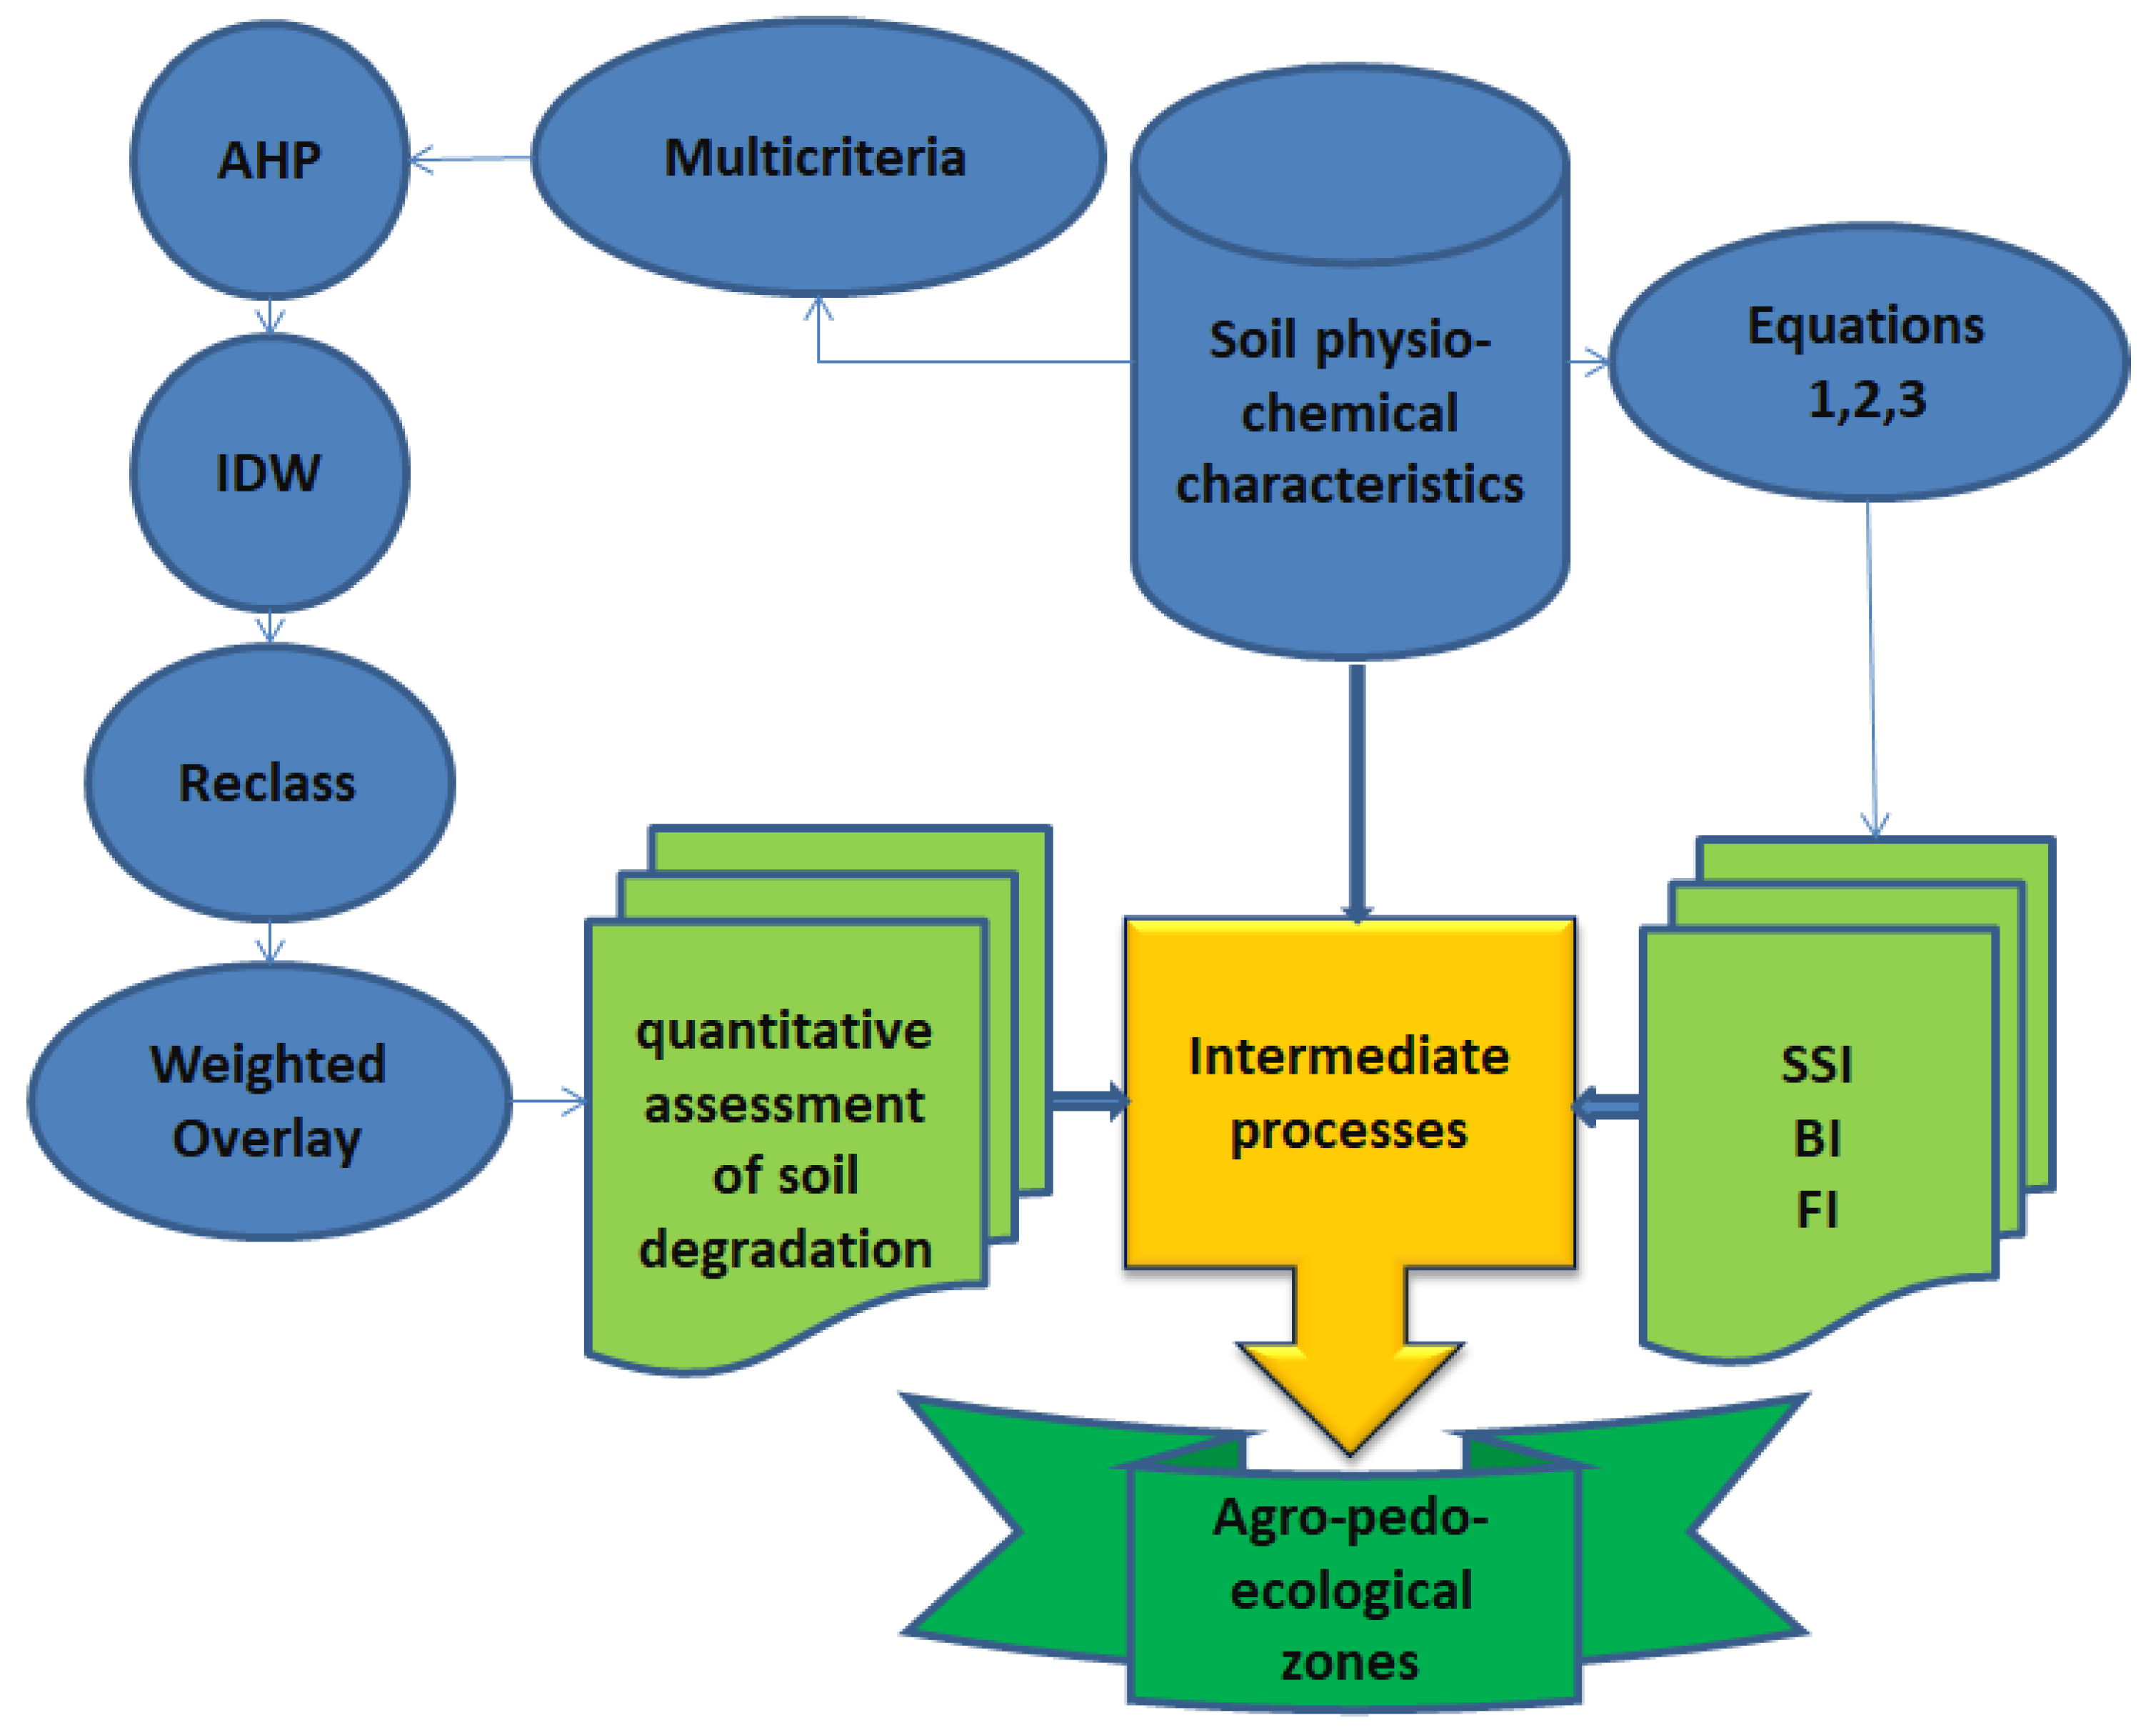
2. Materials and Methods
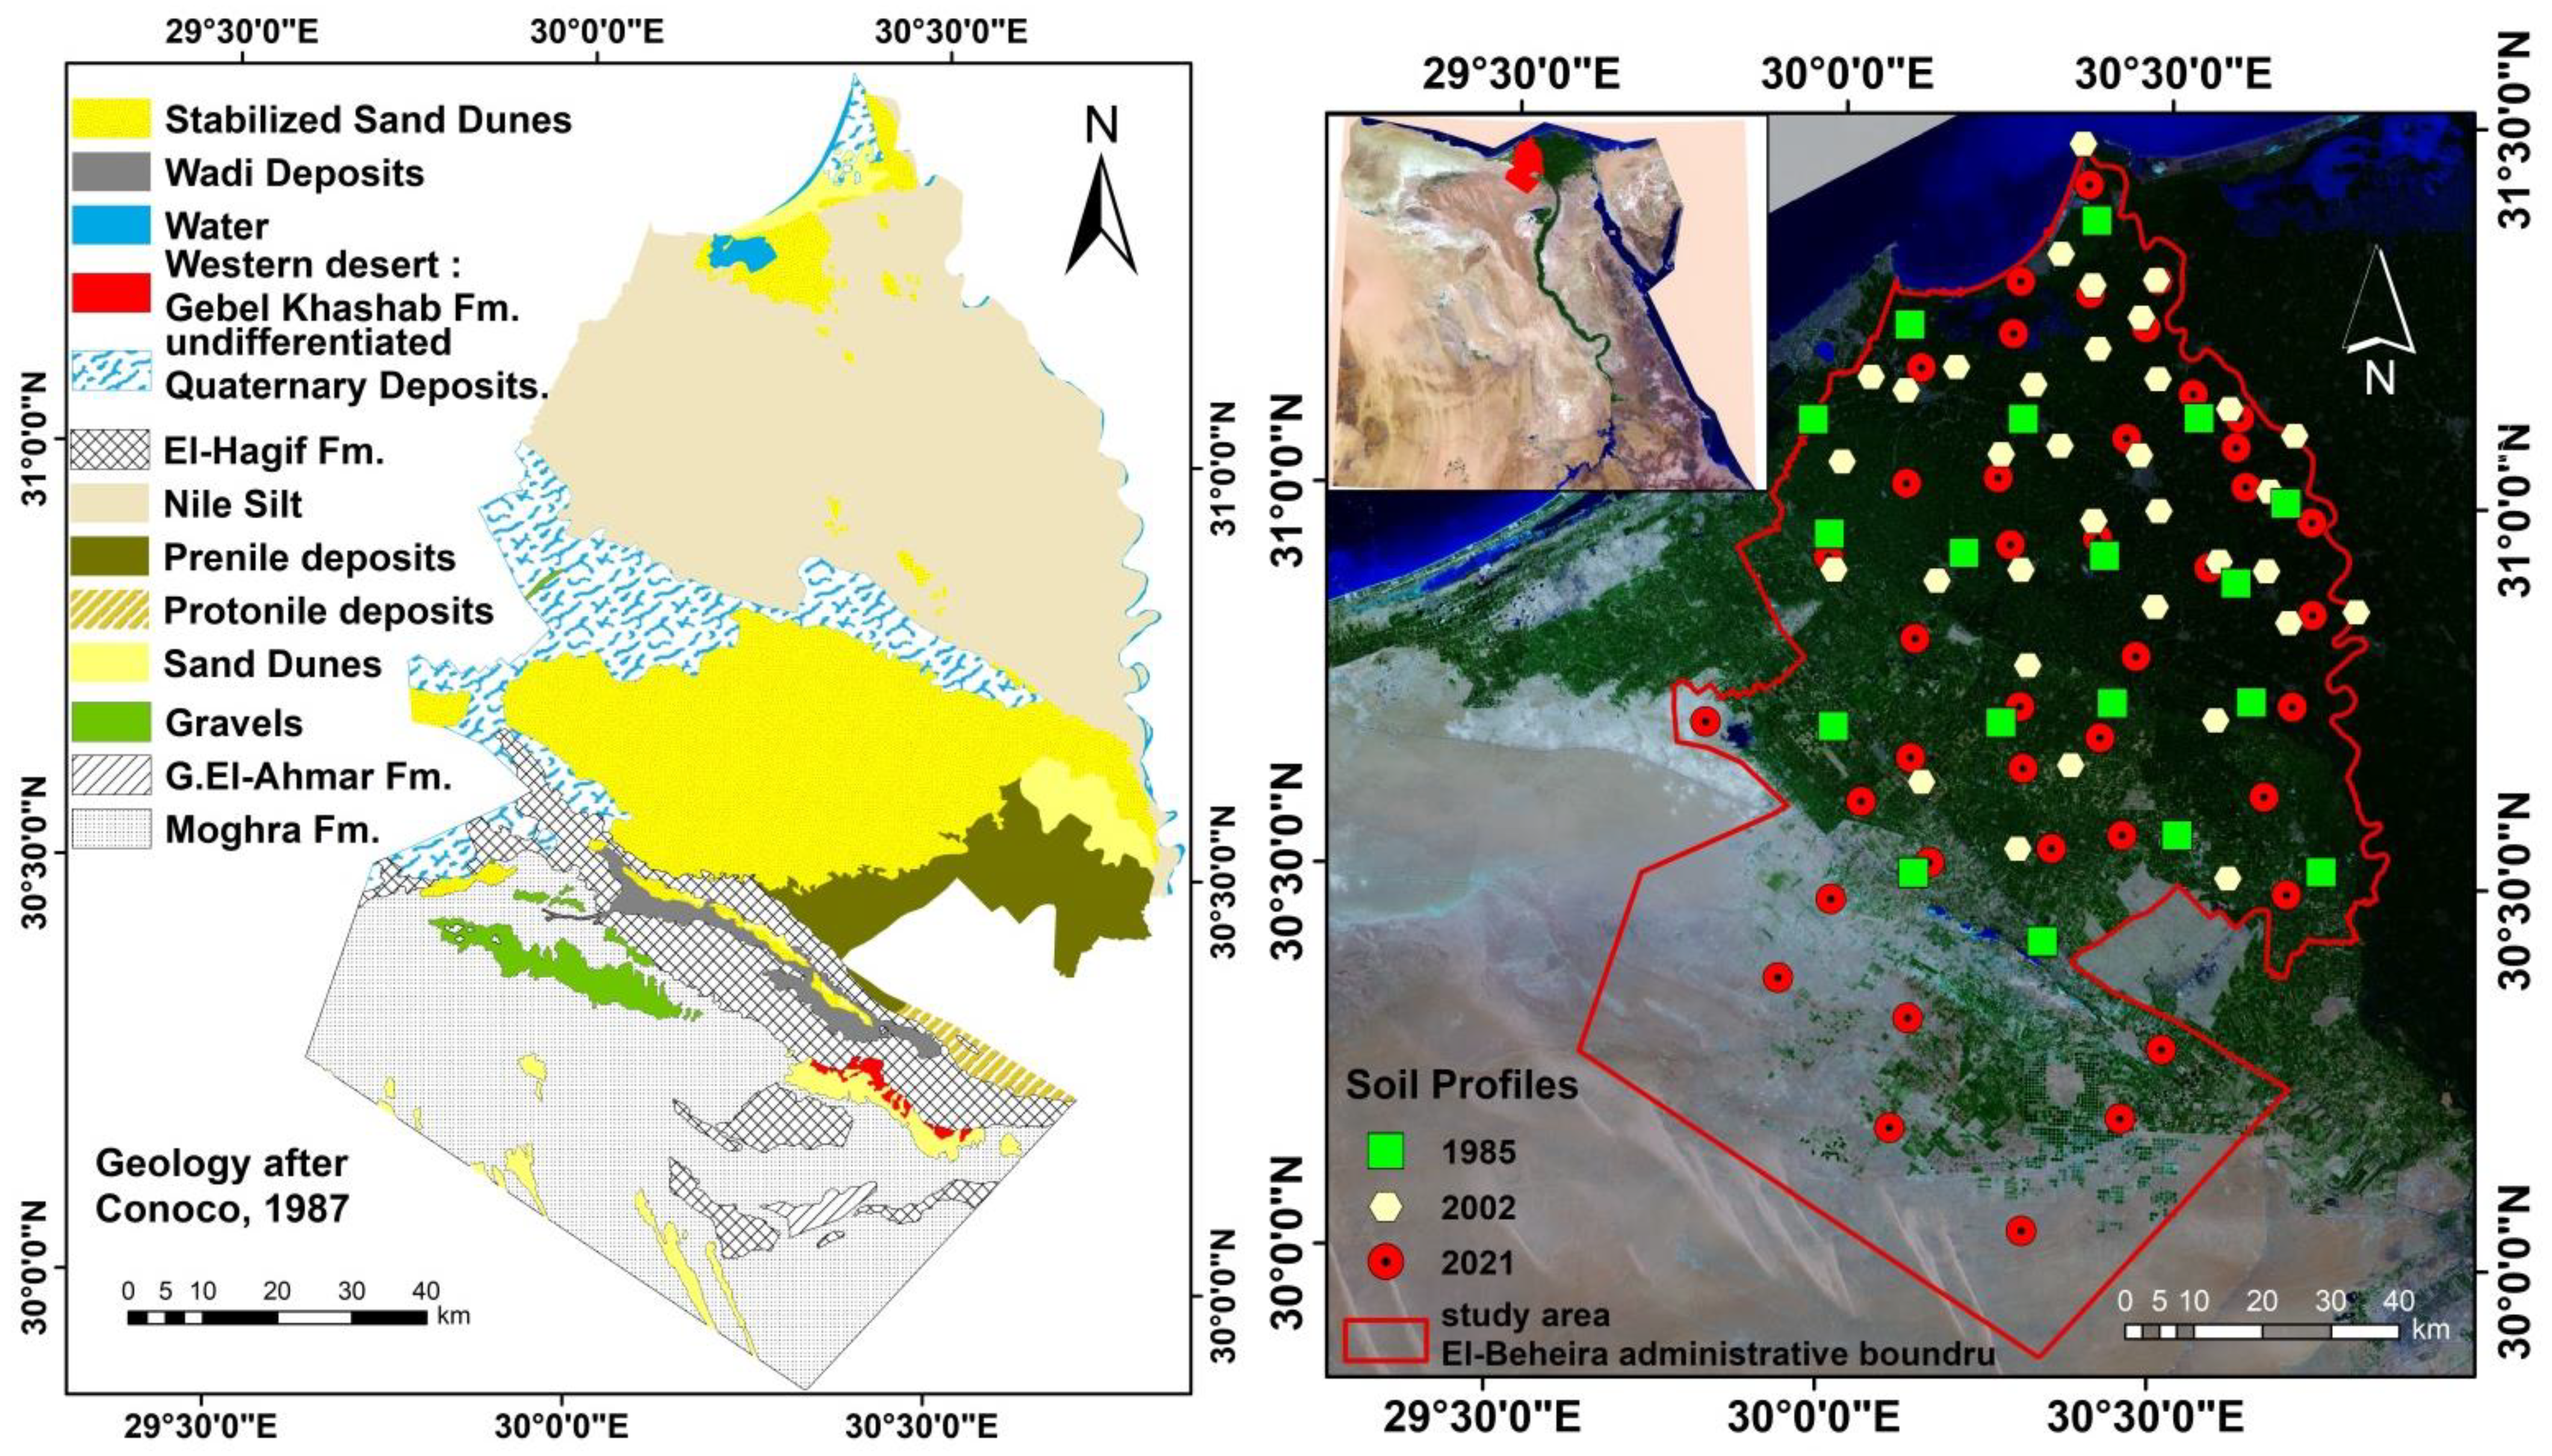
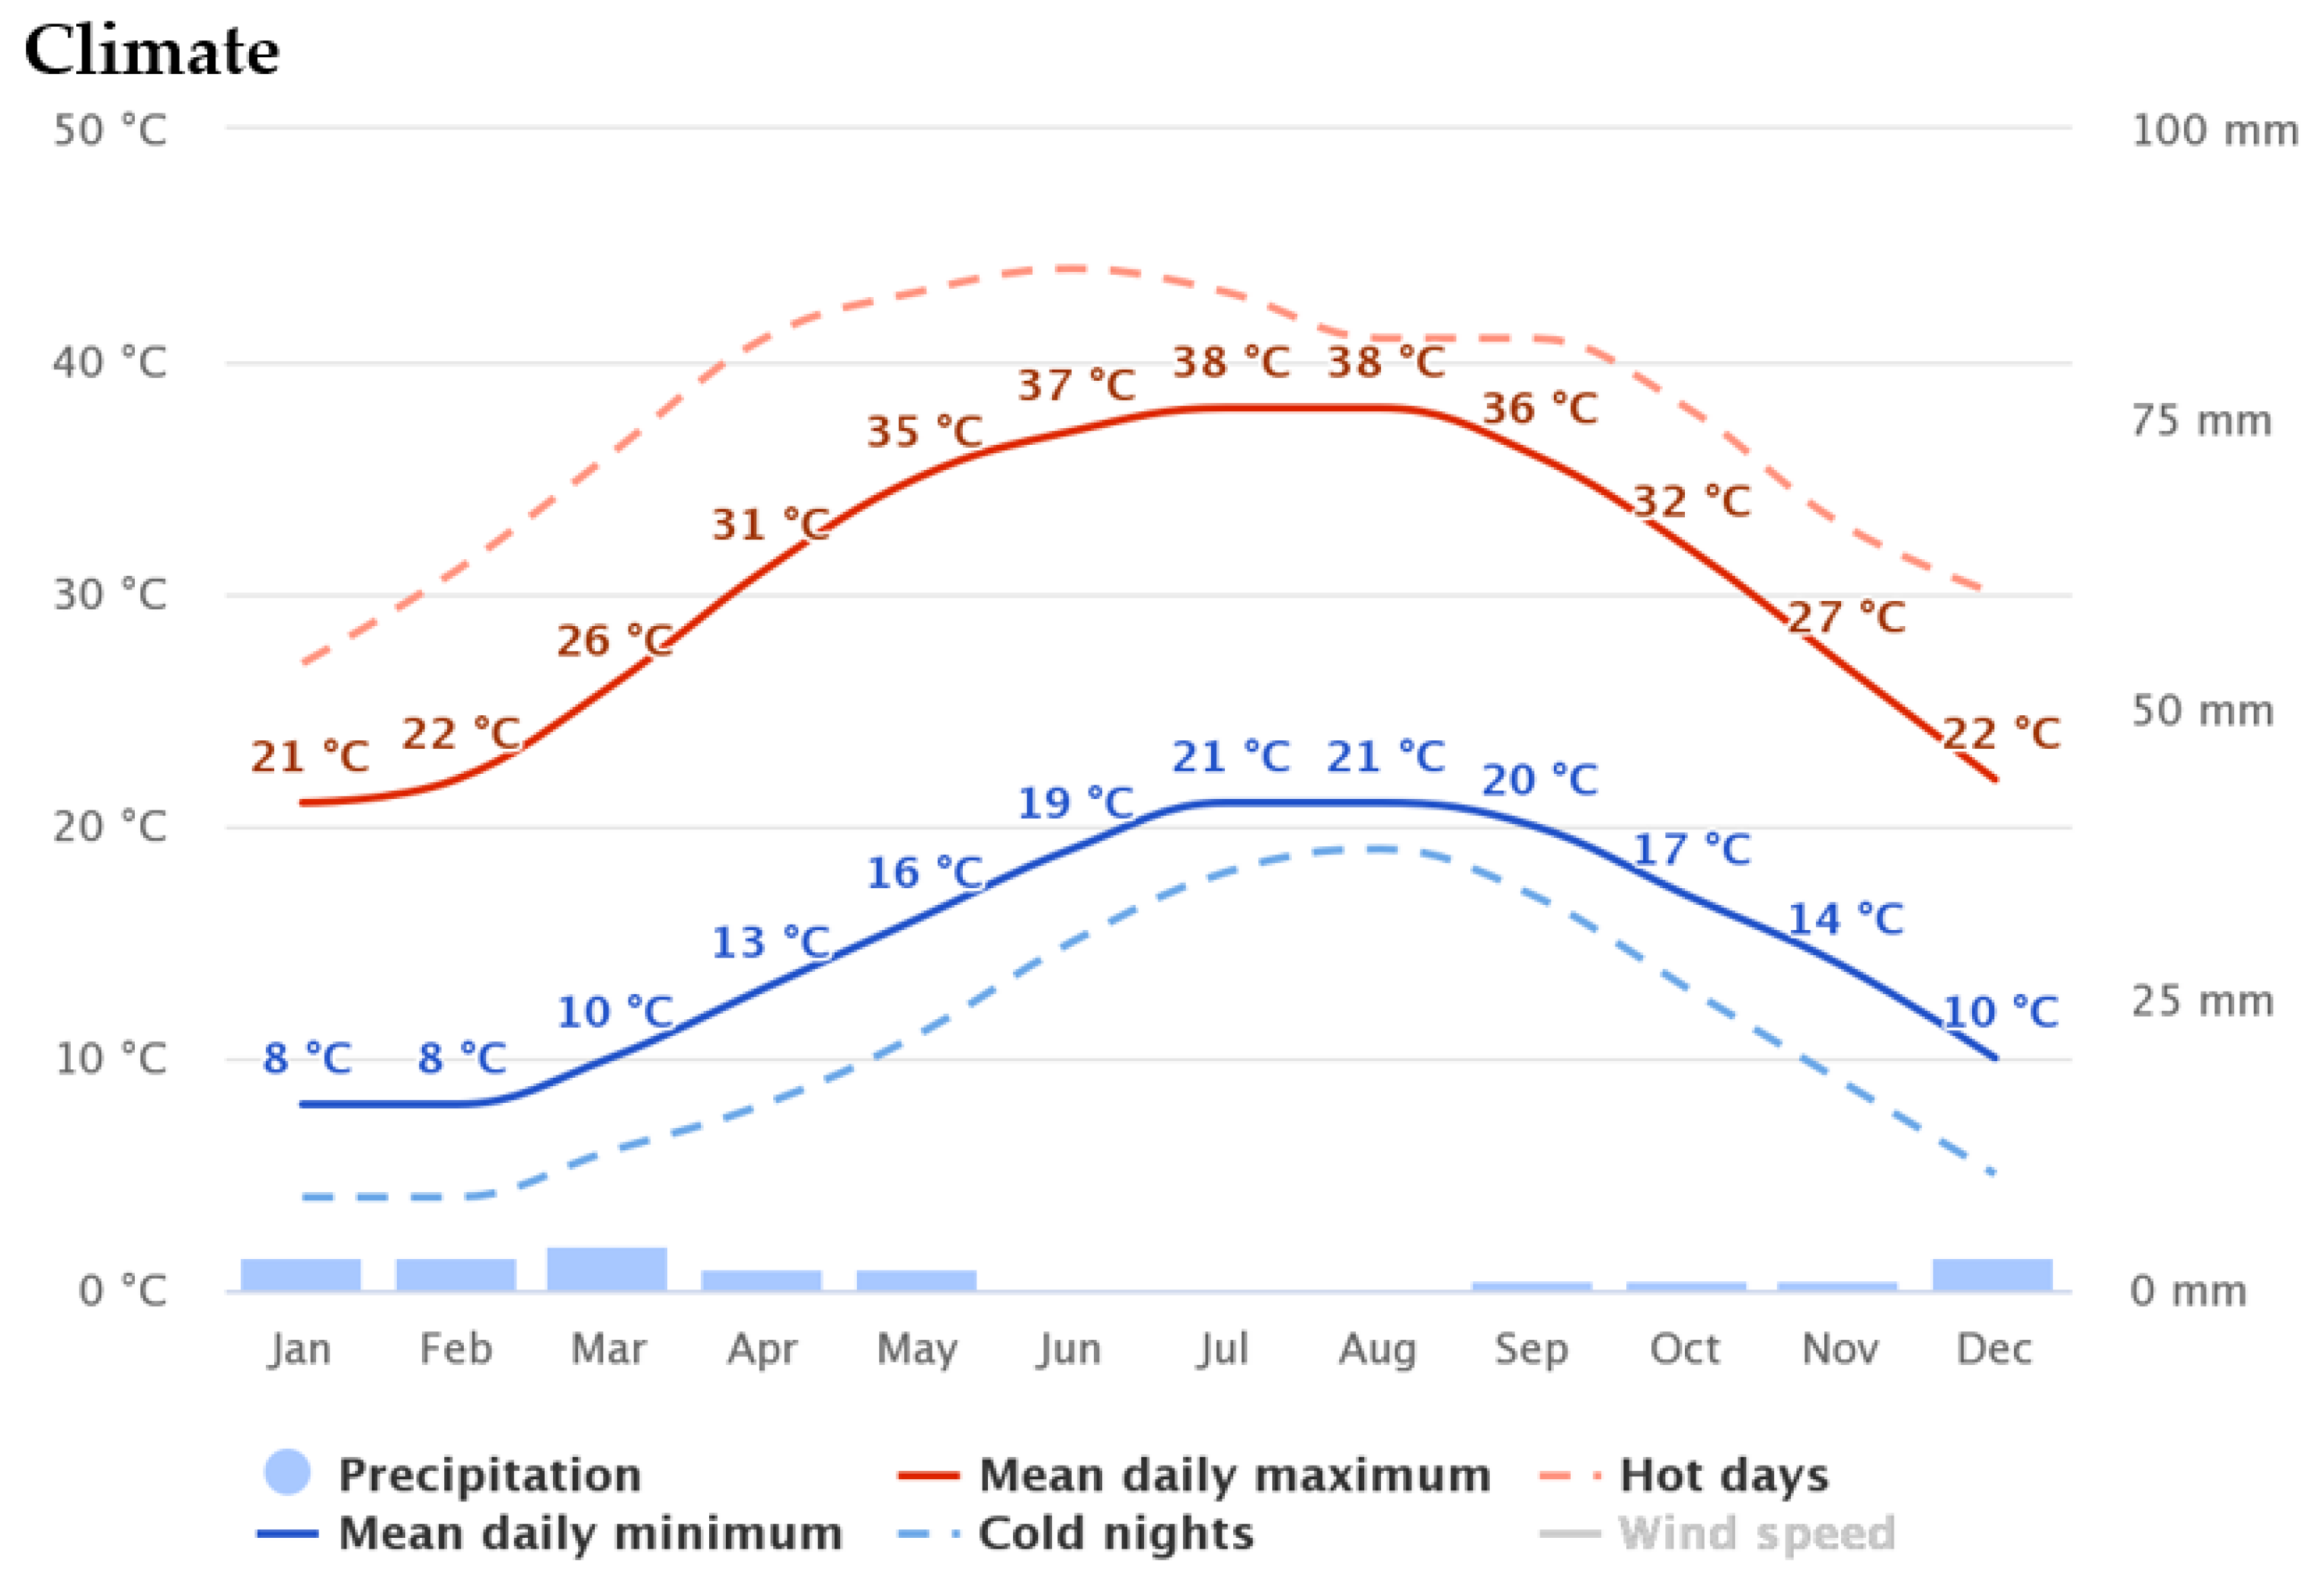
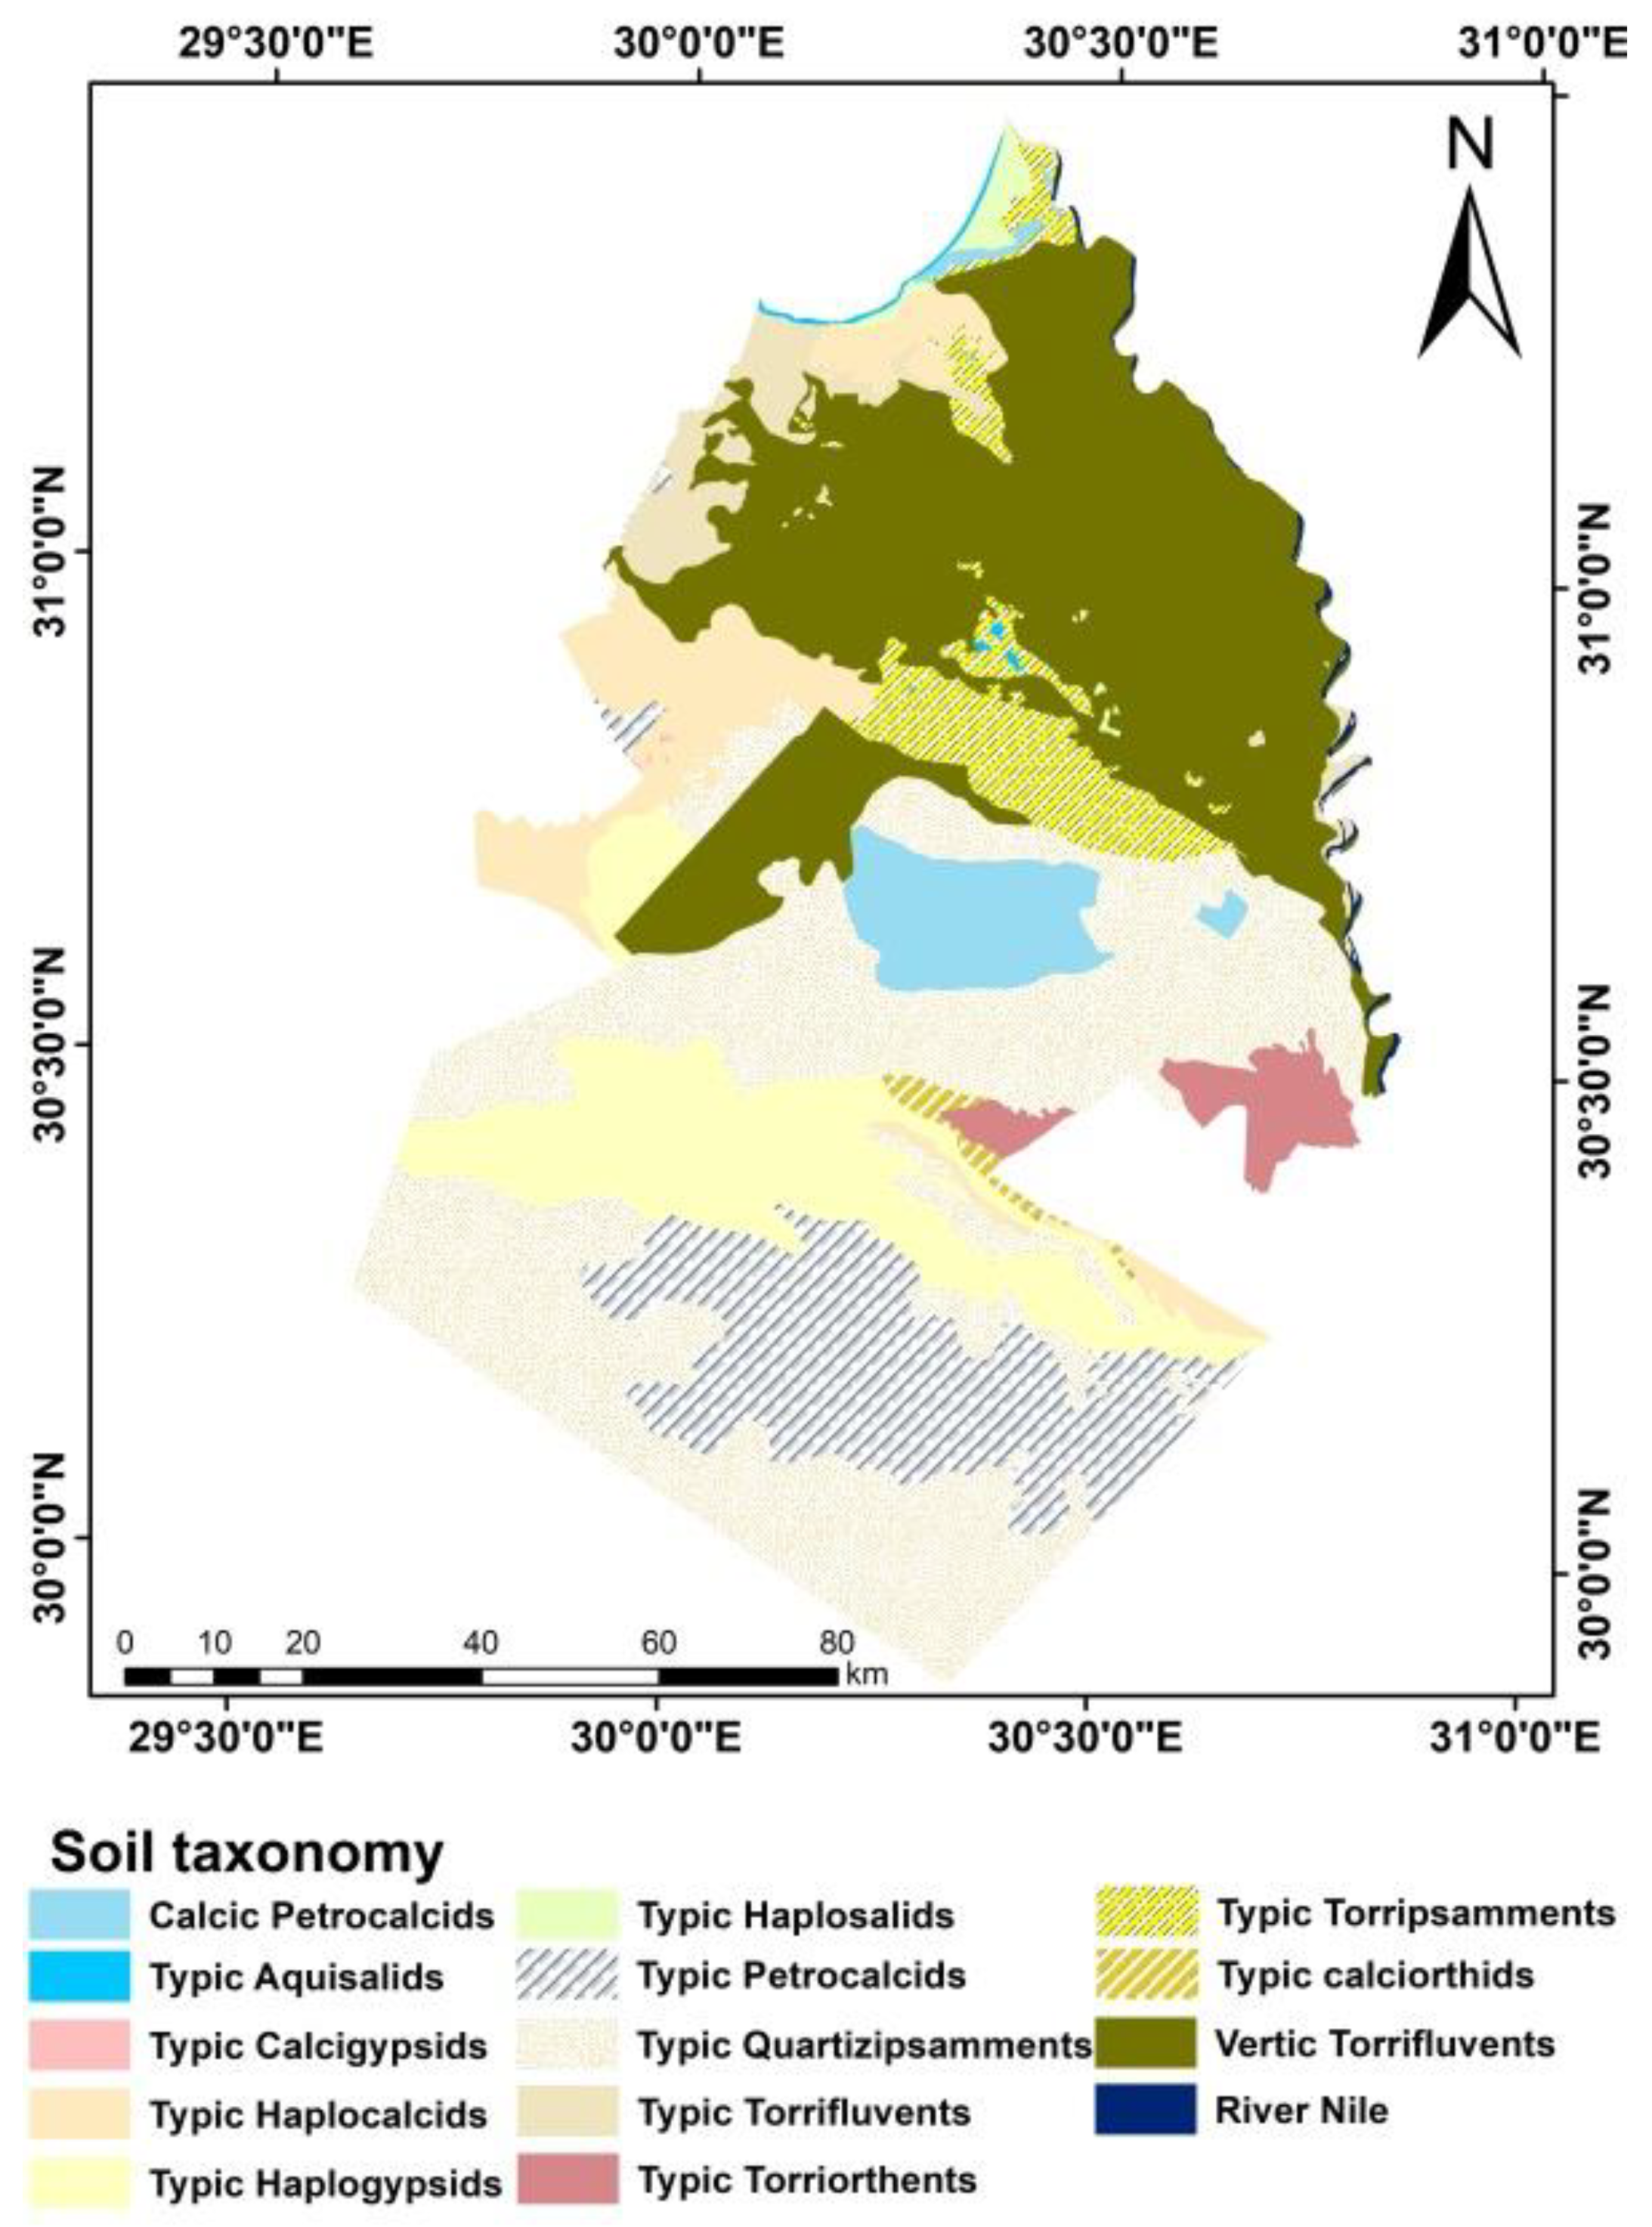
2.1. Study Area

El-Beheira Governorate is located in the west of the Delta. It is bordered to the north by the Mediterranean Sea, to the east by the Rashid branch, to the west by the governorates of Alexandria and Matrouh, and to the south by the Giza governorate. According to Khalil et al. [24] the landscape of the newly cultivated soil in El-Beheira governorate is low to flat land and the maximum ground elevation is 30 m above sea level. Ground surface elevation is below sea level in Abu EL Matamir and Hush Isa counties, north of the governorate. Geomorphology characterization of the governorate is characterized by two major units: tablelands and alluvial plains. Tablelands are extended towards the southwest of the coastal plains and its surface is covered by sandy limestone on the western and southern sides. Tablelands are distinguished by three landforms which are ridges, depressions, and erg plain. The alluvial plains have a young alluvial plain and an old alluvial plain. The young alluvial plain represents a portion of the oldest cultivated land in the northwest of the Nile Delta. Its surface is covered with clay beds alternated with a thin band of silt where it lies between the Abu Mina Depression in the west and the Rosette branch of the Nile in the east, while the old alluvial plain lies in the south of the young alluvial plain toward the northern and eastern areas of Wadi El Natrun [25]. These plain slopes are toward the north and northeast and vary in elevation between 20 and 60 m. A sandy deposit has covered the northern part surface, whereas gravelly deposits dominate in the southern part, Figure 1.
Figure 2 gives indications of typical climate patterns and expected conditions (temperature, precipitation, sunshine, and wind). The diagram indicates that the soil moisture regime is torric and the soil temperature regime is thermic. The historical data (2004–2021) showed a mean yearly temperature of 21.2 °C and mean monthly temperatures ranging from 13.7 °C in January to 27.8 °C in August, while 34.5 °C in July and 7.8 °C in January were the highest and lowest temperatures, respectively, for the past ten years. Between 52% in May and 70% in November and December, the average monthly relative humidity varied. At around 2 p.m., the relative humidity reaches its lowest point (approximately 30%). In December and January, the wind blows at 11 km/h, while in May and June, it blows at 20 km h−1. Last but not least, winds that are generally present are those that originate in the north, northwest, and northeast.

2.2. Soil Sampling and Analysis

Ancillary data for the years 1985 and 2002 were collected from [26,27]. The field campaign in 2021 consisted of a soil survey by digging profiles with a thickness ranging from about 40–150 cm, with a detailed study of the agricultural horizon. Then, soil samples were taken from different layers and horizons along the crop profile. These samples were taken from the different identified soil groups, taking into consideration the morphology of each soil group. A total of 121 soil samples were collected from 35 soil profiles distributed in the region to cover the existed landform units. Once the samples were taken, they were taken to a laboratory where physical and chemical analyses were performed. Chemical analyses included: soil organic carbon (OC), total nitrogen (N), available P, total P, exchangeable cations (Ca, Mg, K, Na), cation exchange capacity (CEC), and pH. OC was extracted by oxidation with potassium dichromate in a highly acidic solution and quantified using a TOC-5000A analyzer (Shimadzu, Japan). Total N was determined by the Kjeldahl method [28]. The available P and total P were determined by the Bray II method [29], and exchangeable cations were extracted by ammonium acetate (C2H3O2NH4) buffered at pH = 7, and quantified using an atomic absorption spectrophotometer (AAnova 350 Analytic Jena GmbH, Thuringia, Germany) [30]. CEC at pH 7 was determined using the ammonium acetate method [31]. The soil pH was determined in a 1:2.5 soil suspension with demineralized water. Physical analyses performed were bulk density (BD) and particle size distribution. The bulk density (BD) was obtained using the Koppeki cylinder method [32]. With regard to the particle size distribution was determined by the hydrometer method [33,34]. Binary and ternary diagrams models were used [35,36,37] to establish balances between soil textural, pH and nutrient concentrations These diagrams display various soil texture grades in connection to their agronomic significance. The poles of relative richness in a given cation in the equilibrium of the cationic balance (Ca/Mg/K) are shown in the triangular diagram of Dabin [36].
The SSI (structural stability index) is a physical parameter that determines the degree of degradability and erodibility of soil. It is defined by Pieri [38] according to the report:
SSI = 1.724 ×   OC   L + A × 100 ;   0   ISS  
with OM: soil organic matter content, A: clay content in the soil. L: Silt content in the soil. SSI > 9% indicates soils with a stable structure; 7% < SSI ≤ 9% indicates soils with a low risk of structural degradation; 5% < ISS ≤ 7% indicates soils with a high risk of structural degradation; 5% < ISS indicate soils with a degraded structure.
The beat index (BI) indicates the risk of erosion in compaction of one. Remy et al. [39] formula for estimating the risks of beating is written:
BI = 1.5 ×   Lf + 0.75 ×   LG A 10 ×   OM C
with C = 0.2 × (pH-7), LF = Fine silt, LG = coarse silt, A = clay, OM = organic matter. BI < 1.4% indicates non-beating soils; 1.4% < IB ≤ 1.6% indicates low-beating soils; 1.6% < BI ≤ 1.8% indicates beating soils; IB > 1.8% indicate very beating soils.
The Forestier index [35] indicates the reserve in bases exchangeable in the ground.
FI = S 2 A   +   Lf
When this index is above 1.5 (FI > 1.5) the reserve in exchangeable bases is good and when FI < 1.5 the reserve in the base is low.
The balances between certain physical-chemical properties have been established and reported on the diagrams according to the models used by other authors [27,28,29,30]. The different textural classes are given from the FAO textural diagram, thus characterizing the different groups of soils of north El-Beheira and its surroundings on the agro-pedo-ecological level. The Ca-Mg-K ternary fertility diagram after Dabin [36] highlights the thresholds of deficiency and a relative deficiency in a given cation in the equilibrium of the cationic balance. Dabin’s [36] diagram on the N-pH equilibrium highlights the nitrogen contents carried on the abscissa and the pH carried in the ordinate. The limitations are defined by the pH values carried in ordinate, which define horizontal lines and show only the influence of the pH on the total nitrogen reserve. It defines four levels of chemical fertility (low, poor, medium, and good) of soils according to their degree of pH. Dabin’s diagram [36] makes it possible to highlight this antagonism or synergy between K-Mg cations in the soil. The Ca/K diagram relating to the binary fertility diagram of Martin [37] establishes the balance between calcium and potassium in soils. The data obtained, after analysis of the samples in the laboratory, were processed statistically using SPSS (IBM SPSS Statistics for Windows, Version 25.0. Armonk, NY, USA: IBM Corp.). A descriptive statistical analysis of 15 variables was used to compare mean and standard deviations by soil group in the study area. Principal component analysis (PCA) determined the parameters that control fertility in the investigated soils.
According to FAO-ISRIC [23] guidelines, a quantitative assessment of soil degradation was performed with an emphasis on salinization and nutrient loss. The weighting of criteria and sub-criteria was carried out using the AHP method. In fact, AHP and the GIS in an integrated technique were used for mapping vulnerable areas to degrade. This process was done in three main steps. In the first step, the most important criteria and sub-criteria that affect vulnerability to degradation were determined. The initial criteria and sub-criteria were chosen based on the study area’s conditions, expert comments, and a literature review. Five criteria were elected and weighted using AHP. Pairwise comparison was used to allocate weights to criteria rating (Table 1) and sub-criteria and the Consistency Ratio also was calculated to verify the coherence of the judgments [40].
For weighting (criteria and sub-criteria), a questionnaire was delivered, which was associated with a group of experts who were aware of the area and degradation perception. Experts used Saaty’s scale of pairwise comparisons to evaluate the importance of criteria and sub-criteria [40]. Relative weights for the functions were calculated based on input from the experts.
The research indices’ weight values, which are absolute integers between zero and 100%, indicate the priority given to them. This implies that the total weights applied to all parameters should equal 100%. Table 1 summarizes the degradation factors and how they were ranked in terms of their impact on degradation occurrences in the research region, Table 1. The weights assigned to each criterion/index are frequently based on a professional understanding of each parameter’s relevance and are occasionally based on analytical techniques and literature.
The steps involved in soil assessment in the study area are shown sequentially in Figure 3. The figure shows the steps followed in the Model Builder in the GIS program. It started with building a database of various analyzes, then the rating and the creation of intermediate maps, then working and producing for all the factors, then getting the final results of the used indices and degradation rate which combined to produce agro-pedological zones.

3. Results

Soil taxonomy contains 11 units, as shown in Figure 4. The alluvial soil texture is fine textured (clay loam to clay) and the water table is between 90 and 160 cm. The depth varies from the south of the alluvial soil, which is characterized by the depth of the soil profile being the deepest, and the depth decreases in the north of the alluvial soil, especially in the areas adjacent to Lake Edko, less than (70 cm) with low to moderate depth level. Overall, the majority of the alluvial areas have a high clay texture (44 to 65%). Concerning the coastal lands, with clay content (13 to 42%) with texture sandy to clay-loam. Soils are affected by salinity (EC > 4.0 dS m−1) while the pH varies from being near neutral (pH = 7) to an alkaline value of 8.83.

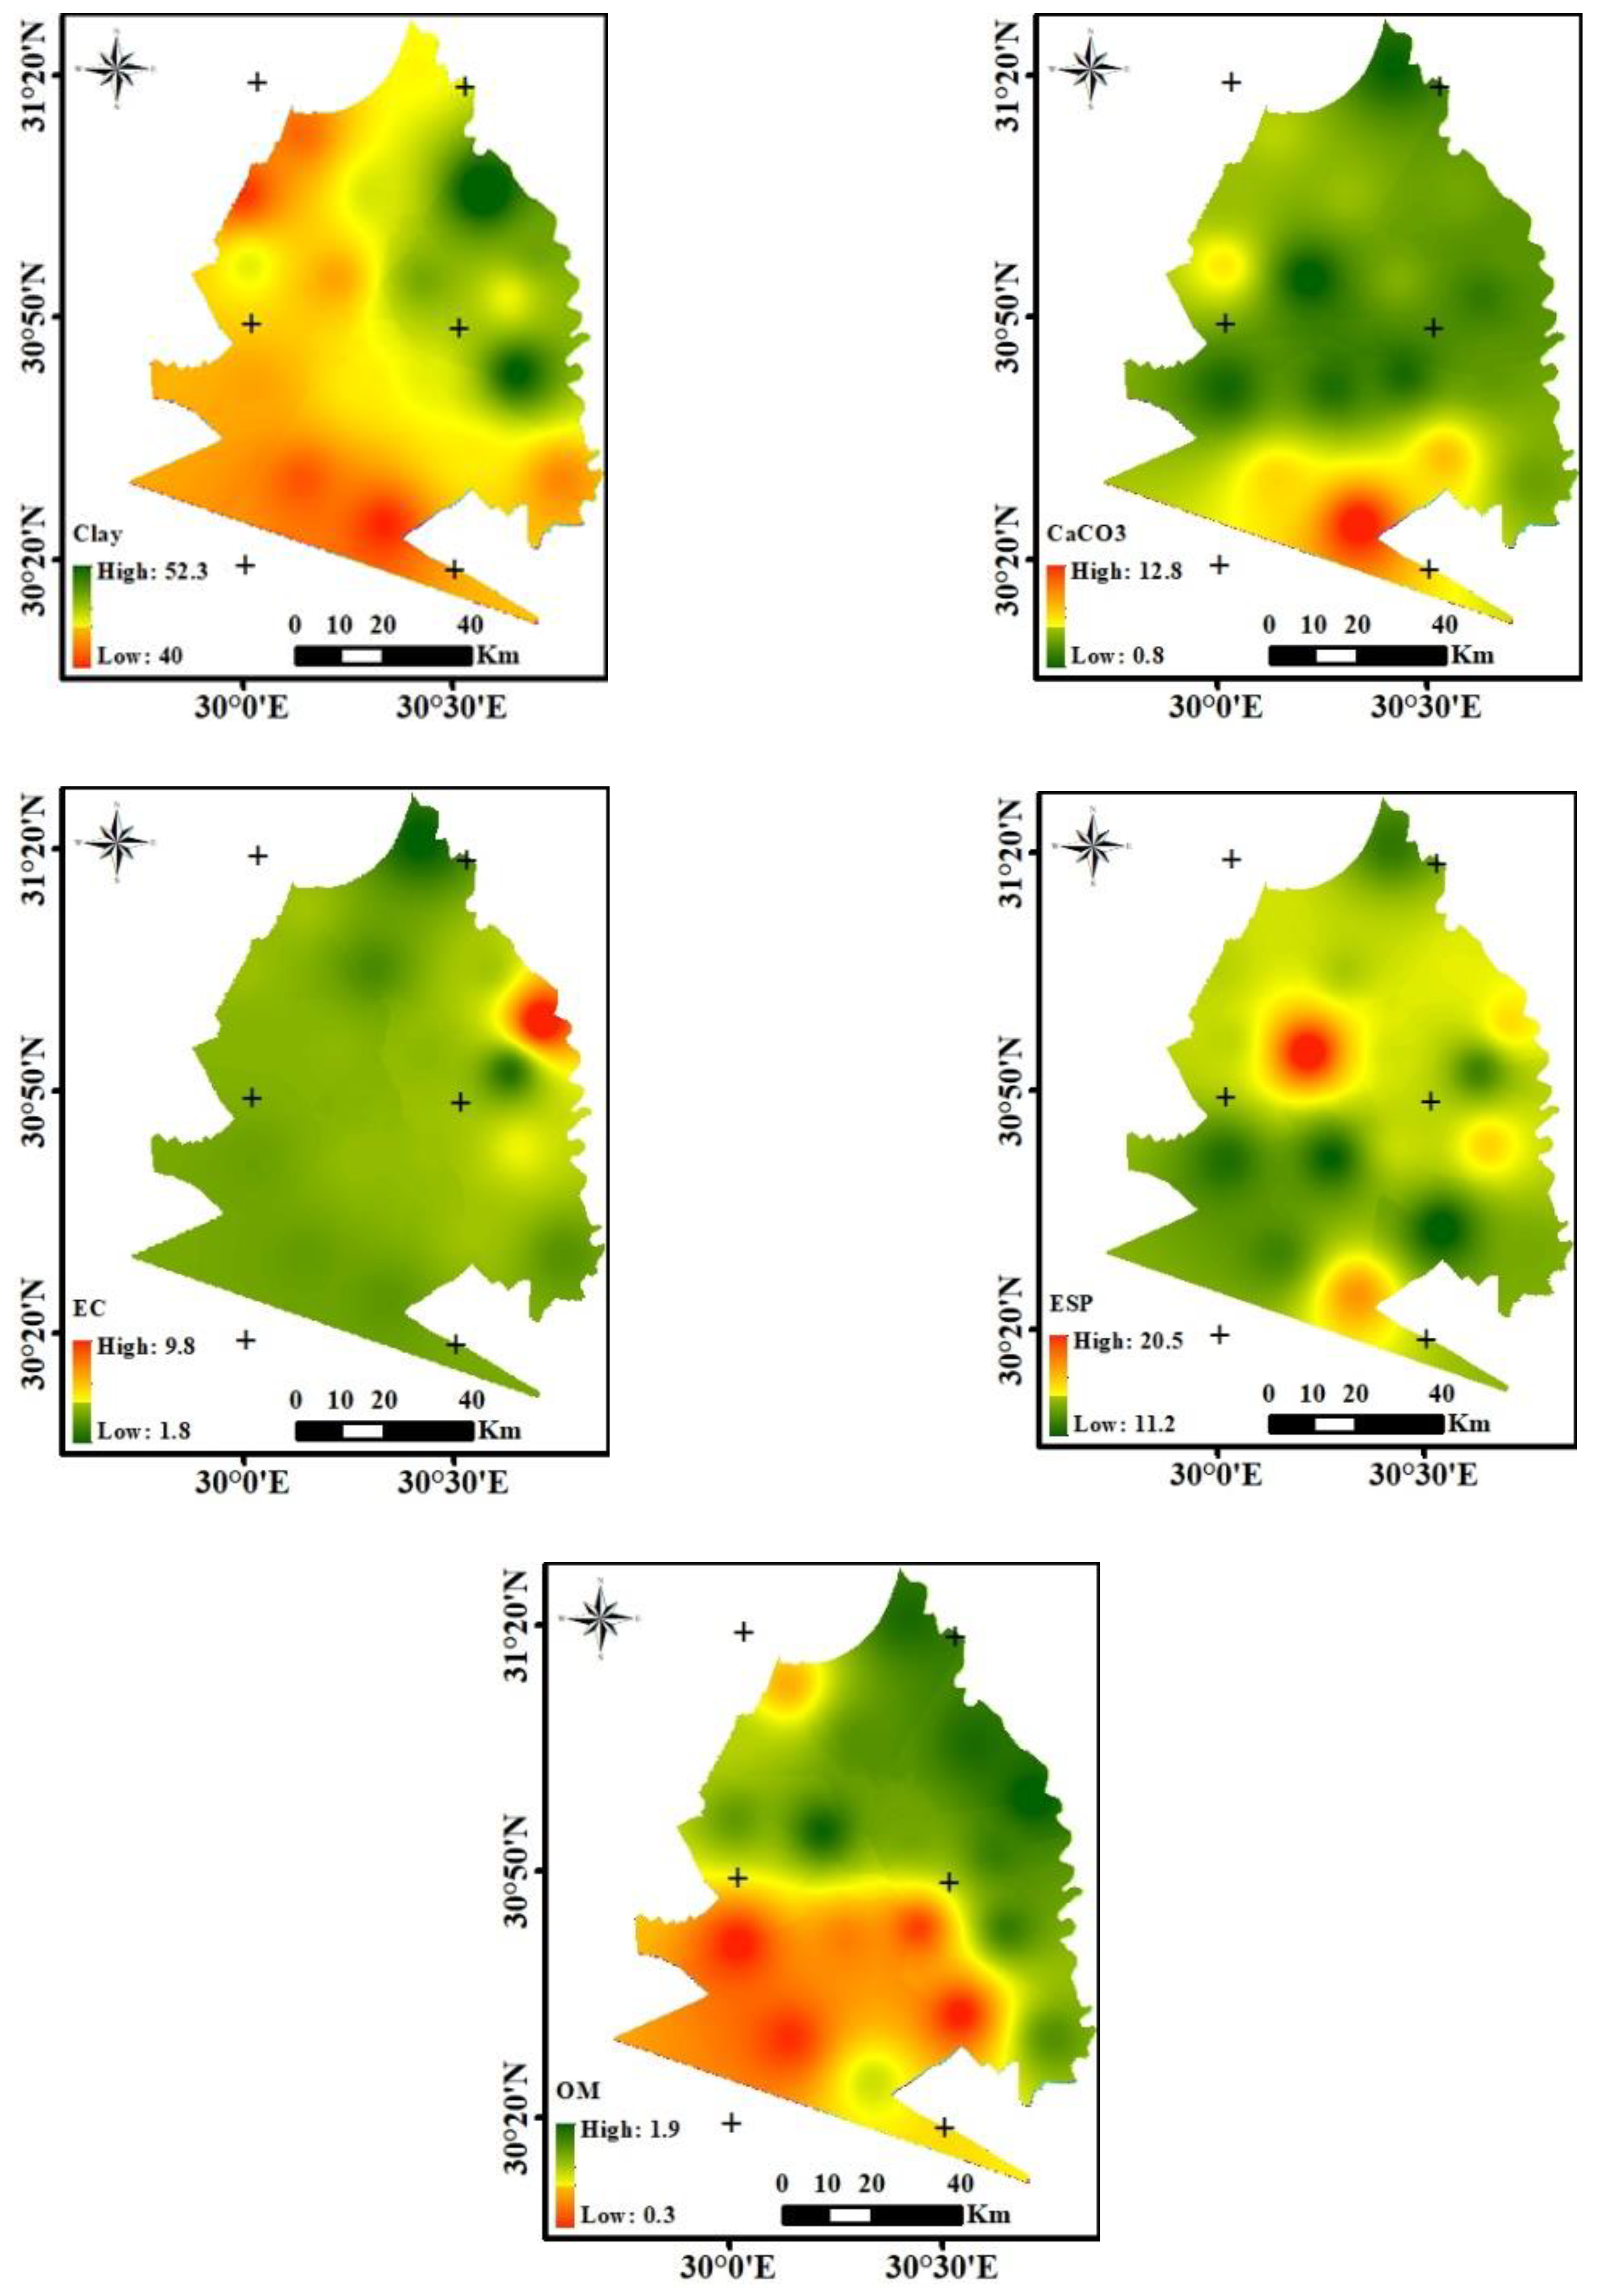
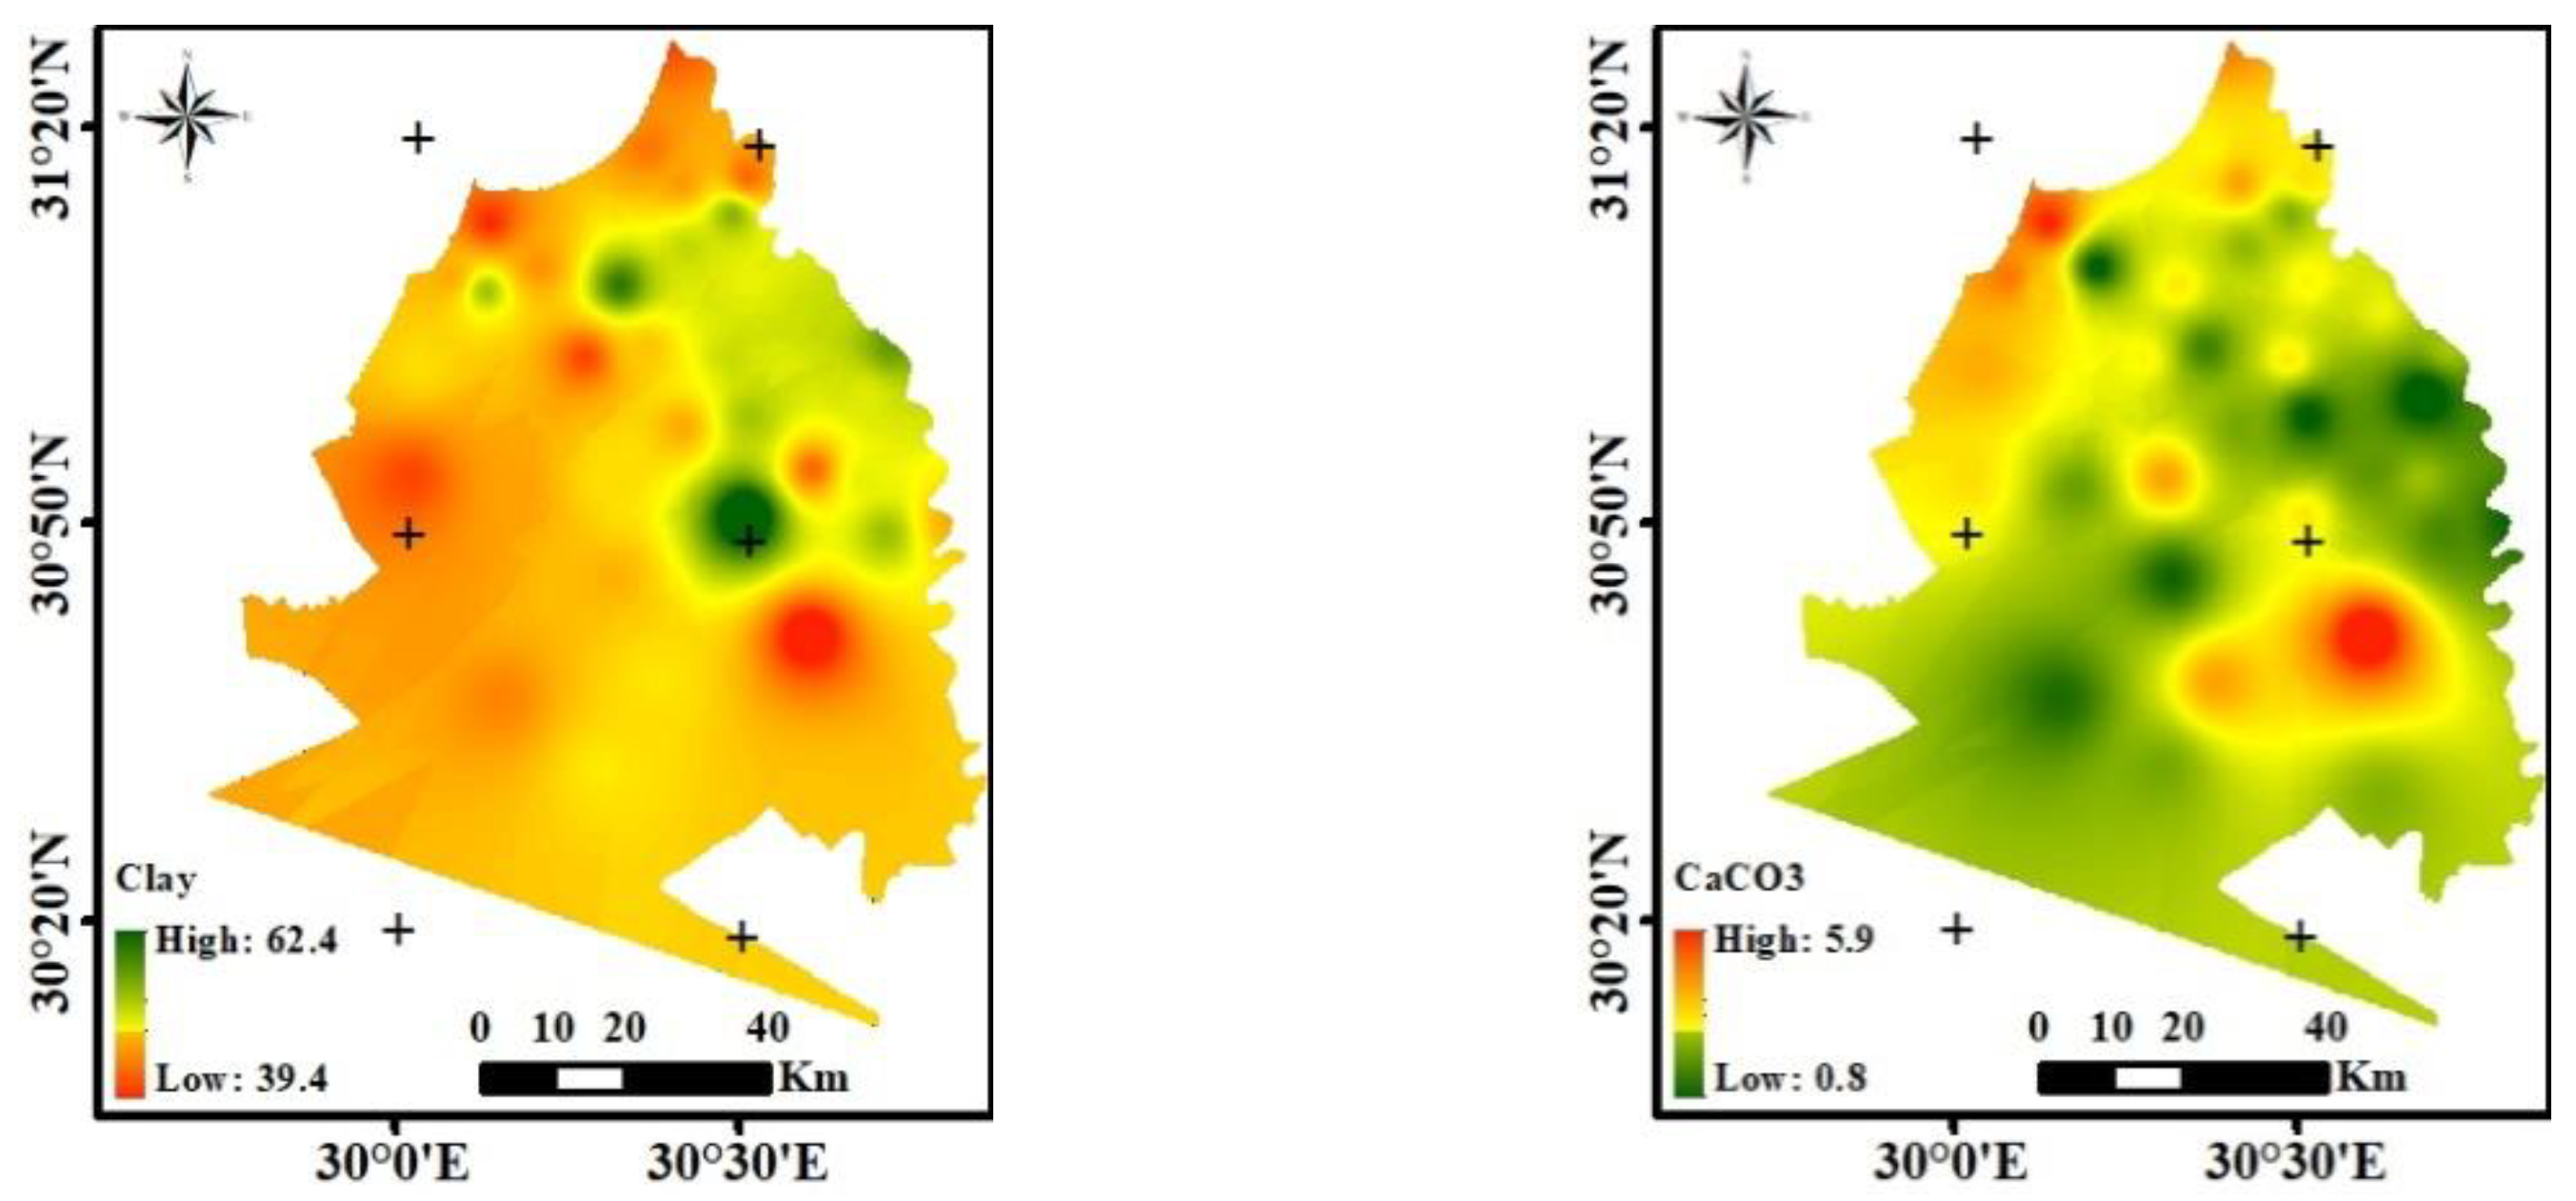
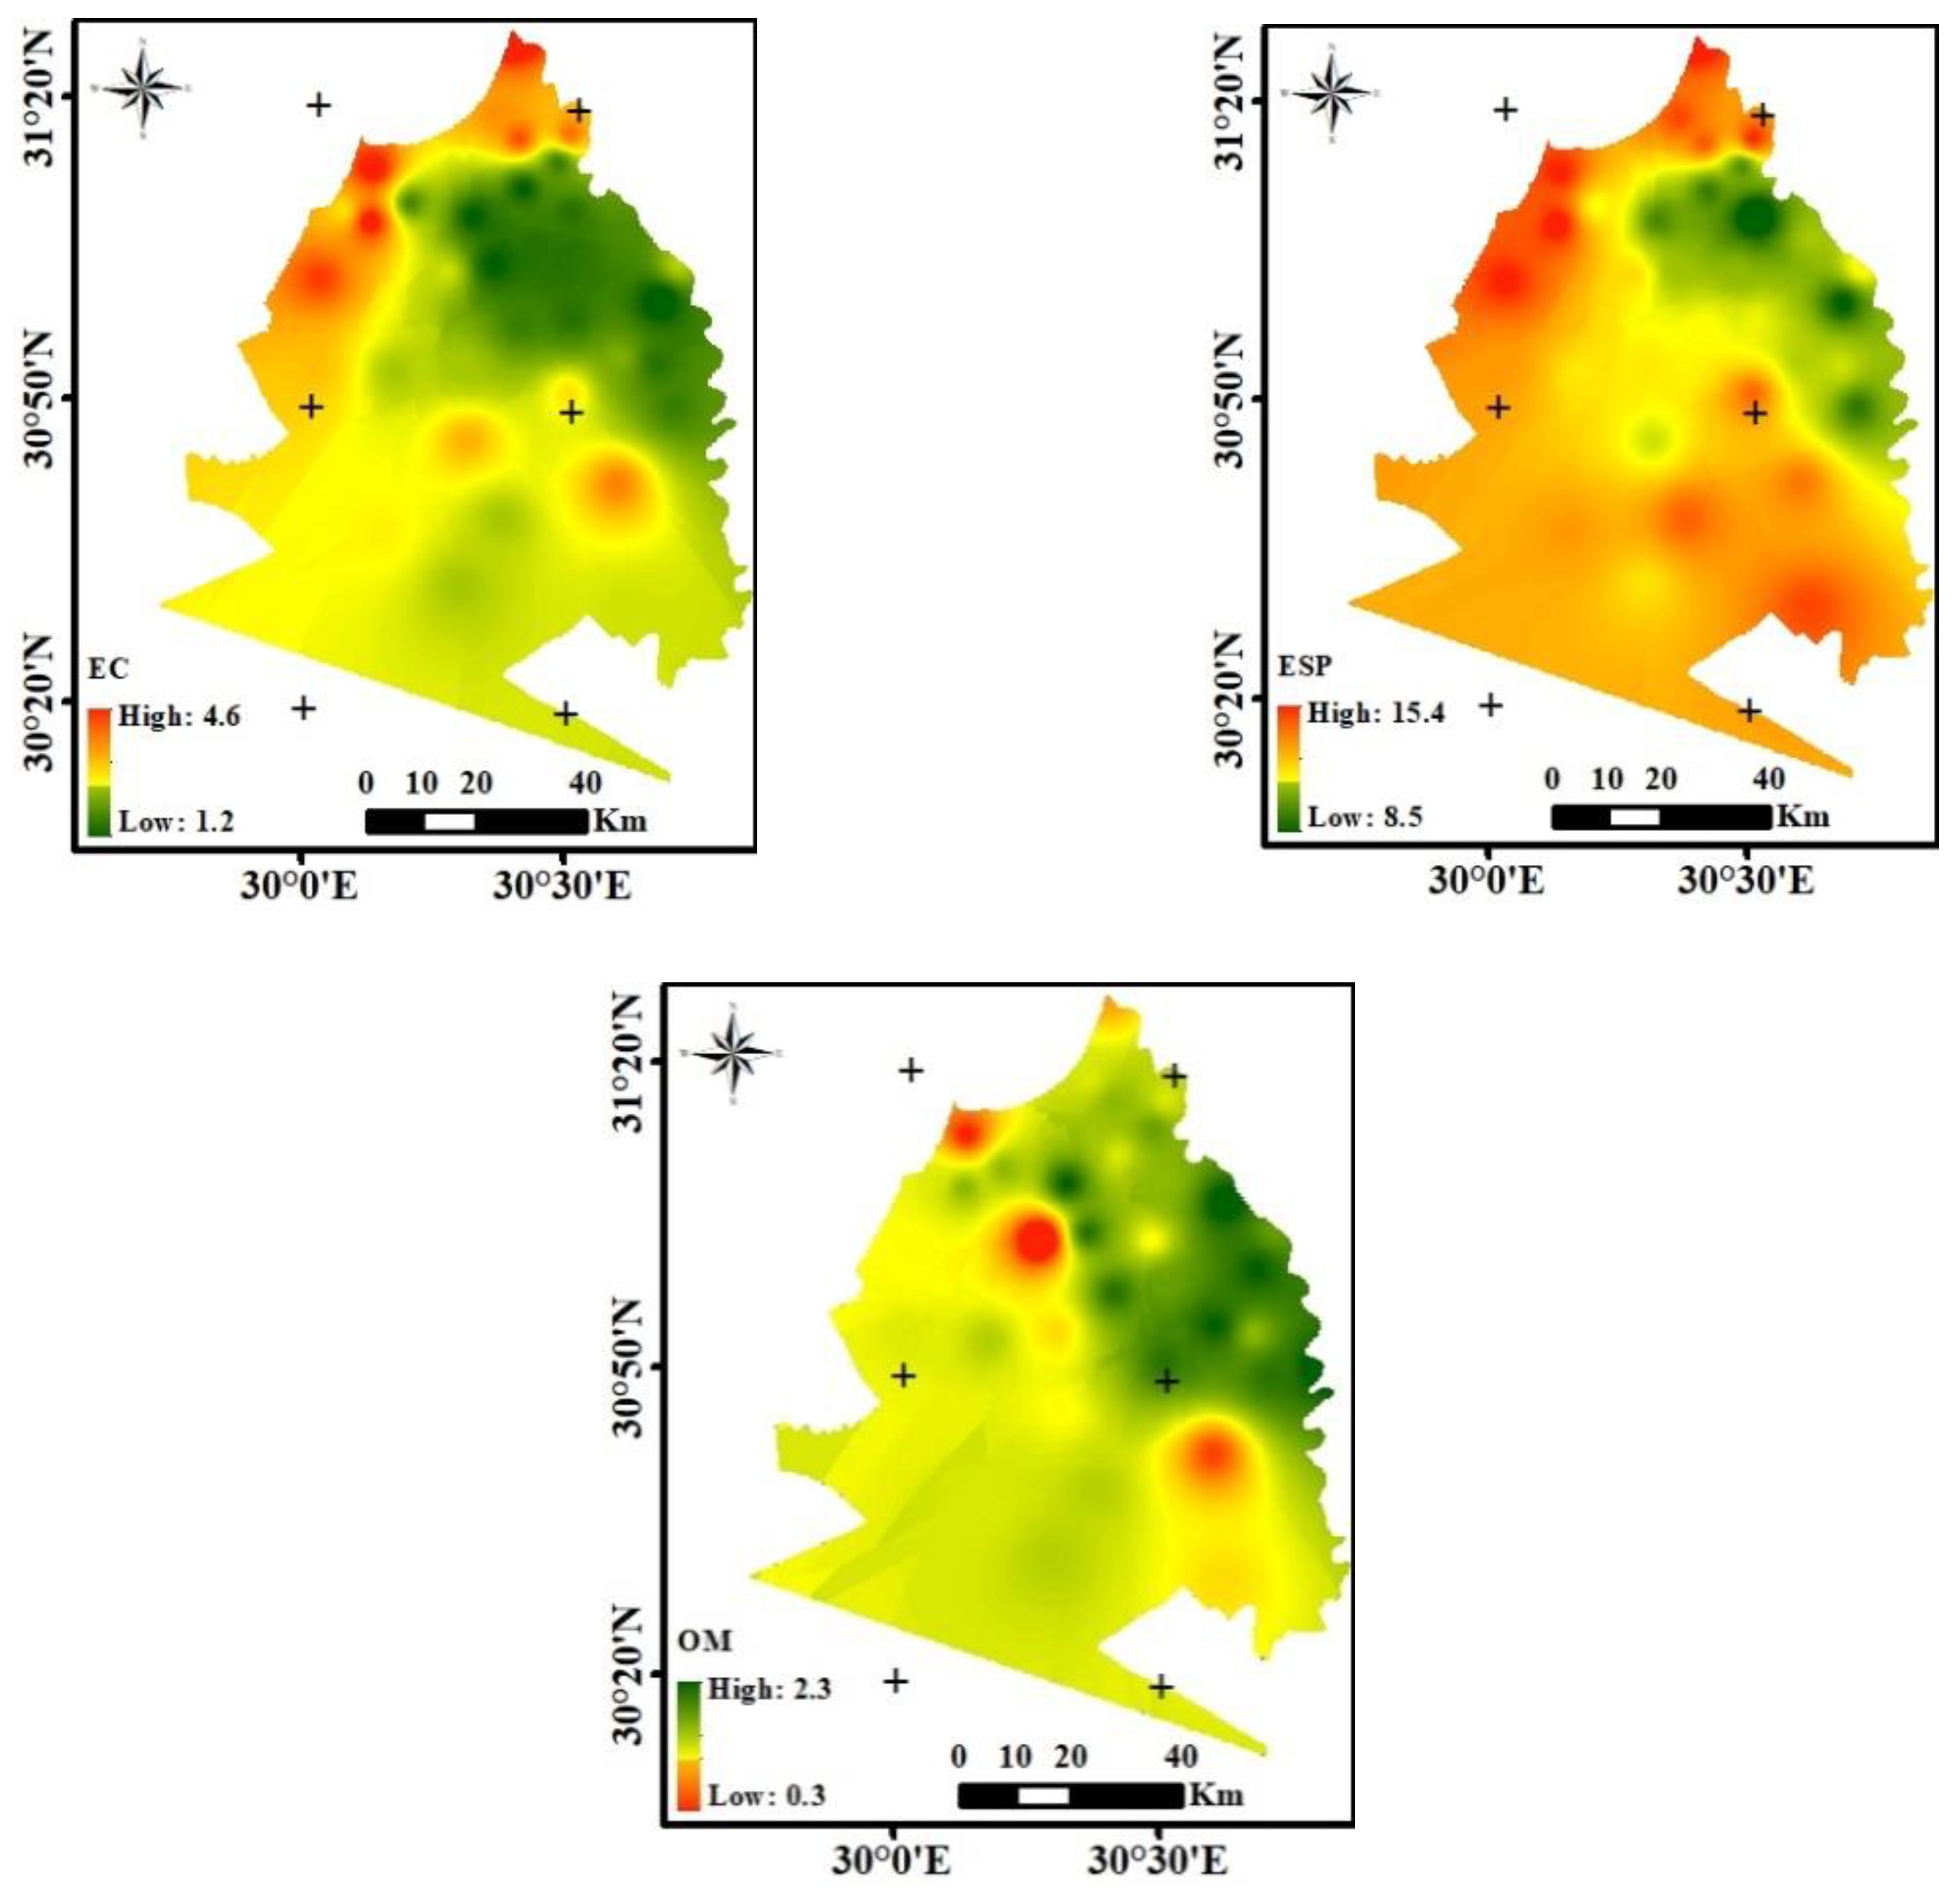
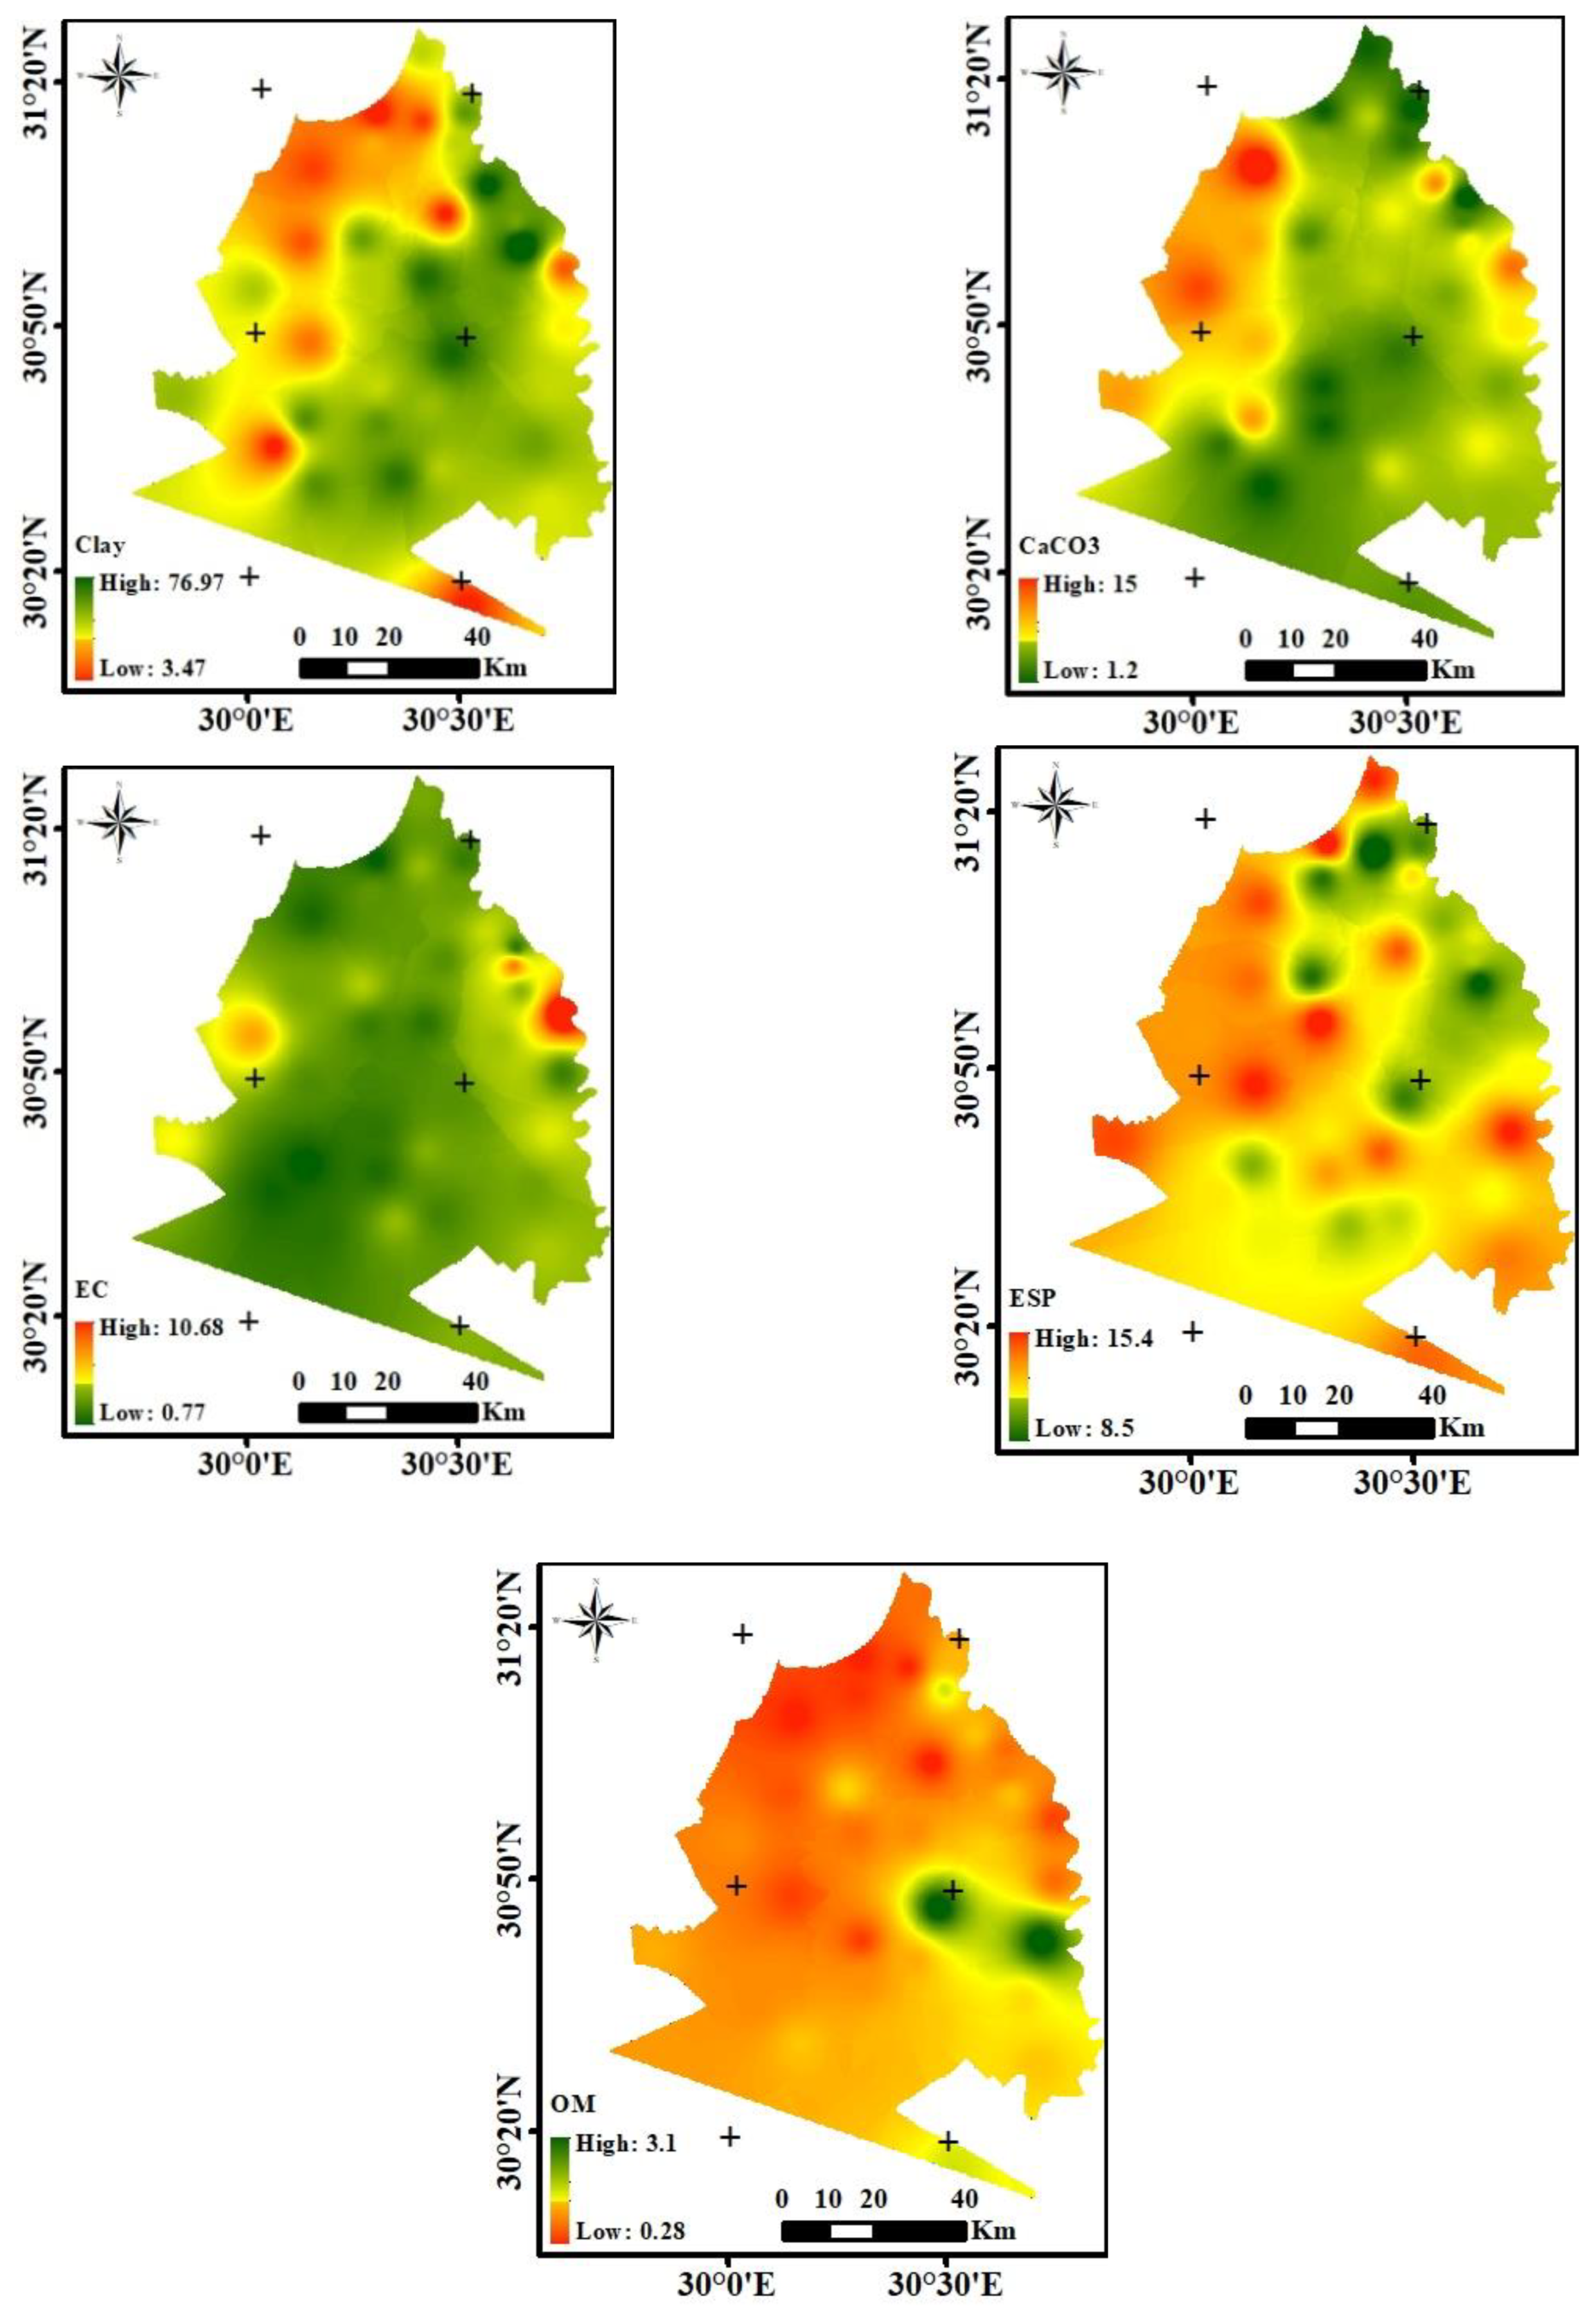
3.1. Variation of Soils Physical Properties

The results show significant variability across different soils (Table 2, Table 3 and Table 4). The beating index (BI) shows that, with the exception of which has very flappy soils (BI > 1.8%), all old alluvial plain soils are non-beating (i.e., BI < 1.4), therefore, have a beating crust on their surface, thus increasing the cohesion of the soil and therefore its resistance to detachment. In theory, the beating crust should reduce the rate of erosion. However, even if it increases the soil’s resistance to detachment, it greatly decreases the rate of water infiltration and increases the rate of runoff.
The beating crust of its soils may exhibit mechanical resistance to root growth and stem expansion. It thus creates anaerobic conditions for the roots [41]. This beating crust is due to the significant presence of the clay fraction in the soil. Soils with the shoreline showed a high risk of structural degradation (5% < SSI < 7%) due to the lower organic matter content in these soils and a high clay content [42]. The rest of the soil groups show soils with a stable structure. Soils with a high risk of structural degradability have a high fertility probability of erodibility [43]. They reduce the rate of water infiltration, which determines the availability of water for plants, unlike soils with a stable structure that facilitates water infiltration. Soils rich in organic matter have physical phases favorable to plant development [42,43] because organic matter plays a physical role in the soil cohesion, structure, porosity, water retention or storage. All the soils in the study area have a neutral pH range than 6.8 to 8.4. The pH is a key element of the chemical composition of the soil and determines the availability of nutrients for plants and soil microorganisms [44].

3.2. Variation of Chemical Properties in Soil Groups

Chemically, except for south part soils which show the fertility index (FI) below 1.5 due to the low exchangeable base rates in their soils, the rest of the soil groups have an average IF above 1.5; this suggests that these soils have a good reserve of exchangeable bases and therefore good chemical fertility [45]. The CEC is a relative indicator of the fertility power of soil [46]. According to Chapman [47], CEC depends on the organic matter and clay content of the soil. Soils with a high CEC can retain more cations and has a high capacity to exchange them. This soil has a high CEC (39.47 ± 3.68 meq/100 g), this would be due to its very high clay content (77 ± 3.48%) and high organic matter rate (3.1 ± 0.49%). The presence of organic matter in soil significantly increases CEC in soil (e.g., 1% of OM contributes 2 meq/100 g of CEC matter to soils) [48]. Given the low presence of organic matter in the rest of the soil groups, the CEC remains average, and therefore they do not have a good ability to retain and exchange cations. This reflects a very high rate of exchangeable cations in these soils. For the rest of the soil groups, exchangeable cations are medium to high. The high level of exchangeable cations is linked to the heavy clay complex, which is rich in organic matter and therefore humus [49].
Biochemically, soils in the study area have medium to high levels of organic matter (OM) in soils. This justifies the richness of these soils’ nutrients [50,51]. As clay and organic matter are the basis of the areas with heavy clay, their deficiency would largely contribute to the degradation of the fertility of these soils [51,52]. Nitrogen levels range from low to medium in all soils. The C/N mineralization rate is greater than 20 for all soils. This reflects a very low rate of mineralization caused by the low total nitrogen content. Mineralization is slow in this soil group and allows only a small amount of mineral nitrogen to the soil [53,54]. The P content is medium in young and old alluvial plains and low in all other soils. This reflects a rate not high enough to ensure proper nutrition of the plant [46]. Phosphorus deficiency in these soils is influenced by the high fixing power of soils due to the presence of iron oxides and hydroxides [55,56].
There is a correlation between the fertility indicators and the physicochemical parameters of the studied soil samples. The partial components (OM, C/N, pH, N, Mg, CEC, Ca, K) show the affinity between chemical characteristics of the soil ranges between 26 and 42%. These variables are positively correlated with the soil fertility components. The variables (exchangeable cations, Ca2+, Mg2+, K+, P, total N, pH, CEC) are closely correlated, with a positive coordinate, while the variables C/N ratio and OM are very closely correlated.
Agronomically, the physical-chemical properties that control the fertility of alluvial soils are C/N, pH, Ca, CEC, MO, Mg, and P. Almost similar results for soil fertility indicators have been obtained by [54,55,56,57]. Organic restitutions through long-term fallows restore fertility soils depleted by several years of successive cropping [56,57,58].
According to the FAO textural diagram, the area soils are grouped into two categories:
  • Soils with a clay texture; poorly permeable and poorly aerated, preventing the smooth penetration of roots and soil micro-organisms. However, high clay contents in soils condition the fixation of the mineral elements of the adsorption complex [59,60,61,62,63].
  • Balanced textured soils; very suitable for development because they are very permeable and easy to work [64,64] and are therefore ideal for growing maize and rice [65]. Soils with balanced textures are excellent and suitable for most crops [57,66,67,68].
The calculation of the equilibrium of the cationic balance (Ca/Mg/K) shows that these soils are close to the optimal equilibrium. This testifies to a balance in absorption and good assimilation by the roots of plants [69,70] while the remaining soils show deficits in potassium and magnesium. This means that the texture complex is essentially dominated by calcium. This richness of the texture in calcium may explain the low pH of these soil groups [59].
This binary fertility diagram or N-pH diagram from [45] divides the soils of El-Beheira and its surroundings into two fertility classes: soils with poor fertility and soils with medium fertility. The limitation of the soils with poor fertility, and medium fertility is due to pH levels between 6.8 and 7.3. They are characterized by low to medium reserves in exchangeable bases and medium to high exchangeable base reserves.
The Dabin [36] K/Mg diagram shows that all soils in the study area are above the potassium and magnesium deficiency thresholds. For the most part, they have a good K-Mg balance (1 < Mg/K < 4). This reflects a nutritional balance between Mg and K. This reflects an excess of assimilation of Mg in the soil by the roots of plants, compared to K. There is an excess of assimilation of K by plants, compared to Mg. Too high a K/Mg ratio in light soils causes magnesium deficiency and therefore decreases yields, while in clay soils, too low a K+/Mg2+ ratio slows down the rate of potassium uptake, thus limiting yields [57].
According to this Ca/Mg binary diagram, all alluvial soils and their surroundings are above the magnesium (Mg = 0.3 meq/100 g) and calcium (Ca = 1 meq/100 g) deficiency and deficiency thresholds. According to the work of [54,71], the decrease in calcium and magnesium in a nutrient solution would be due to the increase in potassium contents. The south-western part has a deficiency of Mg compared to Ca (Ca/Mg > 5) therefore a nutritional imbalance which indicates an excess of Ca in the soil compared to Mg. The rest of the soils in the study area have a perfect Ca-Mg (1 < Ca/Mg < 5) balance. This means that these soils are satisfactory and reflect a nutritional balance between Ca and Mg [72,73].
The balance between the saturation rate and pH makes it possible to highlight the influence of pH on the evolution of exchangeable bases in the soil. It was obvious in the soils with a good saturation rate (CEC > 50%). This reflects a low level of pH in these soils. Soils with an average saturation rate are located within the sure line and east and southern parts. This means that these soils are moderately (6.8 < pH < 8) with medium exchangeable cation contents. The pH values showing moderately pH soils are a limiting factor for plant nutrition [73,74,75,76].

3.3. Criteria for Assessing the Fertility of Soils

The statistical analysis of the fertility parameters as well as the balances between these parameters made it possible to assess the current fertility status (Table 5, Figure 5) of the soils. Then, they were grouped into fertility classes according to [61] modified by [36,45]. This made it possible to define four levels of fertility of soils.
According to the soil fertility assessment (Table 5), four soil fertility classes can be differentiated. Class (I) include groups together soils with a good level of fertility such as Vertic Torrifluvents. They present medium limitations in pH and phosphorus. This means that these soils necessarily need the addition of CaO in order to be improved. Class (II includes soils with a medium level of fertility, such as Typic Torrifluvents. These soils have medium limitations in FI, pH, CEC, and moderate limitations in phosphorus. It is necessary to provide these soils with agricultural inputs rich in phosphate fertilizer, without forgetting the practice of fallowing for a long period of time in order to allow a reconstitution of the soil properties. Class (III), which includes soils with a poor level of fertility, such as Typic Haplocalcids, Typic Calcigypsids, Typic Haplogypsids, Typic Quartizipsamments. They present severe to very severe limitations in FI, SSI, BI, pH, CEC, and medium to severe limitations in P. This means that these soils need organic fertilizer inputs to repair the seemingly very poor physical properties in order to facilitate good soil aeration and sufficient retention of infiltration water. The practice of fallowing for a long period of time is essential for the good fertility of these soils. Lime is important to improve the acidity of these soils, which present high toxicity risks. A calcium amendment would favor the availability of P and Mg to the plant, which would facilitate the installation of the roots. Class (IV) groups together soils with a good level of fertility, such as Typic Torripsamments, rock escarpment (Calcic petrocalcids), and rock land (Typic petrocalcids). They present severe limitations in nutrient depletions. This means that these soils necessarily need the addition of all fertilizers depending on the crop requirements in order to be improved.

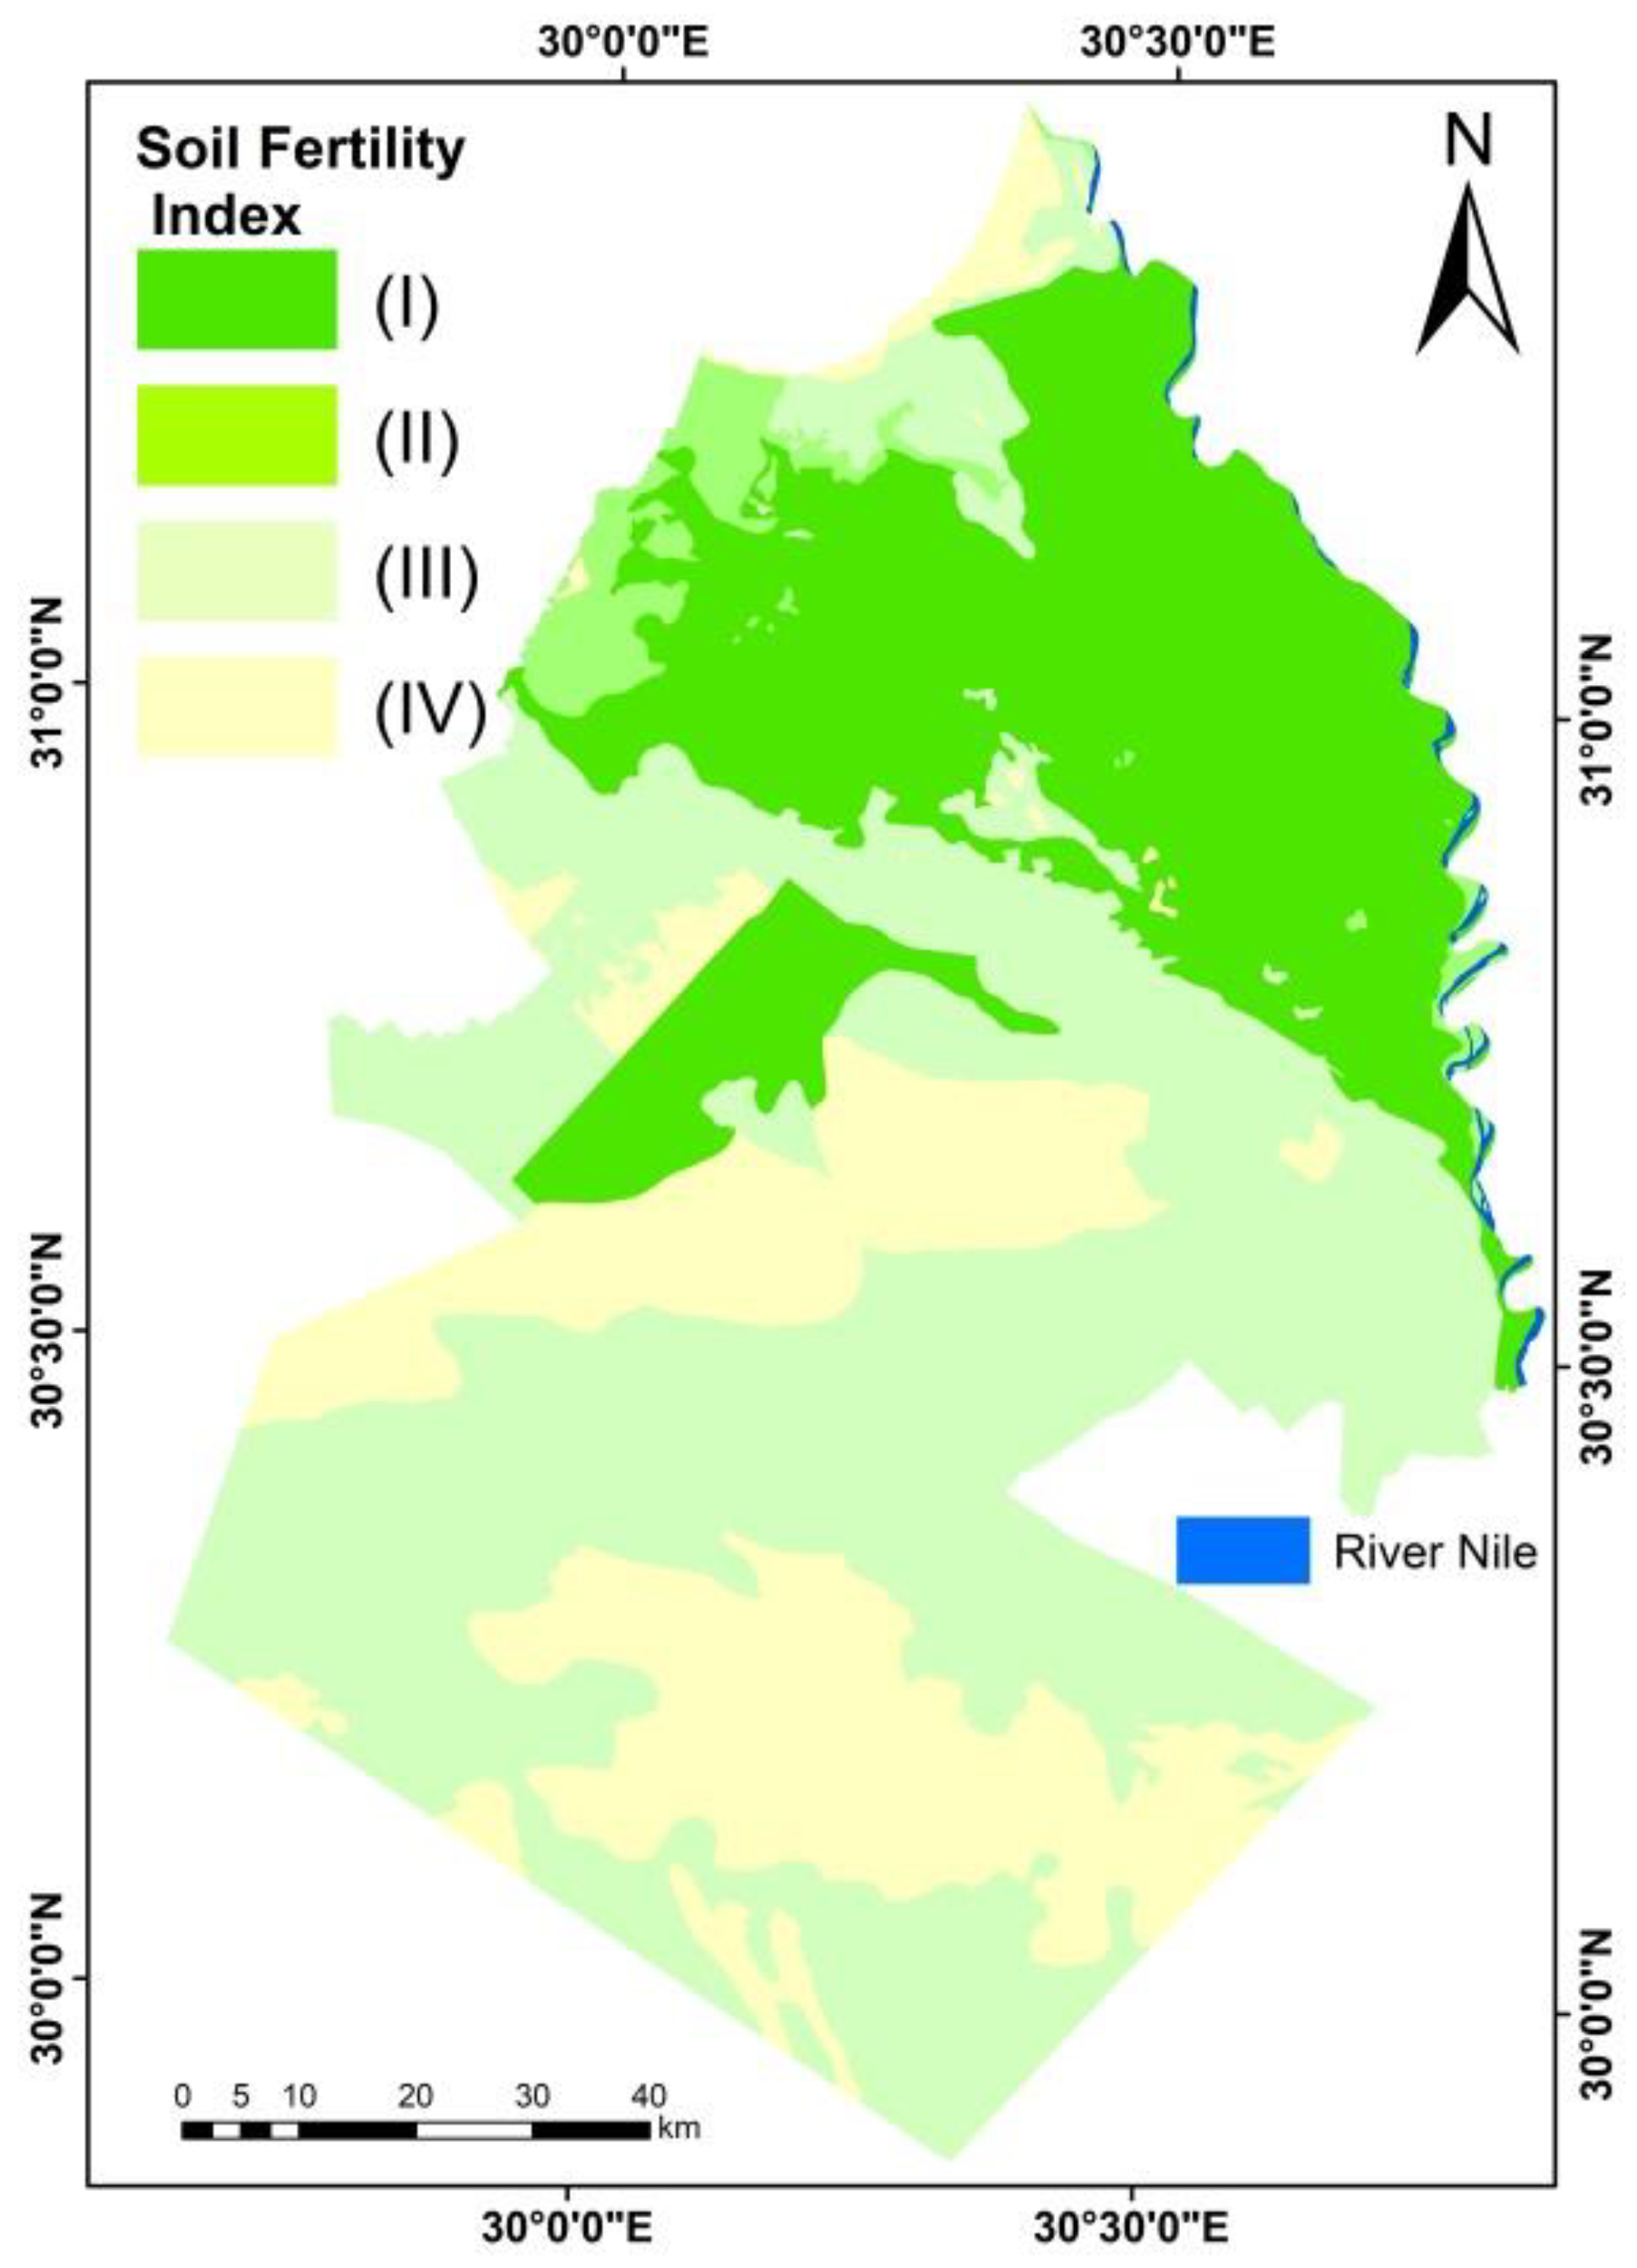
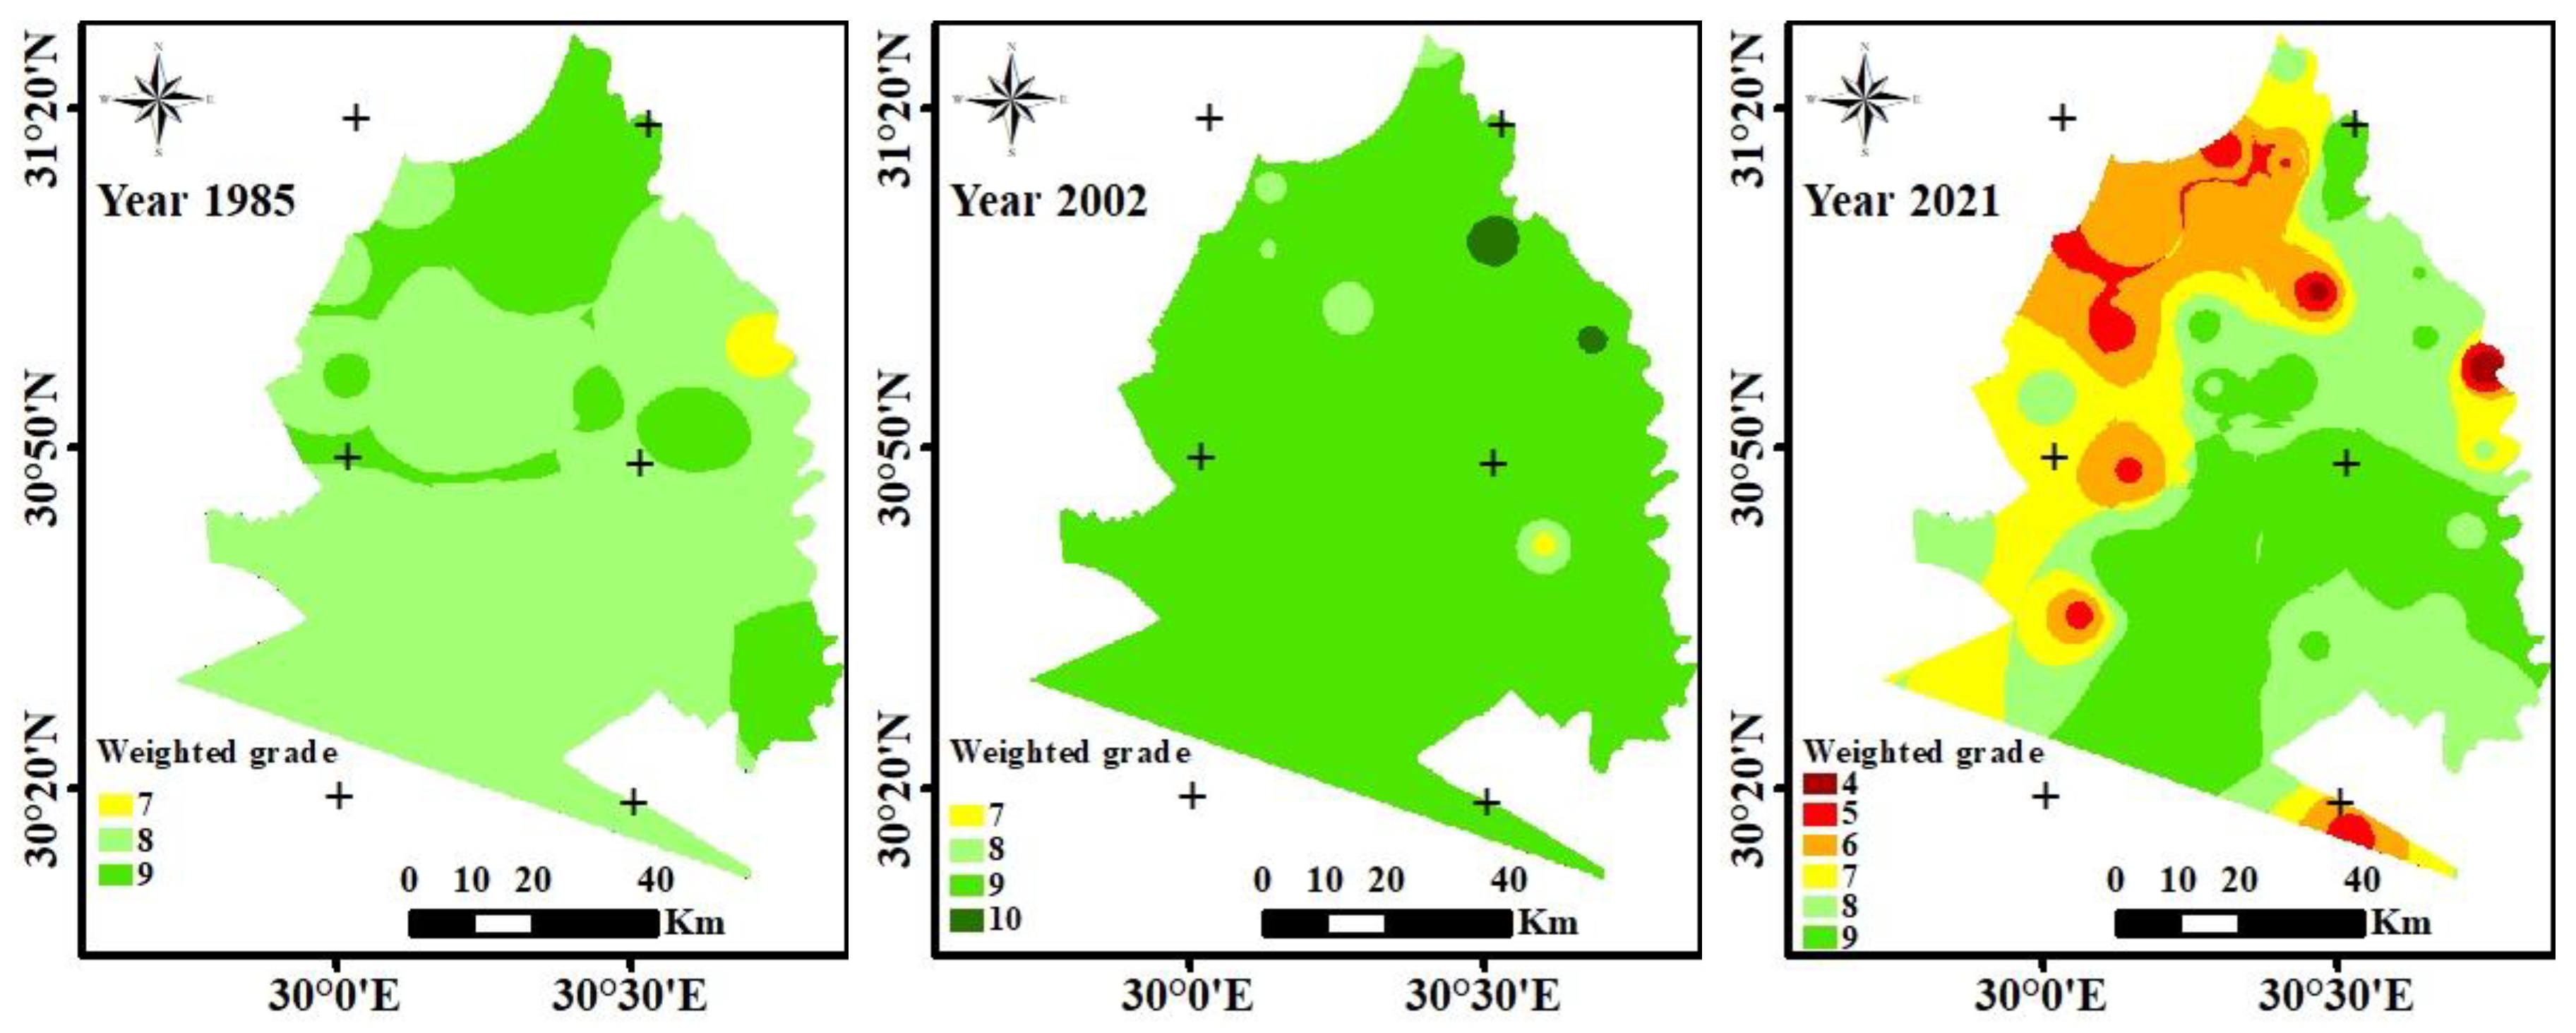
3.4. Spatial Distribution of Fertility of El-Beheira Soils

The soil fertility spatial distribution map (Figure 5) shows that poorly fertile soils are located north (surrounding the Idku lake, costal area and west and south of the study area). They cover 57% of the study area. Average fertility soils are located to the west of the study area. They cover 7% of the study area. Soils with good fertility spread over the entire study area. They cover 66.65% of the study area or an area of about 39% of the total area.

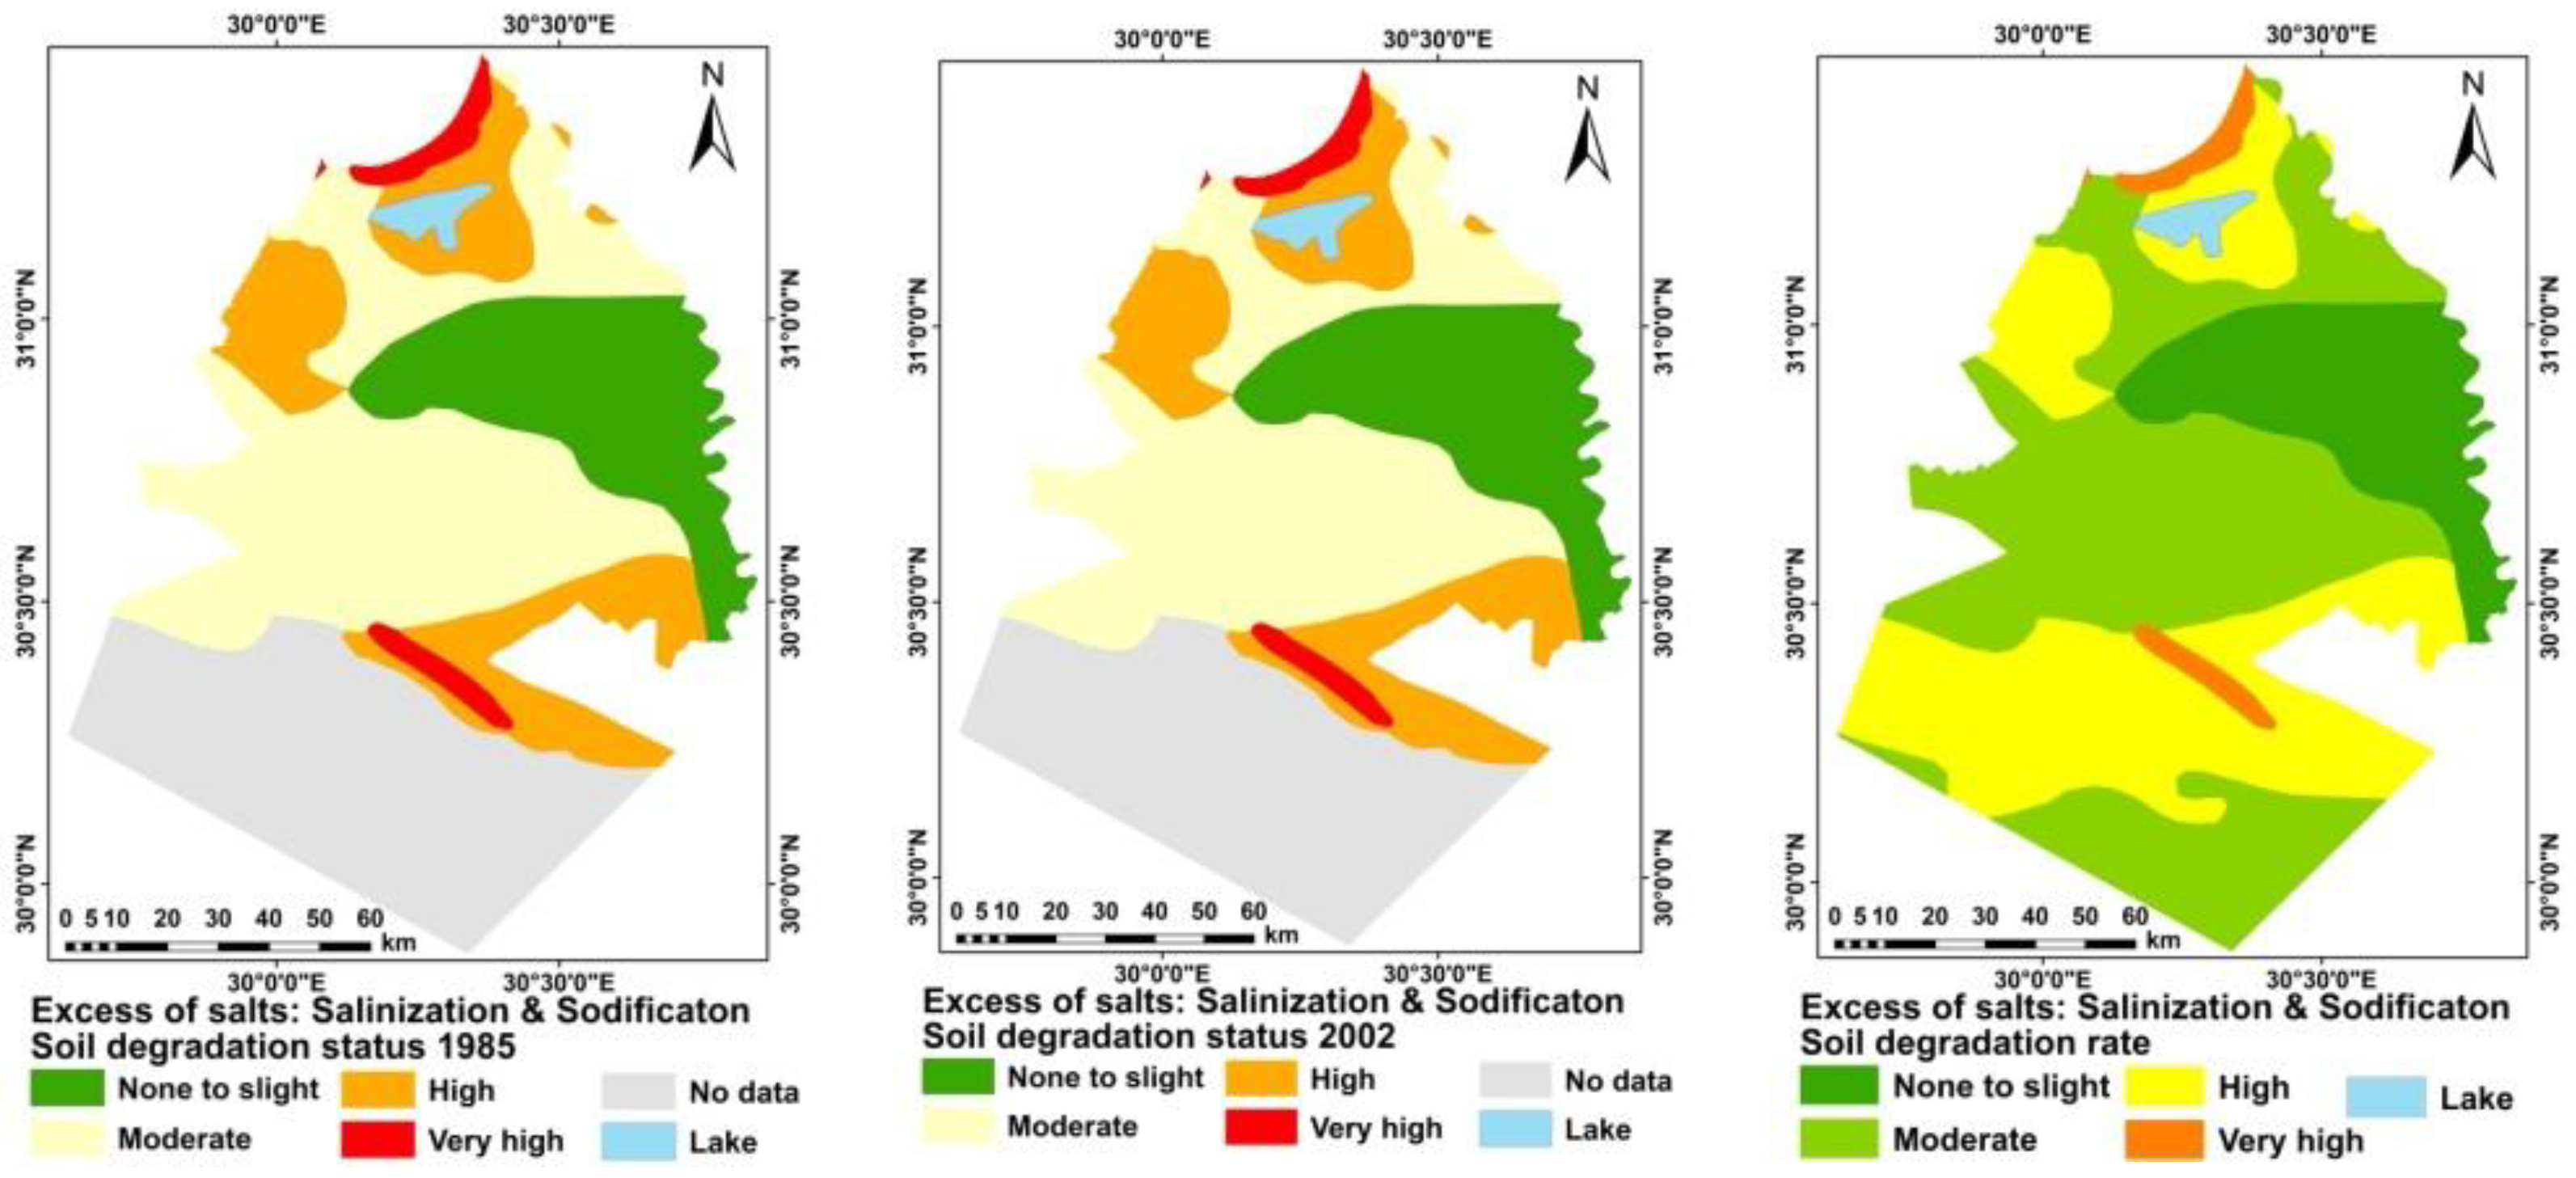
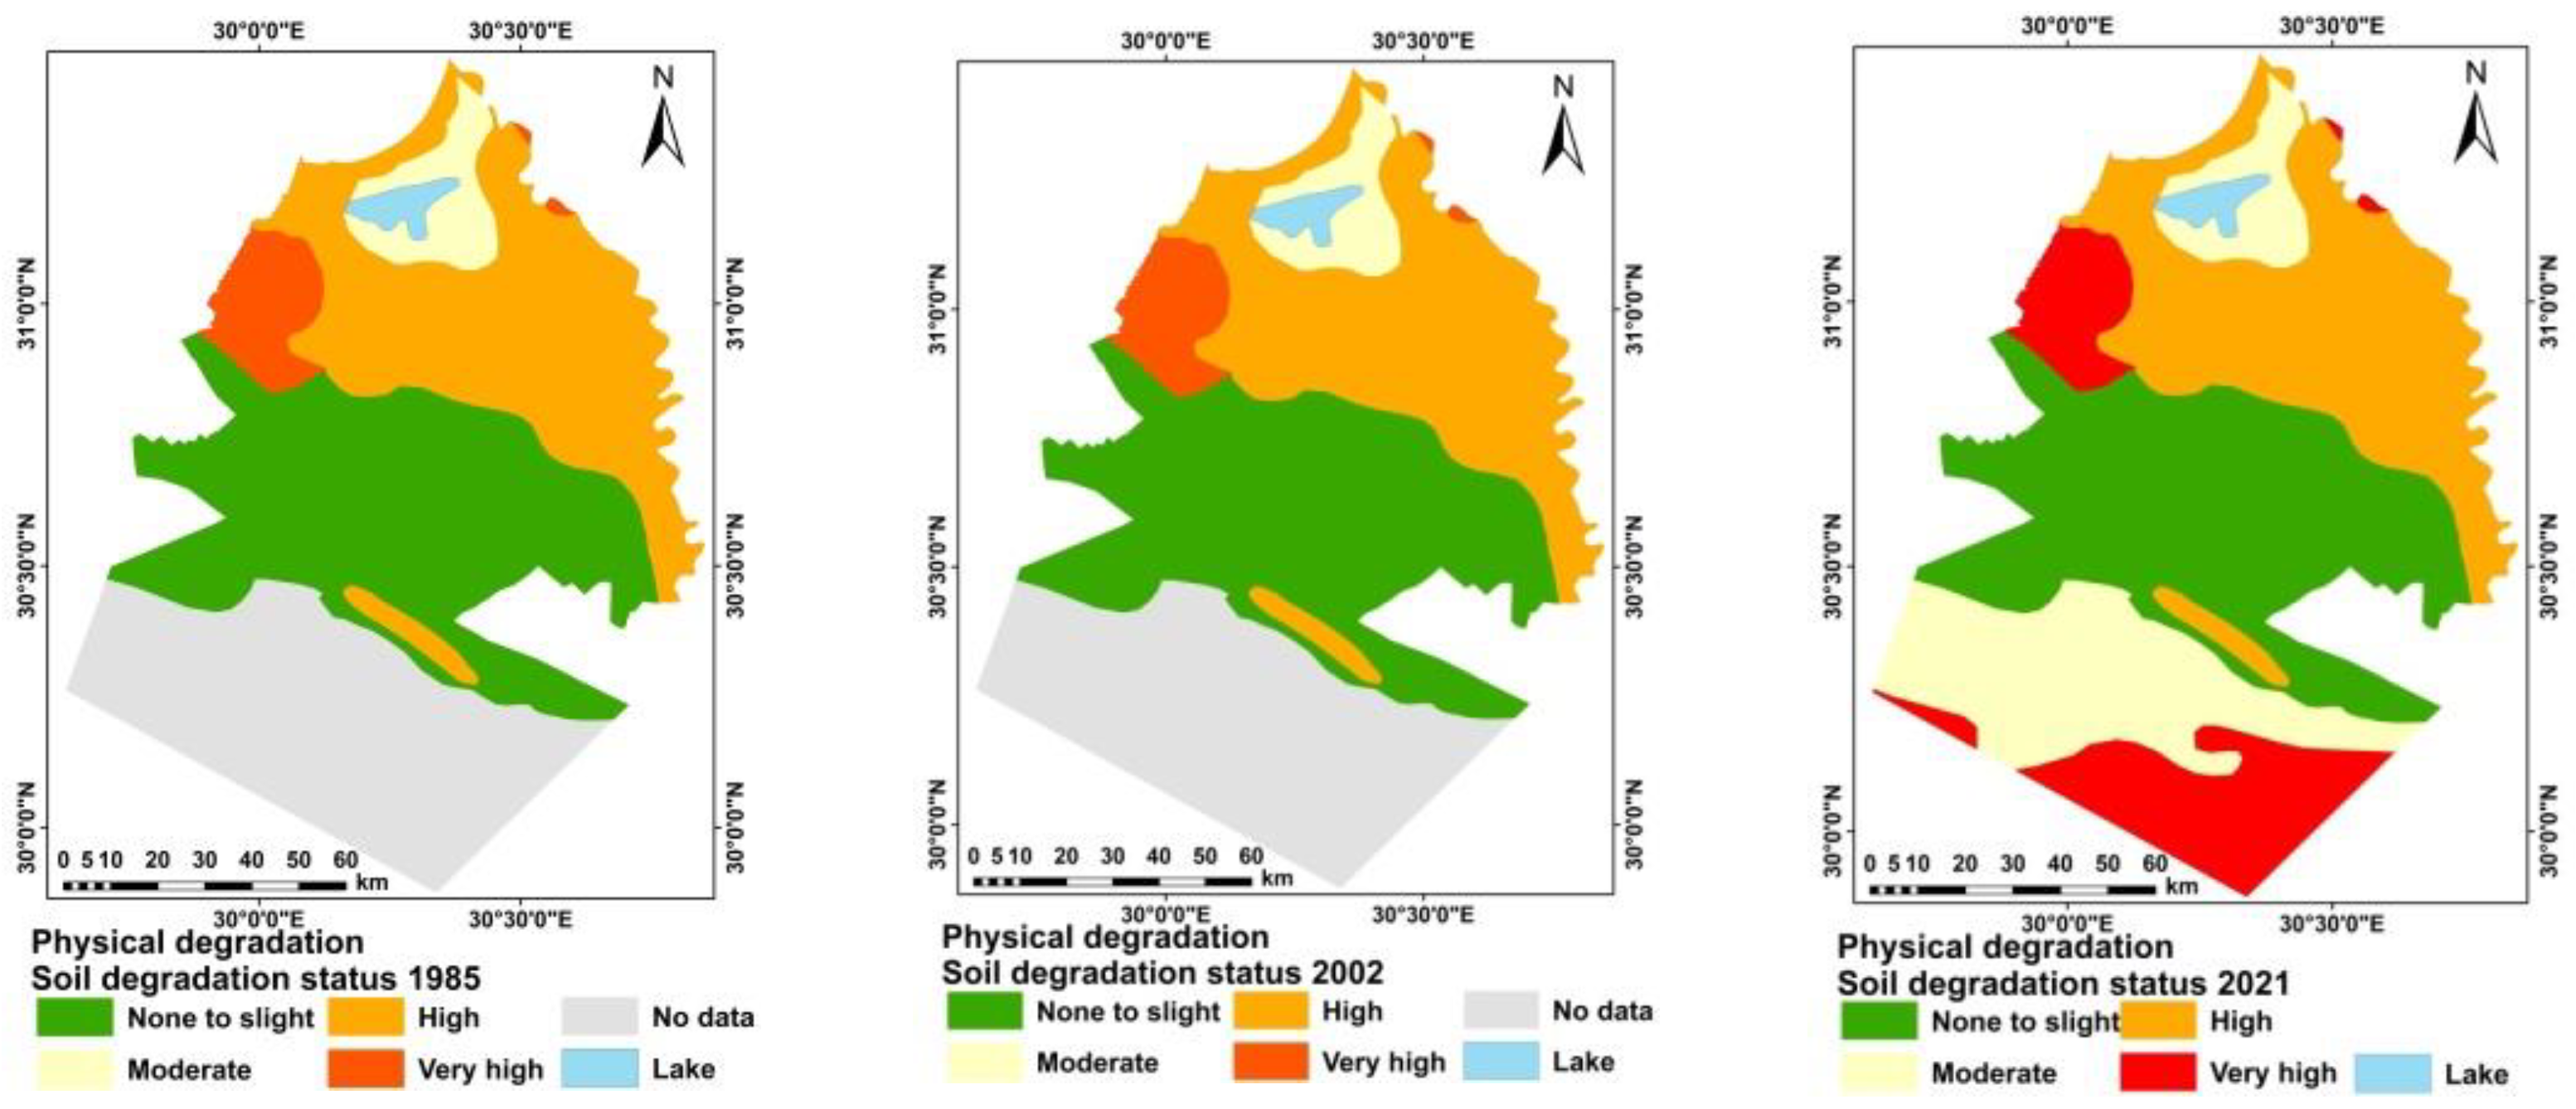
3.5. Quantitative Assessment of Land Degradation

From Table 6 and Figure 6, Figure 7 and Figure 8 soil quality degradation is one of the main causes of land degradation. Soil can be severely degraded due to compaction, salinization and sodification, and the use of chemical fertilizers that prevent the land from regenerating, and soil quality also declines as a result of chemical fertilizers for agriculture, increasing the pollution of water and land and thus reducing the value of the land.
From Figure 9, the nature of the land covers changed as the result of changes in the environmental conditions between 1985 and 2021. These changes in the physiochemical properties lead to the deterioration of land areas and vegetation cover. The changes in all features are included, i.e., water bodies, cultivated lands, wetlands, dry lands, and bare soils. The study showed that the area of water bodies was not significantly affected; inverse with the area of cultivated lands and wetlands, and its effect is directly on the area of dry and bare soils. This was directly affected by anthropogenic activities.
The estimations of degradation are made without taking the salinity and alkalinity of the groundwater into account and are based solely on the calculated climatic index. The study area is at a low to very high risk of salinization (Figure 9). Higher results for the current state and risk of degradation by salinization are a result of the soil, topography, and human activities. This emphasizes the value of good management and solid agricultural practices through effective drainage and irrigation methods. In the research area, sodification levels range from negligible to severe. Higher values are attributed to the soil, topography, and human activities for the current condition and risk of sodification degradation (Figure 10). Soil compaction risk, which is determined based on bulk density, is referred to as physical degradation risk (Figure 11). Biological degradation is calculated upon the organic matter deterioration (Figure 12).
By combining the degree and relative extents of the various degradation classes, the Arc GIS spatial model generated the quantification of total land degradation (Figure 13). More than 50% of the units have deterioration rates that range from moderate to very high. Landforms and soil degradation severity levels are found to be related. Particularly in the north and clay-covered areas, it is at high levels, although it is only experiencing mild levels of degradation in sandy soils and river terrace soils wadi deposits, however, were a severely deteriorated area.
To be successful in combating land degradation, a better awareness of its origins, effect, degree, and familiarity with climate, soil, water, land cover, and socioeconomic aspects is required. As a result, assessing land degradation is a fundamental aim of a decision support system for reversing deterioration. The study intends to use a neural network approach to measure the dynamic of land degradation in the north delta over a 50-year period. The research region is in Egypt’s north delta (El-Beheira Governorate). Spatial models for overall qualitative land deterioration were constructed in 1985, 2002, and 2021 using the Model Builder tool in ArcGIS 10.3 (spatial analyst extension) for land degradation mapping. Land degradation variables (salinization, alkalinization, compaction, lime concentration, and water logging) were collected in a raster and each data set was rated on a scale of 1 to 5 (very low, low, moderate, high, and very high scale). The data sets were then weighted based on their impact on the overall model (more weight = greater effect). From 1985 to 2021, the total degradation change for highly degraded soil grew, whereas it dropped for very highly degraded soil. However, the low deteriorated soil grew over time, at the cost of the highly degraded soils, as a result of the reclamation process and soil management.

4. Discussions

The majority of the agricultural soils in these areas are saline and have low productivity due to the predominance of soluble salts because of the dry, arid climate [77]. In addition, the use of low-quality irrigation wastewater to meet the increasing irrigation water requirements is a result of the scarcity of surface water resources [78]. This leads, under harsh climatic conditions, to an increase in the concentration of salts in the upper horizon through evaporation, especially in clay soils.
The groundwater table depths of the old agricultural lands were typically between 120 and 130 cm, which is deep, with some parts having (80 cm), which had a moderate depth level. Most soils have a high clay texture overall (45 to 68%), and some additionally have a sandy clay loam texture (40–50%). According to reports, the former reclaimed agricultural area in the north of Egypt had a deep groundwater table that ranged in depth from 100 to 150 cm and was of fine texture (clay loam to clay). Going toward the Mediterranean Sea, these soils were stated to have more clay [79]. Furthermore, it has been noted that soils in arid and semi-arid areas have a higher build-up of calcium and magnesium carbonates and sulphates and have pH values that are somewhat alkaline (7.8 to 8.6) [80]. Due to the nature of the parent material from which these soils were created and the insufficient and limited leaching, it has been observed that soils along the northwestern coast are very calcareous. Additionally, due to the limited translocation of carbonates, the predominance of the arid climatic conditions may have aided in the creation of zones or horizons. These soils, which are equivalent to fluvio-marine plain soils in the area, contain low gypsum content (0.10–1.45%), CaCO3 content (0.35–2.30%), and organic matter at the top layer that ranged between 1.11 and 2.55% [81]. The El-Beheira governorate’s reclaimed soils, which had been irrigated with drainage waters since the 1960s, were reported to have a texture that ranged from sandy, silty loam to clay, a calcium carbonate content between 2 and 20%, and very little organic matter [82]. However, it was shown that these soils’ acquired organic matter concentration was adequate for agricultural productivity despite the existing arid circumstances [82].
These old, reclaimed lands have a clay texture (30–60% clay) and a non-saline character (EC ≤ 4.0 dS m−1), which may be related to the fact that the soil is from an old flood plain [12]. Due to poor drainage, these soils have a moderate level (100 cm) and rather deep-water table [83]. There is a second stratum of sandy clay loam in this soil as well. These soils had a pH that varied from 7.2 to 8.1, and possess a sandy clay loam area with a major clayey texture (50 to 69%). The pH was in the desired range (7–8). The maximum EC value was 21.13 dS m−1, which indicates that salinity is only moderately affecting the EC range [83]. The pH of some reclaimed sandy soils west of the Nile delta and calcareous soils inside El-Beheira Governorate lands was alkaline (7.5 to 8.5), according to other studies [78,79,80,82,83,84,85].
As a result, the parent material from which some of these soils are generated may be to blame for the alkaline soil pH of these lower soil layers [83,85,86,87]. Old reclaimed agricultural areas may have EC values as high as 15 dS m−1 [83,86]. Additionally, fluvio-marine plain soils were said to have an EC varying from 2.24 to 25.09 dS m−1 to the north of Egypt [81]. These values were comparable to the EC of flood plains (clayey agricultural soils) to the north of the delta, where salinity ranged from 1.6 to 20.5 dS m−1 [88]. Overall, some soils’ lower levels showed a noticeable rise in salt. The upward migration of salts from lower strata during dry periods, during irrigation intervals, and during the period without irrigation at the end of the season may explain this occurrence [87]. The loss of moisture from the top layers through evaporation and, in some regions, the capillary rise of salty fluids from the shallow water table may also be contributing factors to the increase in soil salinity values [87].
The majority of coastal lands were clayey (25–57%), with sandy clay loam everywhere. Salinity (EC 4.0 dS m−1) affects coastal soils [13]. These soils’ pH varies from the top layer to the lower level, with the top layer having a small area of near neutrality (pH = 7.5). However, the majority of the land was found to have an alkaline pH, with a value of 8.81 from 60 to 80 cm. This range is found naturally in reclaimed desert soil that had an alkaline (pH) throughout its layers and profile, and these results are consistent with other research [83,87] that claimed coastal region soils and recently reclaimed soils have a pH range of 7.9–8.5. Furthermore, according to [87], soils from recovered lakes had a pH that was slightly alkaline (8.0–8.31). However, it has been claimed that a soil pH above 8.70 indicates that CaCO3 predominates and that MgCO3 or Na2CO3 is present in these soils [89]. From another angle, the inflow of lake water at these soils may be the cause of this pH increase [87]. Some of these soils have increased salinity, which may be the result of poor drainage, seepage from low-quality lake water, or intrusion of seawater [81]. Overall, higher EC values were demonstrated, possibly as a result of the limited permeability of the clayey soils next to the lake [87]. Higher EC values for the top layer of these soils may be a sign of seawater intrusion causing waterlogging [79,87]. However, it was noted that the arid natural regions to the north of Egypt had soil salinities that varied from 6.5 to 31 dS m−1 [88]. Additionally, some recently recovered alluvial/marine soils near northern lakes may have EC values as high as 30 dS m−1 [83]. The prolonged exposure of these soils to lake seawater may be to blame for the rise in soil salinity. In addition, the lake is shallow, with a depth range of 10 to 90 cm, with the eastern and central portions of the lake having the deepest depths reported [90]. Furthermore, it has been noted that a shallow saline water table can cause salt to flow through the soil by capillary rise and evapotranspiration [78,79,80,81,82,83,84,85,86,87,88,89,90,91,92,93,94,95,96]. This can result in salt buildup on the surface of the soil. Additionally, the high groundwater table may be a contributing factor to the limited leaching capacity and salinity of these soils [79,80,81,82,83,84,85,86,87]. Furthermore, it was claimed that elevated Mg2+ concentrations indicated that these soils were primarily of marine origin [89].
ESP ranges between 6.3 and 10.5%, cation exchange capacity is rather low as it ranges between 2.4 to 6.8 meq/100 g soils, and the available nitrogen, phosphorous, and potassium are ranges from 0.3 to 0.7, 0.9 to 1.6, and 5.8 to 9.3 ppm, respectively. In the southern part of the study area, the soil texture is sandy, with profile depths ranging from 60 to 120 cm. The findings show that the aeolian plain (sand ripples of varied elevations and almost flat to undulating sand sheets), table land (almost flat and gradually slope areas), and old deltaic plain are the primary physiographic units in the examined area (sequence of old river terraces) [91,92,94].
Soil erosion is also a major threat for soil degradation that directly affects biodiversity [97,98]. Soil erosion occurs slowly in a discontinuous process in small parts of the northern region (coastal and lacustrine deposits) by precipitation, while wind erosion occurs at the same rate in the southern part of the region (aeolian and wadi deposits). Although the erosion process is not at an alarming rate (non to slight), it does lead to the loss of topsoil and ecological degradation.
The study area is classified into five agro-pedo-ecological zones (SQ1, SQ2, SQ3, SQ4, and SQ5) as shown in Figure 14. Qs1 (alluvial deposits) areas produce mainly rice, cotton and wheat, but water shortages and soil degradation have undermined agriculture in the region. The nature of rice cultivation, which consumes large amounts of water, helps to improve the quality of the land by ridding the soil of the salts in it. The study area is already experiencing a water crisis; given the existing environmental problems, water scarcity imposes limits on the economic development. The area is characterized by high land quality and soil fertility, despite the problems of deterioration in it, such as salinization, compaction, and waterlogging.
SQ2 (aeolian deposits) would increase the cultivated area, especially since the types of lands there are good, the fertility rate and their quality are moderate, and there are all kinds of crops such as wheat, corn, vegetables, and fruits. There is an area 50–70 cm away from a mud flat, that was an historic passage for the Nile River that helped to develop agriculture in the area, resulting in a high quality of crops.
SQ3 (lacustrine deposits) and SQ4 (costal deposits); the most important problems inherent in these two areas are salinity, alkalinity, and soil waterlogging, and only salinity-tolerant plants such as rice are present in them. Sabkha is a morphological feature in the area along with salt crust on soil surface.
SQ5 (wadi deposits); lands are marginal, in addition to the exposure of the roots by the effect of the wind on the crops. It also has wetlands, where groundwater resides from the surface of the soil, impeding the growth of plants
Since landform is a key component of soil formation and a soil mapping criterion [94], it is practical to employ landform when arranging soil data. Geomorphology enhanced the results and enabled us to employ computer-assisted techniques by combining them with satellite data, field observations, and geomorphology. The ever-growing availability of earth observation data and the well-established use of GIS lead to the development of automated workflows and toolboxes for environmental management [99,100,101].

5. Conclusions

A considerable amount of the Nile Delta’s northern region is degraded physically and excessively by salts. Additionally, the processes of salinization, sodification, and soil compaction range from extremely low to very high in various soil units. The objective of this study was to assess the soil fertility of the northern half of the El-Beheira Governorate based on physical-chemical properties and fertility parameters. The data obtained in the laboratory were processed by the statistical method using the SPSS software and it appears that soils have four fertility classes: the class of soils with good fertility with an area of about 39%; the class of soils with average fertility with an area of about 7% and the classes of soils with poor fertility (class III + IV) with an area of about 54%. Principal component analysis (PCA) has revealed that the parameters that control fertility in Foumban soils are: C/N, pH, Ca, CEC, MO, P, and Mg. The fertility assessment makes it possible to understand that the major problem of the soils in the study area is the risk of high acidity and phosphorus. To overcome this major problem, it would be wise for farmers to use lime (CaO) to reduce the risk of toxicity overall, and to use calcium fertilizers that would promote the availability of P and Mg to plants. Soils with medium and poor fertility have a poor physical phase. An amendment of these soils with organic fertilizer (fluent, compost, manure) would facilitate the formation of the clay-humic complex, thus allowing good retention of water in the soil. Finally, an amendment in mineral fertilizer would correct the CEC and would bring a high rate of exchangeable cations to the soils, thus increasing the sum of the bases. We recommend a detailed study for each agro-pedo-ecological zone, for better management planning to protect the soils from continuous deteriorations.

Author Contributions

Conceptualization, M.A.E.A., M.M.M., A.A.A., P.D. and A.S.; methodology, M.A.E.A., M.M.M., A.A.A., P.D. and A.S.; software, M.A.E.A., M.M.M., A.A.A., P.D. and A.S.; validation, M.A.E.A., M.M.M., A.A.A., P.D. and A.S.; formal analysis, M.A.E.A., M.M.M. and A.A.A.; investigation, M.A.E.A., M.M.M. and A.A.A.; resources, M.A.E.A., M.M.M. and A.A.A.; data curation, M.A.E.A., M.M.M. and A.S.; writing—original draft preparation, M.A.E.A., M.M.M., A.A.A., P.D. and A.S.; writing—review and editing, M.A.E.A., M.M.M., A.A.A., P.D. and A.S.; visualization, M.A.E.A.; supervision, M.A.E.A., M.M.M., A.A.A. and A.S.; project administration, M.A.E.A., M.M.M. and A.A.A.; funding acquisition, M.A.E.A., M.M.M., A.A.A., P.D. and A.S. All authors have read and agreed to the published version of the manuscript.

Funding

This research received no external funding.

Institutional Review Board Statement

Not applicable.

Informed Consent Statement

Not applicable.

Data Availability Statement

Not applicable.

Acknowledgments

The manuscript presents a participation between the scientific institutions in two countries (Egypt and Italy), and in particular, the authors are grateful for their support in carrying out the work to: (1) National Authority for Remote Sensing and Space Sciences (NARSS), Cairo 11769, Egypt. (2) National Research Centre, Giza 12622, Egypt. ((3) SAFE-Università degli Studi della Basilicata.

Conflicts of Interest

The authors declare no conflict of interest.

References

  1. Alfiky, A.; Kaule, G.; Salheen, M. Agricultural Fragmentation of the Nile Delta; A Modeling Approach to Measuring Agricultural Land Deterioration in Egyptian Nile Delta. Proced. Environ. Sci. 2012, 14, 79–97. [Google Scholar] [CrossRef] [Green Version]
  2. Zhao, X.; Liu, Y.; Thomas, I.; Salem, A.; Wang, Y.; Alassal, S.E.; Jiang, F.; Sun, Q.; Chen, J.; Finlayson, B.; et al. Herding then farming in the Nile Delta. Commun. Earth Environ. 2022, 3, 88. [Google Scholar] [CrossRef]
  3. Fishar, M.R. Nile Delta (Egypt). In The Wetland Book: II: Distribution, Description, and Conservation; Finlayson, C.M., Milton, G.R., Prentice, R.C., Davidson, N.C., Eds.; Springer: Dordrecht, The Netherlands, 2018; pp. 1251–1260. [Google Scholar]
  4. AbdelRahman, M.A.E.; Natarajan, A.; Srinivasamurty, C.A.; Hegde, R. Estimating soil fertility status in physically degraded land using GIS and remote sensing techniques in Chamarajanagar district, Karnataka, India. Egypt. J. Remote Sens. Space Sci. 2016, 19, 95–108. [Google Scholar] [CrossRef] [Green Version]
  5. Schoonover, J.E.; Crim, J.F. An Introduction to Soil Concepts and the Role of Soils in Watershed Management. J. Contemp. Water Res. Educ. 2015, 154, 21–47. [Google Scholar] [CrossRef]
  6. Ogura, T.; Date, Y.; Masukujane, M.; Coetzee, T.; Akashi, A.; Kikuchi, J. Improvement of physical, chemical and biological properties of aridisol from Botswana by the incorporation of torrefied biomass. Sci. Rep. 2016, 6, 28011. [Google Scholar] [CrossRef] [PubMed] [Green Version]
  7. Onwuka, B.; Mang, B. Effects of soil temperature on some soil properties and plant growth. Adv. Plants Agric. Res. 2018, 8, 34–37. [Google Scholar] [CrossRef]
  8. Page, K.L.; Dang, Y.P.; Dalal, R.C. The Ability of Conservation Agriculture to Conserve Soil Organic Carbon and the Subsequent Impact on Soil Physical, Chemical, and Biological Properties and Yield. Front. Sustain. Food Syst. 2020, 4, 21. [Google Scholar] [CrossRef] [Green Version]
  9. Abuzaid, A.S.; El-Husseiny, A.M. Modeling crop suitability under micro irrigation using a hybrid AHP-GIS approach. Arab J. Geosci. 2022, 15, 1217. [Google Scholar] [CrossRef]
  10. Ghanem, H.G.; El-Gabry, Y.A.; Okasha, E.M.; Ganzour, S.K. Improving Some Irrigation Efficiencies, Soil Fertility, Yield and Quality of Wheat under Deficit Irrigation by Integrated N-Fertilization. Egypt. J. Chem. 2021, 64, 2201–2212. [Google Scholar]
  11. Aboelsoud, H.M.; AbdelRahman, M.A.E.; Kheir, A.M.S.; Eid, M.S.M.; Ammar, K.A.; Khalifa, T.H.; Scopa, A. Quantitative Estimation of Saline-Soil Amelioration Using Remote-Sensing Indices in Arid Land for Better Management. Land 2022, 11, 1041. [Google Scholar] [CrossRef]
  12. AbdelRahman, M.A.E.; Afifi, A.A.; D’Antonio, P.; Gabr, S.S.; Scopa, A. Detecting and Mapping Salt-Affected Soil with Arid Integrated Indices in Feature Space using Multi-Temporal Landsat Imagery. Remote Sens. 2022, 14, 2599. [Google Scholar] [CrossRef]
  13. AbdelRahman, M.A.E.; Afifi, A.A.; Scopa, A. A Time Series Investigation to Assess Climate Change and Anthropogenic Impacts on Quantitative Land Degradation in the North Delta, Egypt. ISPRS Int. J. Geo-Inf. 2022, 11, 30. [Google Scholar] [CrossRef]
  14. Gaafar, A.A.; Morsy, I.M.; Yehia, H.M. Geospatial Analysis of Soil Characteristics and Sensitivity to Desertification of Some Alluvial Deposits, El Behira Governorate, Egypt. Alex. Sci. Exch. J. 2017, 38, 137–148. [Google Scholar] [CrossRef]
  15. Memarbashi, E.; Azadi, H.; Barati, A.A.; Mohajeri, F.; Passel, S.V.; Witlox, F. Land-use suitability in Northeast Iran: Application of AHP-GIS hybrid model. ISPRS Int. J. Geo-Inf. 2017, 6, 396. [Google Scholar] [CrossRef] [Green Version]
  16. Naz, A.; Rasheed, H. Modeling the rice land suitability using GIS and multi-criteria decision analysis approach in Sindh, Pakistan. J. Basic Appl. Sci. 2017, 13, 26–33. [Google Scholar] [CrossRef]
  17. Erener, A.; Mutlu, A.; Düzgün, H.S. A comparative study for landslide susceptibility mapping using GIS-based multi-criteria decision analysis (MCDA), logistic regression (LR) and association rule mining (ARM). Eng. Geol. 2016, 203, 45–55. [Google Scholar] [CrossRef]
  18. Ayoade, M.A. Suitability assessment and mapping of Oyo State, Nigeria, for rice cultivation using GIS. Theor. Appl. Climatol. 2017, 129, 1341–1354. [Google Scholar] [CrossRef]
  19. Mokarram, M.; Hojati, M. Using ordered weight averaging (OWA) aggregation for multi-criteria soil fertility evaluation by GIS (case study: Southeast Iran). Comput. Electron. Agric. 2017, 132, 1–13. [Google Scholar] [CrossRef]
  20. Maleknia, R.; Khezri, E.; Zeinivand, H.; Badehian, Z. Mapping Natural Resources Vulnerability to Droughts Using Multi-Criteria Decision Making and GIS (Case Study: Kashkan Basin Lorestan Province, Iran). J. Range. Sci. 2017, 7, 376–386. [Google Scholar]
  21. Guarini, M.R.; Battisti, F.; Chiovitti, A. A Methodology for the Selection of Multi-Criteria Decision Analysis Methods in Real Estate and Land Management Processes. Sustainability 2018, 10, 507. [Google Scholar] [CrossRef] [Green Version]
  22. Lal, R. Restoring Soil Quality to Mitigate Soil Degradation. Sustainability 2015, 7, 5875–5895. [Google Scholar] [CrossRef] [Green Version]
  23. FAO-ISRIC. Guiding Principles for the Quantitative Assessment of Soil Degradation with a Focus on Salinization, Nutrient Decline and Soil Pollution; FAO: Rome, Italy, 2004. [Google Scholar]
  24. Khalil, A.A.; Essa, Y.H.; Hassanein, M.K. Monitoring Agricultural Land Degradation in Egypt Using MODIS NDVI Satellite Images. Nat. Sci. 2014, 12, 15–21. [Google Scholar]
  25. Egyptian Geological Survey and Mining Authority. Geologic Map of Egypt: Egyptian General Authority for Petroleum (UNESCO Joint Map Project), 20 Sheets, Scale 1:50,000; Egyptian Geological Survey and Mining Authority: Cairo, Egypt, 1987. [Google Scholar]
  26. Ministry of Development of Egypt. New communities and Land Reclamation. In Land Master Plan of Egypt; Ministry of Development of Egypt: Giza, Egypt, 1986. [Google Scholar]
  27. ASRT. A Provisional Methodology for Digital Land Resource Data Base for Agricultural Use. (2000–2005); Final Report; Academy of Scientific Research and Technology (ASRT): Cairo, Egypt, 2005. [Google Scholar]
  28. Kjeldahl, J. Neue Methode zur Bestimmung des Stickstoffs in organischen Körpern. Fresenius, Zeitschrift f. anal. Chemie 1883, 22, 366–382. [Google Scholar] [CrossRef] [Green Version]
  29. Bray, R.H.; Kurtz, L.T. Determination of total, organic and available forms of phosphorus in soil. Soil Sci. 1945, 59, 39–46. [Google Scholar] [CrossRef]
  30. Shuman, L.M.; Duncan, R.R. Soil exchangeable cations and aluminum measured by ammonium chloride, potassium chloride, and ammonium acetate. Commun. Soil Sci. Plant Anal. 2008, 21, 1217–1228. [Google Scholar] [CrossRef]
  31. Ross, D.; Ketterings, Q. Recommended methods for determining soil cation exchange capacity. In Recommended Soil Testing Procedures for the Northeastern United States, 3rd ed.; Sims, T., Wolf, A., Eds.; The Northeast Coordinating Committee for Soil Testing (NECC-1312) Agricultural Experiment Stations of Connecticut: New Haven, CT, USA, 2011; pp. 75–86. [Google Scholar]
  32. Blake, G.R. Bulk Density, Soils Analysis; America Society of Agronomy and Crop Science Society of America: Madison, WI, USA, 1982. [Google Scholar] [CrossRef]
  33. Day, P.R. Particle fractionation and particle size analysis. In Methods of Soil Analysis Part I. Agronomy n 9; Black, C.A., Ed.; American Society of Agronomy: Madison, WI, USA, 1965. [Google Scholar]
  34. Boverwijk, A. Particle size analysis of soils by means of the hydrometer method. Sedim. Geol. 1967, 1, 403–406. [Google Scholar] [CrossRef]
  35. Forestier, J. Fertilité des sols des caféières en RCA. Agron. Trop. 1960, 15, 543–567. [Google Scholar]
  36. Dabin, B. Les facteurs de fertilité des sols des régions tropicales en culture irriguée. Bul. Assoc. Française D’etude Sol. 1961, 108–130. [Google Scholar]
  37. Martin, D. Fertilité chimique des sols d’une ferme du Congo. Cah. ORSTOM. Sér. Pédol. 1979, 17, 47–64. [Google Scholar]
  38. Pieri, C.J.M.G. Fertility of Soils: A Future for Farming in the West African Savannah; Springer: Berlin/Heidelberg, Germany, 1992; pp. 1–348. [Google Scholar]
  39. Remy, J.C.; Marin-Laflèche, A. L’analyse de terre: Réalisation d’un programme d’interprétation automatique. Ann. Agron. 1974, 25, 607–632. [Google Scholar]
  40. Saaty, T.L. Decision making with the Analytic Hierarchy Process. Int. J. Serv. Sci. 2008, 1, 83–98. [Google Scholar] [CrossRef] [Green Version]
  41. Russell, R.S.; Goss, M.J. Physical aspects of soil fertility-The response of roots to mechanical impedance. Neth. J. Agric. Sci. 1974, 22, 305–318. [Google Scholar] [CrossRef]
  42. Walsh, E.; McDonnell, K.P. The influence of added organic matter on soil physical, chemical, and biological properties: A small-scale and short-time experiment using straw. Arch. Agron. Soil Sci. 2012, 58, 201–205. [Google Scholar] [CrossRef]
  43. Piaszczyk, W.; Lasota, J.; Błońska, E. Effect of Organic Matter Released from Deadwood at Different Decomposition Stages on Physical Properties of Forest Soil. Forests 2020, 11, 24. [Google Scholar] [CrossRef] [Green Version]
  44. Borah, K.K.; Bhuyan, B.; Sarma, H.P. Lead, arsenic, fluoride, and iron contamination of drinking water in the tea garden belt of Darrang district, Assam, India. Environ. Monit. Assess. 2010, 169, 347–352. [Google Scholar] [CrossRef] [PubMed]
  45. Nguemezi, C.; Tematio, P.; Yemefack, M.; Tsozue, D.; Silatsa, T.B.F. Soil quality and soil fertility status in major soil groups at the Tombel area, South-West Cameroon. Heliyon 2020, 6, e03432. [Google Scholar] [CrossRef] [PubMed] [Green Version]
  46. Bedolla-Rivera, H.I.; Xochilt Negrete-Rodríguez, M.d.l.L.; Medina-Herrera, M.d.R.; Gámez-Vázquez, F.P.; Álvarez-Bernal, D.; Samaniego-Hernández, M.; Gámez-Vázquez, A.J.; Conde-Barajas, E. Development of a Soil Quality Index for Soils under Different Agricultural Management Conditions in the Central Lowlands of Mexico: Physicochemical, Biological and Ecophysiological Indicators. Sustainability 2020, 12, 9754. [Google Scholar] [CrossRef]
  47. Chapman, H.D. Cation-Exchange Capacity. In Agronomy Monographs; Norman, A.G., Ed.; American Society of Agronomy, Soil Science Society of America: Madison, WI, USA, 2016; pp. 891–901. [Google Scholar] [CrossRef]
  48. Kong, X.; Li, D.; Song, X.; Zhang, G. Quantitative Estimation of the Changes in Soil CEC after the Removal of Organic Matter and Iron Oxides. Agric. Sci. 2021, 12, 1244–1254. [Google Scholar] [CrossRef]
  49. Minhal, F.; Ma’as, A.; Hanudin, E.; Sudira, P. Improvement of the chemical properties and buffering capacity of coastal sandy soil as affected by clays and organic by-product application. Soil Water Res. 2020, 15, 93–100. [Google Scholar] [CrossRef] [Green Version]
  50. Loveland, P.; Webb, J. Is there a critical level of organic matter in the agricultural soils of temperate regions: A review. Soil Tillage Res. 2003, 70, 1–18. [Google Scholar] [CrossRef]
  51. Rawat, J.; Saxena, J.; Sanwai, P. Biochar: A Sustainable Approach for Improving Plant Growth and Soil Properties. In Biochar: An Imperative Amendment for Soil and the Environment; Abrol, V., Sharma, P., Eds.; IntechOpen: London, UK, 2019. [Google Scholar] [CrossRef] [Green Version]
  52. Kome, G.K.; Enang, R.K.; Tabi, F.O.; Yerima, B.P.K. Influence of Clay Minerals on Some Soil Fertility Attributes: A Review. Open J. Soil Sci. 2019, 9, 155–188. [Google Scholar] [CrossRef] [Green Version]
  53. Smolander, A.; Henttonen, H.M.; Nöjd, P.; Soronen, P.; Mäkinen, H. Long-term response of soil and stem wood properties to repeated nitrogen fertilization in a N-limited Scots pine stand. Eur. J. For. Res. 2022, 141, 421–431. [Google Scholar] [CrossRef]
  54. Ballot, C.S.A.; Mawussi, G.; Atakpama, W.; Moita-Nassy, M.; Yangakola, T.M.; Zinga, I.; Silla, S.; Kperkouma, W.; Dercon, G.; Komlan, B.; et al. Caractérisation physico- chimique des sols en vue de l’amélioration de la productivité du manioc (Manihot esculenta Crantz) dans la région de Damara au centre-sud de Centrafrique. Agron. Afr. 2016, 28, 9–23. [Google Scholar]
  55. Troeh, F.R.; Thompson, L.M. Soils and Soil Fertility, 6th ed.; Blackwell: Ames, IA, USA, 2005; p. 489. [Google Scholar]
  56. Dreschel, P.; Reck, B. Composted shrubprunings and other organic manures for smallholder farming systems in southern Rwanda. Agrofor. Syst. 1997, 39, 1–12. [Google Scholar] [CrossRef]
  57. Pypers, P.; Sanginga, J.-M.; Kasereka, B.; Walangululu, M.; Vanlauwe, B. Increased productivity through integrated soil fertility management in cassava–legume intercropping systems in the highlands of Sud-Kivu, DR Congo. Field Crops Res. 2011, 120, 76–85. [Google Scholar] [CrossRef]
  58. Diacono, M.; Montemurro, F. Long-term effects of organic amendments on soil fertility. A review. Agron. Sustain. Dev. 2010, 30, 401–422. [Google Scholar] [CrossRef] [Green Version]
  59. Taalab, A.S.; Ageeb, G.W.; Siam, H.S.; Mahmoud, S.A. Some Characteristics of Calcareous soils. A review. Middle East J. Agric. Res. 2019, 8, 96–105. [Google Scholar]
  60. Chatterjee, D.; Datta, S.C.; Manjaiah, K.M. Fractions, uptake and fixation capacity of phosphorus and potassium in three contrasting soil orders. J. Soil Sci. Plant Nutr. 2014, 14, 640–656. [Google Scholar] [CrossRef]
  61. Quemada, M.; Cabrera, M.L. CERES-N model predictions of nitrogen mineralised from cover crop residues. Soil Sci. Soc. Am. Div. S-3—Soil Biol. Biochem. 1995, 59, 1059–1065. [Google Scholar] [CrossRef]
  62. Lin, H.-Y.; Chuang, T.-J.; Yang, P.-T.; Guo, L.-Y.; Wang, S.-L. Adsorption and desorption of Thallium(I) in soils: The predominant contribution by clay minerals. Appl. Clay Sci. 2021, 205, 106063. [Google Scholar] [CrossRef]
  63. Nieder, R.; Benbi, D.K.; Scherer, H.W. Fixation and defixation of ammonium in soils: A review. Biol. Fertil. Soils 2011, 47, 1–14. [Google Scholar] [CrossRef] [Green Version]
  64. Radočaj, D.; Jurišić, M.; Zebec, V.; Plaščak, I. Delineation of Soil Texture Suitability Zones for Soybean Cultivation: A Case Study in Continental Croatia. Agronomy 2020, 10, 823. [Google Scholar] [CrossRef]
  65. Epule, T.E.; Chehbouni, A.; Dhiba, D.; Etongo, D.; Driouech, F.; Brouziyne, Y.; Peng, C. Vulnerability of maize, millet, and rice yields to growing season precipitation and socio-economic proxies in Cameroon. PLoS ONE 2021, 16, e0252335. [Google Scholar] [CrossRef] [PubMed]
  66. Almendro-Candel, M.B.; Lucas, I.G.; Navarro-Pedreño, J.; Zorpas, A.A. Physical Properties of Soils Affected by the Use of Agricultural Waste. In Agricultural Waste and Residues; Aladjadjiyan, A., Ed.; IntechOpen: London, UK, 2018. [Google Scholar]
  67. Dou, F.; Soriano, J.; Tabien, R.E.; Chen, K. Soil Texture and Cultivar Effects on Rice (Oryza sativa, L.) Grain Yield, Yield Components and Water Productivity in Three Water Regimes. PLoS ONE 2016, 11, e0150549. [Google Scholar] [CrossRef]
  68. Sonneveld, M.P.W.; Hack-ten Broeke, M.J.D.; van Diepen, C.A.; Boogaard, H.L. Thirty years of systematic land evaluation in the Netherlands. Geoderma 2010, 156, 84–92. [Google Scholar] [CrossRef]
  69. Hussain, S.; Shaukat, M.; Ashraf, M.; Zhu, C.; Jin, Q.; Zhang, J. Salinity Stress in Arid and Semi-Arid Climates: Effects and Management in Field Crops, in Climate Change and Agriculture; IntechOpen: London, UK, 2019; Available online: https://www.intechopen.com/chapters/68075 (accessed on 1 June 2022).
  70. El-Hadidi, E.M.; El-Dissoky, R.A.; AbdElhafez, A.A.H. Foliar Calcium and Magnesium Application Effect on Potato Crop Grown in Clay Loam Soils. J. Soil Sci. Agric. Eng. Mansoura Univ. 2017, 8, 1–8. [Google Scholar] [CrossRef]
  71. Cole, J.C.; Smith, M.W.; Penn, C.J.; Cheary, B.S.; Conaghan, K.J. Nitrogen, phosphorus, calcium, and magnesium applied individually or as a slow release or controlled release fertilizer increase growth and yield and affect macronutrient and micronutrient concentration and content of field-grown tomato plants. Sci. Hortic. 2016, 211, 420–430. [Google Scholar] [CrossRef] [Green Version]
  72. Gransee, A.; Führs, H. Magnesium mobility in soils as a challenge for soil and plant analysis, magnesium fertilization and root uptake under adverse growth conditions. Plant Soil 2013, 368, 5–21. [Google Scholar] [CrossRef] [Green Version]
  73. Koulibaly, B.; Traoré, O.; Dakuo, D.; Lalsaga, R.; Lompo, F.; Zombre, N.P. Acidification des sols ferrugineux et ferrallitique dans les systèmes de production cotonnière au Burkina Faso. Int. J. Biol. Chem. Sci. 2014, 8, 2879–2890. [Google Scholar] [CrossRef]
  74. Jakobsen, S.T. Nutritional Disorders between Potassium, Magnesium, Calcium, and Phosphorus in Soil. In Plant and Soil; JSTOR: New York, NY, USA, 1993; Volume 154, pp. 21–28. Available online: http://www.jstor.org/stable/42938994 (accessed on 20 July 2022).
  75. Neina, D. The Role of Soil pH in Plant Nutrition and Soil Remediation. Appl. Environ. Soil Sci. 2019, 2019, 5794869. [Google Scholar] [CrossRef]
  76. Gentili, R.; Ambrosini, R.; Montagnani, C.; Caronni, S.; Citterio, S. Effect of Soil pH on the Growth, Reproductive Investment and Pollen Allergenicity of Ambrosia artemisiifolia L. Front. Plant. Sci. 2018, 9, 1335. [Google Scholar] [CrossRef] [PubMed] [Green Version]
  77. AbdelRahman, M.A.E.; Engel, B.; Eid, M.S.M.; Aboelsoud, H.M. A new index to assess soil sustainability based on Temporal Changes of Soil Measurements Using Geomatics–An example from El-Sharkia, Egypt. All Earth 2022, 34, 147–166. [Google Scholar] [CrossRef]
  78. El-Dars, F.M.S.E.; Salem, W.A.; Fahim, M.M. Soil spatial variability in arable land south of Lake Idku, North- West Nile Delta, Egypt. Environ. Sci. Indian J. 2014, 9, 325–344. [Google Scholar]
  79. Kotb, T.H.S.; Watanabe, T.; Ogino, Y.; Tanji, K.K. Soil salinization in the Nile Delta and related policy issues in Egypt. Agric. Water Manag. 2000, 43, 239–261. [Google Scholar] [CrossRef]
  80. Bashour, I.I.; Sayegh, A.H. Methods of Analysis for Soils of Arid and Semi-Arid Regions; Food and Agriculture Organization of the United Nations (FAO): Rome, Italy, 2007; Volume 128. [Google Scholar]
  81. Elewa, H.H.; El Nahry, A.H. Hydro-environmental status and soil management of the River Nile Delta, Egypt. Environ. Geol. 2009, 57, 759–774. [Google Scholar] [CrossRef]
  82. Rhoades, J.D.; Kandiah, A.; Mashali, A.M. The Use of Saline Waters for Crop Production, FAO Irrigation and Drainage Paper 48; Food and Agriculture Organization of the United Nations (FAO): Rome, Italy, 1992. [Google Scholar]
  83. Abdel-Hamid, M.A.; Shrestha, D.P. Soil Salinity Mapping in the Nile Delta, Egypt Using Remote Sensing Techniques. Int. Soc. Photogramm. Remote Sens. 1992, 29, 783–787. [Google Scholar]
  84. Badr, M.A.; El-Tohamy, W.A.; Zaghloul, A.M. Yield and water use efficiency of potato grown under different irrigation and nitrogen levels in an arid region. Agric. Water Manag. 2012, 110, 9–15. [Google Scholar] [CrossRef]
  85. Shehata, A.A.; Hamdy, M.A.; El Badry, D.D. Gypsum application and leaching of saline alkali soils in El-Beheira Governorate. Egypt. J. Soil Sci. 1983, 23, 63–73. [Google Scholar]
  86. Abdelaty, E.F.; Aboukila, E.F. Detection of Soil Salinity for Bare and Cultivated Lands Using Landsat ETM+ Imagery Data: A Case Study from El-Beheira Governorate, Egypt. Alex. Sci. Exch. J. 2017, 38, 642–653. [Google Scholar]
  87. Ali, R.R.; Moghanm, F.S. Variation of soil properties over the landforms around Idku lake, Egypt. Egypt. J. Remote Sens. Space Sci. 2013, 16, 91–101. [Google Scholar] [CrossRef] [Green Version]
  88. Hamed, Y. Soil structure and salinity effects of fish farming as compared to traditional farming in north- eastern Egypt. Land Use Policy 2008, 25, 301–308. [Google Scholar] [CrossRef]
  89. Sayed, A.S.A. Evaluation of the Land Resources for Agricultural Development—Case Study: El- Hammam Canal and Its Extension, NW Coast of Egypt. Ph.D. Thesis, Department of Geosciences, University of Hamburg, Hamburg, Germany, 2013. [Google Scholar]
  90. Shakweer, L. Impacts of Drainage Water Discharge on the Water Chemistry of Lake Edku. Egypt. J. Aquat. Res. 2006, 32, 264–282. [Google Scholar]
  91. Ismail, M.; Yacoub, R.K. Digital soil map using the capability of new technology in Sugar Beet area, Nubariya, Egypt. Egypt. J. Remote Sens. Space Sci. 2012, 15, 113–124. [Google Scholar] [CrossRef] [Green Version]
  92. Ali, R.R.; El Baroudy, A.A. Use of GIS in Mapping the Environmental Sensitivity to Desertification in Wadi El Natrun Depression, Egypt. Aust. J. Basic Appl. Sci. 2008, 2, 157–164. [Google Scholar]
  93. Abdel-Hamid, M.A.; Ismail, M.; Nasr, Y.A.; Kotb, Y. Assessment of Soils of Wadi El-Natrun Area, Egypt Using Remote Sensing and GIS Techniques. J. Am. Sci. 2010, 10, 195–206. [Google Scholar]
  94. Ali, R.R. Digital Soil Mapping for Optimum Land Uses in some Newly Reclaimed Areas West of the Nile Delta, Egypt. Aust. J. Basic Appl. Sci. 2008, 2, 165–173. [Google Scholar]
  95. Afifi, A.A.; Darwish, K.M. Detection and impact of land encroachment in El-Beheira governorate, Egypt. Model. Earth Syst. Environ. 2018, 4, 517–526. [Google Scholar] [CrossRef]
  96. Aziz, A.M.; Shahin, S.A.; Essa, E.F.; Abd El-Hady, M. Sustainability of the Soils for Orchards Land Use of Al-Nagah Area, Beheira, Egypt. Plant Arch. 2019, 19, 738–744. [Google Scholar]
  97. Stefanidis, S.; Alexandridis, V.; Ghosal, K. Assessment of Water-Induced Soil Erosion as a Threat to Natura 2000 Protected Areas in Crete Island, Greece. Sustainability 2022, 14, 2738. [Google Scholar] [CrossRef]
  98. Orgiazzi, A.; Panagos, P. Soil biodiversity and soil erosion: It is time to get married: Adding an earthworm factor to soil erosion modelling. Glob. Ecol. Biogeogr. 2018, 27, 1155–1167. [Google Scholar] [CrossRef]
  99. Stefanidis, S.; Chatzichristaki, C.; Stefanidis, P. An ArcGIS toolbox for estimation and mapping soil erosion. J. Environ. Prot. Ecol. 2021, 22, 689–696. Available online: https://scibulcom.net/en/article/RudumPyvp1Dc9aCFph69 (accessed on 1 June 2022).
  100. Naghibi, S.A.; Hashemi, H.; Pradhan, B. APG: A novel python-based ArcGIS toolbox to generate absence-datasets for geospatial studies. Geosci. Front. 2021, 12, 101232. [Google Scholar] [CrossRef]
  101. Roux, C.; Alber, A.; Bertrand, M.; Vaudor, L.; Piégay, H. FluvialCorridor: A new ArcGIS toolbox package for multiscale riverscape exploration. Geomorphology 2015, 242, 29–37. [Google Scholar] [CrossRef]
Figure 1. Location of the study area, Geology after Conoco [25].
Land 11 01256 g001
Figure 2. The climate diagrams are based on 30 years of hourly weather model simulations.
Land 11 01256 g002
Figure 3. Methodology flowchart.
Land 11 01256 g003
Figure 4. Soil taxonomy of the study area.
Land 11 01256 g004
Figure 5. Soil fertility of the study area.
Land 11 01256 g005
Figure 6. Outranking multi-criteria analyses (year 1985).
Land 11 01256 g006
Figure 7. Outranking multi-criteria analyses (year 2002).
Land 11 01256 g007aLand 11 01256 g007b
Figure 8. Outranking multi-criteria analyses (year 2021).
Land 11 01256 g008
Figure 9. Outranking multi-criteria evaluation for quantitative land degradation in 1985, 2002, and 2021.
Land 11 01256 g009
Figure 10. Assessment of excess of salts degradation.
Land 11 01256 g010
Figure 11. Assessment of physical degradation.
Land 11 01256 g011
Figure 12. Assessment of biological degradation.
Land 11 01256 g012
Figure 13. Assessment of overall land degradation rate.
Land 11 01256 g013
Figure 14. Agro-pedo-ecological zones of the study area, associated with geomorphology and landform.
Land 11 01256 g014
Table 1. Pair wise comparison matrix of criteria in AHP.
ClayECESPOMCaCO3Weightage
Clay133550.43
EC0.3313440.26
ESP0.330.331330.15
OM0.20.250.33140.10
CaCO30.200.250.330.2510.05
Note: n = 5, λ_max = 5.45, RCI = 1.12, CI = 0.08; CR = 0.10. n: no. of parameters, λ_max: maximum eigenvalue, RCI: random consistency index, CI: consistency index, CR: consistency ratio.
Table 2. Summary statistics of soil characteristics of study area.
Year 1985DepthClayCaCO3OMECESPCECANAPAKpH
Count1818181818181818181818
Min90400.80.31.811.27.238.91.465.87.6
Max13052.312.811.94220.546.287.355.992.38.37
Mean105.645.14.31.218.914.428.258.73.179.48.1
Median10045.23.71.57.514.632.859.72.476.28.1
Stdev13.43.53.10.617.22.313.217.21.39.00.2
Variance179.112.49.60.4297.35.5174.0296.11.880.90.1
Skewness0.60.51.3−0.60.30.9−0.50.30.80.1−0.7
Kurtosis−0.8−0.22.0−1.3−2.01.3−1.3−1.5−0.5−1.6−0.3
Coefficient of variation0.130.080.720.480.910.160.470.290.430.110.03
Table 3. Summary statistics of soil characteristics of study area.
Year (2002)DepthClayCaCO3OMECESPCECANAPAKpH
count3535353535353535353535
Min9039.30.80.31.28.530.138.91.254.57.7
Max15062.45.92.34.615.453.691.08.6112.38.4
Mean119.448.13.01.72.512.640.368.83.889.28.0
Median12047.33.21.72.312.539.573.63.389.48.0
Stdev17.54.71.20.40.91.86.015.52.215.50.2
Variance305.522.41.50.20.93.235.4239.84.6240.60.0
Skewness0.10.70.2−1.20.6−0.30.3−0.60.9−0.50.9
Kurtosis−1.01.1−0.42.4−0.7−0.7−0.9−1.0−0.1−0.40.3
Coefficient of variation0.150.100.410.250.380.140.150.220.570.170.02
Table 4. Summary statistics of soil characteristics of study area.
Year (2021)DepthClayCaCO3OMECESPCECAPAKpH
count35353535353535353535
Min903.51.20.30.88.530.11.254.56.8
Max15077.015.03.110.715.453.68.6112.38.4
Mean129.339.36.41.02.912.640.33.889.27.7
Median13043.45.80.92.512.539.53.389.47.7
Stdev17.720.43.40.71.91.86.02.215.50.4
Variance312.0416.811.60.43.73.235.44.6240.60.1
Skewness−0.4−0.50.71.82.4−0.30.30.9−0.5−0.1
Kurtosis−0.7−0.8−0.34.17.5−0.7−0.9−0.1−0.40.0
Coefficient of variation0.140.520.540.630.670.140.150.570.170.05
Table 5. Criterion for assessing soil fertility classes [61] modified by [36,45] for the year 2021.
CharacteristicLevel I (No Limitation)Level II (Moderate Limitation)Level III (Severe Limitation)Level IV (Very Severe Limitation)
OM (%)>21–20.5–1<0.5
N (%)>0.080.045–0.0800.030–0.045<0.03
P (ppm)>2010–205–10<5
K (meq/100 g)>0.40.2–0.40.1–0.2<0.1
EC(dS m−1)>44–88–15<16
CEC (%)>6040–6015–40<15
CEC(meq/100 g)>2510–255–10<5
pH>5.55.1–5.54.75–5.1<4.75
BI≤1.41.6–1.41.8–1.6≥1.8
FI>1.5--<1.5
SSI>97–95–7<5
CaCO3 (%)<1010–2020–40>40
ESP<13-->13
Level I: soils with no or low limitations; Level II: soils with no more than three moderate limitations associated with low limitations; Level III: soils with more than three moderate limitations associated with severe limitation; Level IV: soils with more than one severe limitation.
Table 6. Area of different weighted values for the years 1985, 2002, and 2021.
Weighted ValueArea (Hectares)Area %
Year 198578427.241.04
8613,254.2475.44
9191,219.3123.52
Year 200271157.670.14
815,566.941.91
9788,877.7297.04
107298.460.90
Year 202143144.510.39
527,734.313.41
6121,162.1414.90
7143,513.0117.65
8257,577.7531.69
9259,769.0731.96
Publisher’s Note: MDPI stays neutral with regard to jurisdictional claims in published maps and institutional affiliations.

