Abstract
Urgent biophilia describes the conscious desire of humans to seek interactions with nature during periods of stress. This study examines the changes in frequency and reason for visiting urban green spaces by residents of Wellington, New Zealand, to determine whether resident behavior during a stressful period exemplifies the principles of urgent biophilia. The COVID-19 pandemic and resulting lockdowns were used as the study period due to the significant physical and mental health stressors they triggered. Pedestrian and cyclist counters located in key urban green spaces in Wellington were used to collect data on visits pre- and post-pandemic. Two surveys were used to assess residents’ reasons for visiting urban green spaces during lockdowns. Increased green space visits were seen during the strictest lockdowns, though there was some variation in visits depending on the location of the green space. The most frequently reported reason for visiting green spaces during lockdown was mental wellbeing, followed by recreation. These results suggest that Wellington residents used urban green spaces as a coping mechanism during stressful lockdown periods for wellbeing benefits, exemplifying the principles of urgent biophilia. Urban planners and policymakers must consider and implement urban green infrastructure as a public health resource.
1. Introduction
1.1. Urgent Biophilia and Human Wellbeing
The concept of biophilia, introduced by E. Fromm in 1964 and popularised by E.O. Wilson in 1984, describes the “innate human tendency to focus on and affiliate with life forms and life-like processes” [1]. This affiliation and desire to connect with nature, often termed the biophilia hypothesis, is said to be encoded in human genetics as a result of our evolutionary and historical dependence on other species and biological systems for survival and reproduction [2,3]. A growing body of quantitative and qualitative research provides evidence for the mental and physical advantages associated with biophilia and contact with nature, as well as the adverse effects of a lack of contact with nature [4,5].
A framework for incorporating biophilia into the built environment at the architectural scale, termed biophilic design, was introduced by S. Kellert, a colleague of E.O. Wilson, in 2008 [6]. Biophilic design frameworks related to urban scales have also been devised [7,8], and an international Biophilic Cities Network exists to facilitate a global network of partner cities “working to pursue a natureful city within their unique and diverse environments and cultures” [9].
Biophilic design utilises natural morphologies, materials, and spatial patterns and arrangements to provide more opportunities for humans to connect with nature, either directly or indirectly, in buildings and cities, thereby improving human wellbeing [6]. Russell et al. [10] categorised the contributions of non-material experiences of nature to the many facets of human wellbeing, including certainty and control, inspiration and fulfilment, sense of place and identity, and connectedness and belonging.
In 2012, K. Tidball [11] proposed the concept of urgent biophilia to describe nature’s role in human resilience. In contrast to the biophilia hypothesis, which suggests that our innate affinity to nature is mostly subconscious, urgent biophilia suggests that humans consciously seek out contact with nature to strengthen their resilience during a crisis or disaster. Tidball’s 2012 paper [11] reviews the therapeutic benefits of contact with nature and suggests that within the context of a disaster or crisis, individuals or communities may consciously seek out nature to reap those benefits and aid in their recovery. This hypersensitised manifestation of the human affinity for nature functions as a self-administered or doctor-prescribed [12] nature-based therapy that can improve our capacity to withstand and adapt to hardship [13].
1.2. Green Space and Human Wellbeing
Ecosystems and contact with nature contribute to human wellbeing through physical, psychological, philosophical, social, cultural, and spiritual pathways [14]. The term “wellbeing” goes beyond the meeting of basic needs and includes elements such as a positive physical and mental state, social cohesion and participation in society, and a sense of purpose and achievement [5]. These more intangible benefits of contact with nature are central to human values and preferences, such as cultural diversity and identity, cultural landscapes and heritage, inspiration, recreation, and tourism [10,14].
An extensive body of literature documents the mental and physical health benefits related to nature-based therapies and living in close proximity to nature [4,5]. Nature-based therapies for mental wellbeing include practices such as forest bathing, horticulture, and community gardening [15]. There is evidence for the positive impacts of nature on stress reduction [16], social cohesion [17], and improved mood [18]. Significant associations have been found between the proximity and accessibility of urban green spaces and positive physical and mental health outcomes [19]. However, McDonald et al. [20] found that only 13% of urban residents live near enough forest cover to confer significant wellbeing benefits. Due to age or financial constraints, residents with limited mobility are particularly impacted by a lack of access to good quality urban green space [21]. Urgent biophilia suggests that access to the physical and mental wellbeing benefits of urban green spaces is especially important during times of crisis. Therefore, this study examines the COVID-19 lockdowns and their impacts on green space visits by urban residents.
1.3. COVID-19 Pandemic and Human Wellbeing
The global public health crisis presented by the COVID-19 pandemic sent unprecedented regulations throughout countries worldwide. When the COVID-19 virus arrived in New Zealand in February 2020, the government implemented rapid, strict lockdowns to stop its spread. While this resulted in New Zealand having fewer COVID-19 cases and deaths, there were other impacts on wellbeing due to the economic, social, and health consequences of the border closure and lockdowns [22]. Such large and sudden disruptions to everyday life negatively impact the wellbeing of populations, particularly those in urban environments with limited access to green spaces [23]. Whether through direct contact with the COVID-19 virus or the indirect impacts of the local and global restrictions put into place to reduce its spread, the COVID-19 pandemic has had serious impacts on human wellbeing [24]. The COVID-19 period has been associated with significantly higher levels of depression and anxiety [25], and lockdown severity significantly impacted mental health [26]. The COVID-19 pandemic is a crisis scenario that contains no physical destruction or disaster but remains a threat to public health and social cohesion. The self-isolation and stay-at-home orders severely limited travel globally and locally and reduced the opportunities for coping mechanisms, such as social activities and time spent with loved ones. Without these conventional coping strategies, how did individuals cope with the stress and uncertainty brought on by the pandemic? Based on the concepts and evidence in the biophilia, human wellbeing, and urban green space literature, this study investigates if and why residents of Wellington, New Zealand, used their local green spaces for nature-based coping mechanisms during the COVID-19 lockdowns, as the theory of urgent biophilia might suggest.
2. Materials and Methods
2.1. COVID-19 Lockdowns in Wellington, New Zealand
New Zealand is a temperate island nation in the South Pacific with a population of approximately 5 million [27]. The first COVID-19 case in New Zealand was reported on 28 February 2020. The New Zealand border was closed to all but citizens and permanent residents on 19 March 2020. The New Zealand Government implemented a National Action Plan to manage the spread of COVID-19 and outlined four levels of restrictions [28]. The Alert Level system was introduced and put in place on 21 March 2020, and New Zealand was placed in Alert Level 2. A series of Alert Level changes and lockdowns followed over the next five months, with the most stringent isolation requirements (Alert Level 4) lasting four consecutive weeks. During Alert Level 4, people were to remain at home except to visit essential services. Outside recreation (e.g., walking, jogging) was allowed with social distancing but was limited to residents’ local neighbourhoods. The COVID-19 Stringency Index rated New Zealand’s Alert Level 4 protocol the strictest in the world (96.30 out of 100), followed by Italy (93.52), France (87.96), and the UK (79.63) [29]. During Alert Level 3, people were required to work and study from home, if possible. There was limited domestic travel, and public venues were closed, other than most urban green spaces. During Alert Level 2, alternative ways of working were encouraged to limit the virus spread. There were reduced capacities in public venues, other than urban green spaces, and restrictions on mass gatherings. During Alert Level 1, most restrictions were removed, except for physical distancing, contact tracing, and restrictions on mass gatherings. Self-isolation and testing were required for anyone symptomatic [28]. Alert levels varied in different parts of New Zealand, particularly in 2021.
Wellington, a coastal city on the North Island, is the capital of New Zealand and has a population of approximately 216,505 [30]. The city’s steep hilly topography constrains development and affords residents a high proportion of visible green and blue space [31]. As a result of the preservation of a series of interconnected urban green spaces (known as the Town Belt) and other key native habitat reserves [32], central Wellington has an average of 20 m2 of urban green space per person, but this varies considerably between different suburbs [33]. This is more than twice the WHO recommendation of at least 9 m2 of urban green space per person [34]. Because most residents have access to nearby green space, Wellington is a good case study for examining green space usage by urban residents, particularly during the COVID-19 period (Figure 1) when travelling to larger natural areas on the urban periphery was restricted. Wellington is one of the cities in the International Biophilic Cities Movement [35].

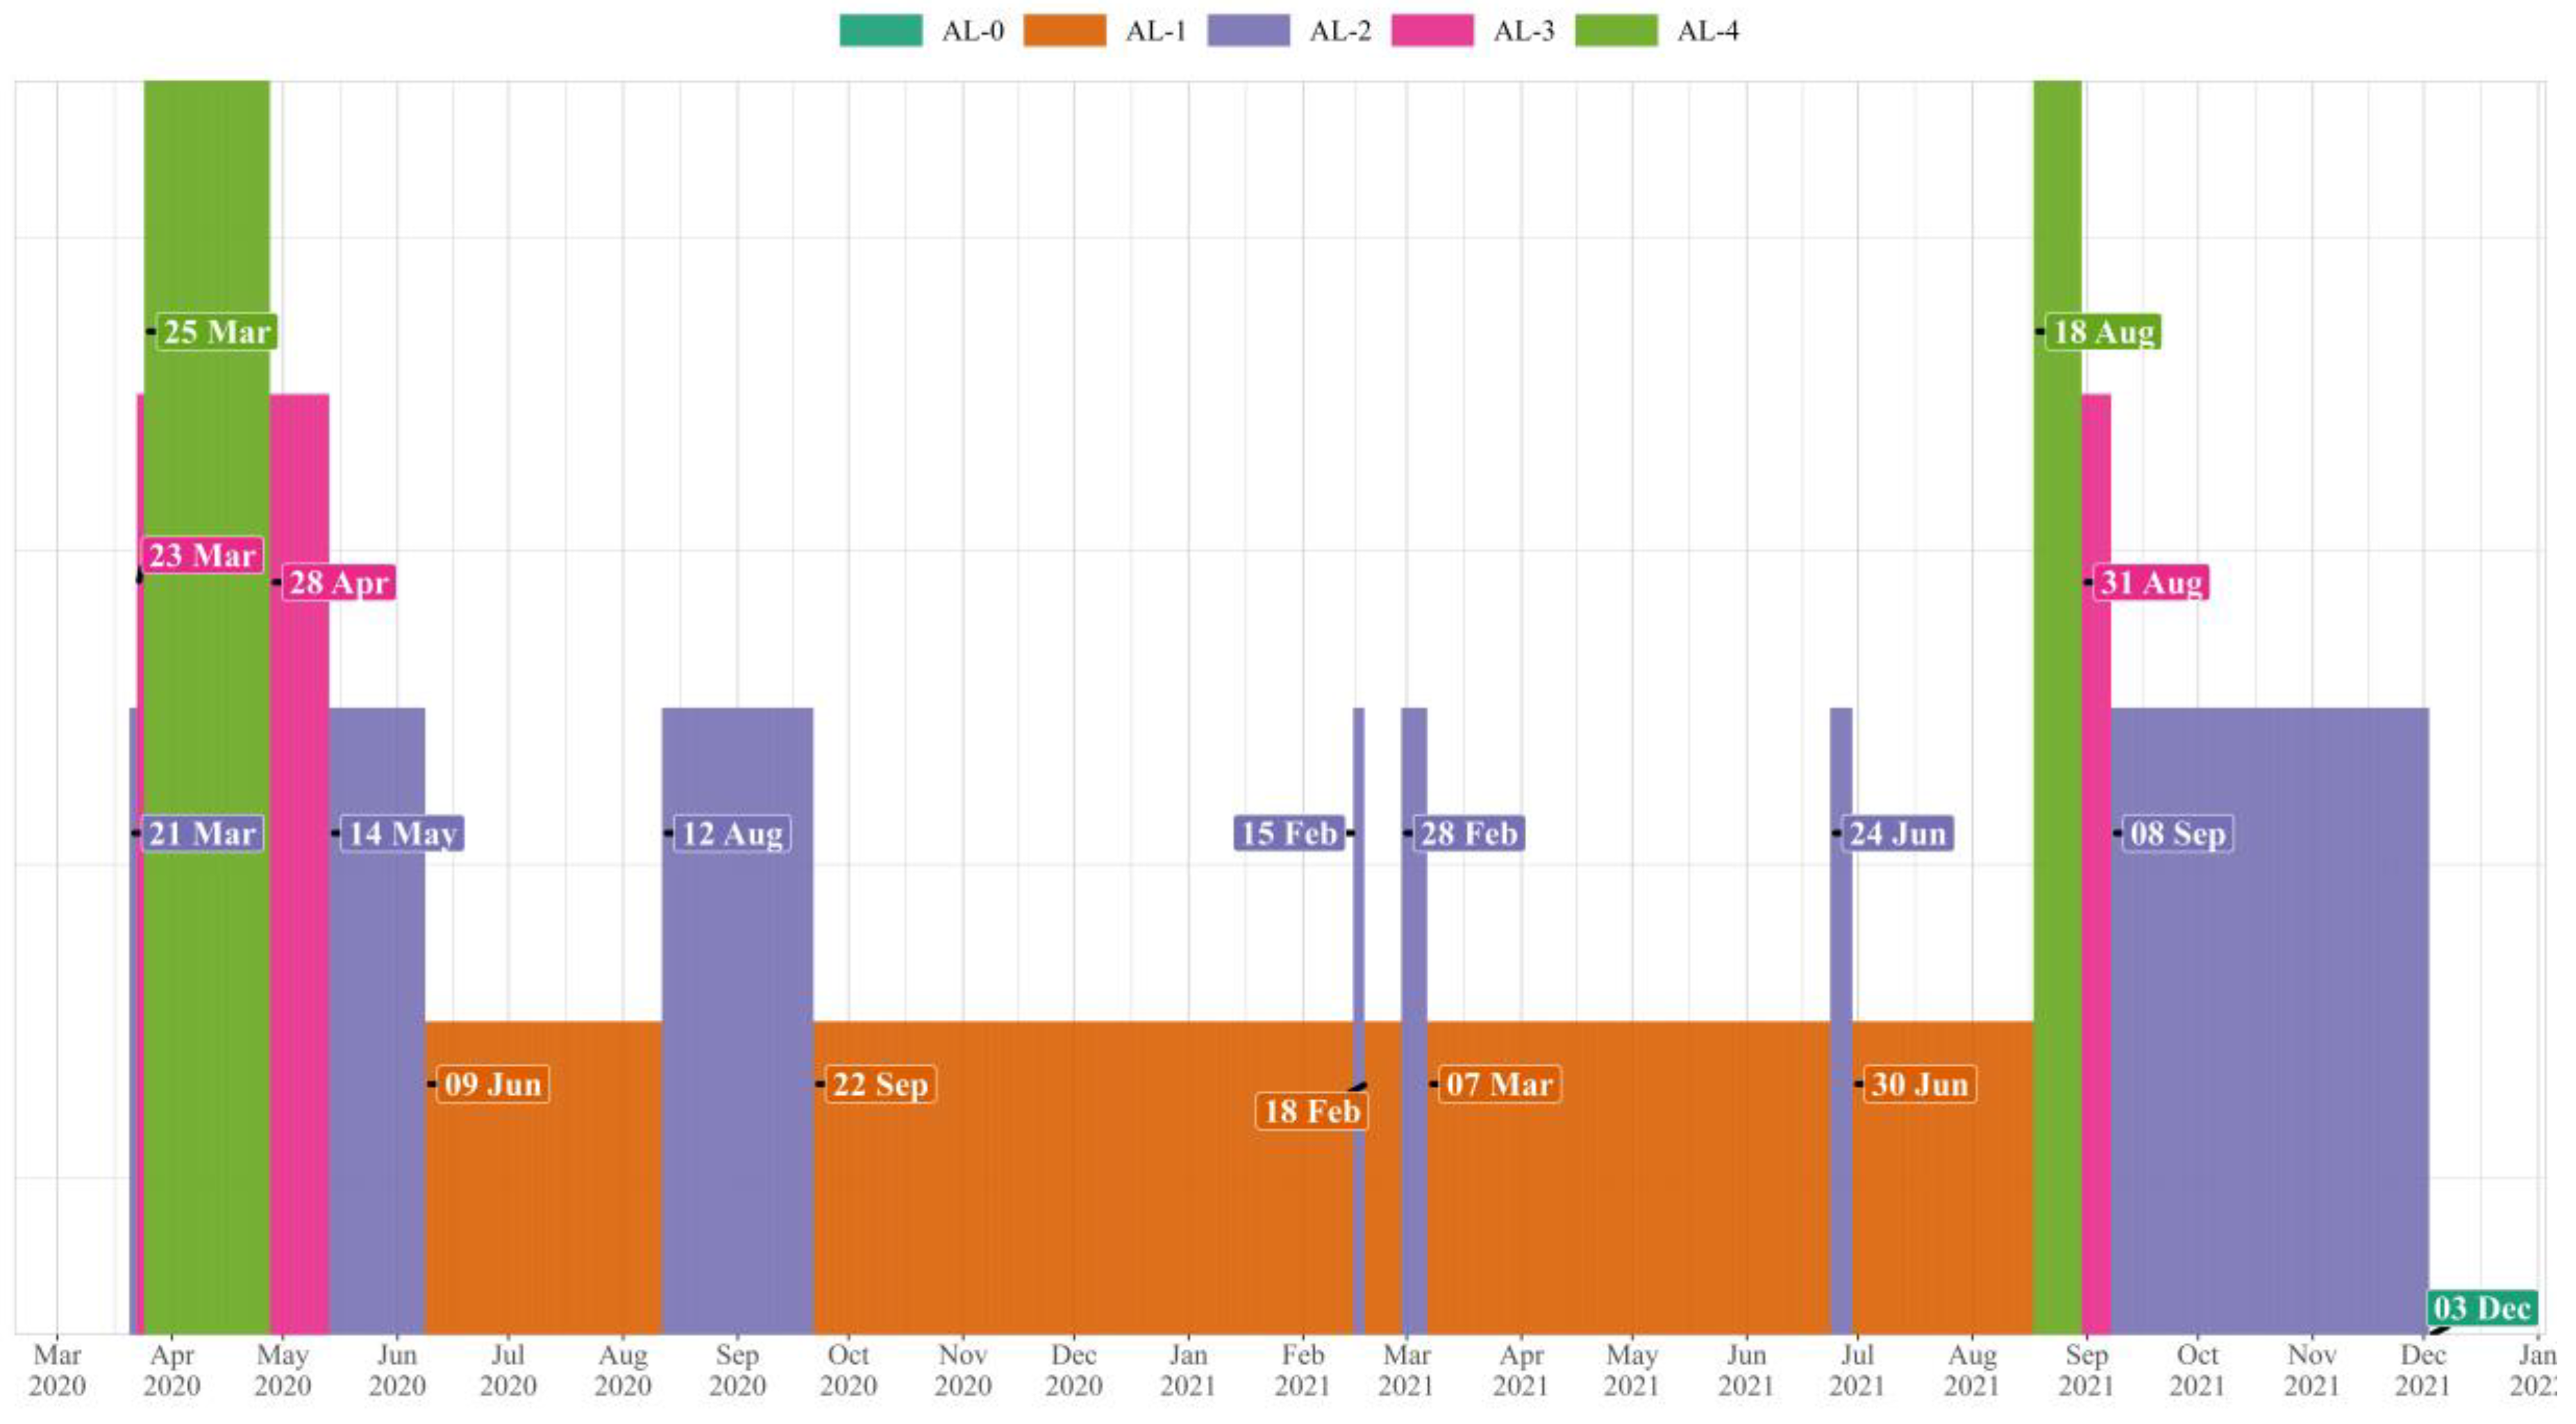
Figure 1.
Wellington, New Zealand, COVID-19 Alert Level restrictions and dates from 2019 to 2021. Alert Level (AL) restrictions increase in strictness, with AL-4 being the strictest (everything except essential services closed). The start dates of the Alert Level periods are shown in the labels.
2.2. Wellington Pedestrian and Cyclist Counter Data
Wellington City Council has a large network of pedestrian and cyclist counters throughout its green spaces to track trail visits. For this analysis, data from counters in six urban green space locations in the Wellington region were used: Gilberd Bush, Hataitai to City Walkway, Southern Walkway (and “Super D” mountain bike trail), Berhampore Golf Course, Mount Kaukau, and Waimapihi (Polhill) (Figure 2). These counters produced the most reliable and consistent data over the study period of January 2019 to March 2022. The counters used by Wellington City Council are from Eco-Counter [36]. The PYRO Evo counter is a passive infrared sensor sitting inside a wooden post beside the trail that counts pedestrians only. The MULTI Nature counter uses a passive infrared sensor and an inductive loop sensor buried under the trail to distinguish between pedestrians and cyclists. Data were collected via cellular transmission using the Eco-Visio data analysis platform from Eco-Counter.

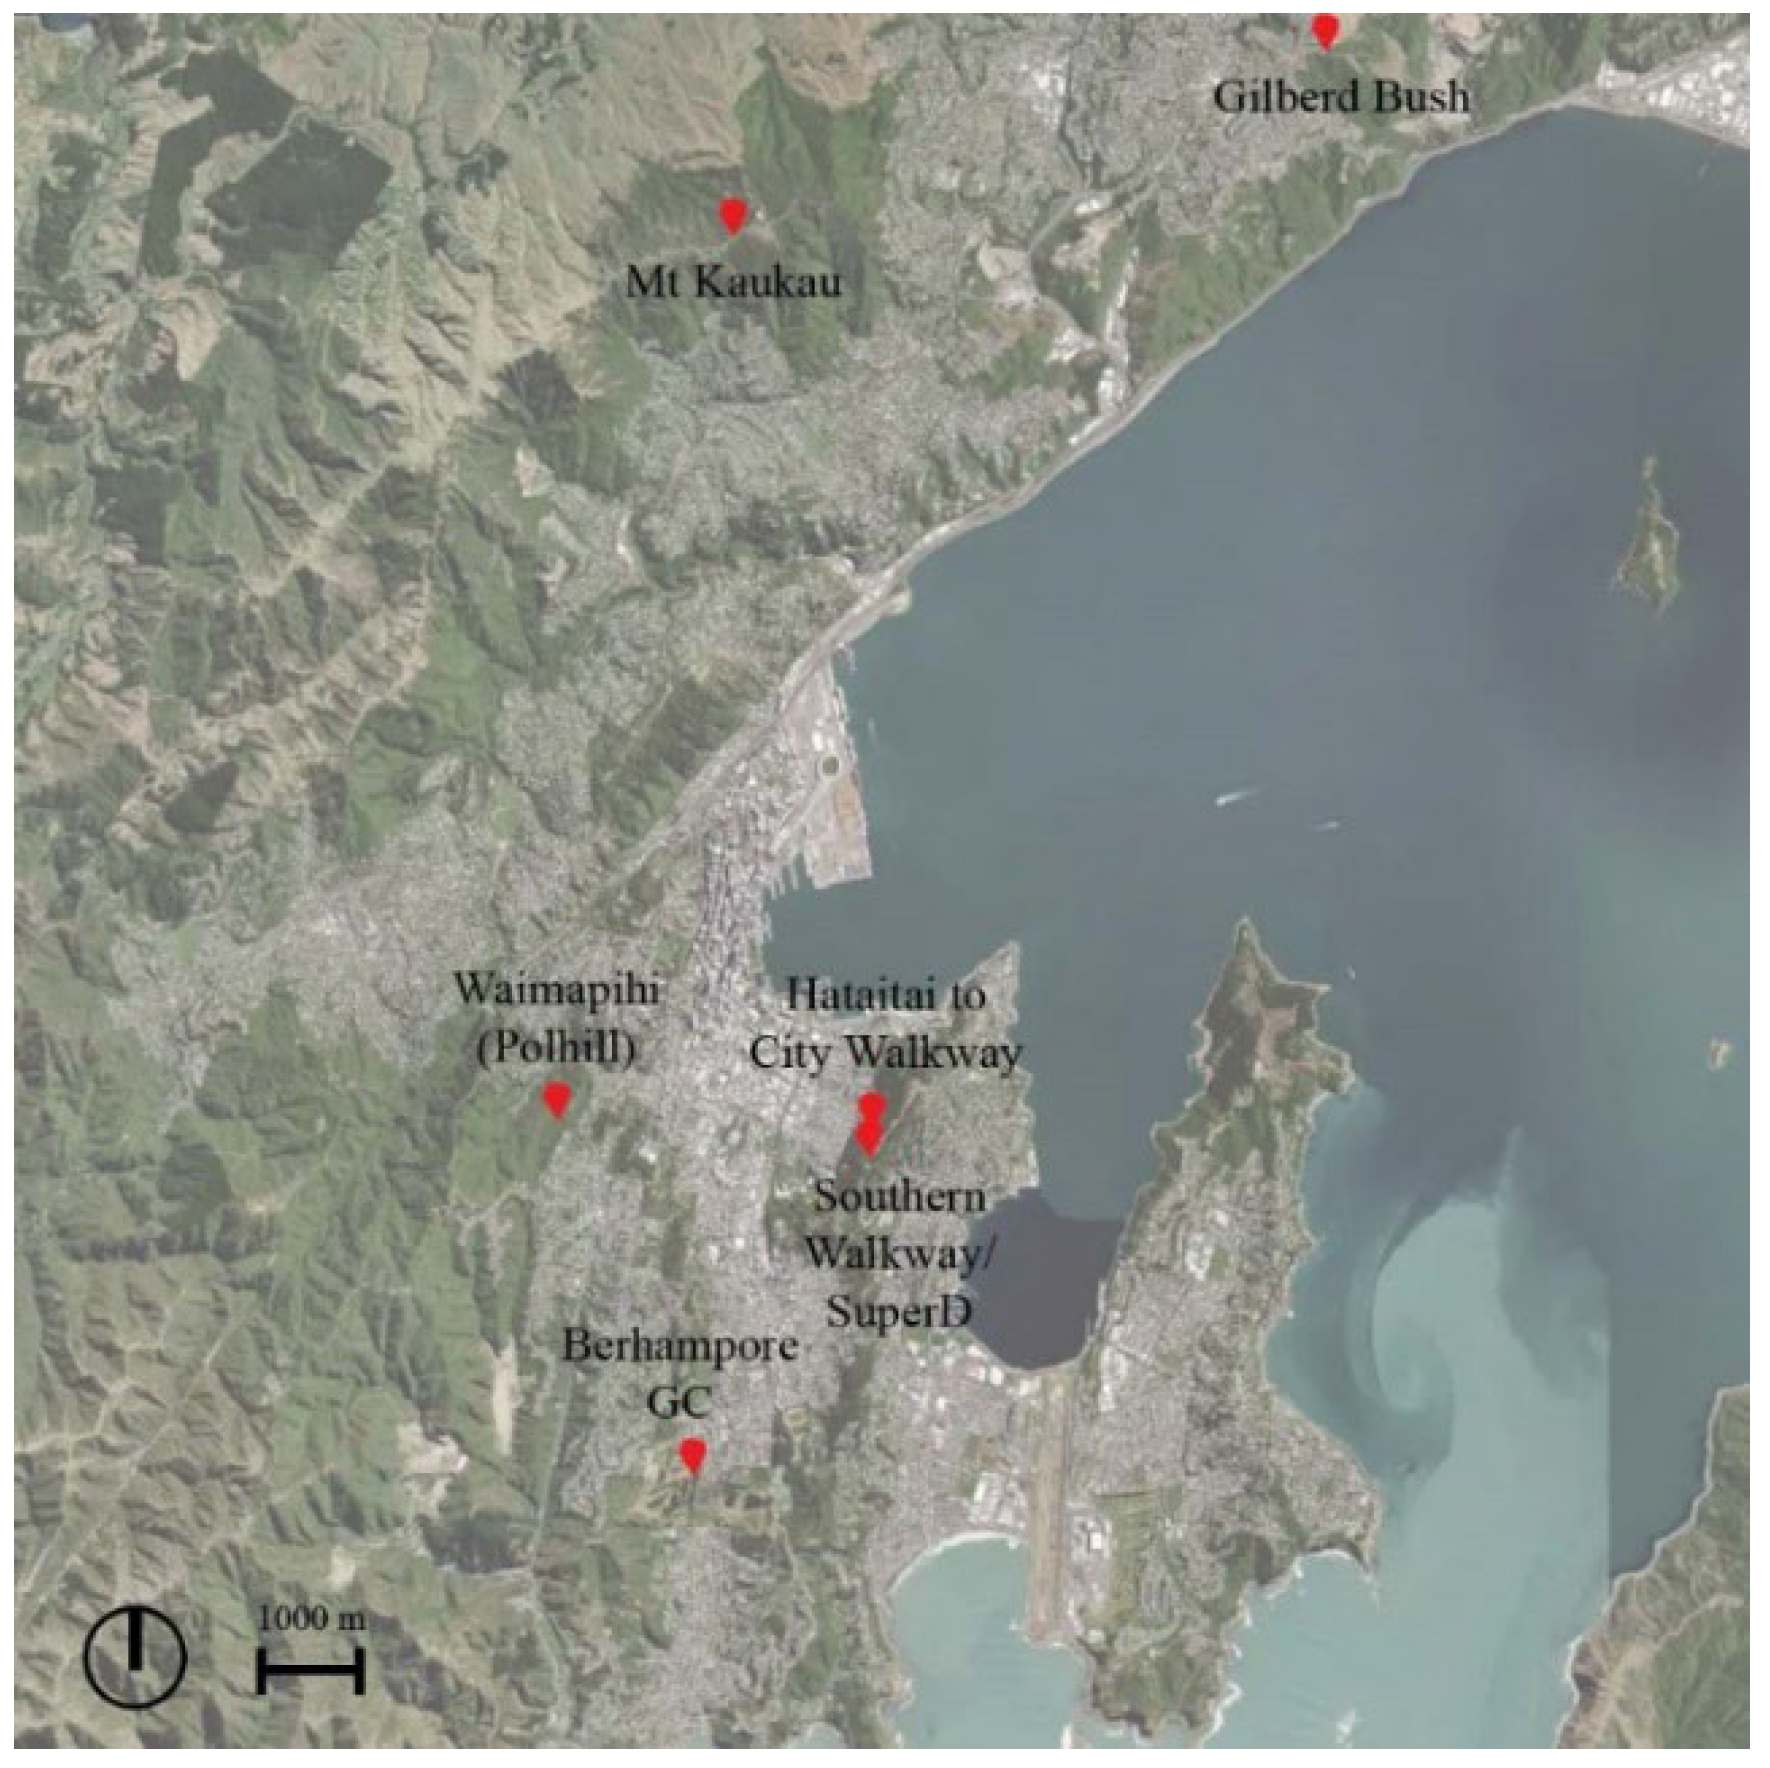
Figure 2.
Pedestrian and cyclist counter locations in Wellington green spaces. Berhampore Golf Course (GC) and Mount Kaukau had pedestrian-only counters. The other four locations had MULTI counters. The base satellite image is from Landcare Research [37].
The data from these counters were processed using the statistical analysis package “R”. Trail visits in the various Alert Level periods in Wellington throughout 2020, 2021, and 2022 were compared to the (pre-COVID) trail visits in 2019. The process for each counter is as follows:
- The daily aggregate of counts are calculated.
- The daily mean count on weekends and weekdays is calculated for each month.
- A correction factor for each month’s weekends/weekdays is calculated by comparing the monthly means with a reference month (March 2019). The month is arbitrarily chosen.
- Each day’s aggregate count is adjusted by the correction factor.
This process corrects for differences in green space visits in Wellington between weekends and weekdays and across seasons. Extreme values (those far more or less than expected) were investigated to identify faulty counters and were not included in the analysis.
2.3. Tanera Park Survey
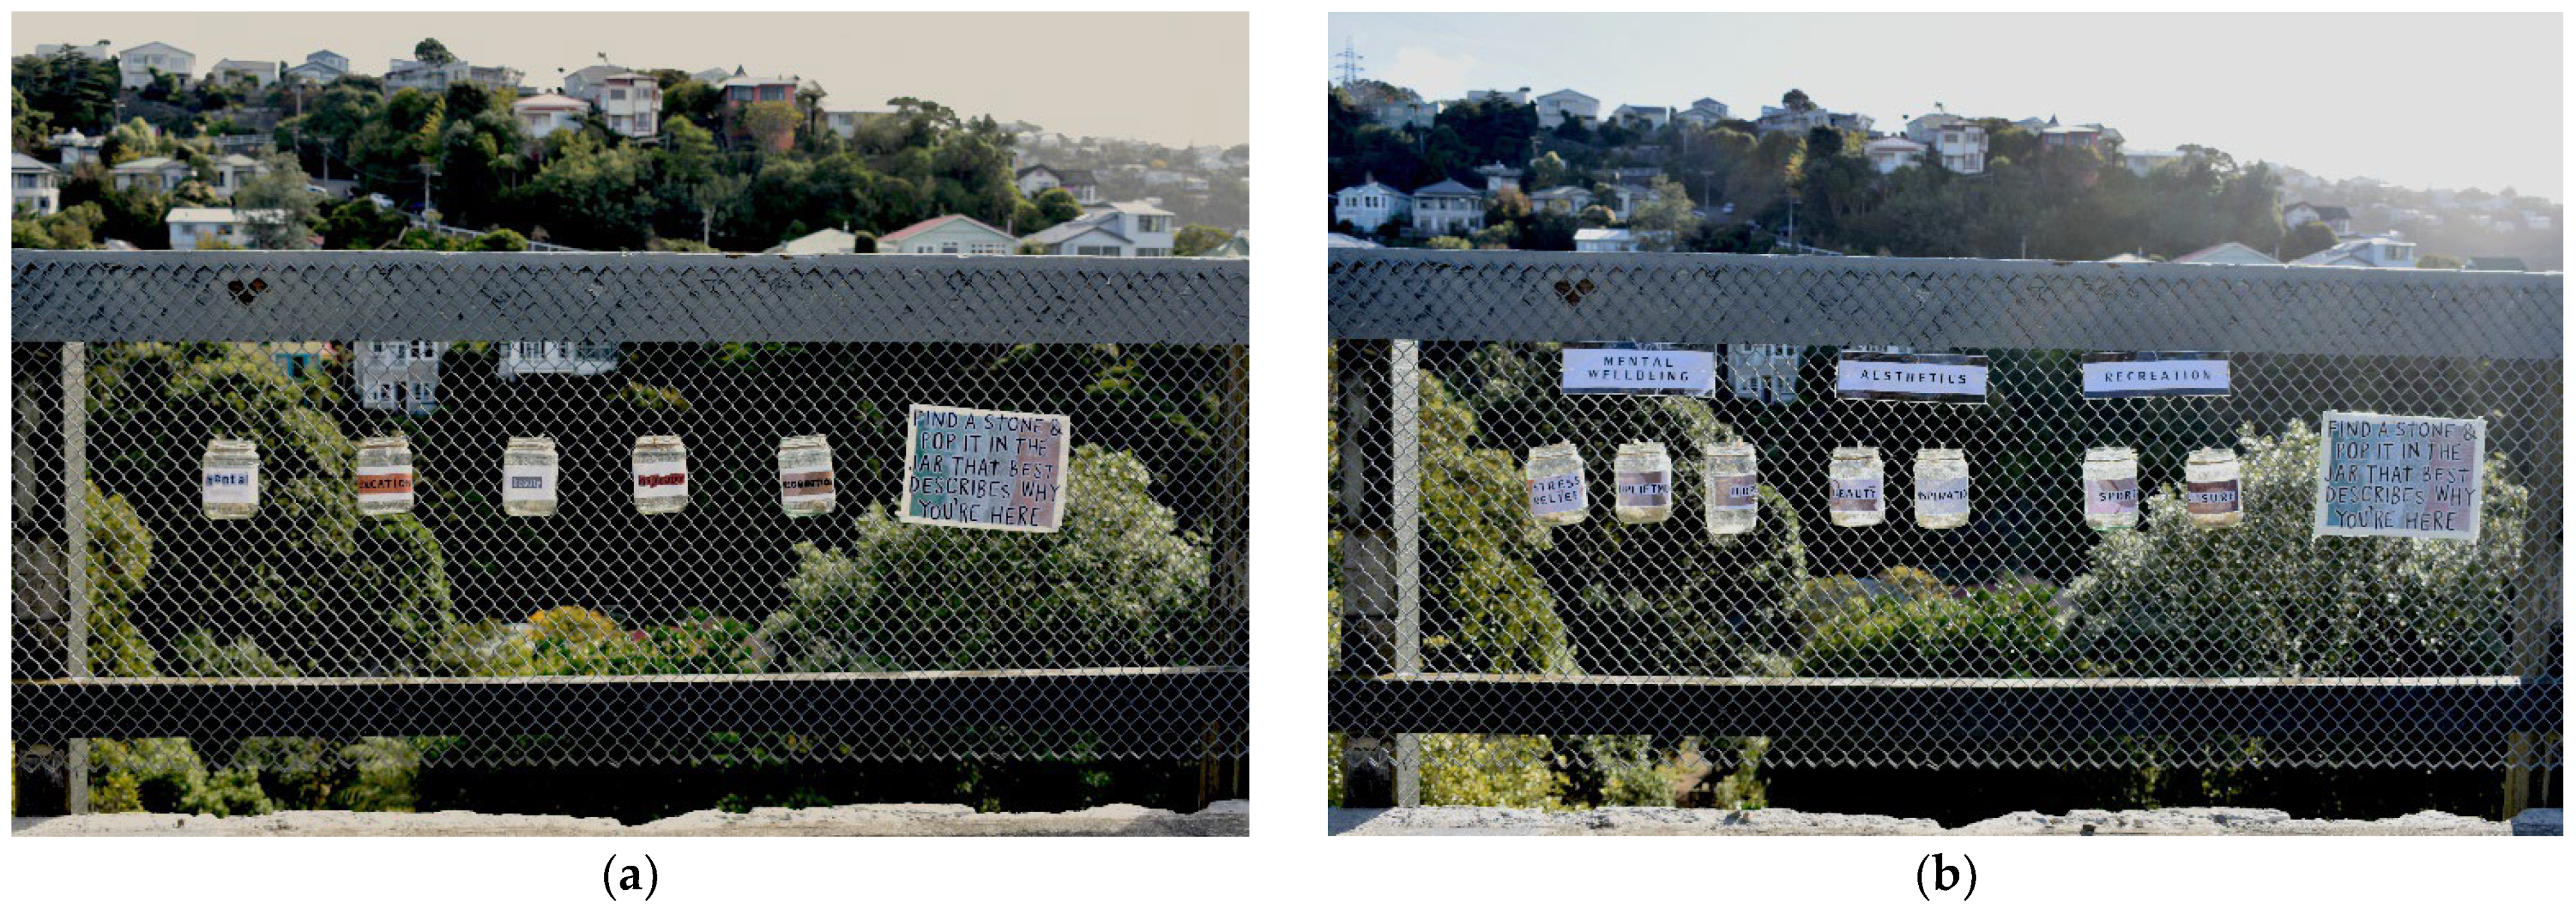
Tanera Park in Aro Valley is one of the green spaces that make up the Wellington Town Belt. During the first national lockdown, labelled glass jars were tied to a fence at one of the park’s viewpoints, and small stones were piled near them to create an interactive survey installation (Figure 3). The survey was carefully designed so that it would not increase virus transmission potential. Posters next to the jars asked people to place a stone in the jar that best described the reason for their visit to the park on a given day (Figure 4). The stones were removed from the jars and counted at the end of each day. The installation was active from 19 April to 29 May 2020, during which Wellington transitioned from Alert Level 4 to Alert Level 2. During the first phase of the survey, there were five jars, each corresponding to a known green space benefit: mental wellbeing, education, beauty, inspiration, and recreation. After an initial assessment of the data collected, phase 2 of the survey expanded the categories related to mental wellbeing and recreation, linking them to attributes of biophilic design. Seven jars were installed in groups related to mental wellbeing, recreation, and aesthetics. There were three jars in the mental wellbeing category (upliftment, stress relief, and hope), two jars in the recreation category (sport and leisure), and two jars in the aesthetics category (beauty and inspiration).

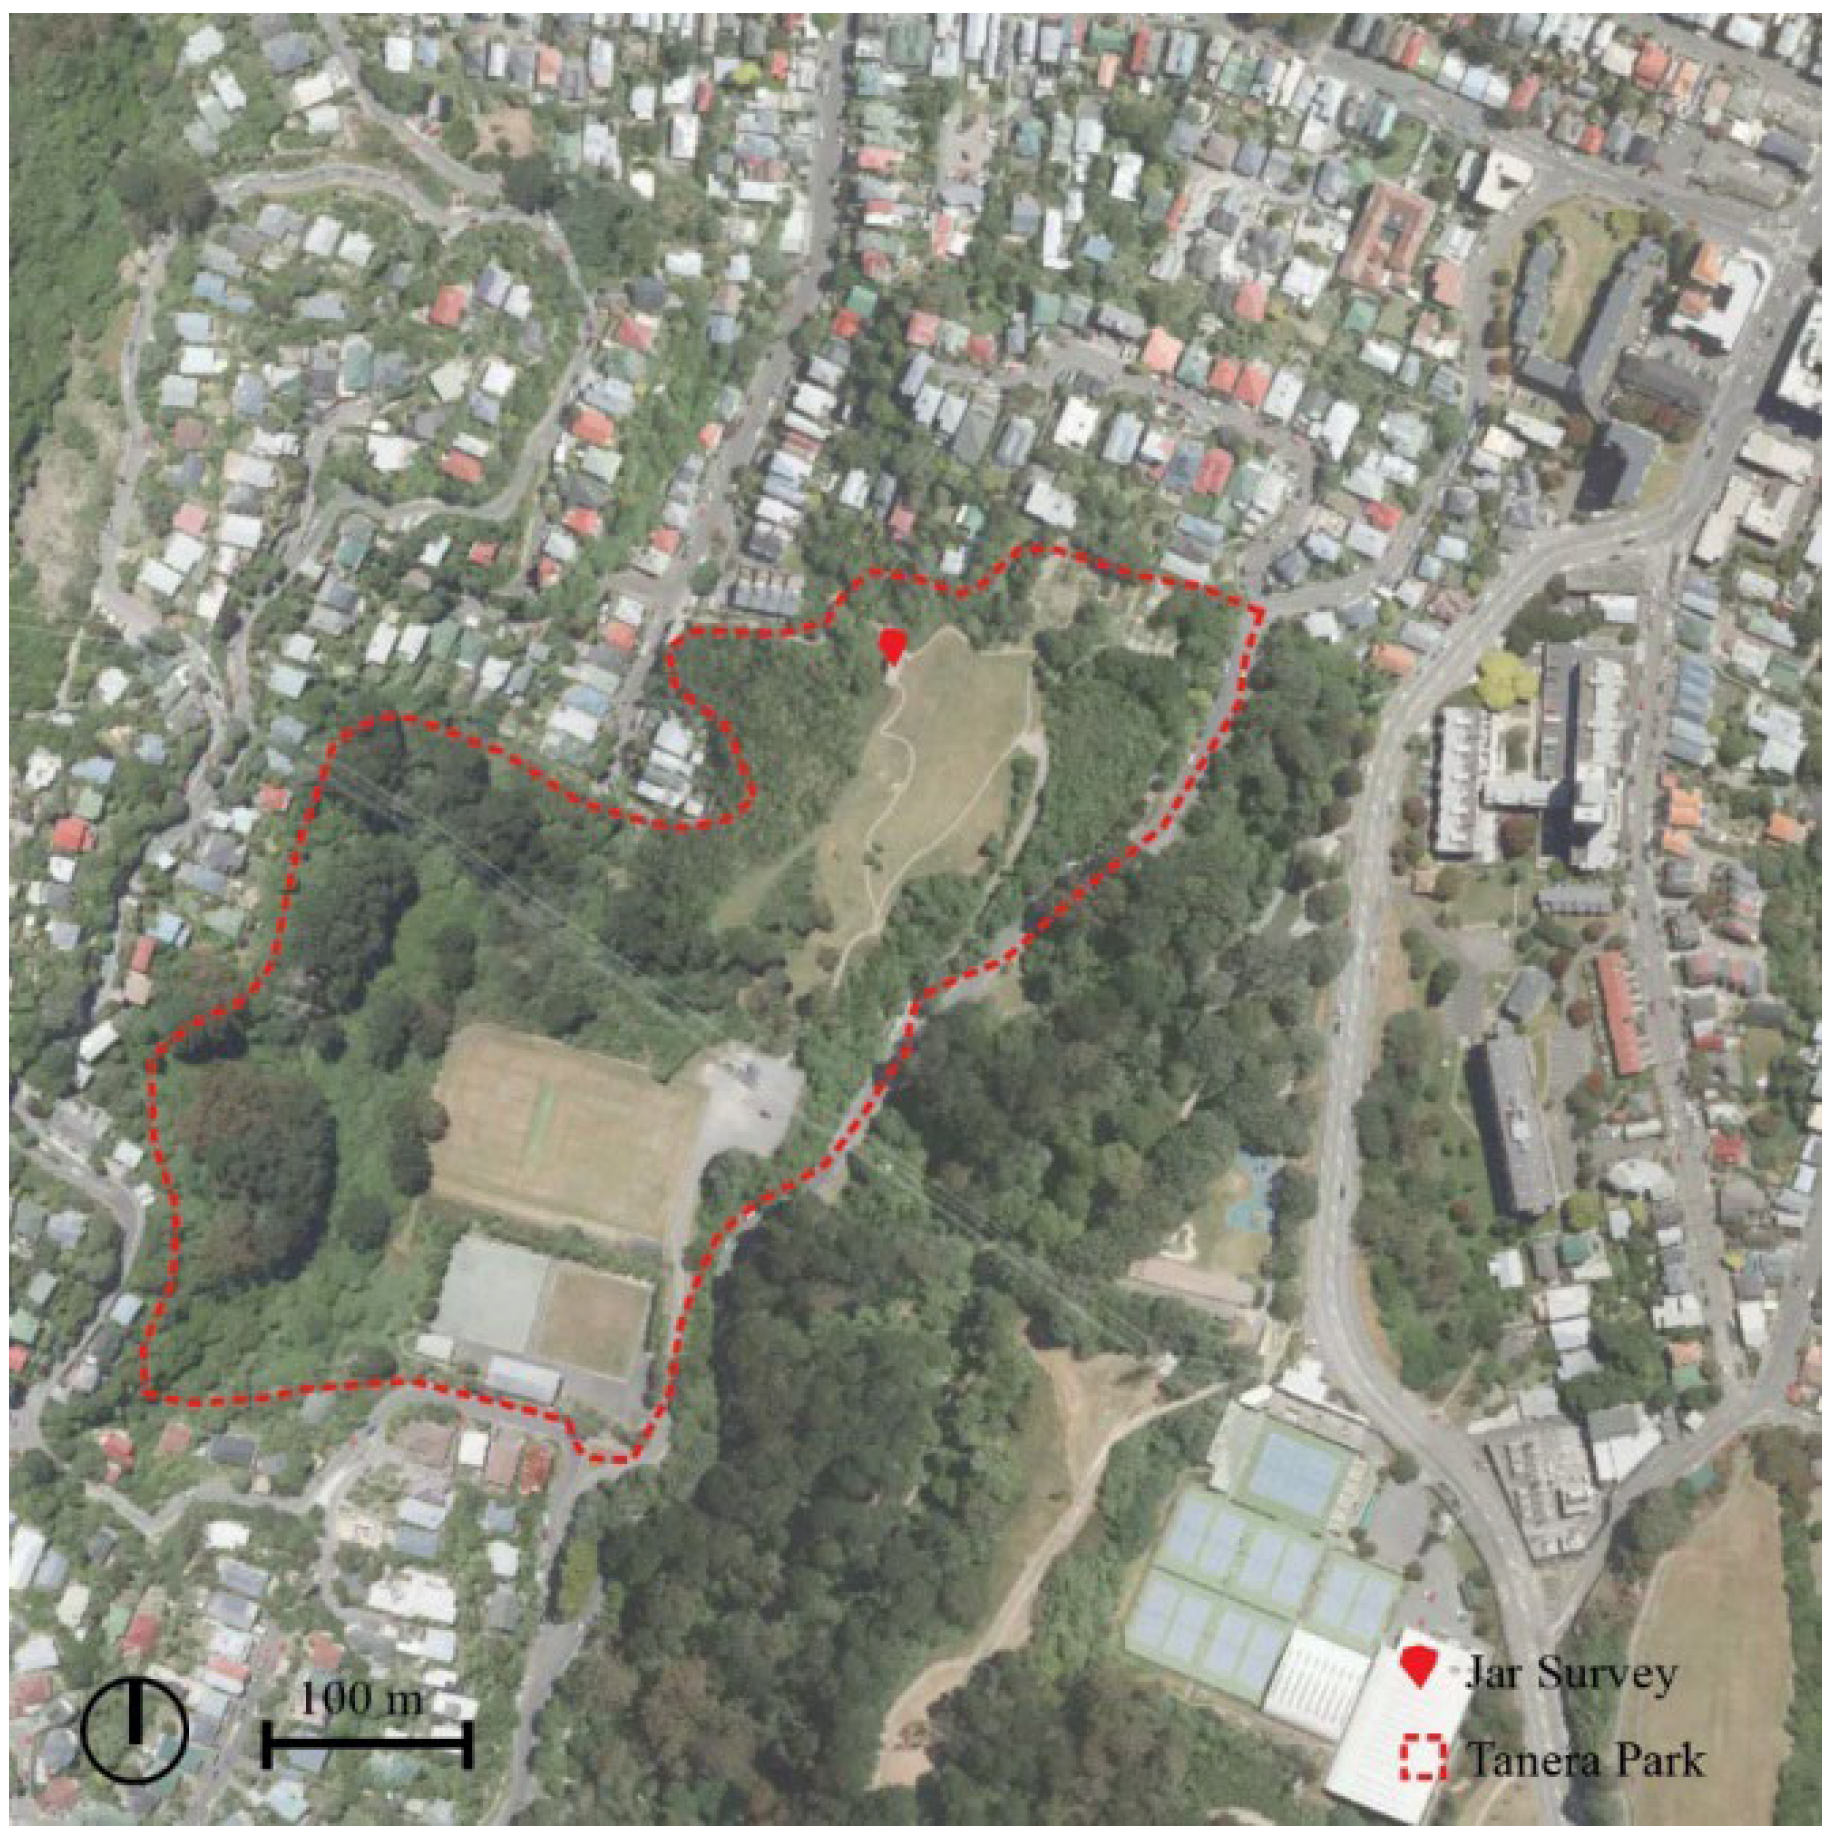
Figure 3.
The location of the jar survey in Tanera Park in Aro Valley, Wellington. The base satellite image is from Landcare Research [37].
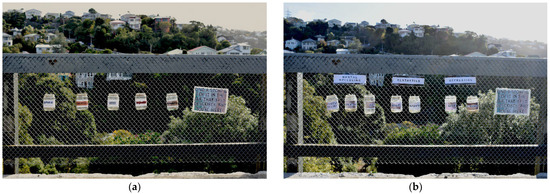
Figure 4.
Images of the Tanera Park jar survey: (a) jar labels for phase 1 of the survey; (b) jar labels for phase 2 of the survey.
In order to better understand if people’s behavior was exemplifying the principles of urgent biophilia, an online survey was created using Qualtrics and was active from 27 May to 30 June 2020. The online survey was distributed via a QR code installed next to the jars, and through popular Facebook groups, community noticeboards, and flyers. However, it was limited to people who had visited and/or interacted with the jar survey in Tanera Park. The survey consisted of 27 questions that expanded upon the jar survey in the park and further investigated people’s frequency and reasons for visiting the park during COVID-19 lockdowns. The survey also allowed open text answers for the reason for visiting the park to capture responses that were not covered by the jar categories, and it also provided a list of options for participants to describe their emotional state.
3. Results
3.1. Wellington Pedestrian and Cyclist Counter Analysis
In total, the six Wellington green space locations registered 538,000 visits in 2019, compared to 564,000 (+4.8%) in 2020 and 554,000 (+3.0%) in 2021; however, some individual stations registered larger changes, such as Gilberd Bush in 2020 with a 67.3% increase or the Hataitai to City Walkway with a decrease of 22.1% in 2020 (Table 1).

Table 1.
Summary of green space visits in 2019 (pre-COVID), 2020, and 2021.
Figure 5 and Figure 6 are frequency distribution graphs of daily visits at the six green space sites during high Alert Levels (3–4) and low Alert Levels (0–2) for each post-COVID-19 year, each compared to the pre-COVID-19 (2019) period. These graphs show the proportion of days (y-axis) against the number of visits per day (x-axis). A narrow peak on these graphs results from the number of visits per day being relatively consistent. In contrast, low, flat curves result from the number of visits being highly variable.
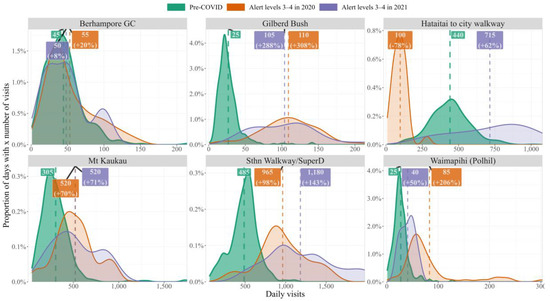
Figure 5.
The distribution of daily green space visits during high Alert Levels (3–4) in 2020 (orange) and 2021 (purple) compared to the pre-COVID-19 (2019) periods. The graphs show the proportion of days (y-axis) with a number of daily visitors (x-axis), and thus show how consistent the number of visits is. The mean daily visitors are also marked with a dashed line and label with this compared to 2019. All values have been corrected for mean monthly and weekend/weekday differences.
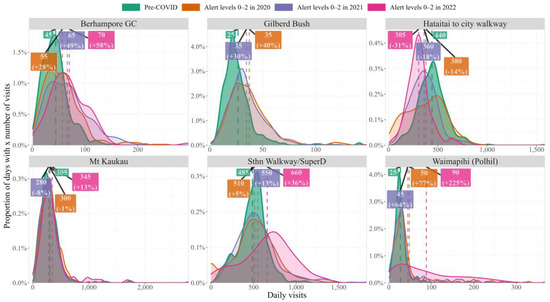
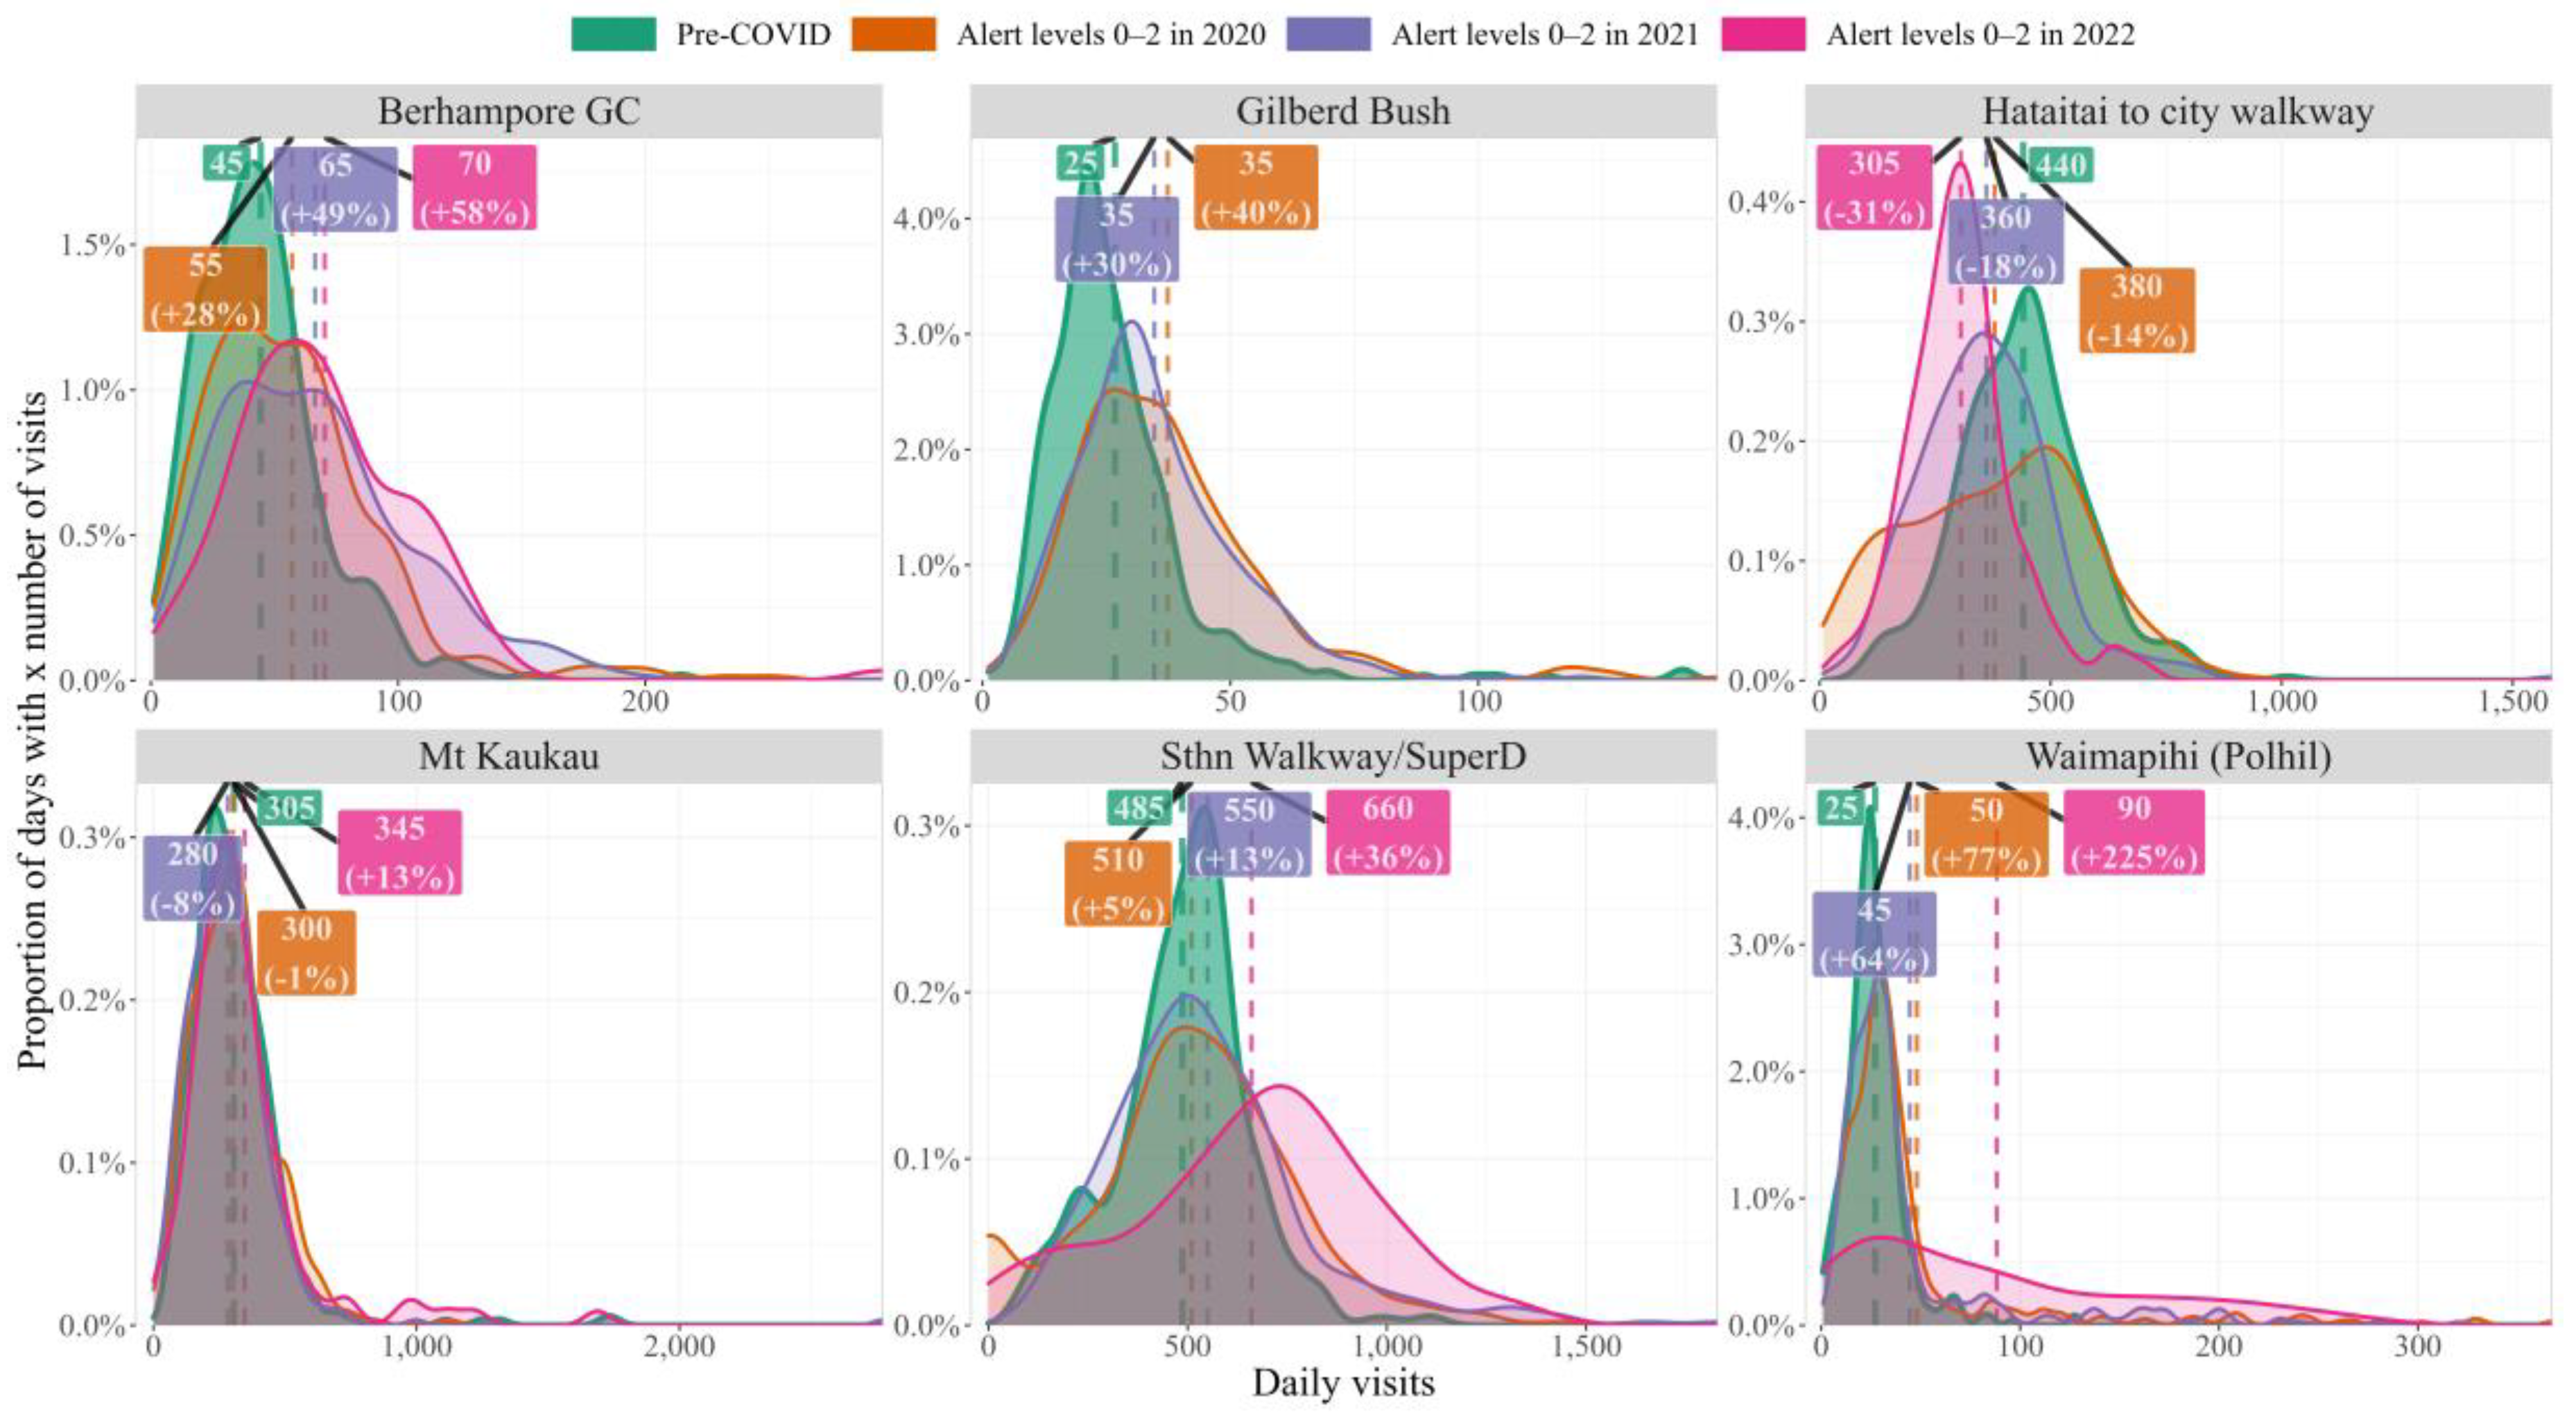
Figure 6.
The distribution of daily visits during low Alert Levels (0–2) in 2020 (orange), 2021 (purple), and 2022 (pink) compared to the pre-COVID-19 (2019) periods. The graphs show the proportion of days (y-axis) with a number of daily visitors (x-axis), and thus show how consistent the number of visits is. The mean daily visitors are also marked with a dashed line and label with this compared to 2019. All values have been corrected for mean monthly and weekend/weekday differences.
At high Alert Levels, there were also variations in the visit patterns of different green space trails. For example, the Hataitai to City Walkway is often used for people’s commute to work; however, with business and school closures and people working and studying from home, there was a decrease in the number of people on that trail, −78% in 2020, compared to an increase of 62% in 2021. Recreational bush trails, namely Waimapihi (Polhill) (+206% in 2020), Gilberd Bush (+308% in 2020 and +288% in 2021), and the Southern Walkway/Super D (+143% in 2021), saw dramatic increases in visits during the lockdowns. Several of the trails saw large increases in the day-to-day variance in the number of visits, especially Gilberd Bush and the Haitaitai to City Walkway.
At low Alert Levels (Figure 6), the differences from pre-COVID-19 visits were, as expected, more modest compared to high alert levels. Especially Mount Kaukau had little variation (−8% to +13%). The visit profile for both the Southern Walkway/Super D and Waimapihi (Polhill) became notably more variable compared to the other years for each. The Hataitai to City Walkway has seen decreased use in all years, suggesting the increase in use in 2021 high Alert Levels (Figure 5) may have been the result of increased leisure use of this trail while commuting use may have decreased overall.
3.2. Tanera Park Survey Analysis
On average, 60 stones were collected every day from the jars. During the first phase of the jar survey, which coincided with Alert Level 4, the jars that received the most stones were recreation and mental wellbeing, each accounting for a third of the total stones counted (Figure 7). During the second phase of the jar survey, which expanded the jar options and grouped them into three categories, mental wellbeing and recreation remained the main reasons for visiting the park. Stress relief and leisure were the jars that received the most stones during Alert Level 3, while the beauty and leisure jars became the most popular during Alert Level 2.
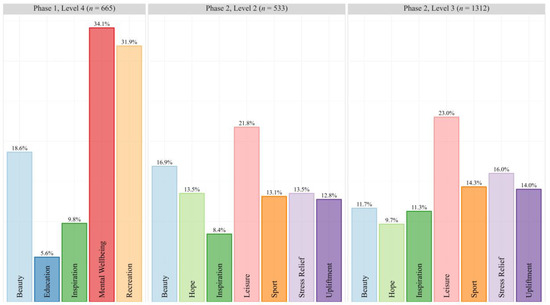
Figure 7.
Reasons for visiting Tanera Park during the COVID-19 lockdowns in Wellington. Phase 1 of the jar survey included five options. These options were expanded in phase 2 of the survey and grouped into the categories of mental wellbeing (upliftment, stress relief, and hope), recreation (sport and leisure), and aesthetics (beauty and inspiration).
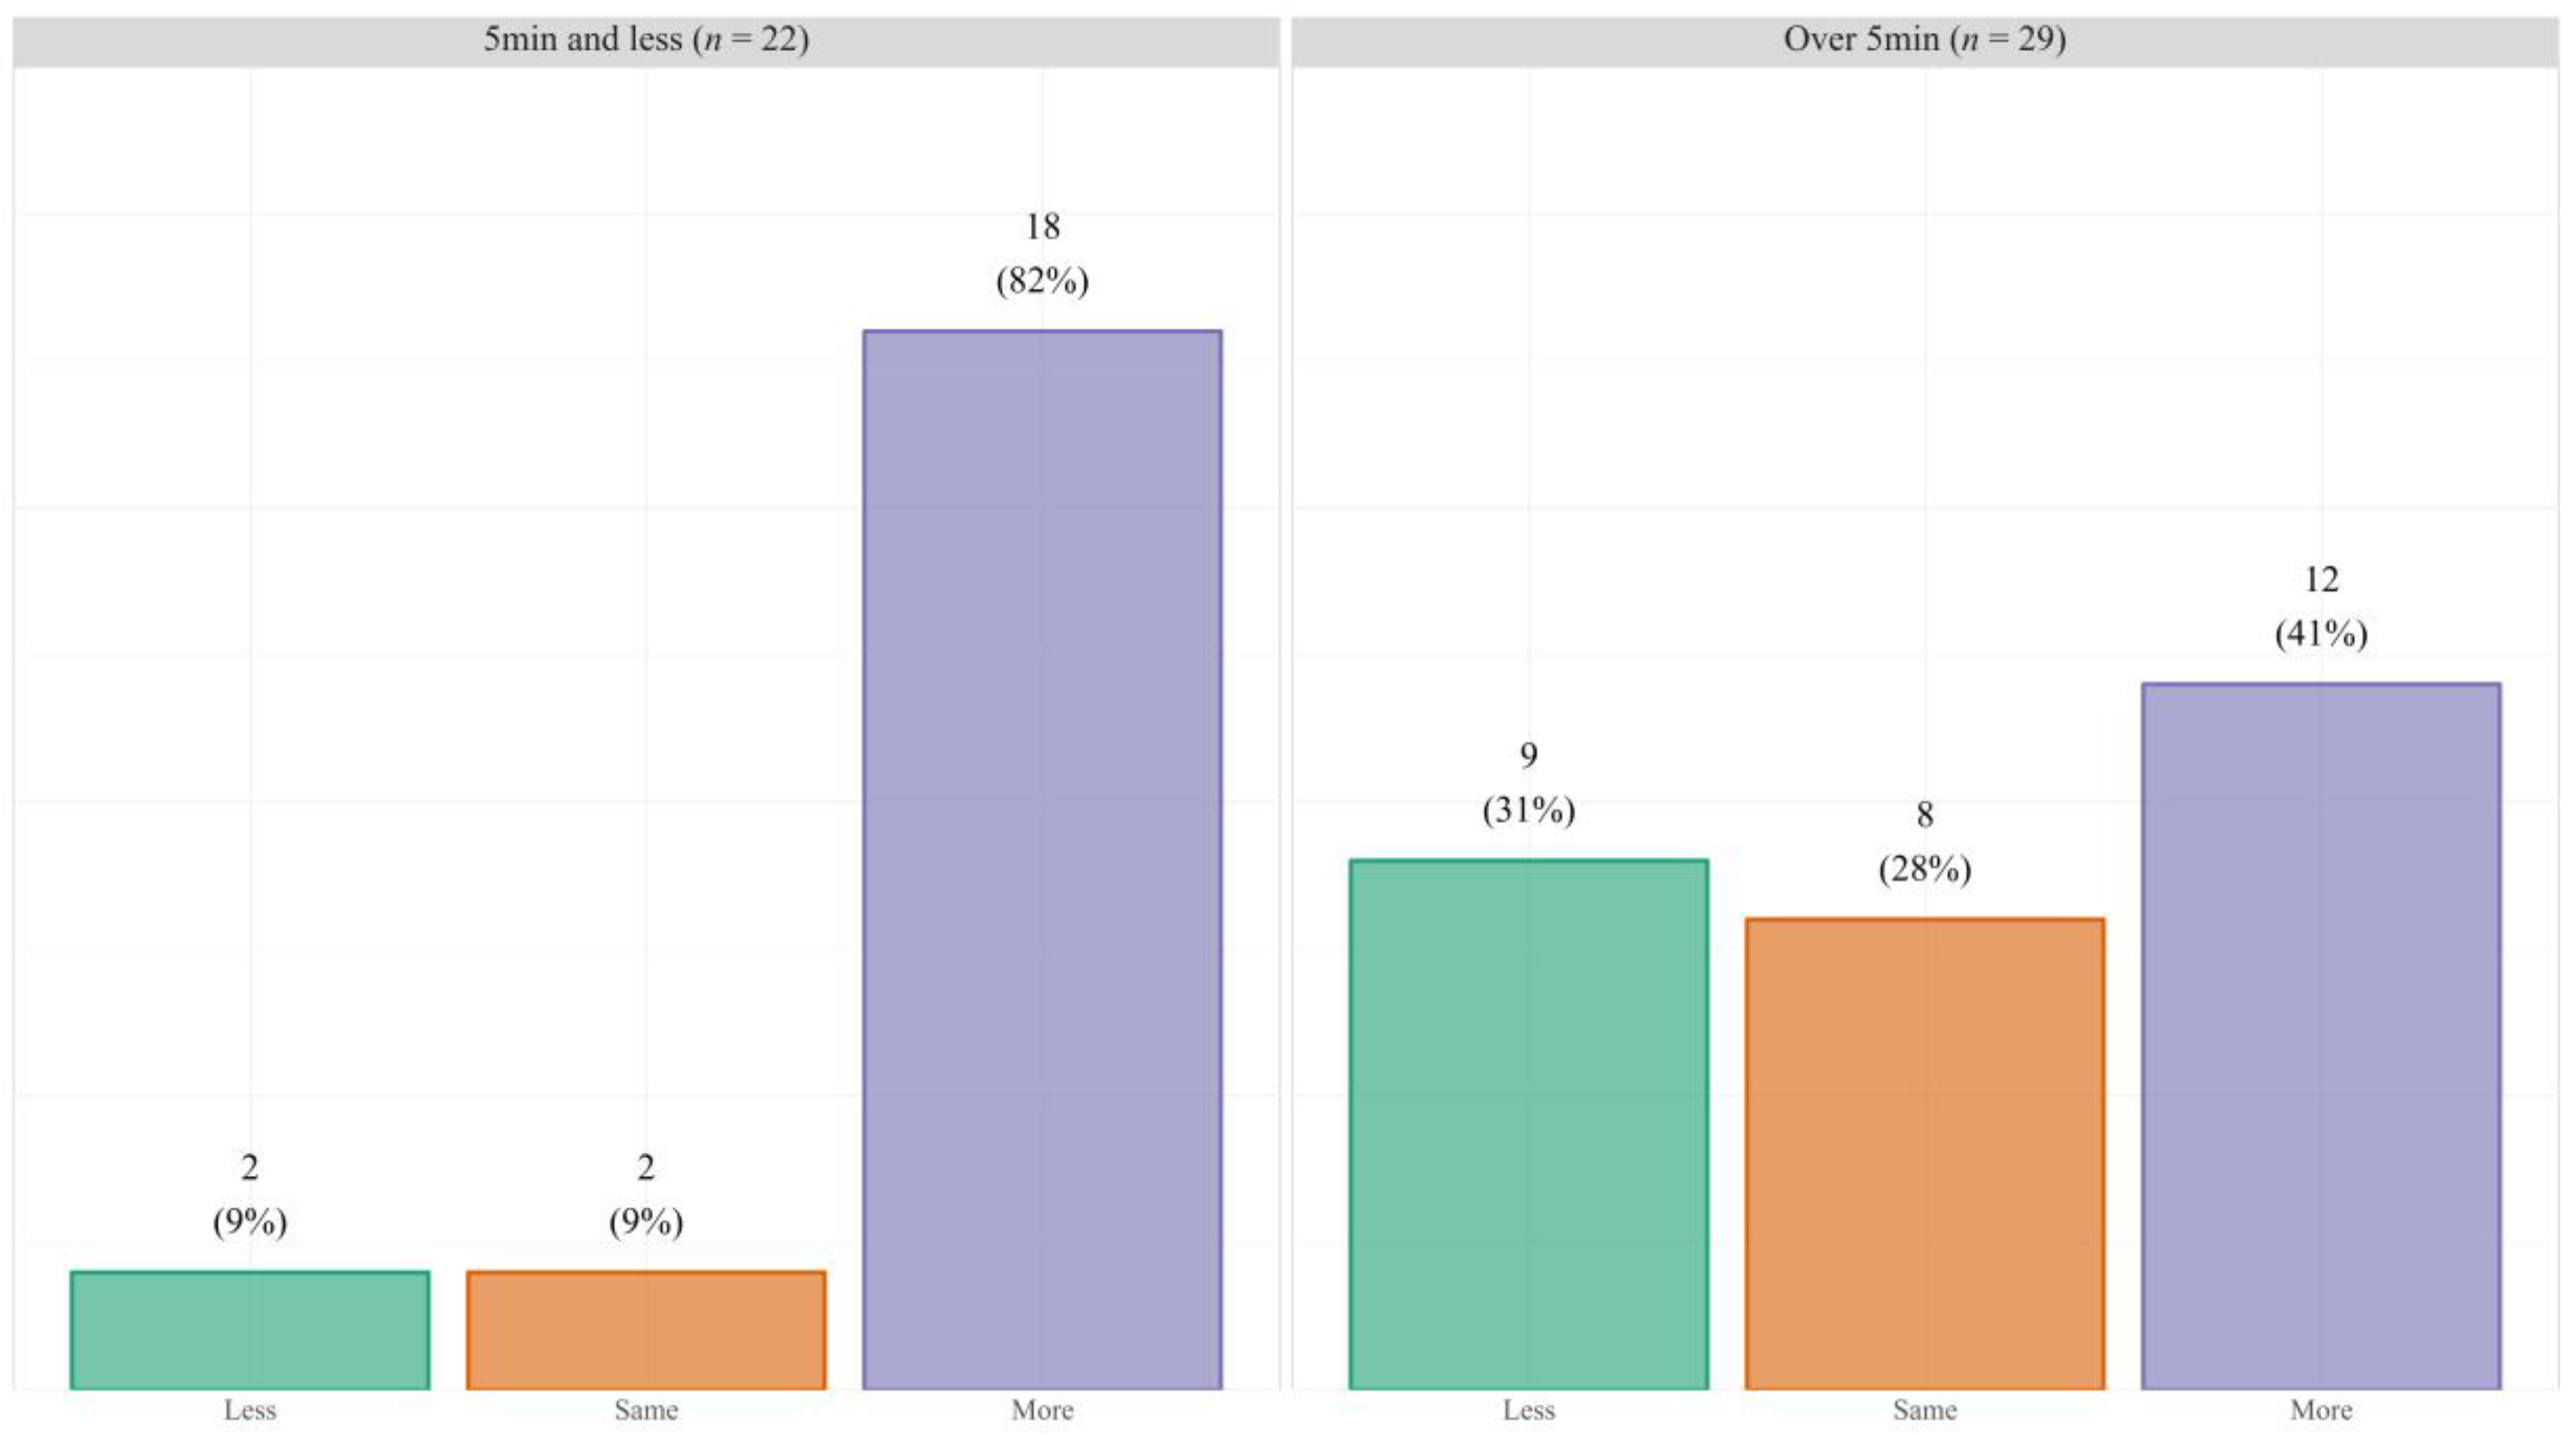
There were 134 responses to the online survey, of which 58 met the selection criteria of having visited and interacted with the jar installation in Tanera Park. The majority of the respondents lived within a 10 min walk from the green space. Over half (58%) of the respondents said they were visiting the park more frequently during the lockdowns than they did prior to them, with 19% stating they visited the same amount and 23% stating they visited less (Figure 8). The reasons for this could be grouped into four main themes: routine change, more time, lack of other options, and feeling confined indoors or cabin fever. With the removal of daily commutes, errands, and social activities, some respondents stated that visiting the park provided an opportunity to break up the monotony of their lockdown experience. With fewer commitments and more flexible working or schooling from home options, some respondents stated that they had more time in their day to walk and spend time in the park. The lack of other safe options for exercise and outdoor gatherings that abided by the social distancing guidelines was another reason some respondents visited the park. The proximity to their home and the spaciousness of the paths made Tanera Park more attractive than some of the neighbouring green spaces that had narrower paths. The most common theme in visitor responses was that of cabin fever. Respondents expressed a need for fresh air or to escape from the indoor confinement and isolation imposed by the lockdowns.

Figure 8.
Respondents’ respective walking distance from Tanera Park and their change in frequency of park visits during the COVID-19 lockdowns in Wellington.
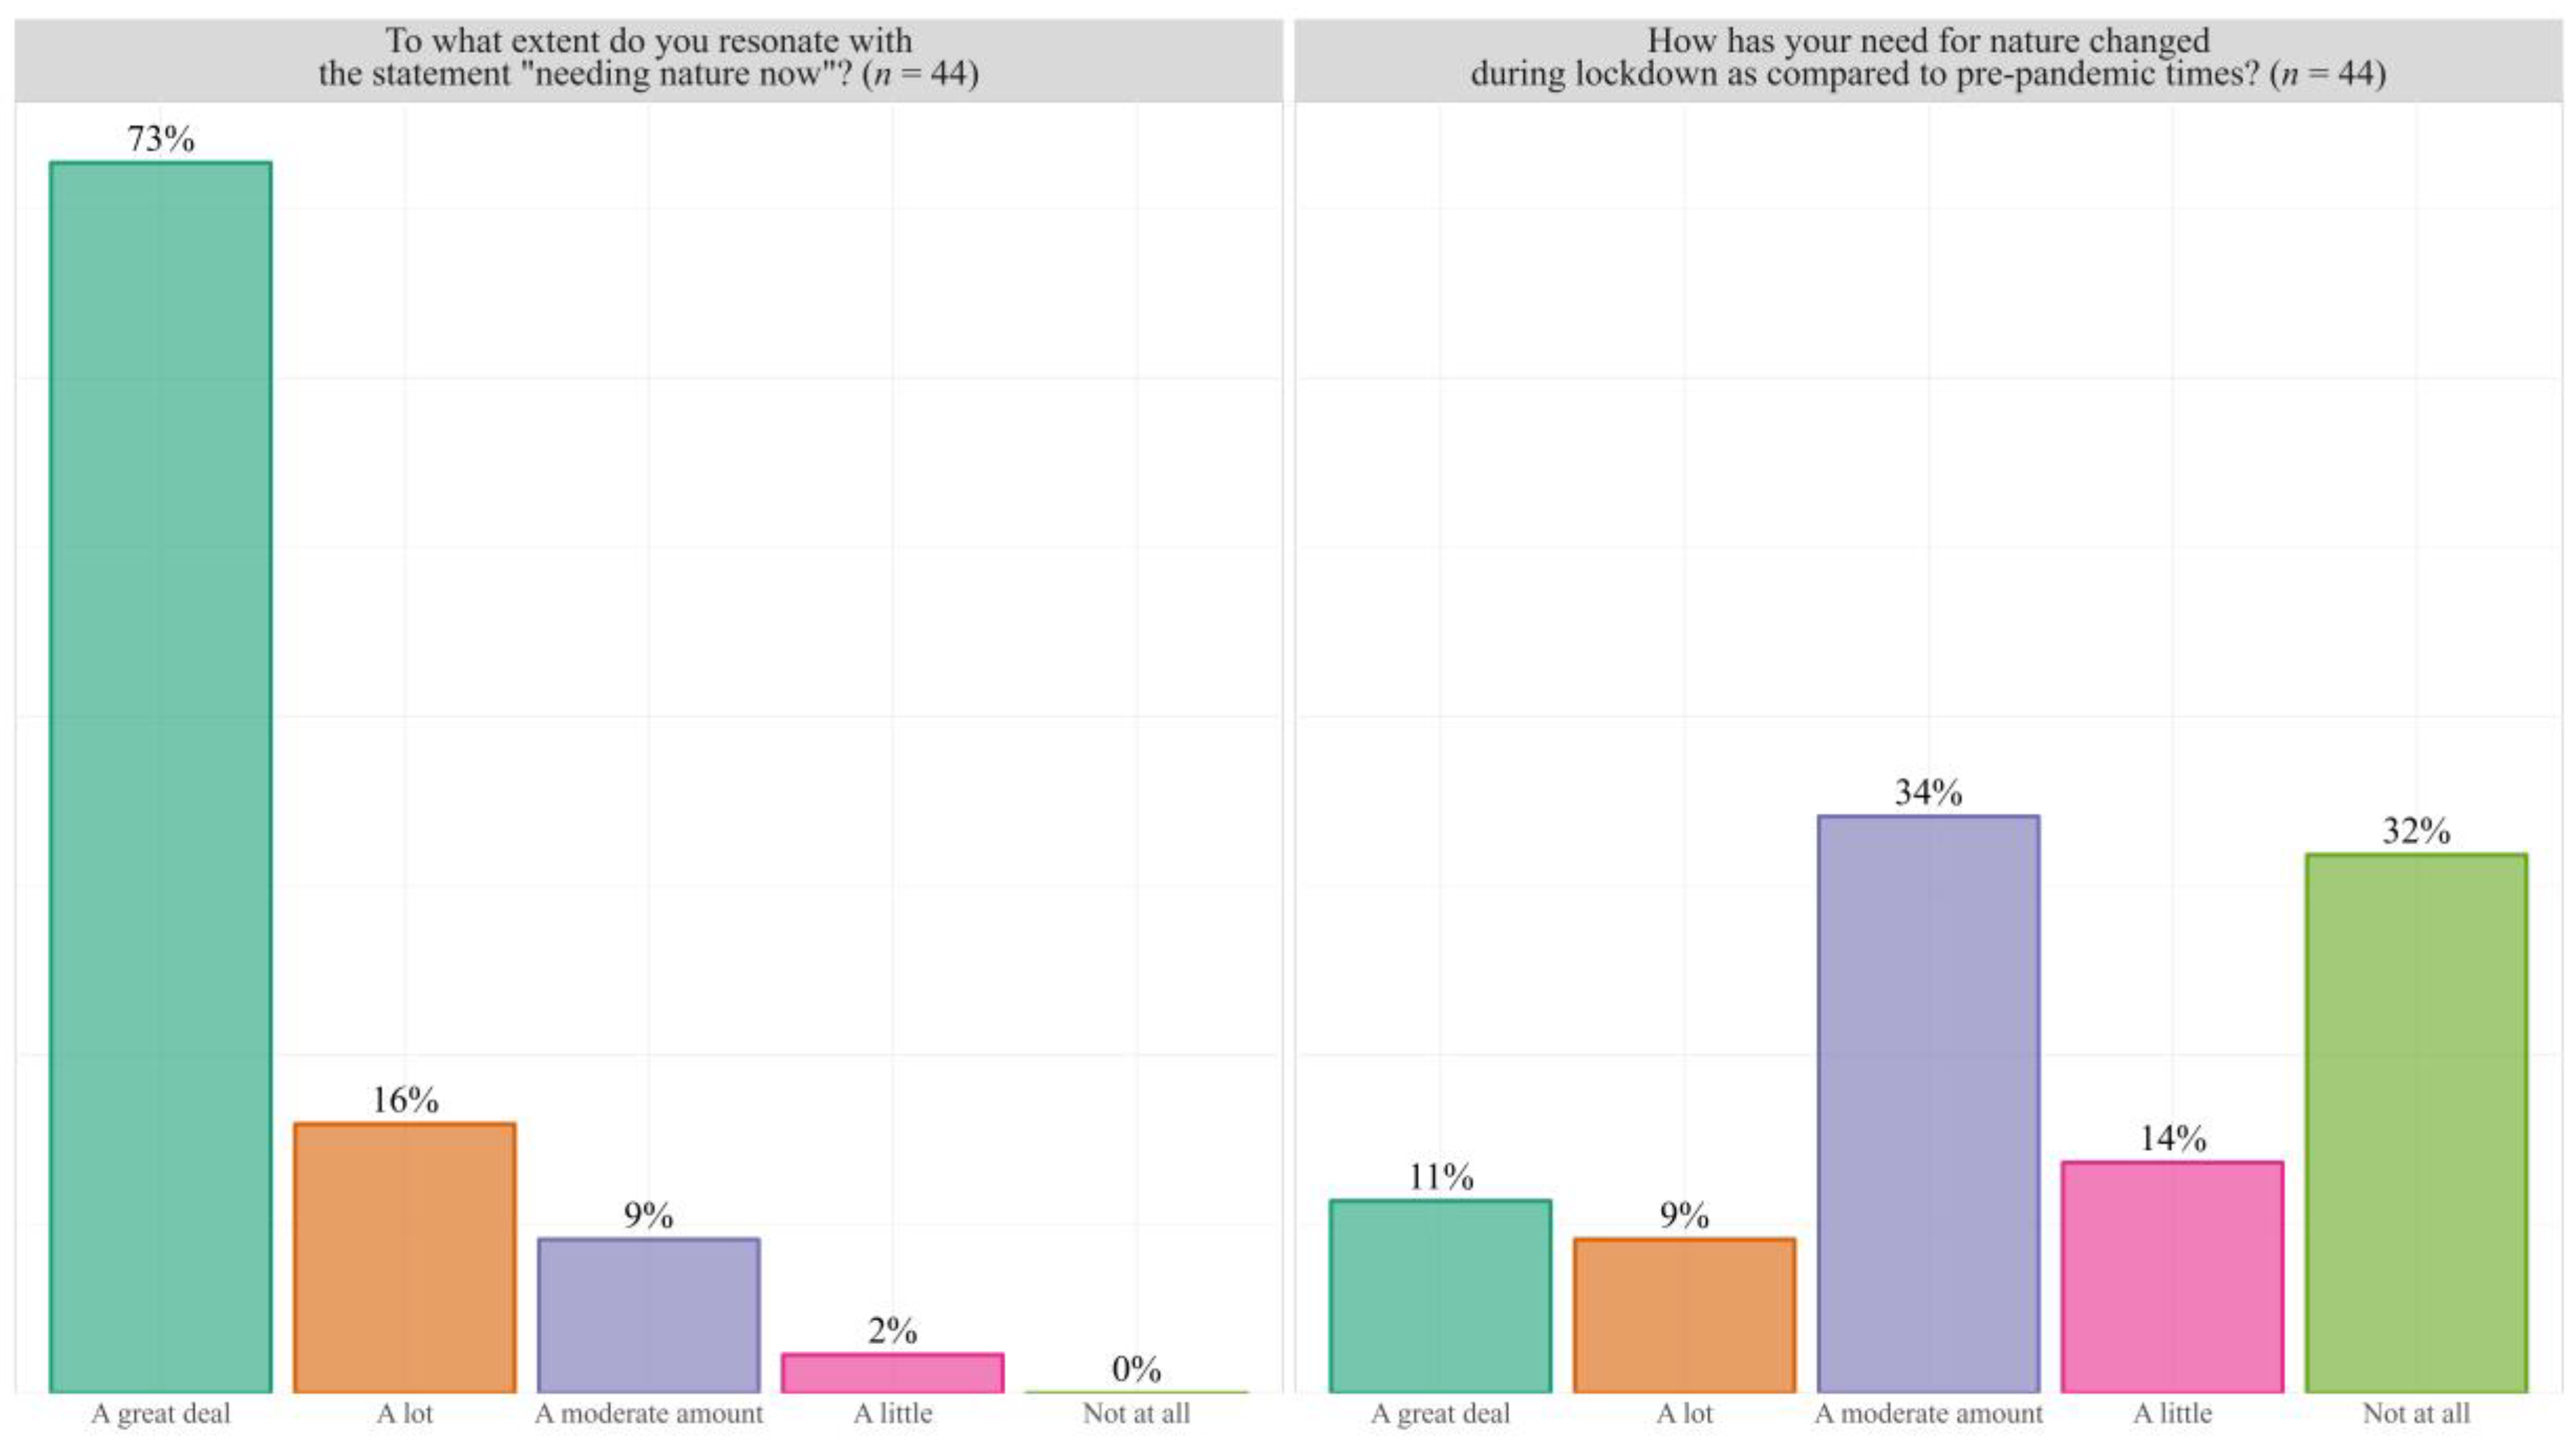
In response to the questions relating to their emotional states during the lockdowns, many respondents selected uncertainty and gratitude, followed closely by relaxation, stress, and anxiety. The varied and sometimes contradictory emotions selected reflect the complexity of the impacts of the lockdowns on mental wellbeing. However, the majority (77%) of the respondents answered that visiting the park helped alleviate some of their negative emotions. When asked how they thought the park helped them cope with negative emotions, some respondents answered that it helped them overcome uncertainty by providing a space for them to gain perspective and reflect. Others stated it helped them alleviate stress by providing an opportunity to escape from media and clear their mind. As one of the few options for social distancing, some respondents said the park helped combat loneliness by allowing safe social interactions. Some respondents said that the park offered a change of scenery and activity to alleviate cabin fever. Though many respondents recognised their need for the wellbeing benefits of nature, when asked to elaborate whether this need was more during the pandemic than it was before, the majority responded that their need for it remained the same (Figure 9). This indicates that many respondents recognise and rely on nature in their daily lives and not only in times of crisis and that other factors, such as more time and fewer other options, could have been the driver behind their increase in visits to the park.
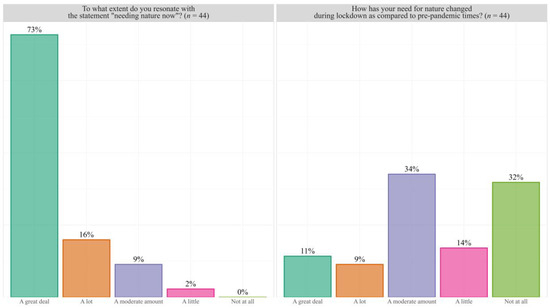
Figure 9.
The responses to two questions of the online survey. The questions were: to what extent do you resonate with the statement “needing nature now”, and how has your need for nature changed during the lockdown compared to the pre-pandemic period?
4. Discussion
The Wellington City Council pedestrian and cyclist counter data showed that there was an increase in urban green space visits during the COVID-19 lockdowns, with visit increases being the highest during the strictest Alert Level (3 and 4) periods. Biophilia is generally described as a subconscious affinity [1]; however, the Tanera Park surveys showed that the majority of visitors were conscious of and made use of nature-based coping mechanisms to alleviate negative emotions and lifestyle changes during the COVID-19 lockdowns, exemplifying the principles of urgent biophilia [11]. However, some important limitations to the data should be noted. The counters used recorded only the numbers of pedestrians or cyclists passing and did not track the patterns of individual users. Further research using individual tracker data could help isolate the changes in the total number of park visitors and individuals’ frequency of visits to the park during the COVID-19 lockdowns. Individual tracker data could also supplement the surveys conducted in this research, which were limited by small sample sizes and self-selected participants. No visitor sociodemographic information was collected by the counters or surveys. Future research using individual tracker data could help capture differences in green space usage or engagement with the surveys between subgroups of Wellington’s population.
Despite some data limitations, the results of this research support other surveys of New Zealand residents and their interactions with nature during the COVID-19 pandemic. The New Zealand Department of Conservation conducted qualitative interviews from November 2020 to January 2021 to understand how visitors’ participation and perspective towards the outdoors had changed as a result of the pandemic [38]. They found similar drivers, such as coping with anxiety, uncertainty, and change, behind people’s participation in the outdoors. An online panel survey of three standardised wellbeing measures found that New Zealanders experienced higher levels of severe psychological distress and anxiety during the COVID-19 lockdowns, particularly in young adults who reported the highest levels of suicidality [39]. However, compared to a cross-sectional study conducted in the UK, Gasteiger et al. [40] found that levels of anxiety and stress were significantly lower in New Zealand overall during the pandemic. A similar result was found in a study comparing mental health and wellbeing in the UK, Ireland, New Zealand, and Australia, with New Zealanders reporting the highest levels of mental health and wellbeing [41]. Another study by Sibley et al. [21] found that there was a small increase in psychological distress in New Zealanders as a result of the COVID-19 lockdowns; however, they also found that participants felt a greater sense of community. With limited indoor options for social gathering, this may suggest that the safe social gathering opportunities provided by urban green spaces contributed to wellbeing during stressful lockdown periods in addition to the restorative benefits of nature itself. Though perhaps skewed as a result of the travel restrictions during lockdowns, the majority of respondents lived within a 10 min walk from the park, demonstrating the importance of local green space accessibility for nature-based coping mechanisms. A study of New Zealanders’ physical activity during the March to May 2020 lockdown found that only half of the respondents were able to maintain their usual level of physical activity as a result of gyms closing [42]. A survey by Faulkner et al. [41] found that those who reported doing less exercise as a result of the COVID-19 lockdowns had reduced mental health and wellbeing. Because green spaces can be important locations for recreation and outdoor physical exercise, having accessible, evenly distributed green spaces in cities could increase opportunities for physical activity during closures of public and private exercise facilities. This is an additional reason why urban green space contributes to mental health and wellbeing and why it must be strategically incorporated across urban landscapes in relation to the spatial distribution of human population densities.
The increase in green space visits by urban residents for wellbeing benefits during the COVID-19 lockdowns found in this study also corroborates international research findings on green space usage during the pandemic. Using mobile tracking data, Venter et al. [43] found that recreational green space usage increased by 291% in Oslo, Norway, in comparison to a 3-year average for the same days after adjusting for other factors, such as weather. As with the results of this study, these findings demonstrate the importance of urban green space as a critical piece of resilience infrastructure during crises. Marconi et al. [44] found that the meaning of urban green space to survey respondents in Buenos Aires, Argentina, evolved from just a place to experience nature to an important piece of infrastructure in the city during the COVID-19 restrictions. Spatial analyses combined with online questionnaires were used by Robinson et al. [45] to find that respondents in England, UK, spent more time in nature during the pandemic, most stating it was for health and wellbeing benefits. They also found that higher amounts of green land cover within a 250 m radius from respondents’ homes were an important predictor of increased mental wellbeing [45]. A survey conducted by Berdejo-Espinola et al. [46] in Brisbane, Australia, found that nearly 80% of respondents stated their reason for visiting green spaces during the lockdowns was for physical and mental wellbeing. In their international survey, Ugolini et al. [47] found that pre-pandemic, the most popular reasons for visiting urban green space were relaxing and physical exercise. When the lockdowns limited access to urban green space, many respondents stated that it was the outdoor environment and social activity elements of green space that they missed the most. Pouso et al. [26] found that having contact with nature especially helped those under strict lockdown. Their international European survey found that individuals with accessible outdoor space and visible blue and green space had more positive emotions. Reid et al. [25] found significant reductions in depression and anxiety were associated with spending time in green space as well as residents’ perceived abundance of green space, after adjusting for sociodemographic and pandemic-related stressors.
5. Conclusions
This study combined quantitative data from pedestrian and cyclist counters with qualitative data from surveys to determine if and why the COVID-19 lockdowns changed Wellington residents’ green space visits. Our findings show that urban residents did actively seek out green space for restorative mental wellbeing benefits during the uncertainty and stress of the COVID-19 lockdowns, exemplifying the principles of urgent biophilia. In order to enhance the resilience of urban residents in the face of global crises, it is crucial to provide accessible green spaces and green infrastructure in cities to provide opportunities for residents to engage in nature-based coping mechanisms and thus positively affect mental health and wellbeing and resilience. Though urban green space accessibility discourse often focuses on mobility-restricted populations, the COVID-19 pandemic showed that accessibility is important for everyone during periods of crisis that restrict movements (lockdowns, natural disasters, etc.). Urban planners and policymakers must consider urban green infrastructure and spaces as a public health necessity and ensure a strategic distribution of green spaces across urban environments that correlates to where people live. Increasing the opportunities for individuals to engage in nature-based coping mechanisms during periods of normalcy and in times of crisis is essential for the current and future wellbeing of urban populations.
Author Contributions
Conceptualization, M.P.Z., R.M. and T.P.; methodology, R.M., K.G. and T.P.; writing—original draft preparation, M.M. and R.M.; writing—review and editing, M.M., M.P.Z., R.M. and K.G.; visualization, K.G. All authors have read and agreed to the published version of the manuscript.
Funding
This research received no external funding.
Institutional Review Board Statement
The study was conducted in accordance with the Declaration of Helsinki, and was approved by the Ethics Committee of Te Herenga Waka Victoria University of Wellington (application 28552, approved 26/05/20).
Informed Consent Statement
Informed consent was obtained from all subjects involved in the study, as per the approved 28552 Ethics application.
Data Availability Statement
Data supporting reported results can be found by contacting the authors.
Acknowledgments
We acknowledge the support of our various intuitions that enabled us to undertake this collaborative work. We also acknowledge the support of Utrecht University supervisors who contributed to interpreting Tanera Park results.
Conflicts of Interest
The authors declare no conflict of interest.
References
- Wilson, E.O.; Kellert, S.R. The Biophilia Hypothesis; Island Press: Washington, DC, USA, 1993. [Google Scholar]
- Browning, W.; Ryan, C.; Clancy, J. 14 Patterns of Biophilic Design; Terrapin Bright Green LLC: New York, NY, USA, 2014. [Google Scholar]
- Joye, Y.; de Block, A. Nature and I are two: A critical examination of the biophilia hypothesis. Env. Values 2011, 20, 189–215. [Google Scholar] [CrossRef]
- Roberts, A.B.L.; Kerr, G.; Lambert, S.; McWilliam, W.; Moore, K.; Quinn, J.; Simmons, D.; Thrush, S.; Townsend, M.; Blaschke, P.; et al. The Nature of Wellbeing: How Nature’s Ecosystem Services Contribute to the Wellbeing of New Zealand and New Zealanders; Department of Conservation: Wellington, New Zealand, 2015.
- Summers, J.K.; Smith, L.M.; Case, J.L.; Linthurst, R.A. A Review of the Elements of Human Well-Being with an Emphasis on the Contribution of Ecosystem Services. Ambio 2012, 41, 327–340. [Google Scholar] [CrossRef] [Green Version]
- Kellert, S.R.; Heerwagen, J.; Mador, M. Biophilic Design: The Theory, Science and Practice of Bringing Buildings to Life; John Wiley & Sons: Hoboken, NJ, USA, 2008; ISBN 9780470163344. [Google Scholar]
- Haase, D. Reflections on urban landscapes, ecosystems services and nature-based solutions in cities. Plan. Theory Pract. 2016, 17, 295–300. [Google Scholar] [CrossRef] [Green Version]
- Zari, M.P. Understanding and designing nature experiences in cities: A framework for biophilic urbanism. Cities Health 2019, 1–12. [Google Scholar] [CrossRef]
- Biophilic Cities. Our Vision: Connecting Cities and Nature. 2022. Available online: https://www.biophiliccities.org/our-vision (accessed on 1 May 2022).
- Russell, R.; Guerry, A.D.; Balvanera, P.; Gould, R.K.; Basurto, X.; Chan, K.M.A.; Klain, S.; Levine, J.; Tam, J. Humans and Nature: How Knowing and Experiencing Nature Affect Well-Being. Annu. Rev. Environ. Resour. 2013, 38, 473–502. [Google Scholar] [CrossRef]
- Tidball, K.G. Urgent Biophilia: Human-Nature Interactions and Biological Attractions in Disaster Resilience. Ecol. Soc. 2012, 17, 113–131. [Google Scholar] [CrossRef]
- Kondo, M.C.; Oyekanmi, K.O.; Gibson, A.; South, E.C.; Bocarro, J.; Hipp, J.A. Nature Prescriptions for Health: A Review of Evidence and Research Opportunities. Int. J. Environ. Res. Public Health 2020, 17, 4213. [Google Scholar] [CrossRef]
- Tidball, K.G.; Krasny, M.E. Greening in the Red Zone: Disaster, Resilience and Community Greening, 1st ed.; Springer: Amsterdam, The Netherlands, 2014; ISBN 90-481-9947-6. [Google Scholar]
- Millennium Ecosystem Assessment. Ecosystems and Human Well-Being: Synthesis; Island Press: Washington, DC, USA, 2005. [Google Scholar]
- Wendelboe-Nelson, C.; Kelly, S.; Kennedy, M.; Cherrie, J.W. A Scoping Review Mapping Research on Green Space and As-sociated Mental Health Benefits. Int. J. Environ. Res. Public Health 2019, 16, 2081. [Google Scholar] [CrossRef] [Green Version]
- Kilpatrick, A.M.; Salkeld, D.J.; Titcomb, G.; Hahn, M.B. Conservation of biodiversity as a strategy for improving human health and well-being. Philos. Trans. R. Soc. B Biol. Sci. 2017, 372, 20160131. [Google Scholar] [CrossRef] [Green Version]
- de Vries, S.; van Dillen, S.; Groenewegen, P.; Spreeuwenberg, P. Streetscape greenery and health: Stress, social cohesion and physical activity as mediators. Soc. Sci. Med. 2013, 94, 26–33. [Google Scholar] [CrossRef] [Green Version]
- van den Berg, M.; Wendel-Vos, W.; van Poppel, M.; Kemper, H.; van Mechelen, W.; Maas, J. Health benefits of green spaces in the living environment: A systematic review of epidemiological studies. Urban Urban Green. 2015, 14, 806–816. [Google Scholar] [CrossRef]
- Nutsford, D.; Pearson, A.; Kingham, S. An ecological study investigating the association between access to urban green space and mental health. Public Health 2013, 127, 1005–1011. [Google Scholar] [CrossRef]
- McDonald, R.I.; Beatley, T.; Elmqvist, T. The green soul of the concrete jungle: The urban century, the urban psychological penalty, and the role of nature. Sustain. Earth 2018, 1, 3. [Google Scholar] [CrossRef]
- Dennis, M.; Cook, P.A.; James, P.; Wheater, C.P.; Lindley, S.J. Relationships between health outcomes in older populations and urban green infrastructure size, quality and proximity. BMC Public Health 2020, 20, 626. [Google Scholar] [CrossRef]
- Officer, T.N.; Imlach, F.; McKinlay, E.; Kennedy, J.; Pledger, M.; Russell, L.; Churchward, M.; Cumming, J.; McBride-Henry, K. COVID-19 Pandemic Lockdown and Wellbeing: Experiences from Aotearoa New Zealand in 2020. Int. J. Environ. Res. Public Health 2022, 19, 2269. [Google Scholar] [CrossRef]
- Samuelsson, K.; Barthel, S.; Colding, J.; Macassa, G.; Giusti, M. Urban nature as a source of resilience during social distancing amidst the coronavirus pandemic. OSFPreprints 2020. [Google Scholar] [CrossRef]
- Sibley, C.G.; Greaves, L.M.; Satherley, N.; Wilson, M.S.; Overall, N.C.; Lee, C.H.J.; Milojev, P.; Bulbulia, J.; Osborne, D.; Milfont, T.L.; et al. Effects of the COVID-19 Pandemic and Nationwide Lockdown on Trust, Attitudes Toward Government, and Well-Being. Am. Psychol. 2020, 75, 618–630. [Google Scholar] [CrossRef]
- Reid, C.E.; Rieves, E.S.; Carlson, K. Perceptions of green space usage, abundance, and quality of green space were associated with better mental health during the COVID-19 pandemic among residents of Denver. PLoS ONE 2022, 17, e0263779. [Google Scholar] [CrossRef]
- Pouso, S.; Borja, Á.; Fleming, L.E.; Gómez-Baggethun, E.; White, M.P.; Uyarra, M.C. Contact with blue-green spaces during the COVID-19 pandemic lockdown beneficial for mental health. Sci. Total Environ. 2021, 756, 143984. [Google Scholar] [CrossRef]
- Stats NZ. Estimated Population of NZ. Available online: https://www.stats.govt.nz/indicators/population-of-nz (accessed on 4 April 2022).
- National Crisis Management Centre. National Action Plan. 2020. Available online: https://covid19.govt.nz/assets/resources/legislation-and-key-documents/COVID-19-national-action-plan-2-issued-1-April.pdf (accessed on 29 April 2022).
- Global Data Lab. Our World in Data: COVID-19 Stringency Index. Available online: https://ourworldindata.org/explorers/coronavirus-data-explorer?uniformYAxis=0&hideControls=true&Interval=7-day+rolling+average&Relative+to+Population=true&Color+by+test+positivity=false&country=USA~ITA~CAN~DEU~GBR~FRA&Metric=Stringency+index (accessed on 18 April 2022).
- id (Informed Decisions) for Wellington City Council. Population and Household Forecasts 2013 to 2043. Available online: https://forecast.idnz.co.nz/wellington/home (accessed on 23 July 2021).
- Rastandeh, A.; Pedersen Zari, M.; Brown, D.K.; Vale, R. Analysis of landform and land cover: Potentials for urban biodiversity conservation against rising temperatures. Urban Policy Res. 2019, 37, 338–349. [Google Scholar] [CrossRef]
- Rastandeh, A.; Brown, D.K.; Pedersen Zari, M. Site selection of urban wildlife sanctuaries for safeguarding indigenous biodi-versity against increased predator pressures. Urban Urban Green 2018, 32, 21–31. [Google Scholar] [CrossRef]
- Blaschke, P.; Chapman, R.; Gyde, E.; Howden-Chapman, P.; Ombler, J.; Pedersen Zari, M.; Perry, M.; Randal, E. Green Space in Wellington’s Central City: Current Provision, and Design for Future Wellbeing; New Zealand Centre for Sustainable Cities: Wellington, New Zealand, 2019. [Google Scholar]
- World Health Organization (WHO). Urban Green Spaces and Health; WHO Regional Office for Europe: Copenhagen, Denmark, 2016. [Google Scholar]
- Beatley, T. Handbook of Biophilic City Planning and Design; Island Press: Washington, DC, USA, 2016; pp. 75–84. [Google Scholar]
- Eco-Counter. Products. Available online: https://www.eco-counter.com/products/ (accessed on 15 April 2022).
- Manaaki Whenua—Landcare Research. Land Cover Database Version 5.0, Mainland New Zealand. Available online: https://lris.scinfo.org.nz/layer/104400-lcdb-v50-land-cover-database-version-50-mainland-new-zealand/ (accessed on 30 March 2022.).
- Department of Conservation. Resilience through Nature: Qualitative Research Providing Insights into New Zealanders’ Outdoors Participation during Lockdown Levels, September 2021. Available online: https://www.doc.govt.nz/globalassets/documents/about-doc/role/visitor-research/resilience-through-nature.pdf (accessed on 20 April 2022).
- Every-Palmer, S.; Jenkins, M.; Gendall, P.; Hoek, J.; Beaglehole, B.; Bell, C.; Williman, J.; Rapsey, C.; Stanley, J. Psychological distress, anxiety, family violence, suicidality, and wellbeing in New Zealand during the COVID-19 lockdown: A cross-sectional study. PLoS ONE 2020, 15, e0241658. [Google Scholar] [CrossRef]
- Gasteiger, N.; Vedhara, K.; Massey, A.; Jia, R.; Ayling, K.; Chalder, T.; Coupland, C.; Broadbent, E. Depression, anxiety and stress during the COVID-19 pandemic: Results from a New Zealand cohort study on mental well-being. BMJ Open 2021, 11, e045325. [Google Scholar] [CrossRef]
- Faulkner, J.; O’Brien, W.J.; McGrane, B.; Wadsworth, D.; Batten, J.; Askew, C.D.; Badenhorst, C.; Byrd, E.; Coulter, M.; Draper, N.; et al. Physical activity, mental health and well-being of adults during initial COVID-19 containment strategies: A multi-country cross-sectional analysis. J. Sci. Med. Sport 2021, 24, 320–326. [Google Scholar] [CrossRef]
- Meiring, R.M.; Gusso, S.; McCullough, E.; Bradnam, L. The Effect of the COVID-19 Pandemic Movement Restrictions on Self-Reported Physical Activity and Health in New Zealand: A Cross-Sectional Survey. Int. J. Environ. Res. Public Health 2021, 18, 1719. [Google Scholar] [CrossRef]
- Venter, Z.S.; Barton, D.N.; Martinez-Izquierdo, L.; Langemeyer, J.; Baró, F.; McPhearson, T. Interactive spatial planning of urban green infrastructure—Retrofitting green roofs where ecosystem services are most needed in Oslo. Ecosyst. Serv. 2021, 50, 101314. [Google Scholar] [CrossRef]
- Marconi, P.L.; Perelman, P.E.; Salgado, V.G. Green in times of COVID-19: Urban green space relevance during the COVID-19 pandemic in Buenos Aires City. Urban Ecosyst. 2022, 25, 941–953. [Google Scholar] [CrossRef]
- Robinson, J.M.; Brindley, P.; Cameron, R.; MacCarthy, D.; Jorgensen, A. Nature’s Role in Supporting Health during the COVID-19 Pandemic: A Geospatial and Socioecological Study. Int. J. Environ. Res. Public Health 2021, 18, 2227. [Google Scholar] [CrossRef]
- Berdejo-Espinola, V.; Suárez-Castro, A.F.; Amano, T.; Fielding, K.S.; Oh, R.R.Y.; Fuller, R.A. Urban green space use during a time of stress: A case study during the COVID-19 pandemic in Brisbane, Australia. People Nat. 2021, 3, 597–609. [Google Scholar] [CrossRef]
- Ugolini, F.; Massetti, L.; Calaza-Martínez, P.; Cariñanos, P.; Dobbs, C.; Ostoić, S.K.; Marin, A.M.; Pearlmutter, D.; Saaroni, H.; Šaulienė, I.; et al. Effects of the COVID-19 pandemic on the use and perceptions of urban green space: An international exploratory study. Urban For. Urban Green. 2020, 56, 126888. [Google Scholar] [CrossRef]


Publisher’s Note: MDPI stays neutral with regard to jurisdictional claims in published maps and institutional affiliations. |
© 2022 by the authors. Licensee MDPI, Basel, Switzerland. This article is an open access article distributed under the terms and conditions of the Creative Commons Attribution (CC BY) license (https://creativecommons.org/licenses/by/4.0/).