Abstract
Public sports facilities have the potential to improve their functions as active living infrastructures (ALIs) in combination with bicycle lanes and green spaces. A favorable sequence of exercise intensities in different scenes is important for individuals to take physical activity scientifically. Our research aimed to explore the feasibility of promoting and consolidating this sequence using reasonable daily exercise routes concatenated by public sports facilities, green spaces, and bicycle lanes. Taking 25 major public sports facilities in Nanjing as an example, we obtained the cycling routes from open-source data and delineated the facilities’ cycling catchment areas to assess the coordination of bicycle lanes and facilities. Further, we evaluated the potential interactions between facilities and green spaces by checking the spatial intersections between park entrances and the above routes. The results revealed that with the integration of bicycle lanes, public sports facilities could provide services to most residential areas, and potential interactions between the facilities and parks existed already. Therefore, it was feasible to design reasonable daily exercise routes coupled with the existing facility layout. Moreover, the service gaps and potential interactions were affected by the layout of the facilities, the density of the bicycle lanes, the configuration of green spaces, and the official planning proposals. This research advances the understanding of how public sports facilities can be pivotal to the cooperation of ALIs with other infrastructures.
1. Introduction
Urban health problems deriving from sharp conflicts between social development and environmental problems due to rapid urbanization have attracted increasing attention. Thus, the practice of a “healthy city” has been carried out in diverse and unique ways universally [1,2,3,4]. Public infrastructures for health promotion came into being in response to the active life concept of “integrating physical activity into daily life” [5,6]. Not only the layout design of these infrastructures, but the ways citizens use and experience them, are hot issues in urban planning.
According to the statistical yearbook of diseases and clinical experience, in recent years, physical inactivity has caused various chronic diseases [7]. During the COVID-19 pandemic, studies found a correlation between chronic disease and the risk of severe illness and death [8,9]. As early as 2010, the WHO proposed global recommendations on physical activity for health to prevent non-communicable diseases through increased activity at the population level [10]. It suggested that mild exercise could not meet the demands of healthy living, and that moderate or vigorous exercise is necessary. Exercise of mixed intensities can be beneficial in many aspects, such as letting individuals challenge themselves in a tolerable way and maximizing the benefits of exercise in a relatively short time. It has been found that placing some moderate exercises prior to milder ones is more beneficial because of the greater fat oxidation and lower stress it elicits [11].
Public sports facilities featuring professional training and support facilities serve as critical exercise and active-living hubs for citizens. Understanding how well these facilities work and their layouts is crucial. The literature on public sports facilities focuses on walking accessibility, spatial layout, and optimal site selection [12,13,14]; on relevance with the built environment, specificity, the regional population, and economy [15,16,17]; on the types of sports provided [18]; and on the users of the facilities [19,20]. However, there is a gap between the importance placed on public sports facilities for promoting exercise and the research done on it. The propensity for going to public sports facilities is affected by travel convenience and experience. Focusing on the travel convenience, the assessment of the facility service capacities provides the basis for improving the convenience, in which the delineation of catchment areas is an important method. In the literature, the methods of delineating catchment areas are based mainly on radius and straight-line distance, and on consumption costs [21,22,23]. When shifting the focus to the travel experience, the travel routes and the places passed need to be addressed. The effects of the surrounding built environment, perceived availability, individual preference, etc., need to be considered.
How to encourage citizens to take daily exercise is a comprehensive issue where urban infrastructures should be included as research objects. Public sports facilities play an irreplaceable role in sports infrastructure and must interact with other infrastructures, such as transportation infrastructures and green infrastructures, etc., to provide services more efficiently. However, the possibilities of such interactions depend on the spatial layout in ways rarely discussed in the literature [6,24]. We summarized the infrastructures for promoting daily exercise, such as bicycle lanes, walkways, open spaces, and sports facilities as “active living infrastructure” (ALI) [6]. Considering the popularity, user modes, intensity of exercise provided, and morphological characteristics, we selected bicycle lanes and parks from ALIs as the interactive objects of public sports facilities in our study.
Cycling is a non-motorized mode of travel that combines low carbon emissions and exercise [25], which not only improves the health of the population but reduces inequality [26,27]. Cycling has prominent advantages over walking in short- and medium-distance travel because of its range and speed. However, cycling infrastructure is more sporadic and temporary than walking infrastructure [6]. In healthy city practices, the importance of bicycle lanes has been recognized; Los Angeles, Amsterdam, and New York in particular have put forward bike-friendly design guidelines. COVID-19 has made cycling an important part of daily travel, especially for commuting, in many cities around the world [28]. In the long term, cycling can also reduce the consumption of fossil fuels.
Compared with public sports facilities and bicycle lanes, green spaces have stronger neighborhood effects due to their larger size and more flexible boundaries [29,30]. Parks are important green spaces where mild exercise can be carried out to mitigate the negative effects of vigorous exercise [31,32]. Green spaces improve health not only physically but also psychologically. A study on emotional health risks pointed out that green spaces and water are critical to mitigate the negative emotional hazards in high-risk areas [33]. Another study has found that the perceived availability of green space has positive implications for health [34]. Adding parks to travel routes can improve the travel experience and increase the benefits of exercise for cyclists. In addition, studies have also shown that people who visit parks frequently also have positive attitudes toward bicycles and physical exercise [35].
We began our study by analyzing the coordination of bicycle lanes and facilities by delineating facilities’ cycling catchment areas. A new research method was used to delineate public sports facilities’ cycling catchment areas, relying on big data. Given the closed or semi-closed form of residential communities in China, which result in longer distances than previous models, we used the Baidu Map API to obtain travel routes and residential areas. Using the catchment areas, we then evaluated the service capabilities of public sports facilities according to different indexes. By measuring the residential areas, population and number of residential buildings served by facilities through bicycle lanes, we provided a reference for the coordination between sports facilities and bicycle lanes in the quantification. Second, we studied the spatial intersections between cycling routes and park entrances to explore the potential interactions between the facilities and green spaces for cyclists. The research results can show planners the underserved areas and the cycling routes that meet the need for the reasonable daily exercise routes we envisioned intuitively. On the basis of our research, planners can also consider high-frequency bicycle lanes as references for greenway construction. Our findings will help urban planners improve the layout of ALIs and extend the influence of public sports facilities.
2. Materials and Methods
2.1. Study Area and Subjects
Nanjing, which hosted the Youth Olympic Games in 2014, is the only city in China besides Beijing to have hosted international Olympic events. By 2021, 148 public sports facilities and 174.6 km of greenways had been built in Nanjing. That year, the per-capita area of gymnasiums in Nanjing reached 3.23 square meters, much higher than the average of Chinese cities [36]. The study area covered the main urban region of Nanjing, including six districts: Xuanwu, Qinhuai, Jianye, Gulou, Qixia (part), and Yuhuatai (part). These encompassed 44 sub-districts (Jie-dao), an area of 308.52 km2, and a population of around 3.66 million (according to 100 × 100 m precision raster data from 2010).
Because of the longer travel distances of cycling and the clear intentions of cyclists, we selected more comprehensive and attractive public sports facilities as study subjects. According to the classification requirements (Table 1) and planning documents proposed in the Master Plan of Nanjing in 2019, there are 25 “city and district level” (city/province level, and district/new town level) public sports facilities meeting the need (Figure 1).

Table 1.
Four-level classification of public sports facilities in Nanjing.
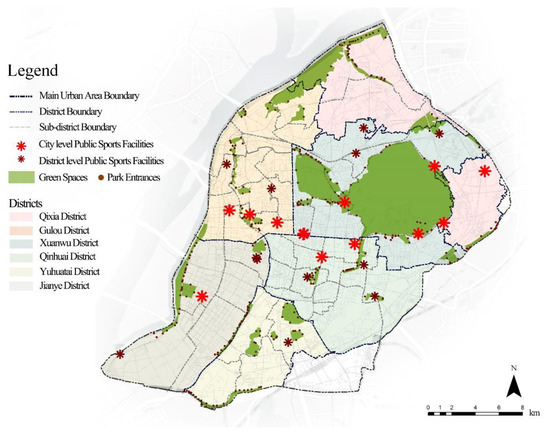
Figure 1.
Distribution of public sports facilities in the study.
2.2. Data Sources
We took the cycling routes from residences to public sports facilities as crucial data and superimposed the following data onto it: the outlines of the administrative districts, the locations of public sports facilities, the locations of residential buildings, the outlines and areas of residential communities, the local population information, the outlines of parks, and the locations of entrances to those parks.
The location data on public sports facilities and park entrances were corrected by a field investigation. The location data for residential buildings were based on POI queries that included the geographical coordinates of a large number of residential buildings in the study area. The cycling routes from residences to sports facilities were based on the routes recommended by the Baidu Map API, which included information on the distance, duration, and start and end points [37]. The local population data were based on the population density data for Nanjing (100 × 100 m precision raster data from 2010). The outlines of the administrative districts used were those of the municipal administrative divisions and sub-district administrative divisions of Nanjing. Closed and semi-closed communities are special residential agglomeration forms in China, usually having relatively clear enclosed boundaries. The outlines of the residential communities were based on the area of interest (AOI) queries in the Baidu Map API.
2.3. Methods and Indexes
We superimposed the above data and used indexes to delineate the cycling catchment areas to assess the service capacities of the facilities and identify the spatial intersections between cycling routes and park entrances. The procedures (Figure 2) and relevant indexes (Table 2) are given below.
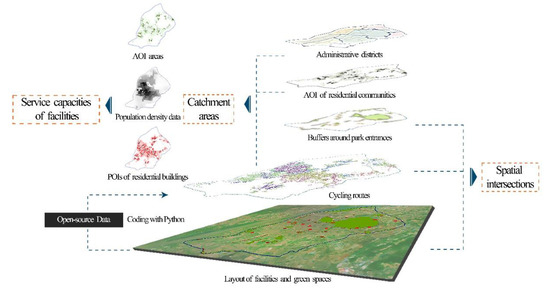
Figure 2.
Operating flow of the study.

Table 2.
Relevant indexes.
Step 1. Using the Baidu map API and a ground survey, we identified the entrances of 25 public sports facilities (72 entrances) and 50 parks (318 entrances).
Step 2. Coding with Python, we called the POI and AOI query functions on the Baidu Map to search for the POIs of residential buildings and the AOIs of residential communities within 80 square kilometers around 25 public sports facilities.
Step 3. With Python, we called the tourism navigation function of the Baidu Map to search for the recommended cycling routes connecting public sports facilities to the POIs of residential buildings. The routes were then screened with time thresholds of 15, 10, and 5 min.
Step 4. We used ArcGIS10.6 to superimpose the POIs of residential buildings and the AOIs of residential communities onto cycling routes to delineate the cycling catchment areas. Then, the administrative districts, populations, and core densities of the POIs were combined to let us evaluate the service capabilities at different levels.
Step 5. We used ArcGIS10.6 to create 500 m and 50 m buffers separately around the entrances to the parks. One precondition for cyclists to enter a park is perceived availability. The buffers were based on the visibility of people and the built environment. A distance of 500 m is one at which people can recognize the outlines of things, and it is close to the diameter of many parks in Nanjing. It was thus considered as an idealized standard for cyclists to recognize that a park is nearby. Considering the road width and the occlusion of buildings, we defined 50 m as the standard for cyclists to be able to see a park entrance in detail. The buffers were superimposed onto the cycling routes to analyze the spatial intersections between the routes and entrances and the potential interactions between public sports facilities and parks.
3. Results
3.1. Service Capacities of Public Sports Facilities Based on Bicycle Lanes
3.1.1. Service Capacities of Facilities at the City Level
The service areas, service populations, and service POIs of public sports facilities within 5, 10, and 15 min are given in Table 3. The service-area and service-population data showed that the service capacity of the public sports facilities was not satisfactory, and the service POIs indicated that the facilities served more than half of the residential building POIs. This might be due to differences in residential aggregation and a varying population density. Because residential buildings were the main areas for citizens’ daily activities and future occupancy of vacant housing, we compared the residential building POIs’ nuclear density and cycling catchment areas to evaluate the rationality of the distribution of a public sports facility.

Table 3.
Service capacities of facilities within 5, 10, and 15 min at the city level.
On the whole, there was a spatial consistency between the residential building POIs and the cycling catchment areas within 5, 10, and 15 min. The service areas were consistent with a high nuclear density (Figure 3), meaning the current distribution of public sports facilities was generally reasonable. The inconsistency between the service areas and nuclear density indicated that there were underserved areas in the northwest and southeast. The service capacities of the facilities in the central areas were better than those in the peripheral areas of the city.
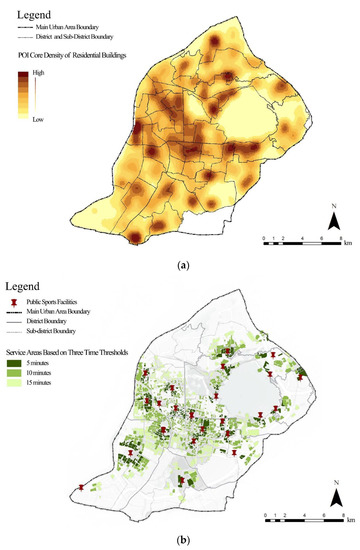
Figure 3.
Spatial consistency and inconsistency between POI core density of residential buildings and service areas based on time thresholds. (a) POI core density of residential buildings; (b) service areas based on time thresholds.
3.1.2. Service Capacities of Facilities at the District Level
The results showed that different indexes at this level had different priorities in judging the results of a beneficiary status (Table 4). Within 5, 10, and 15 min, Qinhuai and Gulou Districts had the best benefits when the service population was taken as the measurement standard. When the other two indexes were used as the standard, Qinhuai and Xuanwu Districts received a better service.

Table 4.
Service capacities of facilities within 5, 10, and 15 min at the district level.
In addition, within the different time thresholds, the beneficiary status of each district was different (Figure 4). Within 5 min, the public sports facilities in Jianye District had 1281 service POIs, significantly more than the rest. This indicates that the facilities there were spatially closer to the surrounding residential buildings, and the service capacity for short-distance travel in this district was higher than in the others. Within 15 min, the service areas of Xuanwu District were the largest, as was the service population. This means that the facilities in Xuanwu District had the strongest service capacity for long-distance travel.
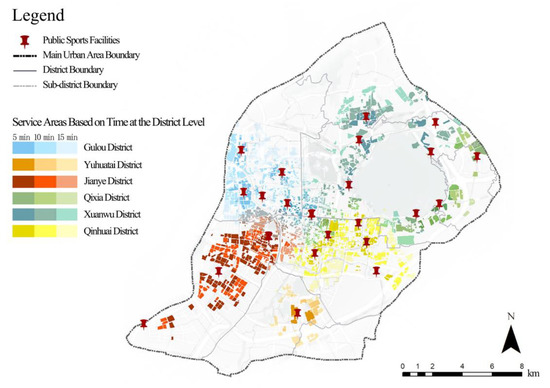
Figure 4.
Service areas based on time thresholds at the district level.
3.1.3. Optional Capacities of Facilities at the Sub-District (Jie-Dao) Level
At the micro scale, we changed the perspective, adding optional capability as a standard. Following the definition of the assignment of POIs, we summed the assignments of every sub-district (Jie-dao) and divided the total by the area of each (Figure 5). The results showed that Fenghuang Jie-dao, Chaotiangong Jie-dao, and Laowucun Jie-dao had the best optional capabilities. Huaqiao Road Jie-dao, Xinjiekou Jie-dao, Meiyuan Xincun Jie-dao, and Hongwu Road Jie-dao were second. The reason for this might be that these streets had longer histories than the rest. The older Jie-dao in cities were more likely to have higher building densities and better public infrastructures, including bicycle lanes and sports facilities, at all levels.
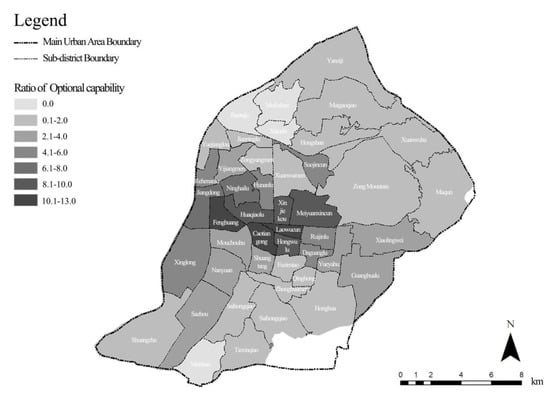
Figure 5.
Optional capacities at the sub-district level.
3.1.4. Ranking of Facilities by Service Capacity
According to planning documents, the government has built sports facilities at different levels with the concept of a “10 min life circle.” We ranked the service capacities of the facilities by three indexes within 10 min (Figure 6). The results show that the service capacity was inconsistent with the facilities’ level. Some district-level facilities had high service capacities, such as Nanhu Gymnasium and Jianye Amateur Sports School, while some city-level facilities had a low capacity. The reason might be that some city-level facilities were massive, usually those in newly built areas, while the surrounding infrastructures were incomplete. By contrast, the scale of district-level facilities was smaller, and they were usually surrounded by dense residential buildings, and a better surrounding infrastructure.
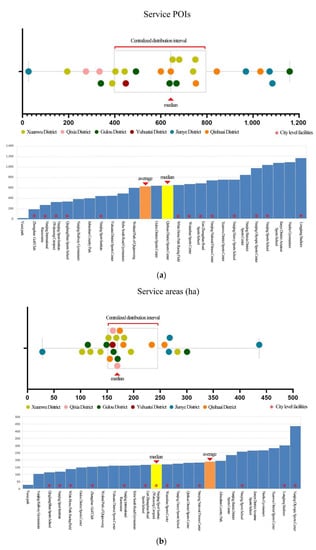
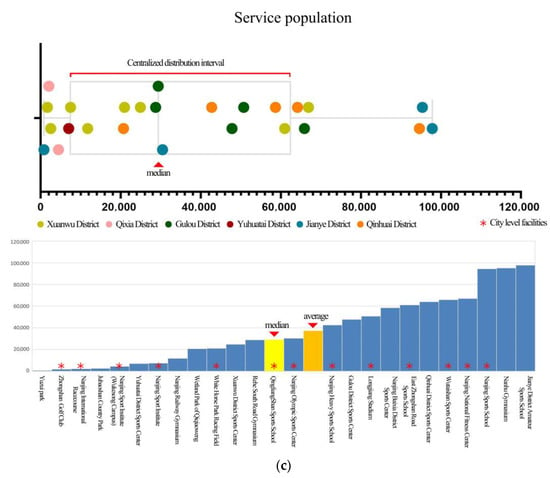
Figure 6.
Ranking of public sports facilities by three indexes. (a) Service POIs; (b) service areas; (c) service population.
3.2. Potential Interaction between Green Spaces and Facilities by Bicycle Lanes
We screened 15,249 routes intersecting the buffers (Figure 7), accounting for 54.8% of the total samples (27,840 routes). Every district owned routes that met the conditions, but the qualified routes only in Qinhuai, Jianye, Yuhuatai, and Qixia Districts exceeded 50% of the samples in themselves (Table 5).
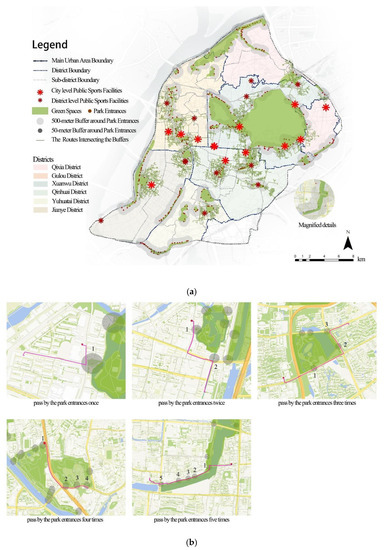
Figure 7.
Cycling routes intersecting buffers. (a) Routes intersecting 500- and 50 m buffers all over the study areas; (b) five examples of routes intersecting 50 m buffers.

Table 5.
Number of routes intersecting the buffers.
Xuanwu District had the most routes, and Qixia District had the fewest. Xuanwu District had the most greenspaces and facilities, and the spatial distances between them were close. In Xuanwu District, the public sports facilities were almost all distributed along the edges of the green spaces. This was confirmed by the proportion of qualified routes. In Qixia District, however, there were only two facilities, both in the south of the district, and the green spaces were mainly in the north, meaning they were completely separated. Yuhuatai District also had fewer qualified routes than the other districts, but mainly because there were only one facility and fewer route samples in this area. To judge by the proportion of qualified routes, the green spaces and facilities in Yuhuatai District were not separated. To be precise, through a field survey, we found that the only public sports facility in this district was indeed close to green spaces.
3.2.1. Probability of Interaction during Travel
We defined the probability of the interaction between public sports facilities and parks during travel as the ratio of the length of one route intersecting 500 m buffer zones to the length of the route itself. The ratios for all the qualified routes were greater than 0, which means that interactions could occur on all of them. The higher the ratio, the longer cyclists would stay within the influence of the parks, and the greater the probability of an interaction.
The results showed that the characteristic of probability in each district was different (Table 5, Figure 8). The probability of an interaction in Qinhuai, Jianye, and Gulou Districts were not centralized, while those in Xuanwu, Yuhuatai, and Qixia Districts were clustered. In the extreme case, the probability of an interaction above 0.75 exceeded 80% of Xuanwu District, which might be caused by the similarity of qualified routes. Moreover, the probability above 0.5 exceeded 50% of every district, except Qixia Districts. It meant that the great probability of an interaction occurred on many qualified routes, where reasonable measures could be taken to turn the probability into a reality.

Figure 8.
Probability of interaction.
3.2.2. Times of One Route Passing by Park Entrances
A total of 7287 routes were screened, accounting for 26.2% of the total samples (Table 5). The qualified routes exceeded 50% of the samples only in Yuhuatai District. Qixia District had the fewest qualified routes with only three. Most of the routes passed park entrances only once, and the number was 5979. In the extreme case of Xuanwu District, however, there were 20 routes that passed the entrances five times each (Figure 9). By the number of qualified routes and times passing entrances, Xuanwu and Qinhuai Districts did better than the others. This means that the potential interactions between the public sports facilities and parks in those two districts were already strong.

Figure 9.
Times of one route passing park entrances.
4. Discussion
4.1. Reasons for the Service Capacity Gaps of Public Sports Facilities in Cycling Access
We compared the service capacities of public sports facilities on the basis of cycling catchment areas, which showed the current coordination of bicycle lanes and public sports facilities. The spatial distributions of underserved areas showed that the service capacities of the facilities in peripheral areas were inferior to those in central areas, especially in the northwest and southeast. This means that residents of central areas could fully enjoy public sports facilities by cycling, but those in peripheral areas benefited less. This result appears to be consistent with previous studies [39]. Moreover, the service capability gap was reflected not only in service areas, service populations, and service POIs, but in the optional capability. We also discovered, contrary to common sense, that the service capacities of facilities were inconsistent with the construction levels: some district-level facilities had much greater capacities than some city-level facilities.
The service capability gap between facilities in urban centers and those in peripheral areas was caused by differences in the population, housing density, and infrastructure construction. There were highly clustered residential communities in the southeast and northwest of the peripheral areas, even denser than some central areas, but lacking city- and district-level facilities. This phenomenon reflected the fact that the population aggregation in those areas exceeded the infrastructure planning, resulting in the vacancy of the public sports facilities. Not only that, the population density, residential density, and bicycle lane density in the city center were much higher than in the peripheral areas, which also affected the service capacities of the sports facilities at different levels. Both the city- and district-level facilities showed great service capacities in the city center. By contrast, the capacities of some city-level facilities in the peripheral areas were even worse than those of district-level facilities in the city center. This was not caused by the facilities themselves; in fact, the facilities in the peripheral areas were newly built and well equipped. The main reasons were that the construction of nearby supporting infrastructure was imperfect, the residential populations were small, and the vacancy rate of residential buildings was high. This means that those facilities had high idle service capacities for a period of time. The same phenomenon occurred in other cities [12,40]. However, in China, this kind of idleness is usually short term. It is a characteristic of civic planning in China that construction often precedes population migration. It was difficult for us to predict social changes, such as housing occupancy and migration in the region, but the Chinese government is accustomed to guiding population agglomeration in this way. In addition, the topographical aspects of the city affected the service capacity, especially at the sub-district (Jie-dao) level. Zhong Mountain and XuanWu Lake are located in northeast Nanjing and create geographical obstacles to bicycle travel.
4.2. Factors in the Potential Interaction between Parks and Facilities
We evaluated the potential interactions between public sports facilities and parks by identifying the spatial intersections between park entrances and cycling routes. The gap in the number of qualified routes confirmed the distances between green spaces and sports facilities. It turned out, though the planners might not have intended this, that green spaces and sports facilities were mostly located close together, which is worth thinking about. In districts with large numbers of routes, facilities were mostly located around parks; these included Xuanwu, Qinhuai, Gulou, and Jianye Districts. In Xuanwu District in particular, the facilities were distributed almost along the edge of Zhong Mountain. The numbers of qualified routes in Yuhuatai and Qixia Districts were small, but their situations differed. The facilities were not far from green spaces in Yuhuatai District, which was consistent with the high proportion of qualified routes. By contrast, the number and proportion of qualified routes in Qixia District were both small, which was consistent with the spatial separation of green spaces and facilities in this district.
Moreover, we found clustering in the probability of an interaction, which might be related not only to the distances between green spaces and facilities, but to the road network structure. The clustering was caused by similarity among routes: some routes shared the same segment, and it was these segments that intersected the buffers around park entrances. This might mean that improving those route segments would benefit a larger number of routes. By counting the times of a single route passing by park entrances, we found that most routes passed entrances once or twice, and only a few routes passed more often. This might be caused by the morphological characteristics of green spaces. The most extreme example was in Xuanwu District, where routes passed park entrances five times. This was due to the park being banded and having a shape similar to that of the routes themselves.
4.3. Thinking about Exercise Promotion in a More Operational Way
A large number of studies have explored the topic of the built environment promoting exercise, from multiple perspectives. Green spaces, sports facilities, and bicycle lanes are widely discussed and are often regarded as independent research objects [41,42,43,44,45]. Some scholars have recognized that active living infrastructure is not independent, however. They have proposed the importance of creating urban systems with sports spaces, facilities, and green space connected [46,47,48]. However, that is only a general suggestion. The research on how to promote daily exercise with the help of public infrastructure in more operational ways is insufficient. What we conceived is a specific scenario: the reasonable daily exercise route. We think this is a way to make the system more concrete and operable. This scenario is one kind of urban system in which sports facilities are connected with green spaces by bicycle lanes. We mainly verified the feasibility of such a system and suggested how to implement the system by focusing on specific objects. Some detailed implementation methods are described in Section 4.4. Other researchers could also construct a system by imagining other scenarios, as we did, and could implement their system by verifying the feasibility and analyzing how to improve it for different objects.
4.4. Optimization of Suggestions
4.4.1. Solutions to the Shortage of Public Sports Facilities
The scale of additional facilities must be judged in accordance with the long-term regional development plan, future permanent population, and so forth. It is necessary to propose new facilities in the southeast and northwest areas or to upgrade the existing, low-level facilities. In addition, there were some universities in these underserved areas. Their gymnasiums included excellent sports apparatus and might be opened to the public, which has been a trend [49]. That would require the government to take the lead and improve management systems to alleviate the imbalance between public demand and the available resources. In the central areas, due to land shortage and complex land transactions [50], it would be difficult to add facilities on a large scale. We suggest that the management department increase the sports equipment and projects in the existing facilities, add new entrances and exits, and improve the surrounding environment to reduce travel obstacles [51].
4.4.2. Planning of Bicycle Lanes That Combine Green Spaces and Public Sports Facilities
The planning of bicycle lanes must be done in consideration of exercise travel routes and green spaces. The density of the bicycle lanes in the peripheral areas was low, which is true in many Chinese cities [52]. We suggest that when adding bicycle lanes, planners pay attention not only to the economic and social conditions of the surrounding areas but to the coordination of bicycle lanes with public sports facilities. Bicycle-oriented spaces should also receive attention. Previous studies have shown that micro-scale built environments, such as wider roads with more streetlights and trees, a higher sky openness, and a proximity to mountains and water, facilitate running [53,54]. Similarly, bicycle-oriented spaces are easily incorporated into the urban fabric through the design of streetscapes, greenways, or greenbelts to promote cycling and improve the travel experience. By observing the cycling routes in the study, we were able to identify the high-use road segments, which would be valuable for improvement.
In addition, cycling routes that have spatial intersections with parks are of a special significance. Benefiting from the strong neighbor effects of parks and perceived access to green spaces, these routes could exert their influence in multiple ways that might be valuable for greenway planning. At the time of the study, the concept of riding friendship was still in its infancy in China, and only a few big cities, such as Shenzhen and Beijing, attached importance to it [55,56]. Improvements to bicycle-oriented spaces will enhance the riding experience and promote the development of friendly riding in other Chinese cities.
4.4.3. Encouragement of Cyclists and Users of Public Sports Facilities to Enter Parks
It is worthwhile to encourage cyclists and users of public sports facilities to enter parks, in view of the preference of the population and the characteristics of different training intensities. One of the most direct ways to do so is to make people aware of the presence of the park, for instance by placing guide signs to increase the possibility of an interaction. Interactions between the 500 m buffer and cycling routes could provide locations for these signs. Furthermore, reducing the barriers around park entrances will help people recognize parks visually [57]. The feelings produced on the way to the park, such as insecurity or a fear of injury, can also affect one’s willingness to enter. It is necessary to provide a safe environment for people to travel from public sports facilities to parks. Last but not least, it is crucial to spread awareness that mixed-intensity exercise and reasonable exercise sequences can promote a healthy lifestyle.
4.5. Advantages and Limitations
We used a new method to get data from open-source data and defined indexes in the Chinese context to delineate the catchment areas. Open-source data were more convenient, precise, and informative than traditional sources. Depending on how people perceived physical distance and the characteristics of residential communities in China, we gathered the AOIs of residential communities from local big-data platforms to determine service areas. This research method expresses respect for regionalism. Next, we checked for spatial intersections between the park entrances and cycling routes to evaluate potential interactions between the facilities and parks. The 500 m and 50 m buffers around park entrances were designed with different meanings, and the problem was simplified to the intersections of geometric figures.
The limitations to this study include the following. We ignored some complexities of the real situation. For example, residential buildings and communities were reduced to geometric figures, ignoring differences in the number of households, building density, and community size. Our evaluations of the potential interactions were also based only on whether people could see parks, ignoring various other influences on their observations, such as the attractiveness of different parks, psychological conditions while cycling, and one’s attention level after physical training.
5. Conclusions
This study expands how public sports facilities are viewed and considers them as active living infrastructures from a comprehensive perspective. First, we employed big data to acquire cycling routes from residential buildings to public sports facilities and to delineate cycling catchment areas. This step was focused on linking citizens and sports facilities through bicycle lanes and evaluating the current service capacity. Our findings provided insights into underserved areas and service capacity gaps, and especially into why and how these arose at different scales. Second, we identified spatial intersections between park entrances and cycling routes and then selected the regions with better existing conditions. The results revealed that parks could be seen during travel from residential buildings to public sports facilities, even if they were not deliberately designed this way. Planners need to improve the perceptibility of parks to cyclists, however, for instance by increasing the guide signs, reducing shielding, and providing safe environments to encourage people to enter parks.
In addition, we would like to express the view that the infrastructure for promoting an active life is not an independent matter. This fact can be recognized if we design some example scenarios. By ordering sports in intensity from moderate to mild, we were able to design an operable system connecting public sports facilities and green spaces. Other researchers could construct similar systems to connect sports spaces and green spaces by imagining other scenarios. We believe that our method can function as a reference. In addition, researchers can further study the routes we selected. These routes are based on bicycle lanes, which have the potential to become high-quality greenways, connecting residential areas, parks, and public sports facilities. Researchers can continue to evaluate them using different indicators, such as green visibility, service scope, and carbon emission, etc., to find the best daily exercise routes to recommend, or they can identify the segments with the highest usage among the routes we chose, as references for greenway planning.
Furthermore, the Baidu Map API provided us with a new way to obtain data. In comparison with the traditional acquisition methods, big data are promptly updated and informative, and should be recognized for this. All in all, we hope to have demonstrated the feasibility of concatenating daily exercise routes with public sports facilities, bicycle lanes, and green spaces, to promote healthy city development in China.
Author Contributions
Conceptualization, Z.X. and Y.C.; methodology, Y.C. and Z.X.; software, Y.C. and R.Z.Z.; validation, M.L., B.Z. and R.Z.Z.; formal analysis, Y.C., B.Z. and M.L.; investigation, Y.C; resources, Z.X.; data curation, Y.C.; writing—original draft preparation, Y.C. and Z.X.; writing—review and editing, Z.X., Y.C., B.Z. and M.L.; visualization, Y.C.; supervision, Z.X.; project administration, Z.X.; funding acquisition, Z.X. All authors have read and agreed to the published version of the manuscript.
Funding
This research was funded by Humanity and Social Science Foundation of Ministry of Education (20YJAZH115), Postgraduate Research & Practice Innovation Program of Jiangsu Province (SJCX22_0326), National Natural Science Foundation of China (52078254, 31971721) and Priority Academic Program Development of Jiangsu Higher Education Institutions (PAPD).
Institutional Review Board Statement
Not applicable.
Informed Consent Statement
Not applicable.
Data Availability Statement
Not applicable.
Acknowledgments
The authors would like to thank anonymous reviewers for their helpful comments on this article.
Conflicts of Interest
The authors declare no conflict of interest.
References
- Active living by design (ALbD)–RWJF [EB/OL]. Available online: https://healthyplacesbydesign.org/project/robert-wood-johnson-foundation-active-living-by-design/ (accessed on 28 June 2022).
- Active design guidelines: Promoting physical activity and health in design [EB/OL]. Available online: https://www1.nyc.gov/site/planning/plans/active-design-guidelines/active-design-guidelines.page (accessed on 19 June 2022).
- Shafique, M.; Kim, R.; Kyung-Ho, K. Green roof for stormwater management in a highly urbanized area: The case of Seoul, Korea. Sustainability 2018, 10, 584. [Google Scholar] [CrossRef]
- Shafique, M.; Kim, R. Recent progress in low-impact development in South Korea: Water-management policies, challenges and opportunities. Water 2018, 10, 435. [Google Scholar] [CrossRef]
- Active living network [EB/OL]. Available online: https://www.oakgov.com/health/partnerships/echo/Pages/active-living-network.aspx (accessed on 8 June 2022).
- Le Gouais, A.; Foley, L.; Ogilvie, D.; Guell, C. Decision-making for active living infrastructure in new communities: A qualitative study in England. J. Public Health 2019, 42, 249–258. [Google Scholar] [CrossRef] [PubMed]
- Guthold, R.; Ono, T.; Strong, K.L.; Chatterji, S.; Morabia, A. Worldwide variability in physical inactivity. A 51-country survey. Am. J. Prev. Med. 2008, 34, 486–494. [Google Scholar] [CrossRef] [PubMed]
- Meister, T.; Pisarev, H.; Kolde, R.; Kalda, R.; Suija, K.; Milani, L.; Karo-Astover, L.; Piirsoo, M.; Uuskula, A. Clinical characteristics and risk factors for COVID-19 infection and disease severity: A nationwide observational study in Estonia. PLoS ONE 2022, 17, 0270192. [Google Scholar] [CrossRef]
- Semenzato, L.; Botton, J.; Drouin, J.; Cuenot, F.; Dray-Spira, R.; Weill, A.; Zureik, M. Chronic diseases, health conditions and risk of COVID-19-related hospitalization and in-hospital mortality during the first wave of the epidemic in France: A cohort study of 66 million people. Lancet Reg. Health–Eur. 2021, 8, 100158. [Google Scholar] [CrossRef]
- Global recommendations on physical activity for health [EB/OL]. Available online: https://www.who.int/publications/i/item/9789241599979 (accessed on 18 June 2022).
- Kang, J.; Schweitzer, J.S.; Hoffman, J.R. Effect of order of exercise intensity upon cardiorespiratory, metabolic, and perceptual responses during exercise of mixed intensity. Eur. J. Appl. Physiol. 2003, 90, 569–574. [Google Scholar] [CrossRef]
- Chen, Y.; Lin, N.; Wu, Y.; Ding, L.; Pang, J.; Lv, T. Spatial equity in the layout of urban public sports facilities in Hangzhou. PLoS ONE 2021, 16, 0256174. [Google Scholar] [CrossRef]
- Huang, T. Facility layout optimization of urban public sports services under the background of deep learning. Comput. Intell. Neurosci. 2022, 13, 1748319. [Google Scholar] [CrossRef]
- Sun, F.; Zhang, J.; Ma, J.; Wang, C.; Hu, S.; Xu, D. Evolution of the spatial-temporal pattern and social performance evaluation of community sports and fitness venues in Shanghai. Int. J. Environ. Res. Public Health 2022, 19, 274. [Google Scholar] [CrossRef]
- Ma, X.; Cui, H.; Tang, K. Supply-side reform measures of public sports service from the perspective of public health promotion. Rev. Bras. Med. Esporte 2021, 27, 53–55. [Google Scholar] [CrossRef]
- Prins, R.R.G.; Ball, K.; Timperio, A.; Salmon, J.; Oenema, A.; Brug, J.; Crawford, D. Associations between availability of facilities within three different neighbourhood buffer sizes and objectively assessed physical activity in adolescents. Health Place 2011, 17, 1228–1234. [Google Scholar] [CrossRef] [PubMed]
- Billaudeau, N.; Oppert, J.-M.; Simon, C.; Charreire, H.; Casey, R.; Salze, P.; Badariotti, D.; Banos, A.; Weber, C.; Chaix, B. Investigating disparities in spatial accessibility to and characteristics of sport facilities: Direction, strength, and spatial scale of associations with area income. Health Place 2011, 17, 114–121. [Google Scholar] [CrossRef] [PubMed]
- Panter, J.; Jones, A.; Hillsdon, M. Equity of access to physical activity facilities in an English city. Prev. Med. 2008, 46, 303–307. [Google Scholar] [CrossRef]
- Lee, S.A.; Ju, Y.J.; Lee, J.E.; Hyun, I.S.; Nam, J.Y.; Han, K.-T.; Park, E.-C. The relationship between sports facility accessibility and physical activity among Korean adults. BMC Public Health 2016, 16, 893. [Google Scholar] [CrossRef]
- Ries, A.V.; Yan, A.F.; Voorhees, C.C. The neighborhood recreational environment and physical activity among urban youth: An examination of public and private recreational facilities. J. Community Health 2011, 36, 640–649. [Google Scholar] [CrossRef]
- Reyes, M.; Páez, A.; Morency, C. Walking accessibility to urban parks by children: A case study of Montreal. Landsc. Urban Plan. 2014, 125, 38–47. [Google Scholar] [CrossRef]
- Frank, L.D.; Schmid, T.L.; Sallis, J.F.; Chapman, J.; Saelens, B.E. Linking objectively measured physical activity with an objectively measured urban form: Findings from SMARTRAQ. Am. J. Prev. Med. 2005, 28, 117–125. [Google Scholar] [CrossRef]
- Oliver, L.N.; Schuurman, N.; Hall, A.W. Comparing circular and network buffers to examine the influence of land use on walking for leisure and errands. Int. J. Health Geogr. 2007, 6, 41. [Google Scholar] [CrossRef] [PubMed]
- Le Gouais, A.; Govia, I.; Guell, C. Challenges for creating active living infrastructure in a middle-income country: A qualitative case study in Jamaica. Cities Health 2020, 0, 1–12. [Google Scholar] [CrossRef]
- Merritt, A.S.; Georgellis, A.; Andersson, N.; Bero, B.G.; Bellander, T.; Johansson, C. Personal exposure to black carbon in Stockholm, using different intra-urban transport modes. Sci. Total Environ. 2019, 674, 279–287. [Google Scholar] [CrossRef] [PubMed]
- Le Gouais, A.; Panter, J.R.; Cope, A.; Powell, J.E.; Bird, E.L.; Woodcock, J.; Ogilvie, D.; Foley, L. A natural experimental study of new walking and cycling infrastructure across the United Kingdom: The Connect2 programme. J. Transp. Health 2021, 20, 100968. [Google Scholar] [CrossRef]
- Keall, M.; Randal, E.; Abrahamse, W.; Chapman, R.; Shaw, C.; Witten, K.; Woodward, A.; How den-Chapman, P. Equity and other effects of a program facilitating and promoting active travel. Transp. Res. Part D Transp. Environ. 2022, 108, 103338. [Google Scholar] [CrossRef]
- Mahmud, Z.N.; Asif, K.; Shaila, J.; Monwar, A.B. Impacts of the COVID-19 pandemic on active travel mode choice in Bangladesh: A study from the perspective of sustainability and new normal situation. Sustainability 2021, 13, 6975. [Google Scholar] [CrossRef]
- Chuang, I.-T.; Benita, F.; Tunçer, B. Effects of urban park spatial characteristics on visitor density and diversity: A geolocated social media approach. Landsc. Urban Plan. 2022, 226, 104514. [Google Scholar] [CrossRef]
- Xu, L.; You, H.; Li, D.; Yu, K. Urban green spaces, their spatial pattern, and ecosystem service value: The case of Beijing. Habitat. Int. 2016, 56, 84–95. [Google Scholar] [CrossRef]
- Campbell-O’Sullivan, S.P.; Constantin-Teodosiu, D.; Peirce, N.; Greenhaff, P.L. Low intensity exercise in humans accelerates mitochondrial ATP production and pulmonary oxygen kinetics during subsequent more intense exercise. J. Physiol. 2002, 538, 931–939. [Google Scholar] [CrossRef]
- Cohen, D.A.; McKenzie, T.L.; Sehgal, A.; Williamson, S.; Golinelli, D.; Lurie, N. Contribution of public parks to physical activity. Am. J. Public Health 2007, 97, 509–514. [Google Scholar] [CrossRef]
- Huang, H.; Zhang, S.Y.; Xiong, S.G.; Shi, C.X. Health risk assessment and influencing factors analysis of high temperatures on negative emotions. Buildings 2022, 12, 1040. [Google Scholar] [CrossRef]
- Gidlöf-Gunnarsson, A.; Öhrström, E. Noise and well-being in urban residential environments: The potential role of perceived availability to nearby green areas. Landsc. Urban Plan. 2007, 83, 115–126. [Google Scholar] [CrossRef]
- Elbakidze, M.; Dawson, L.; Milberg, P.; Mikusiński, G.; Hedblom, M.; Kruhlov, I.; Yamelynets, T.; Schaffer, C.; Johansson, K.E.; Grodzynskyi, M. Multiple factors shape the interaction of people with urban greenspace: Sweden as a case study. Urban For. Urban Green. 2022, 74, 127672. [Google Scholar] [CrossRef]
- Notice on overall planning of Nanjing greenway (2019–2035) [EB/OL]. Available online: https://www.nanjing.gov.cn/zdgk/201912/t20191204_1727803.html (accessed on 18 June 2022).
- Cycling algorithm of Baidu Map API. Baidu Map API [EB/OL]. Available online: http://lbsyun.baidu.com/index.php?title=webapi/directionlite-v1 (accessed on 4 November 2021).
- Oswald, B. A further study of the relation between subjective distance and emotional involvement. Acta Psychol. 1969, 29, 244–255. [Google Scholar] [CrossRef]
- Guida, C.; Carpentieri, G.; Masoumi, H. Measuring spatial accessibility to urban services for older adults: An application to healthcare facilities in Milan. Eur. Transp. Res. Rev. 2022, 14, 23. [Google Scholar] [CrossRef]
- Liu, Y.D. Sport and social inclusion: Evidence from the performance of public leisure facilities. Soc. Indic. Res. 2009, 90, 325–337. [Google Scholar] [CrossRef]
- Castillo, E.C.; Campos-Bowers, M.; Ory, M.G. Expanding bicycle infrastructure to promote physical activity in hidalgo county, Texas. Prev. Chronic Dis. 2019, 16, 190125. [Google Scholar] [CrossRef]
- Deelen, I.; Jansen, M.; Dogterom, N.J.; Kamphuis, C.; Ettema, D. Do objective neighbourhood characteristics relate to residents’ preferences for certain sports locations? A cross-sectional study using a discrete choice modelling approach. BMC Public Health 2017, 17, 943. [Google Scholar] [CrossRef]
- Kostrzewska, M. Activating public space: How to promote physical activity in urban environment. IOP Conf. Ser. Mater. Sci. Eng. 2017, 245, 052074. [Google Scholar] [CrossRef]
- Mäki-Opas, T.E.; Borodulin, K.; Valkeinen, H.; Stenholm, S.; Kunst, A.E.; Abel, T.; Härkänen, T.; Kopperoinen, L.; Itkonen, P.; Prättälä, R.; et al. The contribution of travel-related urban zones, cycling and pedestrian networks and green space to commuting physical activity among adults-A cross-sectional population-based study using geographical information systems. BMC Public Health 2016, 16, 760. [Google Scholar] [CrossRef]
- Toselli, S.; Bragonzoni, L.; Dallolio, L.; Grigoletto, A.; Masini, A.; Marini, S.; Barone, G.; Pinelli, E.; Zinno, R.; Mauro, M.; et al. The effects of park based interventions on health: The Italian project “Moving Parks”. Int. J. Environ. Res. Public Health 2022, 19, 2130. [Google Scholar] [CrossRef]
- Kostrzewska, M. Neighbourhood sports as a tool of urban regeneration-A Warsaw case study. In Proceedings of the international multidisciplinary scientific conferences on social sciences and arts, 3rd International multidisciplinary scientific conference on social sciences and arts, SGEM 2016, Vienna, Austria, 6–9 April 2016. [Google Scholar]
- Wei, F.; Xu, W.; Hu, X.; Li, X.; Zhan, X. The supply-demand balance and spatial optimization of urban physical activity space. J. Hum. Sett. West China 2022, 37, 88–96. [Google Scholar] [CrossRef]
- Yi, J.; Horton, P. The integration of three types of lands: A new approach to the provision of public sport and recreation areas in China. Int. J. Hist. Sport 2015, 32, 1291–1307. [Google Scholar] [CrossRef]
- Yang, Z.; Li, Y.L. The dilemma and optimization strategies on colleges and universities stadium and gymnasium of open to society. J. Beijing Sport Univ. 2013, 36, 91–96+101. [Google Scholar] [CrossRef]
- Yuan, F.; Wei, Y.D.; Xiao, W. Land marketization, fiscal decentralization, and the dynamics of urban land prices in transitional China. Land Use Policy 2019, 89, 104208. [Google Scholar] [CrossRef]
- Han, L.Y.; Xu, Z.; Clive, S. Exploring the potential of urban (re)form: Modifying gated communities to shorten school travel distance in Nanjing, China. Environ. Plan. B. Plan. Des. 2021, 48, 2536–2553. [Google Scholar] [CrossRef]
- Pan, H.; Shen, Q.; Liu, C. Transit-oriented development at the urban periphery-Insights from a case study in Shanghai, China. Transp. Res. Rec. 2011, 2245, 95–102. [Google Scholar] [CrossRef]
- Koo, B.W.; Guhathakurta, S.; Botchwey, N. How are neighborhood and street-level walkability factors associated with walking behaviors? A big data approach using street view images. Environ. Behav. 2022, 54, 211–241. [Google Scholar] [CrossRef]
- Jiang, H.; Dong, L.; Qiu, B. How are macro-scale and micro-scale built environments associated with running activity? The application of Strava data and deep learning in inner London. ISPRS Int. J. Geo-Inf. 2022, 11, 504. [Google Scholar] [CrossRef]
- Guidelines for planning and design of slow traffic in Shanghai [EB/OL]. Available online: https://www.shanghai.gov.cn/nw4411/20210831/95fbb7db83f144ef8841d31749acdebf.html (accessed on 4 June 2022).
- The green life of walking and cycling in Beijing [EB/OL]. Available online: http://ghzrzyw.beijing.gov.cn/zhengwuxinxi/zxzt/zhjtxsy/202001/t20200109_1570329.html (accessed on 4 June 2022).
- Zhou, S.; Chen, F.; Xu, Z. Evaluating the accessibility of urban parks and waterfronts through online map services: A case study of Shaoxing, China. Urban For. Urban Gree. 2022, 77, 127731. [Google Scholar] [CrossRef]
Publisher’s Note: MDPI stays neutral with regard to jurisdictional claims in published maps and institutional affiliations. |
© 2022 by the authors. Licensee MDPI, Basel, Switzerland. This article is an open access article distributed under the terms and conditions of the Creative Commons Attribution (CC BY) license (https://creativecommons.org/licenses/by/4.0/).