


Comparing the Urban Floods Resistance of Common Tree Species in Winter City Parks
 , ,
, , 
Abstract
1. Introduction
2. Materials and Methods
2.1. Study Area
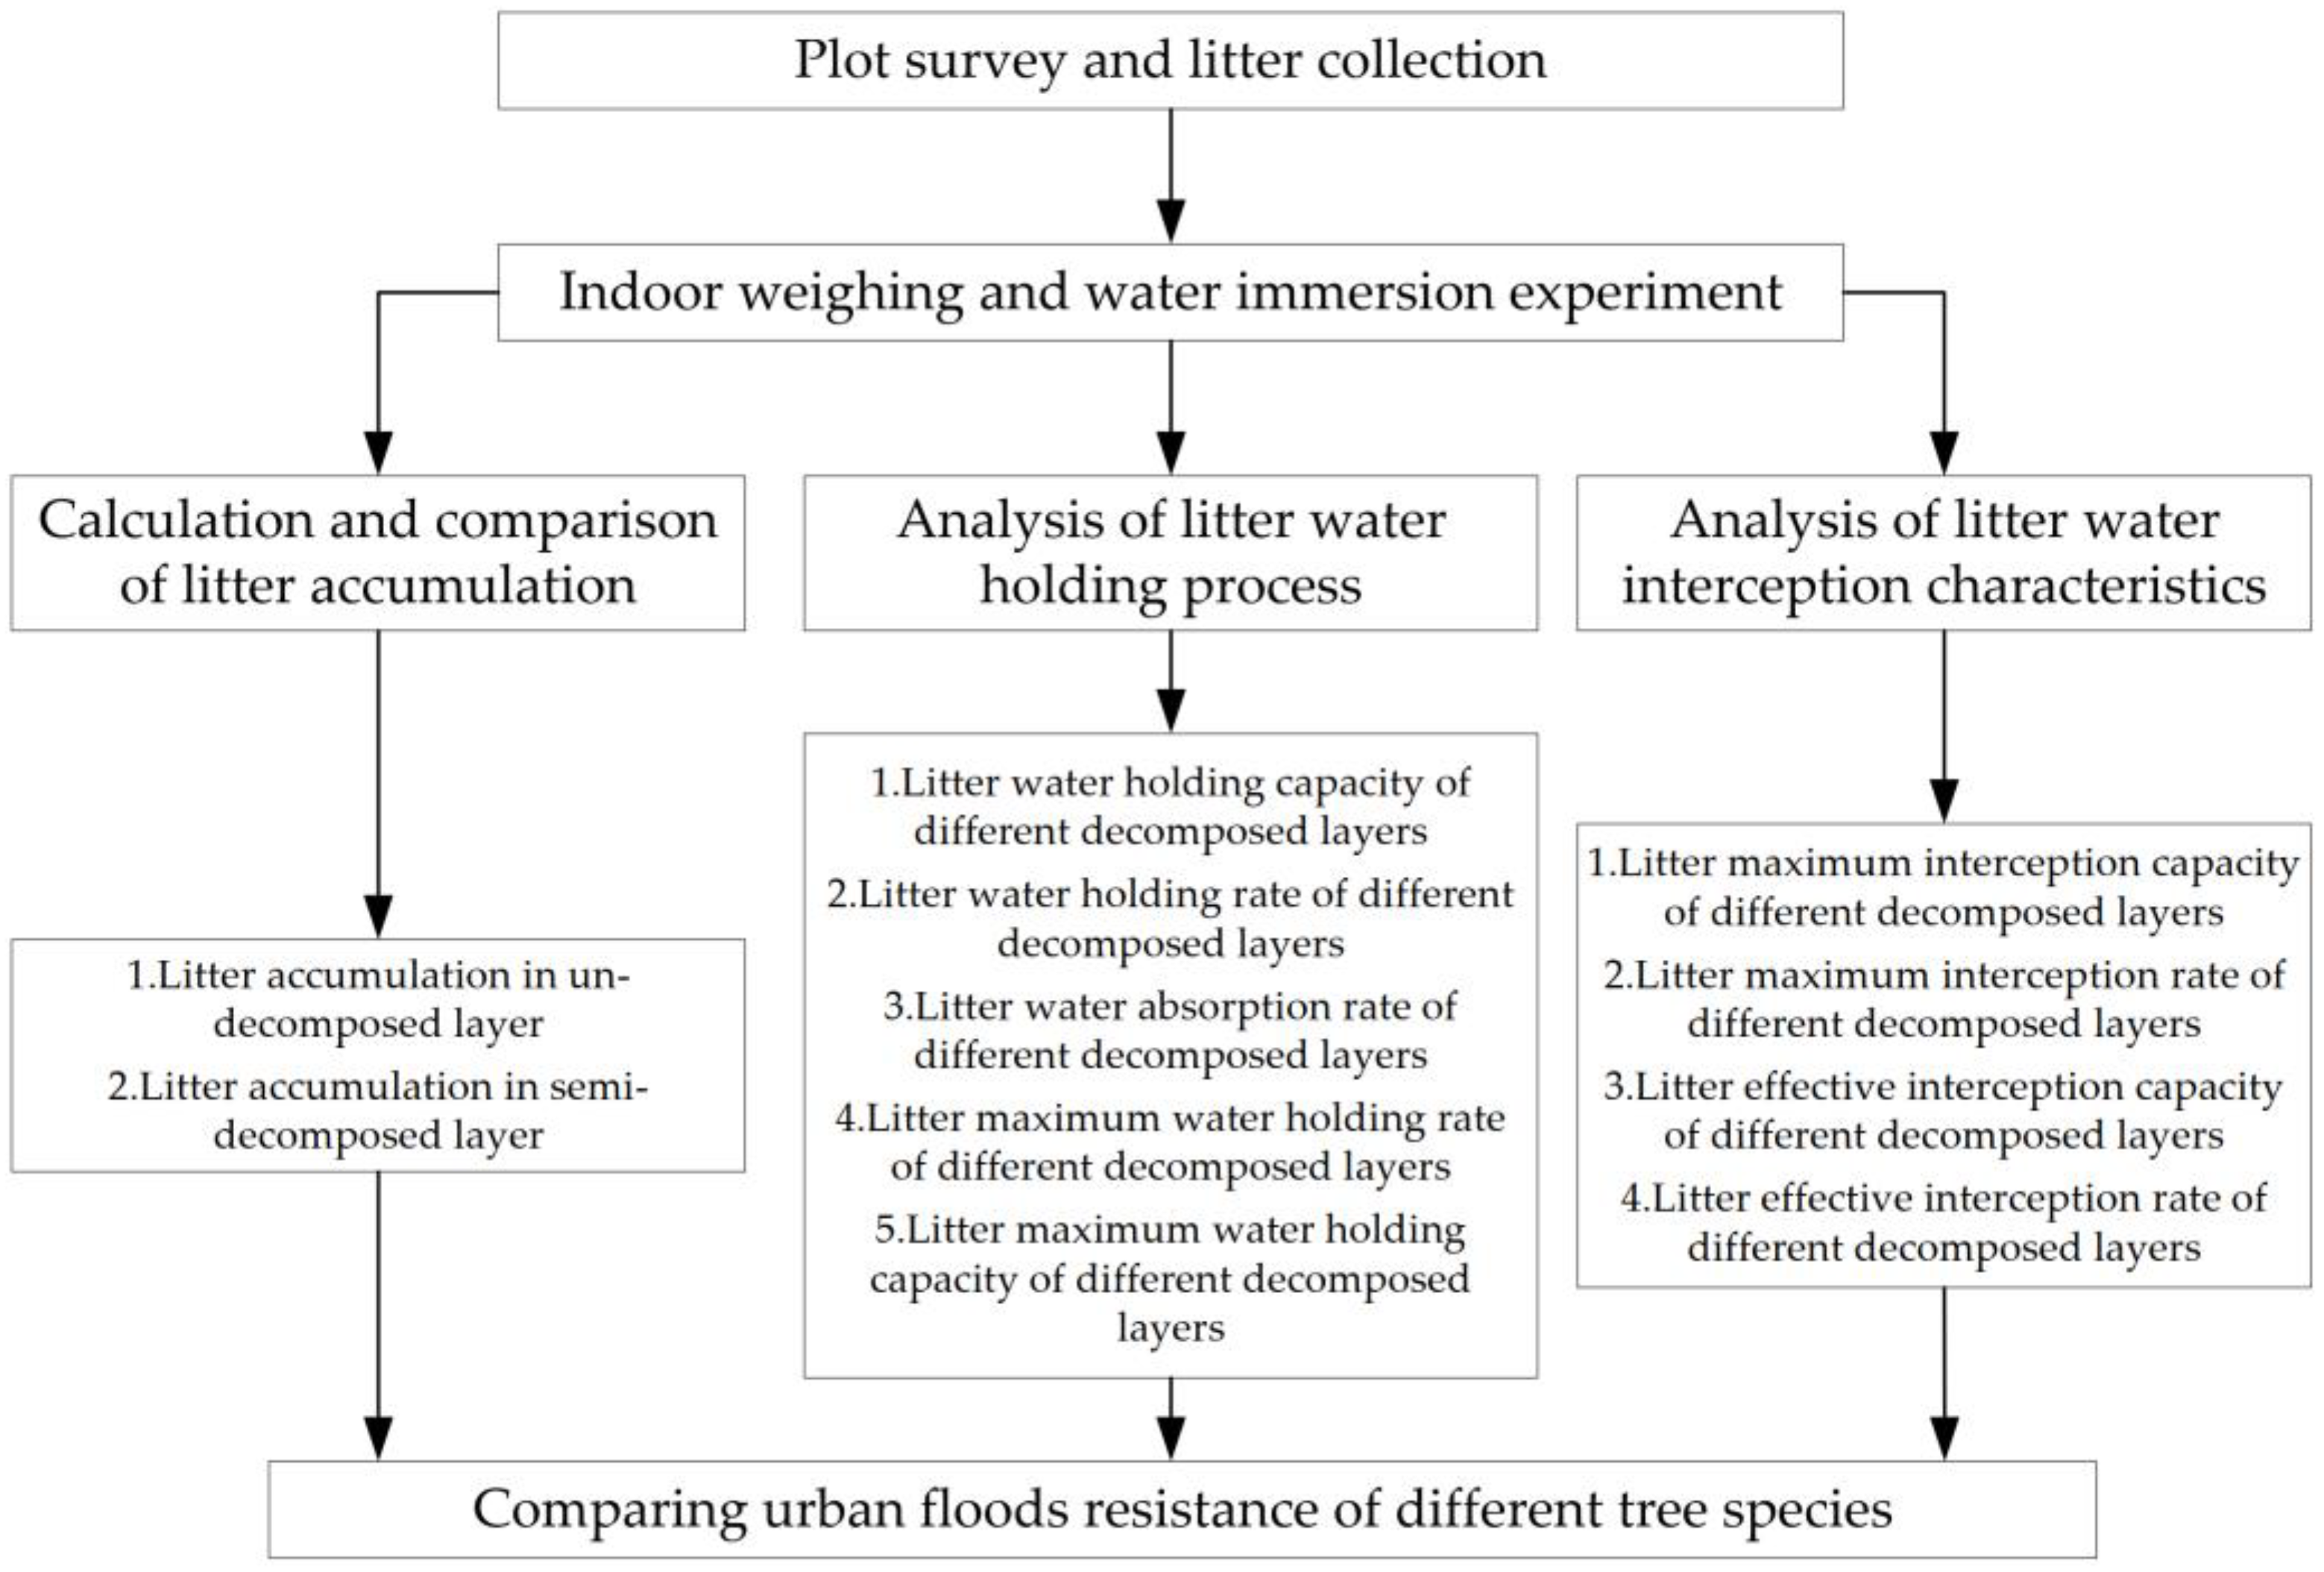
2.2. Methods
2.2.1. Litter Collection and Accumulation Calculation
2.2.2. Measure the Hydrological Characteristics of Different Forest Stands
2.2.3. Data Analysis
3. Results
3.1. Litter Accumulation and Composition of Different Forest Stands
3.2. Litter Hydrological Characteristics
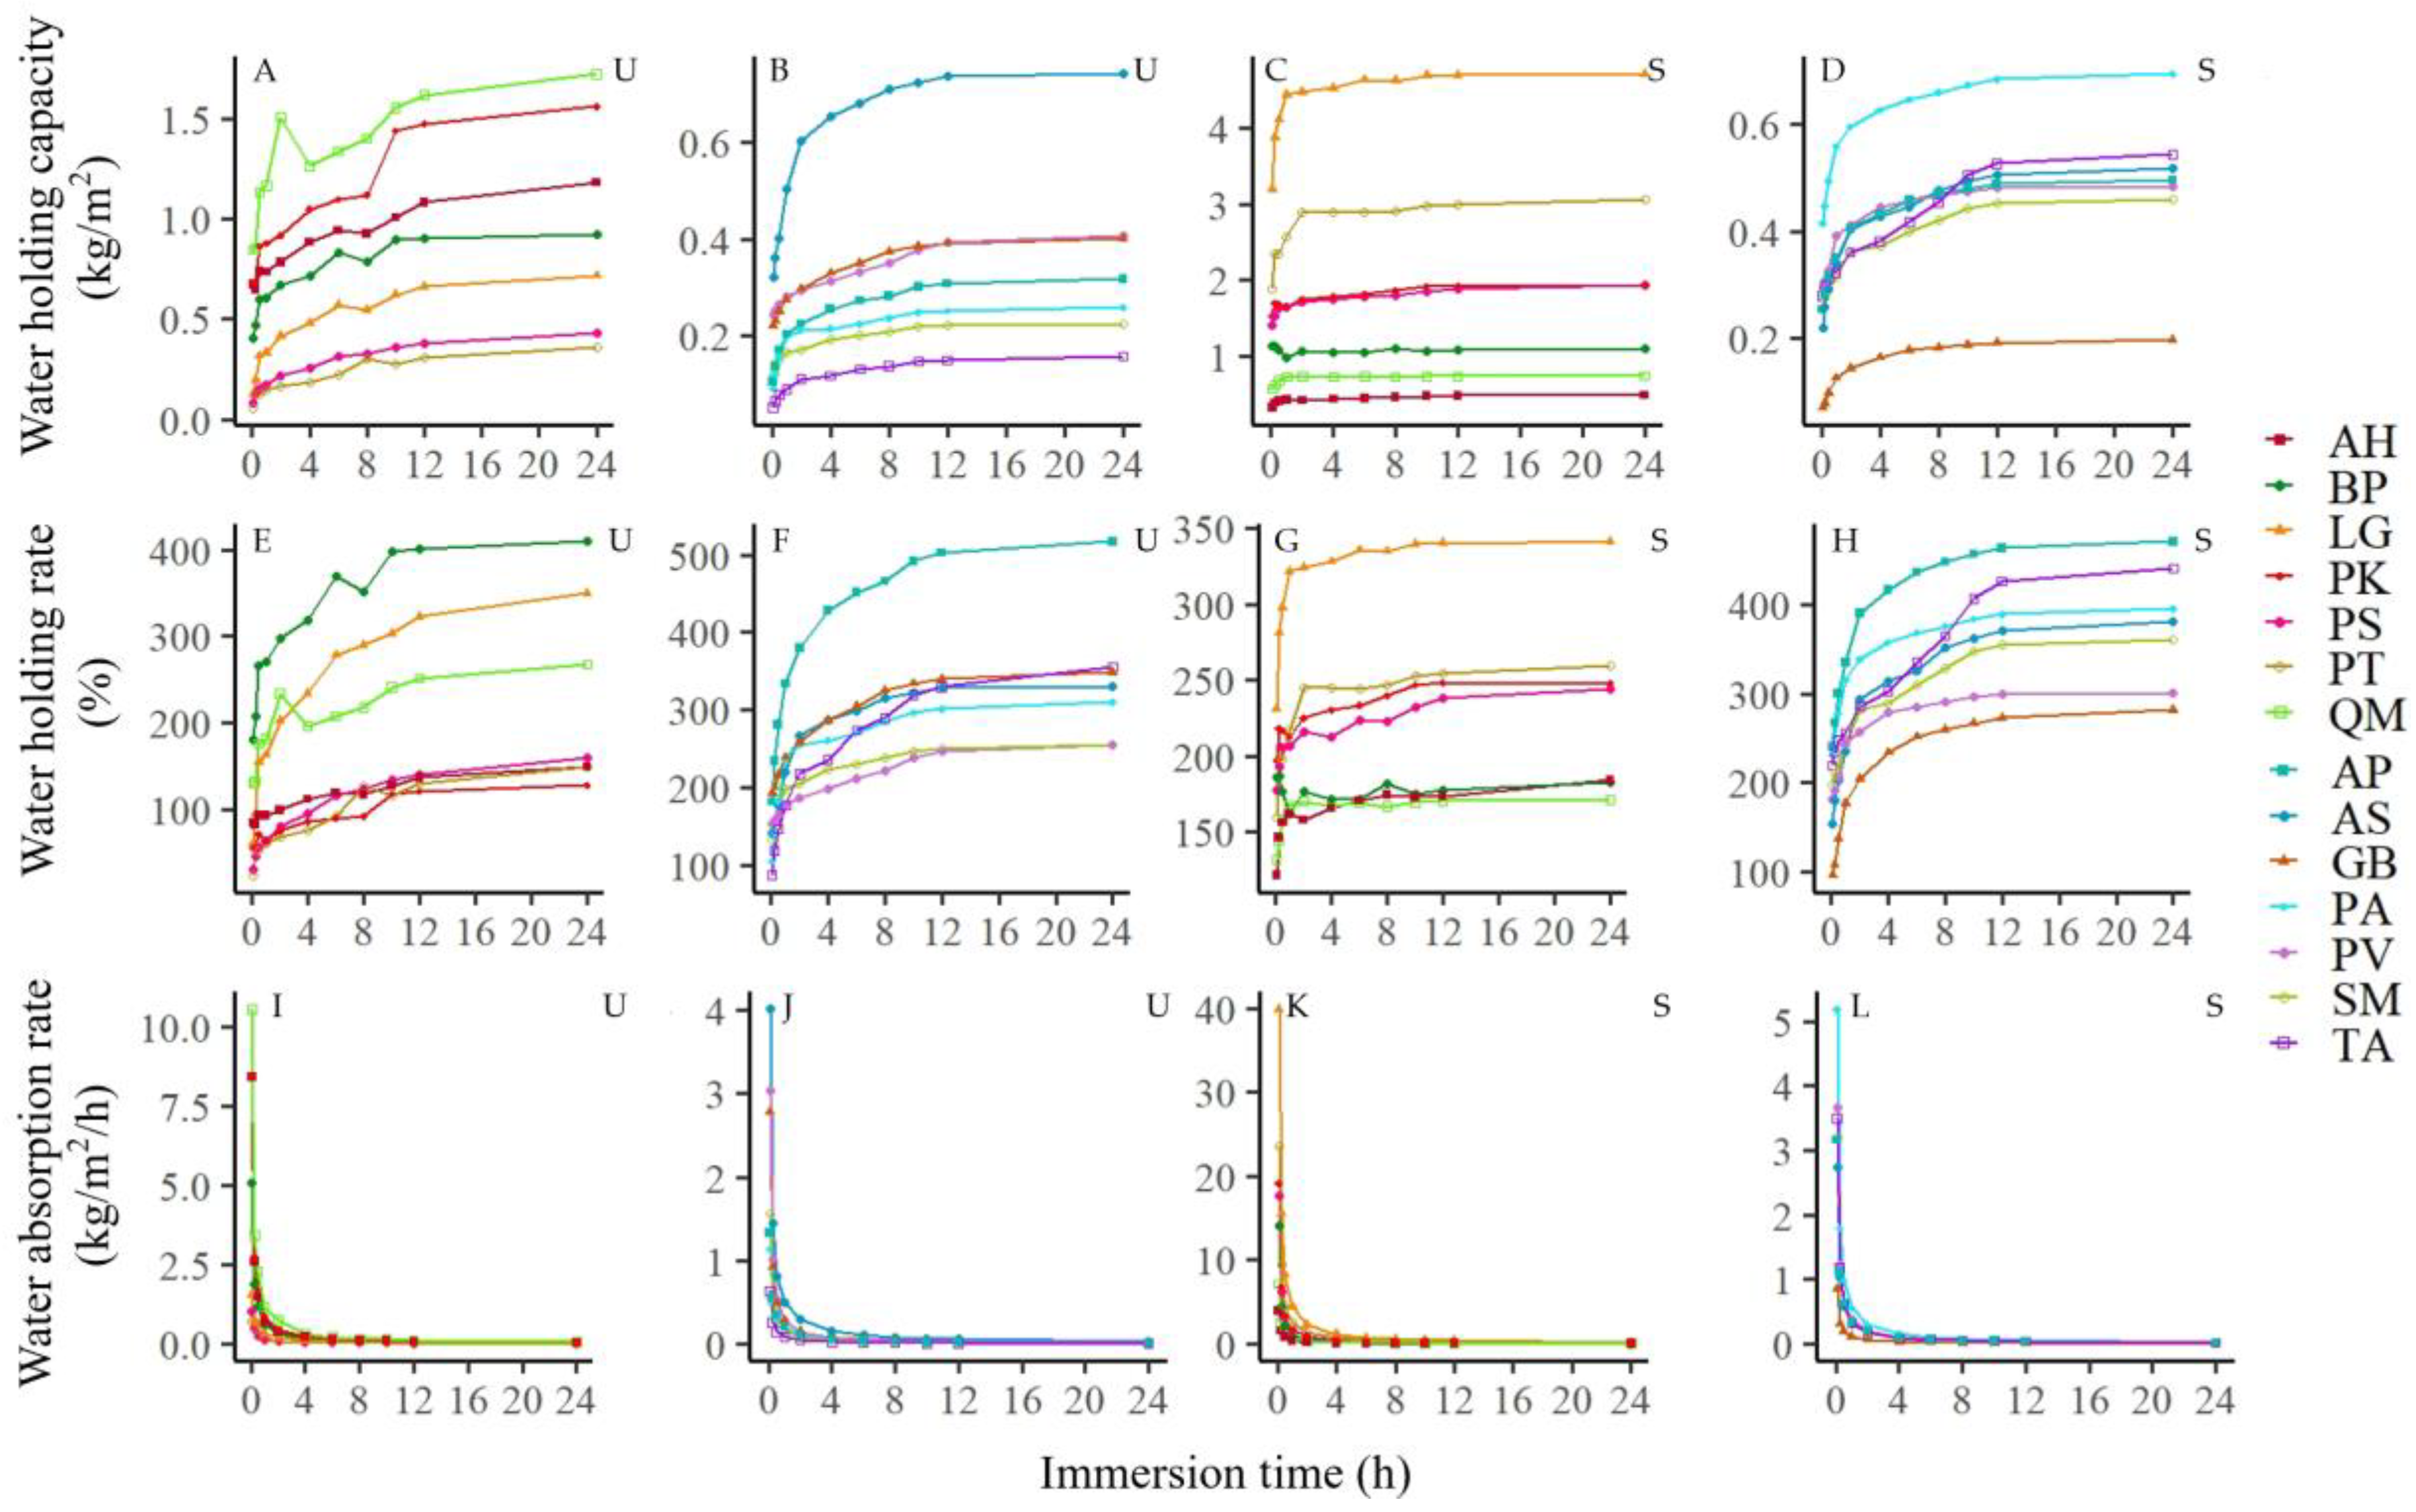
3.2.1. Litter Water Holding Process
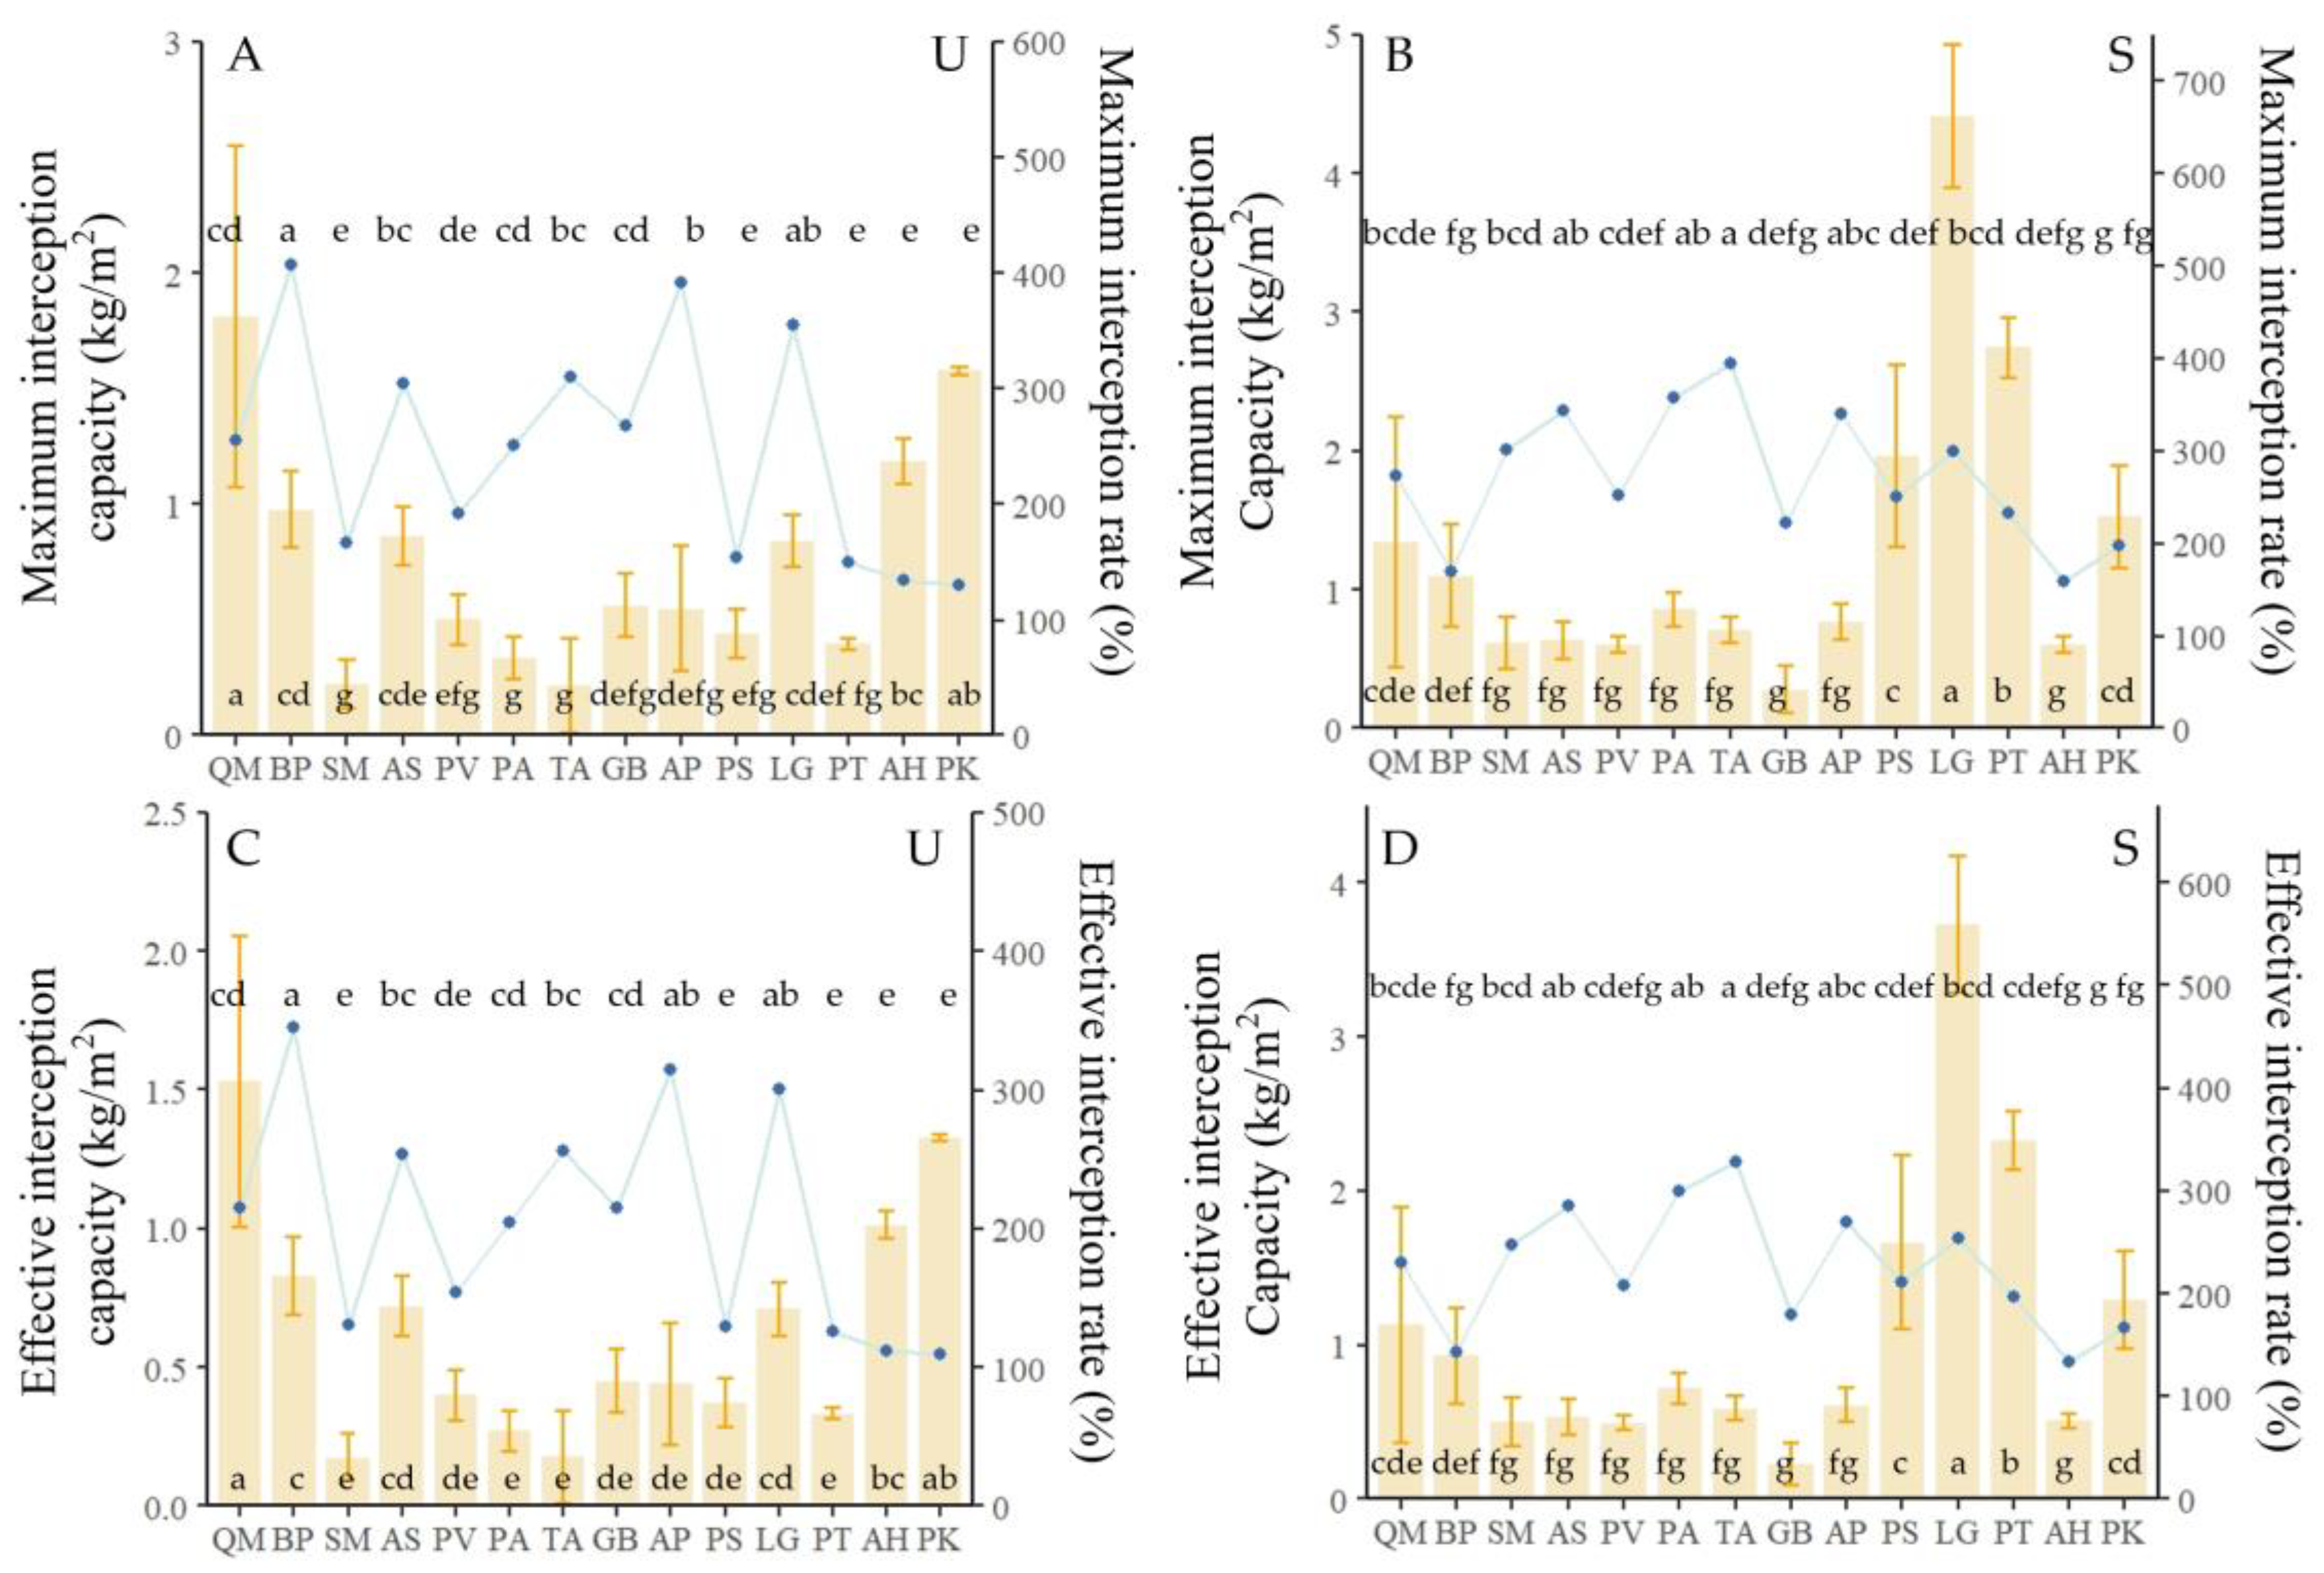
3.2.2. Litter Water Interception Characteristics
3.3. Summary of Litter Accumulation and Water-Related Parameters
4. Discussion
4.1. The Relations between Litter Accumulation and Its Water Holding Ability
4.2. Tree Species Selection for Urban Flood Mitigation
5. Conclusions
Author Contributions
Funding
Conflicts of Interest
References
- IPCC. Climate Change 2022: Impacts, Adaptation and Vulnerability; Contribution of Working Group II to the Sixth Assessment Report of the Intergovernmental Panel on Climate Change; IPCC: Cambridge, UK; New York, NY, USA, 2022. [Google Scholar]
- WMO. State of the Global Climate 2021; World Meteorological Organization: Geneva, Switzerland, 2022. [Google Scholar]
- Ministry of Water Resources of the People’s Republic of China. China Annual Hydrological Report 2021; Ministry of Water Resources of the People’s Republic of China: Beijing, China, 2022.
- State Council Investigation Team of China. Investigation Report of “July 20” Heavy Rain Disaster in Zhengzhou, Henan Province; Ministry of Emergency Management of the People’s Republic of China: Beijing, China, 2022.
- Ministry of Emergency Management of the People’s Republic of China. Basic Information on Natural Disasters in China 2021; Ministry of Emergency Management of the People’s Republic of China: Beijing, China, 2022.
- UN Department of Economic and Social Affairs. Available online: https://sdgs.un.org/goals (accessed on 10 November 2022).
- Zhou, M.; Feng, X.; Liu, K.; Zhang, C.; Xie, L.; Wu, X. An Alternative Risk Assessment Model of Urban Waterlogging: A Case Study of Ningbo City. Sustainability 2021, 13, 826. [Google Scholar] [CrossRef]
- Zhang, Q.; Wu, Z.; Tarolli, P. Investigating the Role of Green Infrastructure on Urban Water Logging: Evidence from Metropolitan Coastal Cities. Remote Sens. 2021, 13, 2341. [Google Scholar] [CrossRef]
- Yu, H.; Zhao, Y.; Fu, Y.; Li, L. Spatiotemporal Variance Assessment of Urban Rainstorm Waterlogging Affected by Impervious Surface Expansion: A Case Study of Guangzhou, China. Sustainability 2018, 10, 3761. [Google Scholar] [CrossRef]
- Yin, Z.; Yin, J.; Xu, S.; Wen, J. Community-based scenario modelling and disaster risk assessment of urban rainstorm waterlogging. J. Geogr. Sci. 2011, 21, 274–284. [Google Scholar] [CrossRef]
- Lin, T.; Liu, X.; Song, J.; Zhang, G.; Jia, Y.; Tu, Z.; Zheng, Z.; Liu, C. Urban waterlogging risk assessment based on internet open data: A case study in China. Habitat Int. 2018, 71, 88–96. [Google Scholar] [CrossRef]
- Islam, M.R.; Raja, D.R. Waterlogging Risk Assessment: An Undervalued Disaster Risk in Coastal Urban Community of Chattogram, Bangladesh. Earth 2021, 2, 151–173. [Google Scholar] [CrossRef]
- Chen, W.; Dong, J.; Yan, C.; Dong, H.; Liu, P. What Causes Waterlogging?—Explore the Urban Waterlogging Control Scheme through System Dynamics Simulation. Sustainability 2021, 13, 8546. [Google Scholar] [CrossRef]
- Shahid, M.; Cong, Z.; Zhang, D. Understanding the impacts of climate change and human activities on streamflow: A case study of the Soan River basin, Pakistan. Theor. Appl. Clim. 2017, 134, 205–219. [Google Scholar] [CrossRef]
- Cong, Z.; Shahid, M.; Zhang, D.; Lei, H.; Yang, D. Attribution of runoff change in the alpine basin: A case study of the Heihe Upstream Basin, China. Hydrol. Sci. J. 2017, 62, 1013–1028. [Google Scholar] [CrossRef]
- Wu, J.; Sha, W.; Zhang, P.; Wang, Z. The spatial non-stationary effect of urban landscape pattern on urban waterlogging: A case study of Shenzhen City. Sci. Rep. 2020, 10, 7369. [Google Scholar] [CrossRef] [PubMed]
- Liu, F.; Liu, X.; Xu, T.; Yang, G.; Zhao, Y. Driving Factors and Risk Assessment of Rainstorm Waterlogging in Urban Agglomeration Areas: A Case Study of the Guangdong-Hong Kong-Macao Greater Bay Area, China. Water 2021, 13, 770. [Google Scholar] [CrossRef]
- Tehrany, M.S.; Jones, S.; Shabani, F. Identifying the essential flood conditioning factors for flood prone area mapping using machine learning techniques. Catena 2019, 175, 174–192. [Google Scholar] [CrossRef]
- Zhang, H.; Cheng, J.; Wu, Z.; Li, C.; Qin, J.; Liu, T. Effects of Impervious Surface on the Spatial Distribution of Urban Waterlogging Risk Spots at Multiple Scales in Guangzhou, South China. Sustainability 2018, 10, 1589. [Google Scholar] [CrossRef]
- Liu, W.; Chen, W.; Peng, C. Assessing the effectiveness of green infrastructures on urban flooding reduction: A community scale study. Ecol. Model. 2014, 291, 6–14. [Google Scholar] [CrossRef]
- Spletozer, A.G.; Silveira, L.J.; Barbosa, R.A.; Barbosa, S.G.; Dias, H.C.T. Effect of litter on the surface runoff of a forest fragment in the Atlantic Forest. Braz. J. Agric. Sci. 2021, 16, 1–7. [Google Scholar] [CrossRef]
- Chen, J.; Liu, Y.; Gitau, M.W.; Engel, B.A.; Flanagan, D.C.; Harbor, J.M. Evaluation of the effectiveness of green infrastructure on hydrology and water quality in a combined sewer overflow community. Sci. Total Environ. 2019, 665, 69–79. [Google Scholar] [CrossRef] [PubMed]
- Zhang, Q.; Wu, Z.; Guo, G.; Zhang, H.; Tarolli, P. Explicit the urban waterlogging spatial variation and its driving factors: The stepwise cluster analysis model and hierarchical partitioning analysis approach. Sci. Total Environ. 2020, 763, 143041. [Google Scholar] [CrossRef] [PubMed]
- Fletcher, T.D.; Shuster, W.; Hunt, W.F.; Ashley, R.; Butler, D.; Arthur, S.; Trowsdale, S.; Barraud, S.; Semadeni-Davies, A.; Bertrand-Krajewski, J.-L.; et al. SUDS, LID, BMPs, WSUD and more—The evolution and application of terminology surrounding urban drainage. Urban Water J. 2014, 12, 525–542. [Google Scholar] [CrossRef]
- Chui, T.F.M.; Liu, X.; Zhan, W. Assessing cost-effectiveness of specific LID practice designs in response to large storm events. J. Hydrol. 2016, 533, 353–364. [Google Scholar] [CrossRef]
- Mao, X.; Jia, H.; Yu, S.L. Assessing the ecological benefits of aggregate LID-BMPs through modelling. Ecol. Model. 2017, 353, 139–149. [Google Scholar] [CrossRef]
- Pour, S.H.; Wahab, A.K.A.; Shahid, S.; Asaduzzaman, M.; Dewan, A. Low impact development techniques to mitigate the impacts of climate-change-induced urban floods: Current trends, issues and challenges. Sustain. Cities Soc. 2020, 62, 102373. [Google Scholar] [CrossRef]
- Lancia, M.; Zheng, C.; He, X.; Lerner, D.N.; Andrews, C.; Tian, Y. Hydrogeological constraints and opportunities for “Sponge City” development: Shenzhen, southern China. J. Hydrol. Reg. Stud. 2020, 28, 100679. [Google Scholar] [CrossRef]
- Liu, J.; Gong, X.; Li, L.; Chen, F.; Zhang, J. Innovative design and construction of the sponge city facilities in the Chaotou Park, Talent Island, Jiangmen, China. Sustain. Cities Soc. 2021, 70, 102906. [Google Scholar] [CrossRef]
- Xia, J.; Zhang, Y.; Xiong, L.; He, S.; Wang, L.; Yu, Z. Opportunities and challenges of the Sponge City construction related to urban water issues in China. Sci. China Earth Sci. 2017, 60, 652–658. [Google Scholar] [CrossRef]
- Armson, D.; Stringer, P.; Ennos, A.R. The effect of street trees and amenity grass on urban surface water runoff in Manchester, UK. Urban For. Urban Green. 2013, 12, 282–286. [Google Scholar] [CrossRef]
- Li, X.; Xiao, Q.; Niu, J.; Dymond, S.; van Doorn, N.S.; Yu, X.; Xie, B.; Lv, X.; Zhang, K.; Li, J. Process-based rainfall interception by small trees in Northern China: The effect of rainfall traits and crown structure characteristics. Agric. For. Meteorol. 2016, 218-219, 65–73. [Google Scholar] [CrossRef]
- Yang, L.; Zhang, L.; Li, Y.; Wu, S. Water-related ecosystem services provided by urban green space: A case study in Yixing City (China). Landsc. Urban Plan. 2015, 136, 40–51. [Google Scholar] [CrossRef]
- Li, X.; Xiao, Q.; Niu, J.; Dymond, S.; McPherson, E.G.; van Doorn, N.; Yu, X.; Xie, B.; Zhang, K.; Li, J. Rainfall interception by tree crown and leaf litter: An interactive process. Hydrol. Process. 2017, 31, 3533–3542. [Google Scholar] [CrossRef]
- Zhang, B.; Li, W.; Xie, G.; Xiao, Y. Water conservation of forest ecosystem in Beijing and its value. Ecol. Econ. 2010, 69, 1416–1426. [Google Scholar]
- Jiang, M.-H.; Lin, T.-C.; Shaner, P.-J.L.; Lyu, M.-K.; Xu, C.; Xie, J.-S.; Lin, C.-F.; Yang, Z.-J.; Yang, Y.-S. Understory interception contributed to the convergence of surface runoff between a Chinese fir plantation and a secondary broadleaf forest. J. Hydrol. 2019, 574, 862–871. [Google Scholar] [CrossRef]
- Li, X.; Niu, J.; Xie, B. The Effect of Leaf Litter Cover on Surface Runoff and Soil erosion in Northern China. PLoS ONE 2014, 9, e107789. [Google Scholar] [CrossRef]
- Szota, C.; Coutts, A.M.; Thom, J.K.; Virahsawmy, H.K.; Fletcher, T.D.; Livesley, S.J. Street tree stormwater control measures can reduce runoff but may not benefit established trees. Landsc. Urban Plan. 2019, 182, 144–155. [Google Scholar] [CrossRef]
- Richards, P.J.; Farrell, C.; Tom, M.; Williams, N.S.G.; Fletcher, T.D. Vegetable raingardens can produce food and reduce stormwater runoff. Urban For. Urban Green. 2015, 14, 646–654. [Google Scholar] [CrossRef]
- Wu, W.; Li, L.; Li, C. Seasonal variation in the effects of urban environmental factors on land surface temperature in a winter city. J. Clean. Prod. 2021, 299, 126897. [Google Scholar] [CrossRef]
- Hidalgo, A.K. Mental health in winter cities: The effect of vegetation on streets. Urban For. Urban Green. 2021, 63, 127226. [Google Scholar] [CrossRef]
- Statistic Bureau of Jilin. Jilin Statistical Yearbook; Statistic Bureau of Jilin: Changchun, China, 2021. [Google Scholar]
- Changchun Bureau of Statistics. Changchun Statistical Yearbook; Changchun Bureau of Statistics: Changchun, China, 2021. [Google Scholar]
- Statistic Bureau of Jilin. Jilin Statistical Yearbook; Statistic Bureau of Jilin: Changchun, China, 2020. [Google Scholar]
- Statistic Bureau of Jilin. Jilin Statistical Yearbook; Statistic Bureau of Jilin: Changchun, China, 2019. [Google Scholar]
- Statistic Bureau of Jilin. Jilin Statistical Yearbook; Statistic Bureau of Jilin: Changchun, China, 2018. [Google Scholar]
- Statistic Bureau of Jilin. Jilin Statistical Yearbook; Statistic Bureau of Jilin: Changchun, China, 2017. [Google Scholar]
- Cui, Y.; Pan, C.; Zhang, G.; Sun, Z.; Wang, F. Effects of litter mass on throughfall partitioning in a Pinus tabulaeformis plantation on the Loess Plateau, China. Agric. For. Meteorol. 2022, 318, 108908. [Google Scholar] [CrossRef]
- Bai, Y.; Zhou, Y.; Du, J.; Zhang, X.; Di, N. Effects of a broadleaf-oriented transformation of coniferous plantations on the hydrological characteristics of litter layers in subtropical China. Glob. Ecol. Conserv. 2020, 25, e01400. [Google Scholar] [CrossRef]
- Wickham, H. ggplot2: Elegant Graphics for Data Analysis; Springer: New York, NY, USA, 2016. [Google Scholar]
- Mendiburu, F.D. Agricolae: Statistical Procedures for Agricultural Research. Available online: https://CRAN.R-project.org/package=agricolae (accessed on 10 November 2022).
- Neris, J.; Tejedor, M.; Rodríguez, M.; Fuentes, J.; Jiménez, C. Effect of forest floor characteristics on water repellency, infiltration, runoff and soil loss in Andisols of Tenerife (Canary Islands, Spain). Catena 2013, 108, 50–57. [Google Scholar] [CrossRef]
- Zhao, L.; Hou, R.; Fang, Q. Differences in interception storage capacities of undecomposed broad-leaf and needle-leaf litter under simulated rainfall conditions. For. Ecol. Manag. 2019, 446, 135–142. [Google Scholar] [CrossRef]
- Wang, B.; Niu, J.; Berndtsson, R.; Zhang, L.; Chen, X.; Li, X.; Zhu, Z. Efficient organic mulch thickness for soil and water conservation in urban areas. Sci. Rep. 2021, 11, 6259. [Google Scholar] [CrossRef]
- Zhang, Y.; Gan, Z.; Li, R.; Wang, R.; Li, N.; Zhao, M.; Du, L.; Guo, S.; Jiang, J.; Wang, Z. Litter production rates and soil moisture influences interannual variability in litter respiration in the semi-arid Loess Plateau, China. J. Arid Environ. 2016, 125, 43–51. [Google Scholar] [CrossRef]
- Liu, X.E.; Su, S.P. Hydrological functions of litters under five typical plantations in southern and northern mountains of Lanzhou City, Northwest China. Chin. J. Appl. Ecol. 2020, 31, 2574–2582. [Google Scholar]
- Yang, Y.; Bao, G.; Zhang, D.; Zhai, C. Spatial Distribution and Driving Factors of Old and Notable Trees in a Fast-Developing City, Northeast China. Sustainability 2022, 14, 7937. [Google Scholar] [CrossRef]
- Ali, A.; Wang, L.-Q. Big-sized trees and forest functioning: Current knowledge and future perspectives. Ecol. Indic. 2021, 127, 107760. [Google Scholar] [CrossRef]
- Bordin, K.M.; Esquivel-Muelbert, A.; Bergamin, R.S.; Klipel, J.; Picolotto, R.C.; Frangipani, M.A.; Zanini, K.J.; Cianciaruso, M.V.; Jarenkow, J.A.; Jurinitz, C.F.; et al. Climate and large-sized trees, but not diversity, drive above-ground biomass in subtropical forests. For. Ecol. Manag. 2021, 490, 119126. [Google Scholar] [CrossRef]
- Zhao, W.; Li, K.; Wang, J.; He, Z. Litter water-holding capacity and accumulation amount of five Acacia plantation. J. Sichuan Agric. Univ. 2020, 38, 677–684. [Google Scholar]


| Forest Stands | Abbr. | Canopy Density | Average Tree Height (m) | Mean Breast Diameter (cm) | Plot Coordinates | Forest Density (Trees/Plot) |
|---|---|---|---|---|---|---|
| Quercus mongolica Fisch. ex Ledeb. forest | QM forest | 0.85 | 9.92 ± 1.2 | 16.5 ± 2.6 | 43°51′04″ N 125°17′39″ E | 40 |
| Betula platyphylla Sukaczev forest | BP forest | 0.89 | 18.04 ± 3.1 | 24.9 ± 2.8 | 43°50′57″ N 125°18′12″ E | 36 |
| Salix matsudana Koidz. forest | SM forest | 0.81 | 7.80 ± 1.7 | 17.6 ± 2.2 | 43°53′45″ N 125°16′13″ E | 20 |
| Armeniaca sibirica (L.) Lam. Forest | AS forest | 0.77 | 5.80 ± 1.1 | 16.3 ± 3.8 | 43°53′15″ N 125°16′13″ E | 19 |
| Padus virginiana ‘Canada Red’ forest | PV forest | 0.75 | 3.70 ± 0.2 | 5.0 ± 0.6 | 43°52′34″ N 125°21′14″ E | 27 |
| Populus alba × P. Berolinensis | PA forest | 0.77 | 12.80 ± 0.5 | 17.9 ± 2.3 | 43°52′28″ N 125°21′19″ E | 22 |
| Tilia amurensis Rupr. forest | TA forest | 0.81 | 6.90 ± 1.3 | 21.8 ± 1.9 | 43°53′17″ N 125°16′10″ E | 16 |
| Ginkgo biloba L. | GB forest | 0.72 | 6.30 ± 0.2 | 17.3 ± 4.8 | 43°53′45″ N 125°16′13″ E | 19 |
| Amygdalus persica f. rubro-plena forest | AP forest | 0.78 | 6.50 ± 0.3 | 10.9 ± 1.1 | 43°53′36″ N 125°16′14″ E | 27 |
| Pinus sylvestris L. var. mongolica Litv. | PS forest | 0.93 | 10.64 ± 1.4 | 20.2 ± 4.6 | 43°51′04″ N 125°17′40″ E | 39 |
| Larix gmelinii (Rupr.) Kuzen. forest | LG forest | 0.78 | 13.57 ± 2.1 | 24.9 ± 6.3 | 43°50′58″ N 125°17′13″ E | 21 |
| Pinus tabulaeformis var. mukdensis | PT forest | 0.73 | 11.80 ± 1.0 | 31.0 ± 5.8 | 43°51′17″ N 125°17′57″ E | 6 |
| Abies holophylla Maxim. forest | AH forest | 0.82 | 15.70 ± 1.9 | 23.1 ± 6.5 | 43°50′57″ N 125°17′09″ E | 15 |
| Picea koraiensis Nakai forest | PK forest | 0.85 | 14.30 ± 1.8 | 23.4 ± 2.8 | 43°50′57″ N 125°17′09″ E | 17 |
| Hydrological Parameters of Litters | Abbr. | Units | Equations | Explanations |
|---|---|---|---|---|
| Water holding capacity | Wt | kg/m2 | Wt = Gt − Gd | Gt is the wet weight of litter at time t (kg/m2); Gd is the dry weight of litter (kg/m2). |
| Water holding rate | Rh | % | Rh = (Gt − Gd)/Gd × 100% | Same as above. |
| Water absorption rate in a certain period | V | kg/m2/h | V = Wt/t | Wt is water holding capacity at time t. |
| Maximum water holding rate | Rh max | % | Rh max = (G24 − Gd)/Gd × 100% | G24 is the weight of litter soaked in water for 24 h (kg/m2); Gd is the dry weight of litter (kg/m2). |
| Maximum water holding capacity | Wh max | kg/m2 | Wh max = M × Rh max | Rh Max is the maximum water holding rate (%); M is litter accumulation (kg/m2). |
| Average natural water content | R0 | % | R0 = (G0 − Gd)/Gd × 100% | G0 is the fresh weight of litter (kg/m2); Gd is the dry weight of litter (kg/m2). |
| Maximum interception rate | Rs max | % | Rs max = Rh max − R0 | Rh Max is the maximum water holding rate (%); R0 is the average natural water content (%). |
| Maximum interception capacity | Ws max | kg/m2 | Ws max = Rs max × M | RS Max is the maximum litter interception rate (%); M is litter accumulation (kg/m2). |
| Effective interception rate | Rsv | % | Rsv = 0.85Rh max − R0 | Rh Max is the maximum water holding rate (%); R0 is the average natural water content (%). |
| Effective interception capacity | Wsv | kg/m2 | Wsv = Rsv × M | Rsv is the effective interception rate (%); M is litter accumulation (kg/m2). |
| Forest Stands | Total Accumulation (kg/m2) | U | S | ||
|---|---|---|---|---|---|
| Accumulation (kg/m2) | Proportions (%) | Accumulation (kg/m2) | Proportions (%) | ||
| QM forest | 1.18 ± 0.0 d | 0.70 ± 0.2 c | 59.46 | 0.48 ± 0.1 de | 40.54 |
| BP forest | 0.89 ± 0.1 e | 0.24 ± 0.1 de | 27.35 | 0.65 ± 0.1 cd | 72.65 |
| SM forest | 0.34 ± 0.1 fg | 0.14 ± 0.1 ef | 39.94 | 0.20 ± 0.1 ef | 60.06 |
| AS forest | 0.49 ± 0.1 f | 0.29 ± 0.1 d | 60.12 | 0.20 ± 0.1 ef | 39.88 |
| PV forest | 0.50 ± 0.0 f | 0.26 ± 0.1 de | 51.49 | 0.24 ± 0.1 ef | 48.51 |
| PA forest | 0.37 ± 0.0 fg | 0.13 ± 0.0 ef | 35.37 | 0.24 ± 0.1 ef | 64.63 |
| TA forest | 0.24 ± 0.0 g | 0.06 ± 0.0 f | 24.79 | 0.18 ± 0.0 ef | 75.21 |
| GB forest | 0.33 ± 0.1 fg | 0.21 ± 0.0 def | 64.02 | 0.12 ± 0.0 f | 35.98 |
| AP forest | 0.36 ± 0.0 fg | 0.13 ± 0.1 ef | 37.47 | 0.23 ± 0.0 ef | 62.53 |
| PS forest | 1.14 ± 0.2 d | 0.29 ± 0.1 de | 25.09 | 0.85 ± 0.3 c | 74.91 |
| LG forest | 1.70 ± 0.1 b | 0.23 ± 0.0 de | 13.81 | 1.47 ± 0.0 a | 86.19 |
| PT forest | 1.44 ± 0.0 c | 0.26 ± 0.0 de | 18.35 | 1.18 ± 0.0 b | 81.65 |
| AH forest | 1.29 ± 0.1 cd | 0.91 ± 0.1 b | 70.18 | 0.38 ± 0.1 def | 29.82 |
| PK forest | 1.99 ± 0.1 a | 1.22 ± 0.1 a | 61.32 | 0.77 ± 0.1 c | 38.68 |
| Forest Stands | Maximum Water Holding Rate (%) | Maximum Water Holding Capacity (kg/m2) | ||
|---|---|---|---|---|
| U | S | U | S | |
| QM forest | 263.27 ± 17.77 de | 283.37 ± 15.12 defg | 1.87 ± 0.56 a | 1.74 ± 0.41 cd |
| BP forest | 416.40 ± 32.42 b | 176.29 ± 23.54 h | 1.00 ± 0.18 cd | 1.14 ± 0.38 def |
| SM forest | 235.03 ± 34.12 ef | 360.69 ± 19.85 bcde | 0.38 ± 0.25 f | 0.73 ± 0.24 ef |
| AS forest | 331.41 ± 46.60 cd | 381.32 ± 31.11 abcd | 0.94 ± 0.12 cde | 0.70 ± 0.13 ef |
| PV forest | 256.40 ± 6.13 de | 301.56 ± 17.23 cdefg | 0.66 ± 0.13 def | 0.72 ± 0.06 ef |
| PA forest | 309.90 ± 6.68 cde | 394.96 ± 13.40 abc | 0.41 ± 0.11 f | 0.95 ± 0.15 def |
| TA forest | 355.89 ± 55.36 bc | 440.66 ± 15.39 ab | 0.25 ± 0.23 f | 0.79 ± 0.11 ef |
| GB forest | 349.02 ± 51.27 bc | 281.65 ± 27.02 efg | 0.73 ± 0.15 def | 0.35 ± 0.21 f |
| AP forest | 517.05 ± 44.53 a | 471.01 ± 24.31 a | 0.72 ± 0.35 def | 1.07 ± 0.15 def |
| PS forest | 158.90 ± 17.64 fg | 257.02 ± 25.89 fgh | 0.47 ± 0.11 ef | 2.03 ± 0.69 c |
| LG forest | 362.57 ± 11.61 bc | 309.07 ± 19.67 cdef | 0.94 ± 0.17 cde | 3.82 ± 1.15 a |
| PT forest | 158.63 ± 12.75 fg | 236.50 ± 15.51 fgh | 0.45 ± 0.06 ef | 2.75 ± 0.21 b |
| AH forest | 145.63 ± 14.30 g | 163.38 ± 18.21 h | 1.29 ± 0.18 bc | 0.60 ± 0.04 ef |
| PK forest | 135.50 ± 7.65 g | 202.27 ± 22.36 gh | 1.69 ± 0.06 ab | 1.43 ± 0.50 cde |
Publisher’s Note: MDPI stays neutral with regard to jurisdictional claims in published maps and institutional affiliations. |
© 2022 by the authors. Licensee MDPI, Basel, Switzerland. This article is an open access article distributed under the terms and conditions of the Creative Commons Attribution (CC BY) license (https://creativecommons.org/licenses/by/4.0/).
Share and Cite
Zhai, C.; Zhang, Z.; Bao, G.; Zhang, D.; Liu, T.; Chen, J.; Ding, M.; Geng, R.; Fang, N. Comparing the Urban Floods Resistance of Common Tree Species in Winter City Parks. Land 2022, 11, 2247. https://doi.org/10.3390/land11122247
Zhai C, Zhang Z, Bao G, Zhang D, Liu T, Chen J, Ding M, Geng R, Fang N. Comparing the Urban Floods Resistance of Common Tree Species in Winter City Parks. Land. 2022; 11(12):2247. https://doi.org/10.3390/land11122247
Chicago/Turabian StyleZhai, Chang, Zhonghui Zhang, Guangdao Bao, Dan Zhang, Ting Liu, Jiaqi Chen, Mingming Ding, Ruoxuan Geng, and Ning Fang. 2022. "Comparing the Urban Floods Resistance of Common Tree Species in Winter City Parks" Land 11, no. 12: 2247. https://doi.org/10.3390/land11122247
APA StyleZhai, C., Zhang, Z., Bao, G., Zhang, D., Liu, T., Chen, J., Ding, M., Geng, R., & Fang, N. (2022). Comparing the Urban Floods Resistance of Common Tree Species in Winter City Parks. Land, 11(12), 2247. https://doi.org/10.3390/land11122247