Abstract
To understand the change in irrigation water requirement (IWR) in China under the changing climate conditions and grain planting structures, this paper focused on rice, wheat and maize and analyzed the IWR change in each county under the background of climate change and the adjustment of planting structure by means of the China Agro-Ecological Zones (China-AEZ) model. The results show that: (1) Climate change causes the increase of IWR. Compared with the 1961–1990 period, the average IWR of counties in China increased by 9.31 mm and 16.50% under the climate conditions of the 1981–2010 period. Regionally, the water consumption effect of climate change is stronger in water-poor areas than in water-rich areas. (2) Planting structure change causes the decrease of IWR. Compared with 1990, under the planting structure in 2014, the average IWR of counties in China decreased by 6.61 mm and 11.41%. Regionally, the water-saving effect of the change in planting structure in the north is stronger than that in the south. (3) With the change in climate conditions and planting structure, the average IWR of counties in China first increased and then decreased, with an overall increase of 2.06 mm and 3.56%. Regionally, the IWR in most parts of the country has shown a decreasing trend, while the IWR in northwestern and north China, where water resources are relatively scarce, has increased significantly. (4) Nationally, the change in IWR is dominated by climate change, and the overall trend is in the direction of water consumption. Therefore, adjusting the crop planting structure is a promising way to save irrigation water. To adapt to the pressures on water resources caused by climate change, the proportion of crops with water-saving advantages should be increased in the corresponding areas to achieve regional water savings. In northwest China, which mainly relies on irrigation water, many crops with low IWR should be planted, such as wheat and maize, while the planting proportion of rice should be reduced; furthermore, the planting proportion of wheat should be reduced, and the planting proportion of maize should be increased in north China. Finally, rice with high IWR should be more localized in central, southern and northeastern China.
1. Introduction
Current and future agricultural systems are arguably the sectors most affected by climate change [,]. In the past 100 years, climate change has been mainly characterized by obvious global warming. In the past 50 years, the rate of temperature rise has reached 0.13 °C/10a []. Moreover, there is a trend of continuous rise in temperature. Gao et al. found that substantial warming was found in both seasons and periods, and the warming was more pronounced at the end of the century (2081–2100) than in the middle (2041–2060) []. By the end of the 21st century (2090–2099), the likely range of global temperature increase is projected to be 1.1–6.4 °C (relative to 1980–1999) []. Obvious climate change has an important impact on crop phenology. Changes in crop phenology will cause changes in crop water consumption, leading to changes in crop evapotranspiration. The research results on the impact of global temperature change on crop water requirements are different. The reproductive growth period of wheat at 60% of the meteorological stations in China was significantly prolonged from 1981 to 2007 [,], and the increase in the growth period has a positive impact on crop water requirements. Other studies have found that climate warming will reduce the requirement for irrigation water for maize and rice in China due to the shortening of the growth period [,], and the reduction will increase with the increase of the global mean temperature for maize in China []. Adding a change in precipitation will inevitably lead to a change in the irrigation water requirement (IWR) pattern [,]. From 1963 to 2002, climate drove approximately 10% of the global demand change for irrigation water [].
For different crops, changes in water requirements are not the same under the influence of climate change. For regional water resources management, different crop combinations need to be considered comprehensively [,]. The change in food consumption structure caused by urbanization is the main driving force affecting the change in the agricultural planting structure in China []. In the context of rapid urbanization, China’s agricultural planting structure is undergoing and will undergo major changes, and changes in planting structure will have a great impact on the IWR. Since the 1990s, as the general dietary structure in China has changed to increase meat consumption and reduce staple food consumption, the proportion of rice and wheat sown area in grain crops has been decreasing, while the increase in meat consumption has led to the rapid increase in the use of maize as feed, and the proportion of maize sown area has started to show an increasing trend [,]. It is necessary to study how to reduce the requirement for irrigation water and improve the utilization efficiency of irrigation water by optimizing the planting structure []. For the same crop, the study found that different irrigation schemes and planting dates may have different effects on water consumption [,]. For different crops, the study found that different cultivation combinations might be coped with climate change in different regions on the basis of irrigation and water management [,].
Irrigation is an important means of stabilizing grain production. China’s agricultural water consumption accounts for 70% of the total annual water consumption of the whole society, while the proportion of agricultural water consumption in developed countries is typically below 50% []. Irrigation water accounts for more than 90% of agricultural water use and is an important part of agricultural water use []. Therefore, under the background of increasing global water resource shortages, understanding the change in irrigation water consumption under climate change and studying the influence of planting structure change on irrigation water demand indicate the direction for optimizing and adjusting planting structure from the perspective of agricultural water-saving; additionally, this research has positive significance for understanding the situation of agricultural water use and realizing the prediction and regulation of agricultural water use. For the impact of climate change and planting structure change on irrigation water use in China, the existing studies mainly focus on the irrigation area or regional level [,,,,] and are mostly based on site data [], using the Penman–Monteith model to calculate the crop IWR [,]. The results generally have low spatialization, and there is still a problem of insensitivity to the change in soil moisture content []. Moreover, most of the existing studies focus only on the impact of climate change or planting structures on the IWR. There are few studies that combine these two influences. Therefore, this study used a spatially detailed method that considered the process of soil water balance to study the impact of a long-time series of climate change and cropping structure changes on the IWR in China. The research results clarify the changes in the IWR under climate change and the direction of agricultural planting structure adjustment.
2. Methods and Data
2.1. Calculation of Crop Irrigation Water Requirement
China Agro-Ecological Zones model (China-AEZ) is based on the Global Agro-Ecological Zones model (Global-AEZ), while the parameters are all revised locally for China []. The main parameters of the China-AEZ model and its simulation results have been calibrated and validated []. Crop IWR is derived from crop water demand minus effective precipitation; thus, the calculation of crop water demand is the basis for calculating crop IWR. Crop water demand can be calculated by the energy balance method, micrometeorology method, soil water balance method, and yield and evaporation estimation method [,,,]. The above methods have different principles and limitations and have not been widely used in practice. Therefore, this study uses the method of the China-AEZ model to calculate crop water demand, which is embedded with the meteorological data method recommended by the Food and Agriculture Organization of the United Nations (FAO). The actual evapotranspiration of crops is calculated by crop coefficient and reference crop evapotranspiration. Among them, reference crop evapotranspiration is calculated by Penman–Monteith formula. The application of the China-AEZ model in the calculation of crop water demand has obvious advantages. The model can effectively estimate the available soil moisture through the soil water balance equation, causing the results to be closer to the real value, and the simulation results can be expressed spatially at a resolution of 1 km. At the same time, the results of the model can distinguish the rain-fed and irrigated conditions, so we can obtain the IWR of crops under irrigation conditions more specifically. Therefore, we choose to use the China-AEZ model to simulate crop IWR in a certain climate period. For the choice of climate period, according to the convention from the World Meteorological Organization (WMO), we chose 1961–1990 as the 6190 period, 1971–2000 as the 7100 period, 1981–2010 as the 8110 period, of which 8110 periods are used to represent the current climate conditions.
The main data needed for the model are as follows:
- Meteorological data included daily minimum temperature, maximum temperature, precipitation, solar radiation, wet-day frequency, wind speed at 10 m height and relative humidity. These data can be obtained from the China Meteorological Data Sharing Service System (http://data.cma.cn/ (accessed on 30 October 2022)). Solar radiation data are calculated from sunshine hours []. The time range of the data was 1961–2010, and the Anusplin [] method was used to interpolate the data into a 10 km spatial resolution.
- Soil data in 2000 with a 1 km spatial resolution. These data include soil type distribution data and attribute data for each soil type; data were obtained from the Harmonized World Soil Database (HWSD).
- Digital Elevation Model (DEM) data in 2000 with 90m spatial resolution. It can be obtained from the Shuttle Radar Topography Mission dataset (SRTM) (http://srtm.csi.cgiar.org/ (accessed on 30 October 2022)).
- Land use data in 2000 with 1km spatial resolution. It can be gained from the Data Center for Resources and Environmental Sciences, Chinese Academy of Sciences (RESDC) (http://www.resdc.cn (accessed on 30 October 2022)).
2.2. Calculation of Net Irrigation Water Requirement at the County Level
Since the minimum statistical unit of the data we obtained is the county level, the final spatial scale of our study is the county level; we calculated the change in IWR of the main crops planted in each county. Among them, rice, wheat and maize are important food crops in China. These three kinds of crops have accounted for more than 50% of the total sown area of crops in China for a long time. Rice, wheat and maize have accounted for more than 90% of the total grain production for a long time. Therefore, we chose these three crops as the main crops.
The formula for calculating the net IWR at the county level is as follows:
where is the net IWR of three crops planted in county j, is the average IWR of the crop i in county j, is the proportion of the average irrigated area of the arable land that planted crop i in county j, is the proportion of sown area of crop i in county j, and is calculated by: . Among them, is the sown area of the crop i in county j. The net IWR at the county level mainly depends on the climate conditions, planting structure and irrigation proportion of crops. This study mainly focuses on the influence of the former two. Therefore, the crop irrigation ratio in each period is fixed as the average of the three years of 1990, 2000 and 2014. The specific calculation method for the crop irrigation ratio is shown in Section 2.3.
We believe that if there is no major policy effect, the planting structure is relatively stable for a period of time. Therefore, we chose the sowing data of crops from 1990, 2000 and 2014 in counties to correspond to the planting structure of crops in the 6190, 7100 and 8110 periods, respectively. The data of the sown area of the three crops in each county used in this part were obtained from the Ministry of Agriculture and Rural Affairs of China.
2.3. Spatialization of the Crop Irrigation Ratio
This part acquired the total arable land area and the effective irrigated land area in China’s counties in 1990, 2000 and 2014. Therefore, the statistical data should be allocated to the crops to obtain the irrigation proportion of the three crops in each county. In China, rice is basically paddy rice, so the irrigation proportion of rice was set at 100%, that is . At the same time, the irrigation property belongs to the specific plot, and it is the farmer’s choice to choose which crops to plant on a specific plot. Therefore, in this study, all crops except rice adopt the same irrigation ratio, and the formula is as follows:
where is the proportion of irrigated area of wheat and maize in county j in year y, is the effective irrigated arable land area in county j in year y, is the total arable land area in county j in year y, and is the arable land area that planted rice in county j in year y.
Considering that there are single-cropping and double-cropping rice areas in China, is calculated in two cases. First, according to the sown areas of single-cropping rice, double-cropping early rice and double-cropping late rice in the statistical yearbook, the single-cropping rice area and double-cropping rice area were divided. The provinces with 0 sown areas of double-cropping early rice and double-cropping late rice were single-cropping rice areas. In the provinces where only one season of rice was planted, the arable land that planted rice was the sown area of rice, that is . In the provinces where two-season rice was planted, the proportion of double-cropping rice sown area in year y was calculated first:, where is the sown area of double-cropping early rice in year y in that province, is the sown area of double-cropping late rice in year y in that province, and is the total sown area of rice in year y in that province. The arable land that planted rice in county j in year y can be calculated as follows: .
At the same time, to control the influence in the change of irrigation proportion on the IWR in different periods, the average proportion of crop irrigation area in 1990, 2000 and 2014 was adopted in each year; that is, .
3. Results
3.1. Temporal and Spatial Variations in Climate Change and Planting Structure
We used the average status of temperature and precipitation changes in different periods to reflect climate change. According to the geographical, climatic and economic conditions, China was divided into seven regions in this study. From the annual average precipitation, south China, east China and central China were the highest, followed by southwest, northeast, north China and northwest China. July, August and June had the most precipitation in a year, followed by May, September and April, October, March and November, while the least precipitation occurred in February, January and December. From the perspective of precipitation change, the annual average precipitation in China increased by 0.20 mm per year from 1961 to 2010. The monthly average precipitation in January, February, March, May, June and December showed an increasing trend, and the annual average precipitation increased at rates of 0.13 mm, 0.11 mm, 0.14 mm, 0.07 mm, 0.27 mm and 0.06 mm, respectively. The precipitation in April, July, August, September, October and November showed a decreasing trend, and the annual average precipitation decreased by 0.11 mm, 0.002 mm, 0.10 mm, 0.26 mm, 0.06 mm and 0.07 mm, respectively. From the perspective of crop growth, the decrease in precipitation in these months will have a greater impact on crop growth and grain grouting. It can be seen from the seasonal change that the precipitation in China tends to be dryer in summer and autumn and wetter in winter and spring. That is, the precipitation in the months with more precipitation decreases, the precipitation in the months with less precipitation increases, and the precipitation difference among each month tends to decrease.
From 1961 to 2010, the variation rules of different regions were different. The regions with obvious increases in precipitation were mainly in south China, east China and central China, with annual average increases in precipitation being 1.83 mm, 1.74 mm and 0.64 mm, respectively. The regions with reduced precipitation were north China, northwest China, northeast China and southwest China. The regions with significantly reduced precipitation were concentrated in north China, northeast China and northwest China, and the annual average precipitation decreases were 1.09 mm, 0.62 mm and 0.25 mm, respectively. We regarded 1961–1990 as the first base period of 30 years, 1971–2000 as the second base period of 30 years, and 1981–2010 as the third base period of 30 years. From the changes in different periods (Figure 1), the annual average precipitation showed an increasing trend in east and central China and a decreasing trend in north and southwest China. The annual average precipitation in south China and northeast China first increased and then decreased, while it first decreased and then increased in northwest China. The average annual precipitation of China in the third base period was 8.43 mm higher than that in the first period. The average annual precipitation of south China, east China and central China in the third base period was 48.82 mm, 45.57 mm and 18.88 mm higher than that in the first base period, respectively. The average annual precipitation of north China, northwest China, southwest China and northeast China in the third base period was 28.50 mm, 5.32 mm, 4.38 mm and 1.43 mm lower than that in the first base period, respectively. It can be seen that the trend of precipitation change showed that the precipitation in areas with more precipitation continued to increase, the precipitation in areas with less precipitation continued to decrease, and the spatial distribution difference of precipitation had an expanding trend.
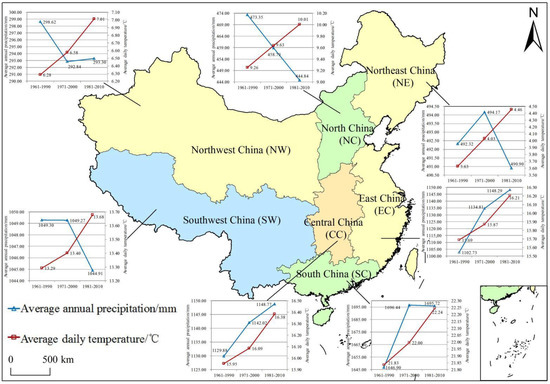
Figure 1.
Changes in average annual precipitation and average daily temperature in three basic climatic periods in different regions of China.
In terms of the daily average temperature, the areas with higher daily average temperature were concentrated in south China, central China and east China, followed by southwest China, north China, northwest China and northeast China. Among the monthly average daily temperatures, the highest was in July, August, June and September, followed by May, April and October, and the lowest was in March, November, February, December and January. From the change in daily average temperature, the warming trend of all regions in China was obvious from 1961 to 2010. The average annual temperature increased by 0.03 °C in China. The daily average temperature of each month showed an obvious increasing trend, and the order of temperature increase in each month was as follows: the annual average daily temperature of February increased by 0.060 °C, January by 0.036 °C, March by 0.035 °C, December by 0.034 °C, April by 0.032 °C, October by 0.028 °C, November by 0.028 °C, September by 0.027 °C, June by 0.025 °C, May by 0.022 °C, July by 0.017 °C, and August by 0.014 °C. The temperature increase in the low-temperature season was higher than that in the high-temperature season, and the monthly temperature gap tended to shrink.
From 1961 to 2010, the annual average warming in northeast, northwest and north China was the highest, with values of 0.038, 0.036 and 0.034 °C respectively, followed by that in east China, with an average annual warming of 0.023 °C, central China with an average annual warming of 0.021 °C, and southwest and south China with an average annual warming of 0.019 °C. From the changes in the different periods (Figure 1), the daily average temperature in all regions across the country showed an increasing trend, and nationwide, the daily average temperature in the third base period has increased by 0.63 °C relative to that in the first base period. According to the range of warming, the order of warming ranges is 0.83 °C in northeast China, 0.75 °C in north China, 0.73 °C in northwest China, 0.52 °C in east China, 0.43 °C in central China, 0.41 °C in south China and 0.39 °C in southwest China. The spatial difference in the temperature distribution also tended to decrease, and the warming trend in China was obvious.
In 1990, the proportions of the sown areas of rice, wheat and maize were 33.40%, 33.36% and 33.24%, respectively. The sown area of the three crops was relatively balanced. Regionally, the proportion of rice sown area was the highest in central and southern China, with values of 45.26% and 34.26%, respectively; the proportion of wheat sown area was the highest in north and central China, with values of 55.24% and 38.70% respectively; and the proportion of maize sown area was the highest in northeast and north China, with values of 65.75% and 41.48%, respectively.
In 2000, the proportions of sown areas of rice, wheat and maize were 37.39%, 33.91% and 28.70%, respectively. Regionally, the proportion of rice sown area was the highest in south and east China, with values of 85.45% and 46.42%, respectively; wheat sown area was the highest in northwest and north China, with values of 62.33% and 50.18% respectively; maize sown area was still the highest in northeast and north China, with values of 67.44% and 47.31%, respectively.
In 2014, the proportions of sown areas of rice, wheat and maize were 36.86%, 24.74% and 38.39%, respectively. Compared with 1990 and 2000, the proportion of the sown area of wheat significantly declined. Regionally, the proportion of rice-sown areas in south and east China is still the highest, with values of 85.07% and 58.95%, respectively; the proportion of wheat-sown areas in northwest and north China is the highest, with values of 49.74% and 36.26% respectively; and the proportion of maize sown area in northeast and north China is still the highest, with values of 79.66% and 62.70%, respectively.
From the changes in the proportion of rice sown area (Figure 2), from 1990 to 2014, the proportion of rice sown area first increased, then decreased, and showed an overall growth trend throughout the country. Regionally, the proportion of rice sown area increased continuously in east China and declined continuously in north China, central China and northwest China; however, it first increased, then decreased, and generally increased overall in northeast, south and southwest China. Among them, the most significant growth trend was found in south China, which increased from 34.26% in 1990 to 85.07% in 2014, more than doubling. The most notable decreasing trend was found in the northwest, which decreased from 32.84% in 1990 to 2.08% in 2014, a reduction of more than 14 times.
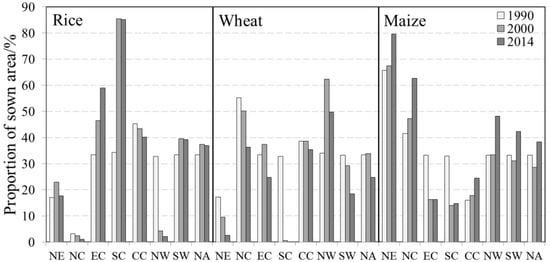
Figure 2.
Changes in rice, wheat and maize sown area proportions in different regions of China in 1990, 2000 and 2014.
From the perspective in the changes of the proportion of wheat sown area (Figure 2), during the period of 1990–2014, the proportion of wheat sown area first increased, then decreased, and overall decreased nationwide. Regionally, the proportion of wheat sown area in northeast China, north China, south China, central and southwest China showed a continuous decreasing trend. The proportion first increased, then decreased, and decreased overall in east China. The proportion first increased, then decreased, and increased overall in northwest China. Among them, the most significant increasing trend was found in northwest China, which increased from 33.94% in 1990 to 49.74% in 2014. The most significant decreasing trend was found in south China, which changed from 32.81% in 1990 to 0.12% in 2014.
According to the changes in the proportion of maize sown area (Figure 2), from 1990 to 2014, the proportion of maize sown area first decreased, then increased, and overall showed an increasing trend throughout the country. Regionally, the proportion of maize sown area in northeast China, north China, central China and northwest China showed a sustained growth trend. The areas first had a decreasing trend followed by an increasing trend, while overall, an increasing trend was found in southwest China. The areas with a decreasing trend and then an increasing trend, while overall, decreasing trends are found in east China and south China. Among them, the most significant growth trend was found in north China, which increased from 41.48% in 1990 to 62.70% in 2014. The most significant decreasing trend was found in south China, with a change from 32.93% in 1990 to 14.81% in 2014.
3.2. Irrigation Water Requirement of Crops and Its Validation
To verify the applicability and accuracy of the model, we verified the evapotranspiration results of the model using meteorological site monitoring data. From the scatter diagram in Figure 3, it can be seen that the simulation value is positively correlated with the site value, and the spatial distribution is consistent. Thus, the simulated value can accurately reflect the real level of crop evapotranspiration in China. Simultaneously, we compared the maximum IWR calculated based on the site data in the literature [] with the maximum IWR simulated by the China-AEZ model. Because rice can be divided into early, middle and late rice, the growth period of different rice types is different; thus, the IWR varies greatly. Additionally, the IWR of wheat has not been obtained nationwide; thus, we compared the IWR of maize in the 7100 period (Figure 4). We found that the relative error was less than 20% between the site-based value and our simulation results. Among them, the simulation values of north China, southwest China, northwest China and central China are much higher, which are 2.33%, 4.00%, 7.13% and 7.50% higher, respectively. The simulation values of south China and northeast China were lower by 18.00% and 19.55%, respectively. The simulated crop IWR was not used for the analysis of the absolute value; the key point was to compare among different periods, so the simulation accuracy of the model met our research requirements.
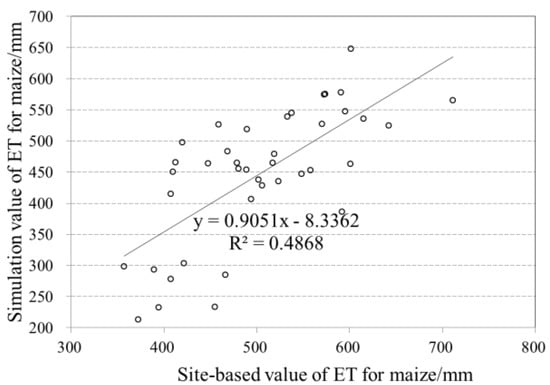
Figure 3.
Comparison of site-based value and simulation value of evapotranspiration for maize.
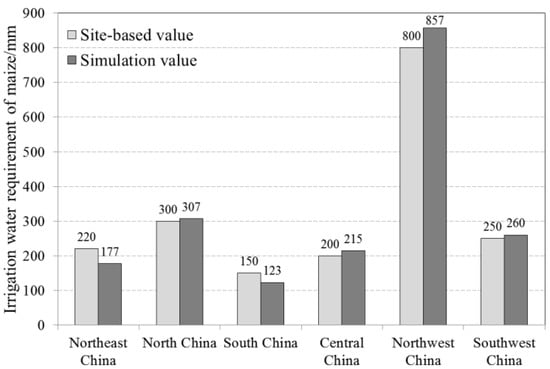
Figure 4.
Comparison of site-based value and simulation value of the maximum IWR for maize in different regions in China in the 1970–2000 period.
The present situation is represented by the meteorological conditions from 1981 to 2010. The IWR of three crops in the 8110 period was as follows (Figure 5). According to the IWR of the three crops, the IWR of rice was the highest, with a value of 1021 mm, followed by that of maize, with the highest value of 892 mm. Then, wheat had the highest value of 807 mm. From the spatial distribution, the distribution of the IWR of rice and maize was similar, and the high-value areas were mainly distributed in the region of northwest China. The IWR of wheat was higher in northwest, southwest and north China. Most of the high-value areas of IWR were arid and semiarid areas with average annual precipitation of less than 400 mm. The shortage of water resources in these areas is serious. Therefore, it is particularly important for crop planting structures to adjust to save more water in these regions.
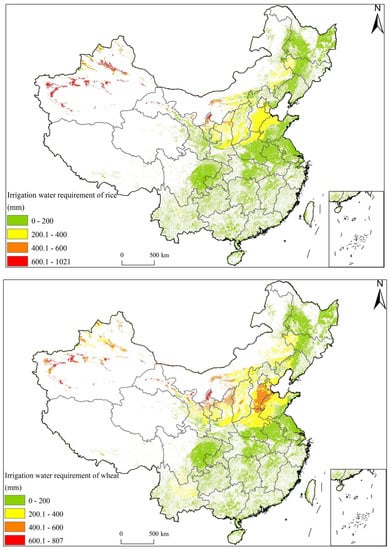
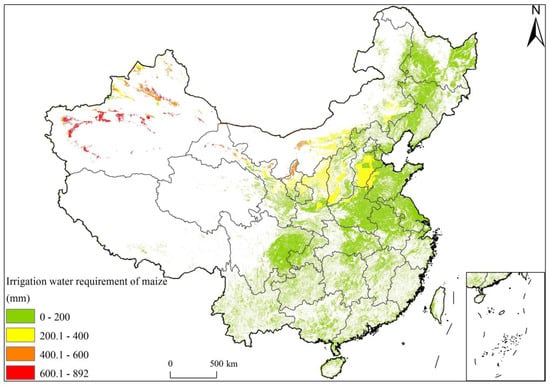
Figure 5.
Spatial distribution of the IWR of rice, wheat and maize in the 1980–2010 period.
3.3. Temporal and Spatial Variations in Net Irrigation Water Requirement Caused by Climate Change
We kept the planting structure unchanged in 1990 and changed the climatic conditions of the 6190, 7100 and 8110 periods to explore the temporal and spatial variations in the net IWR caused by climate change at the county level. The spatial distribution of the IWR at the county level was similar under these three climatic conditions of the 6190, 7100 and 8110 periods. The high-value areas of IWR were concentrated in northwest, north, southwest and western–northeast China. From a national perspective, under the climate conditions of the 6190 period, the average IWR at the county level was 56.46 mm, increased to 61.90 mm under the climate conditions of the 7100 period, and then continued to increase to 65.77 mm under the climate conditions of the 8110 period. With the changes in climate conditions, the average IWR at the county level in China is increasing gradually, with an overall increase of 9.31 mm, equivalent to 93.10 m3/ha, accounting for 16.50% of the total IWR in 6190 period. Regionally (Table 1), the IWR in northwest and north China is the highest, followed by that in central and eastern China, and then by that in northeast, southwest and south China. The county-level IWR in northeast China, north China, east China, central China and northwest China all showed a gradual upward trend. Among them, north China and northwest China increased the most. Compared with the climate conditions in the 6190 period, the IWR in the 8110 period increased by 32.11 mm and 19.96 mm, respectively, in these two regions. The highest growth rates were found in north China and east China, where the IWR increased by 24.92% and 21.04%, respectively. The IWR in south China is decreasing gradually, and the decreasing trend is obvious. Compared with the 6190 period, the IWR in south China in the 8110 period decreased by 3.91 mm, accounting for 40.49% of the IWR in the 6190 period. However, the IWR in southwest China first decreased and then increased, with a general decreasing trend. From 6190 to 7100, it decreased by 0.59 mm, and from 7100 to 8110, it increased by 0.40 mm, with an overall decrease of 0.18 mm, accounting for 0.95%.

Table 1.
IWR and its variation caused by climate change in different regions in different periods.
At the county level (Figure 6), the areas with increased IWR were concentrated in northwest and north China, eastern Inner Mongolia and northeastern Sichuan, where water resources are essentially scarce. The impact of climate change on these areas is undoubtedly aggravated by water resource scarcity. However, the IWR in northeast China, south China, central China, southwest Xinjiang and southwest Sichuan has decreased significantly. Regionally, the increase of water requirement due to climate change is more obvious in the north than in the south, and the north is more water deficient than the south.
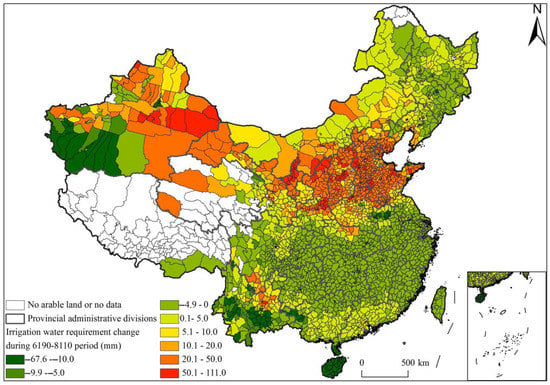
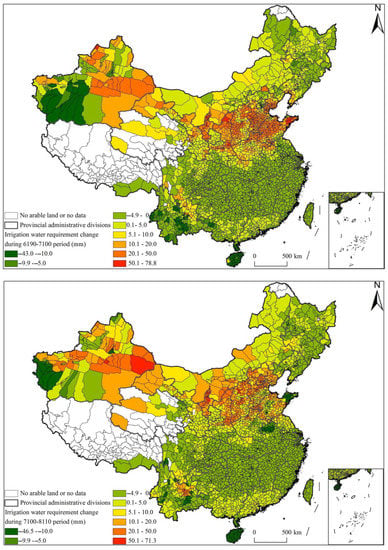
Figure 6.
Variation in IWR caused by climate change in counties during the 6190–8110, 6190–7100 and 7100–8110 periods.
3.4. Temporal and Spatial Variations in Net Irrigation Water Requirement Caused by Changes in Planting Structure
We kept the climate conditions the same as those in the 6190 period and changed the planting structure of counties in 1990, 2000 and 2014 to explore the temporal and spatial changes in the IWR caused by the changes in planting structure at the county level. In 1990, 2000 and 2014, the spatial distribution of IWR at the county level was similar. The high-value areas of IWR were concentrated in northwest, north China, southwest and the west of northeast China. From a national perspective, under the planting structure in 1990, the average IWR at the county level was 57.88 mm, increased to 59.28 mm in 2000, and then decreased to 51.27 mm in 2014. With the change in planting structure, the average IWR at the county level in China first increased and then decreased; overall, the value decreased by 6.61 mm, equivalent to 66.10 m3/ha, accounting for 11.41% of the IWR under the planting structure in 1990. Regionally (Table 2), the IWR in northwest and north China was the highest, followed by that in central and east China, and that in southwest, northeast and south China. The county-level IWR in northeast, south, central and southwest China first increased and then decreased, with an overall decreasing trend. Among them, the IWR in northeast and southwest China decreased most in 2014 relative to the IWR in 1990, decreasing by 5.62 mm and 4.60 mm, respectively, accounting for 28.29% and 21.13% of the IWR in 1990, respectively. During 1990–2014, the IWR in north China and east China showed a continuous downward trend. Compared with 1990, the IWR in 2014 decreased by 22.32 mm and 8.31 mm, accounting for 17.51% and 23.29% of the IWR in 1990, respectively, in north China and east China. However, only in the region of northwest China did the IWR first increase and then decrease, with an overall increasing trend. From 1990 to 2000, it increased by 1.62 mm, and from 2000 to 2014, it decreased by 1.01 mm, with an overall increase of 0.61 mm, accounting for 0.38%.

Table 2.
IWR and its variation caused by planting structure change in different regions in different periods.
At the county level (Figure 7), compared with the planting structure in 1990, the areas where IWR increased in 2000 were mainly distributed in northern Xinjiang, western of northeast China, north China and south–central Sichuan. Compared with 2000, the areas where IWR increased were mainly distributed in Xinjiang due to the planting structure in 2014. In these three periods, the increase of IWR caused by the change of planting structure from 1990 to 2014 was mainly concentrated in north Xinjiang and the west of the northeast region. IWR in most parts of the country has shown a decreasing trend. The water-saving effect of the changes in planting structure is stronger in the poor-water area than in the rich-water area.
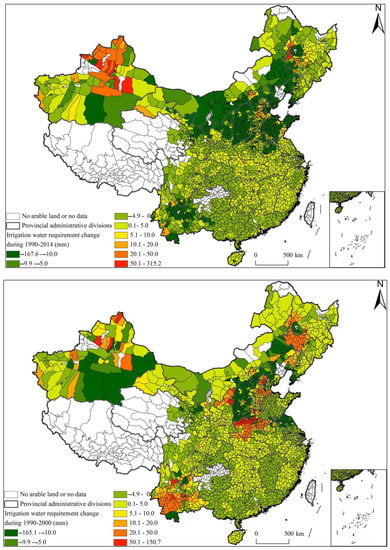
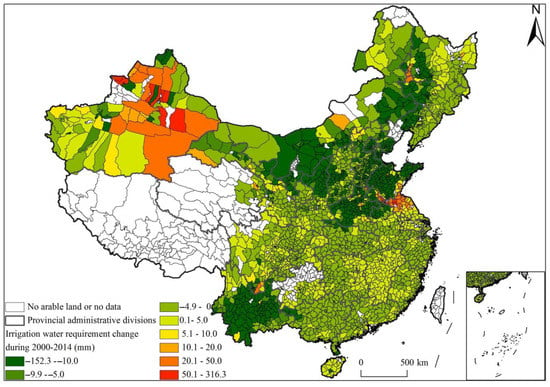
Figure 7.
Variation of IWR caused by planting structure change of counties during 1990–2014, 1990–2000 and 2000–2014 periods.
3.5. Temporal and Spatial Variations in Net Irrigation Water Requirement Caused by Changes in Climate Conditions and Planting Structure
We combined climate change with planting structure change to explore the joint effect of climate change and planting structure change on the net IWR in each county. The spatial distribution of IWR at the county level was similar in 6190, 7100 and 8110. The high-value areas of IWR were concentrated in northwest China, north China, southwest China and west of northeast China. From a national perspective, the average IWR at the county level was 57.88 mm in the 6190 period, increased to 64.36 mm in the 7100 period and decreased to 59.94 mm in the 8110 period. With the change in climatic conditions and planting structure, the average IWR at the county level first increased and then decreased, with an overall increasing trend in China. The IWR increased by 2.06 mm as a whole, equivalent to 20.60 m3/ha, which accounted for 3.56% of the IWR in the 6190 period. Regionally (Table 3), the IWR in northwest and north China was the largest, followed by that in central and east China, and that in southwest, northeast and south China. The IWR in central China and north China first increased and then decreased, showing an overall increasing trend. Compared with the IWR in the 6190 period, the IWR in the 8110 period increased by 5.75 mm and 4.92 mm, accounting for 14.44% and 3.86%, respectively. The IWR in southwest, northeast and east China first increased and then decreased, showing an overall decreasing trend. Compared with the 6190 period, the IWR of these three regions in the 8110 period decreased by 5.66 mm, 2.61 mm and 0.74 mm, accounting for 26.01%, 13.16% and 2.07%, respectively. In northwest China, the IWR showed a continuously increasing trend. Compared with the 6190 period, the IWR in the 8110 period increased by 17.97 mm, accounting for 11.41%. The IWR in south China showed a continuous decreasing trend. Compared with the 6190 period, the IWR in the 8110 period decreased by 4.05 mm, accounting for 40.39%.

Table 3.
IWR and its variation caused by climate change and planting structure change in different regions in different periods.
At the county level (Figure 8), compared with the 6190 period, the areas where IWR increased in the 7100 period were mainly distributed in the northwest, north China, the western part of northeast China and the central and southern part of Sichuan. Compared with the period of 7100, the increased region of IWR in the 8110 period was mainly distributed in Xinjiang and scattered in north China Plain. In these three periods, the increase of IWR caused by the change in climate conditions and planting structure is mainly concentrated in the northwest and north China region. IWR in most parts of the country has a decreasing trend.
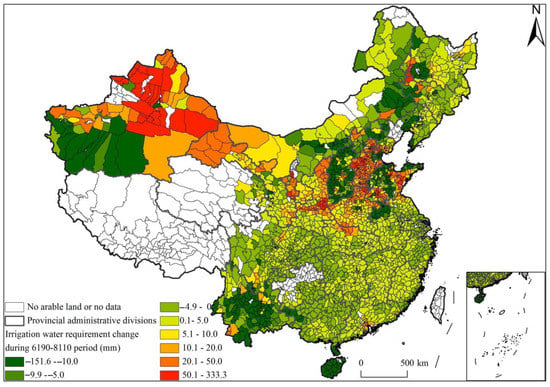
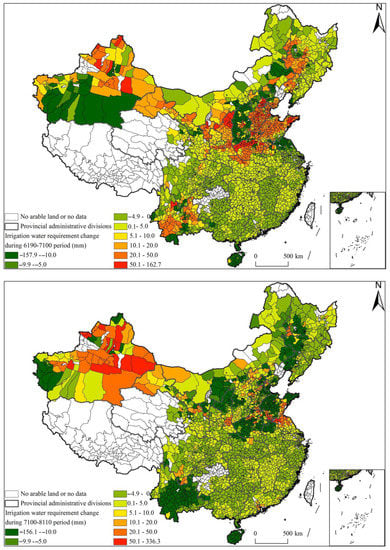
Figure 8.
Variation of IWR caused by climate change and planting structure change of counties during 6190–8110, 6190–7100 and 7100–8110 periods.
From the relative contribution of climate change and planting structure adjustment (Figure 9), according to the direction of the impact, the change in IWR in China is mainly affected by climate change rather than by planting structure change. In north China and central China, the increase in IWR caused by climate change exceeded the decrease caused by the change in planting structure, and the IWR showed an increasing trend. In northeast China and east China, the decrease in IWR caused by the change in planting structure exceeded the increase in IWR caused by climate change, and the IWR tended to decrease. In south, southwest and northwest China, climate change and planting structure change had the same impact direction on the IWR. Judging by the magnitude of the impact, the change in IWR in south and northwest China was more affected by climate change, while the change in IWR in southwest China was more affected by planting structure change. Therefore, currently, the change in IWR in northeast, east and southwest China was dominated by the change in planting structure, and the direction of the IWR change was toward becoming more water-saving. The change in IWR in north China, south China, central China and northwest China was dominated by climate change. Among these regions, except south China, the change directions of IWR in other areas were all toward water consumption. Nationally, the change in IWR in China is still dominated by climate change, and the overall trend is toward the direction of water consumption. Therefore, adjusting crop planting structure is a promising way to save irrigation water [,].
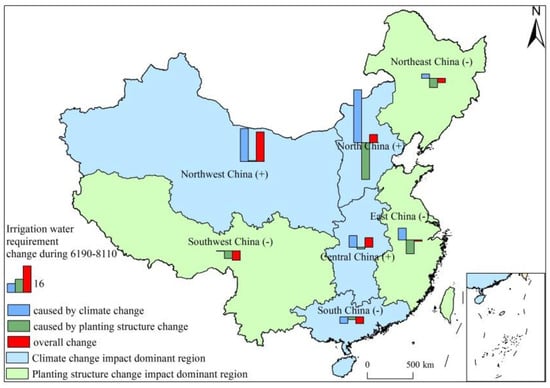
Figure 9.
Main driving factors in the variations of IWR in different regions during 6190–8110 periods.
4. Discussions
For different crops, the impact of climate change on the requirement for irrigation water is different [,,,]. This study does not focus on specific crops but on the irrigation water requirement of main grain crops at the county level. Moreover, the range of irrigation water requirements obtained from different studies is wide, which may be due to the uncertainty caused by the lack of consideration of extreme climate events []. This study uses effective precipitation as a model parameter to avoid this problem as much as possible. Regionally, the situation of water use in water-scarce areas is becoming tenser [], which is consistent with the results of this study. Moreover, in future climate change, the world aggregate net IWR and China IWR will show the strongest signal and consistently increase by the 2080s [,]. Regarding the studies of the impact of planting structure changes on IWR, the changing trend of IWR is also consistent with our study; during the 1990s–2010s, the nationwide and regional IWR showed a significant downward trend due to the adjustment of planting structure [,]. However, in terms of the specific value of the declines, some studies have found that the adjustment of planting structure saved 4.20% of water consumption [] in 1996–2015, and the decline of IWR in our study was more obvious in the same period when the proportion reached 11.41%. Not only planting structure, irrigation methods, planting methods and tillage patterns have an impact on crop IWR [,]. This study has not fully considered these technical factors.
In addition, only the net IWR was studied in this paper. If the effective utilization of farmland irrigation water is considered, the actual gross IWR would be different []. In 2015, the effective utilization coefficient of farmland irrigation water in China was 0.536, and the average gross IWR of the three crops in China was 111.83 mm under the climate conditions of the 8110 period and the crop planting structure in 2014. Regionally (Figure 10), the effective utilization coefficients of farmland irrigation water in each region, from high to low, were 0.62 in north China, 0.58 in east China, 0.57 in northeast China, 0.53 in central China, 0.52 in northwest China, 0.50 in south China and 0.45 in southwest China. The distribution of the effective utilization coefficient of farmland irrigation water was high in the north and east and low in the south and west. The relatively high IWR in the western region will lead to greater actual irrigation water consumption in the western region. The western region itself is an area with water shortages, which will make the local water resource situation more scarce and tense. Meanwhile, water demand can be compared with water resources, and the change in water resource pressure in different regions can be obtained. Furthermore, according to Zhan et al.’s division of the period of the changes in planting structure in rural China, grain crops were mainly planted in rural China from the 1970s to 1990s. High-value-added cash crops began to appear after the 1990s []. At the end of 2015, the Chinese government proposed a structural reform of the agricultural supply side, actively optimizing and adjusting the planting structure. Thus, the next step should be to add the consideration of the effective utilization coefficient of farmland irrigation water, more kinds of grain crops and cash crops and a lengthened time series.
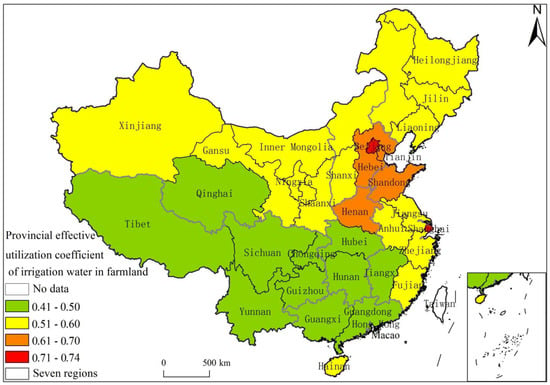
Figure 10.
Effective utilization coefficient of farmland irrigation water in each province in 2015.
5. Conclusions
This paper used a spatially detailed model and overcame the problem related to the difficulty of describing the process of soil water balance. Based on the three crops of rice, wheat and maize, the effects of climate change, planting structure change and comprehensive effects of climate and planting structure change on IWR have been studied accurately at the county level with the influence of irrigation-proportion controlled. The study provides a new direction for moderately adjusting planting structures in response to climate change. The conclusions are as follows. (1) Climate change causes the increase of IWR at the county level. Compared with the 6190 period, the average IWR of counties increased by 16.50% in the 8110 period. Regionally, the water consumption effect of climate change was stronger in the water-poor areas than in the water-rich areas. (2) Planting structure change causes the decrease of IWR at the county level. Compared with 1990, the average IWR of counties in 2014 decreased by 11.41% compared with 1990. Regionally, the water-saving effect of the change in planting structure in the north was stronger than that in the south, where water resources are abundant. (3) With the change in climatic conditions and planting structure, the average IWR of counties in China first increased and then decreased. The IWR overall increased by 3.56%. Regionally, the IWR in most parts of the country showed a decreasing trend, while the IWR in the regions of northwest and north China, where water resources are relatively scarce, has increased significantly. If the effective utilization coefficient of farmland irrigation water is considered, the water resources in northwest China will be more scarce and tense. (4) From the national perspective, the change in IWR in China is dominated by climate change, and adjusting crop planting structures is a promising method to save irrigation water. To adapt to the pressure of water resources brought by climate change, the proportion of crops with water-saving advantages should be increased in the corresponding areas to achieve regional water savings. In northwest China, which mainly depends on irrigation water, crops with low IWR should increase, such as wheat and maize, while the proportion of rice should be reduced; in northern China, the proportion of wheat planting should be reduced, and the proportion of maize planting should be increased; finally, rice, which has high IWR, should be more oriented to central, southern and northeast China.
Author Contributions
Conceptualization, L.X.; methodology, J.W.; software, J.W., M.J. and X.W.; validation, J.W. and X.W.; formal analysis, J.W.; writing—original draft preparation, J.W.; writing—review and editing, L.X. and X.W.; visualization, J.W.; supervision, L.X. and X.W.; funding acquisition, X.W. All authors have read and agreed to the published version of the manuscript.
Funding
Projects of International Cooperation and Exchanges NSFC: 42061124002; National Key Research and Development Program of China: 2017YFE0104600; National Natural Science Foundation of China: 42171264.
Data Availability Statement
Not applicable.
Acknowledgments
The authors thank the reviewers and editors for their valuable comments about the manuscript.
Conflicts of Interest
The authors declare no conflict of interest.
References
- Rosenzweig, C.; Elliott, J.; Deryng, D.; Ruane, A.C.; Müller, C.; Arneth, A.; Boote, K.J.; Folberth, C.; Glotter, M.; Khabarov, N.; et al. Assessing agricultural risks of climate change in the 21st century in a global gridded crop model intercomparison. Proc. Natl. Acad. Sci. USA 2014, 111, 3268–3273. [Google Scholar] [CrossRef] [PubMed]
- Alex, C.R.; Cynthia, R. Agriculture & Food Systems to 2050: A Synthesis. Chapter 5: Climate Change Impacts on Agriculture; World Scientific: Singapore, 2018. [Google Scholar]
- IPCC. Climate Change 2013: The Physical Science Basis; IPCC: Cambridge, UK, 2013. [Google Scholar]
- Gao, X.; Shi, Y.; Zhang, D.; Giorgi, F. Climate change in China in the 21st century as simulated by a high resolution regional climate model. Chin. Sci. Bull. 2012, 57, 1188–1195. [Google Scholar] [CrossRef]
- IPCC. Climate Change 2007: The Physical Science Basis; IPCC: Cambridge, UK, 2007. [Google Scholar]
- Tao, F.; Zhang, S.; Zhang, Z. Spatiotemporal changes of wheat phenology in China under the effects of temperature, day length and cultivar thermal characteristics. Eur. J. Agron. 2012, 43, 201–212. [Google Scholar] [CrossRef]
- Zhao, Y.; Xiao, D.; Bai, H.; Tao, F. Research progress on the response and adaptation of crop phenology to climate change in China. Prog. Geogr. 2019, 38, 224–235. [Google Scholar]
- Wang, W.; Sun, F.; Peng, S.; Xu, J.; Luo, Y.; Jiao, X. Simulation of response of water requirement for rice irrigation to climate change. Trans. Chin. Soc. Agric. Eng. 2013, 29, 90–98. [Google Scholar]
- Xiao, D.; Liu, D.; Wang, B.; Feng, P.; Bai, H.; Tang, J. Climate change impact on yields and water use of wheat and maize in the North China Plain under future climate change scenarios. Agric. Water Manag. 2020, 238, 106238. [Google Scholar] [CrossRef]
- Tao, F.; Zhang, Z. Impacts of climate change as a function of global mean temperature: Maize productivity and water use in China. Clim. Chang. 2011, 105, 409–432. [Google Scholar] [CrossRef]
- Wang, W.; Peng, S.; Sun, F.; Xing, W.; Luo, Y.; Xu, J. Spatiotemporal variations of rice irrigation water requirements in the mid-lower reaches of Yangtze River under changing climate. Adv. Water Sci. 2012, 23, 656–664. [Google Scholar]
- Yan, R.; Cai, Y.; Li, C.; Wang, X.; Liu, Q. Hydrological responses to climate and land use changes in a watershed of the Loess Plateau, China. Sustainability 2019, 11, 1443. [Google Scholar] [CrossRef]
- Wisser, D.; Frolking, S.; Douglas, E.M.; Fekete, B.M.; Vorosmarty, C.J.; Schumann, A.H. Global irrigation water demand: Variability and uncertainties arising from agricultural and climate data sets. Geophys. Res. Lett. 2008, 35, 1–5. [Google Scholar] [CrossRef]
- Liu, J.; Hu, X.; Lu, X.; Qin, D.; Han, B. Research on agricultural planting structure adjustment and economical irrigation quota for water scarcity area. Water Resour. Hydropower Eng. 2011, 42, 52–57. [Google Scholar]
- Ren, P.; Huang, F.; Li, B. Spatiotemporal patterns of water consumption and irrigation requirements of wheat-maize in the Huang-Huai-Hai Plain, China and options of their reduction. Agric. Water Manag. 2022, 263, 107468. [Google Scholar] [CrossRef]
- Liang, S. Space distribution and reason analysis of the changes in agriculture planting structure of China. Chin. J. Agric. Resour. Reg. Plan. 2006, 27, 29–34. [Google Scholar]
- Liang, S.; Meng, Z.; Bai, S. Study on the change of agricultural planting structure in China based on village survey. Issues Agric. Econ. 2008, S1, 26–31. [Google Scholar]
- Liu, Z.; Yang, P.; Wu, W.; Li, Z.; You, L. Spatio-temporal changes in Chinese crop patterns over the past three decades. Acta Geogr. Sin. 2016, 71, 840–851. [Google Scholar]
- Zhang, S.; Tian, Q.; Zhao, H.; Zhang, T.; Zhang, T.; Hu, K. Improving footprint-based water use efficiency through planting structure optimization. Ecol. Eng. 2022, 180, 2–16. [Google Scholar] [CrossRef]
- Acharjee, T.K.; Ullah, M.S. Irrigation requirement and possibility of high-temperature stress of wheat for different planting dates under climate change in Bogura, Bangladesh. J. Bangladesh Agric. Univ. 2021, 19, 277–286. [Google Scholar] [CrossRef]
- Ji, J.; Wei, Y.; Liu, H.; Ahmad, K. Water consumption processes of different planting models in rice production of Northeast China. J. Northeast. Agric. Univ. 2021, 28, 88–96. [Google Scholar]
- Hossain, M.Z.; Ali, M.A. Climate change effect on irrigation water requirement of wheat and maize in Northern Part of Bangladesh. Int. J. Clim. Res. 2021, 5, 25–34. [Google Scholar]
- Liu, Y.; Lin, Y.; Huo, Z.; Zhang, C.; Wang, C.; Xue, J.; Huang, G. Spatio-temporal variation of irrigation water requirements for wheat and maize in the Yellow River Basin, China, 1974–2017. Agric. Water Manag. 2022, 262, 107451. [Google Scholar] [CrossRef]
- Chen, Z. Research Advance and Development Trends of Biology Water Saving. Sci. Agric. Sin. 2007, 40, 1456–1462. [Google Scholar]
- Huang, X.; Gao, F.; Wang, X. Water-saving irrigation and sustainable utilization of water resources in the 21st century. Irrig. Drain. 2001, 20, 1–5. [Google Scholar]
- Wang, X.; He, R.; Shang, M. Research on regional irrigation water demand under climate change. China Rural. Water Hydropower 2011, 1, 29–36. [Google Scholar]
- Huang, Z.; Wang, X.; Xiao, Y.; Yang, F.; Wang, C. Effect of climate change on rice irrigation water requirement in Songnen Plain, Northeast China. Chin. J. Appl. Ecol. 2015, 26, 260–268. [Google Scholar]
- Zhang, Z.; Su, X.; Dang, Y.; Xiang, Y.; Cui, C.; Tian, Z. Influence of crop planting structure change on irrigation water requirement in Jinghuiqu irrigation area. Trans. Chin. Soc. Agric. Mach. 2016, 47, 122–130. [Google Scholar]
- Jin, T. The adjustment of China’s grain cropping structure and its effect on the consumption of water and land resources. J. Nat. Resour. 2019, 34, 14–25. [Google Scholar] [CrossRef]
- Wang, W.; Yu, Z.; Zhang, W.; Shao, Q.; Zhang, Y.; Luo, Y.; Jiao, X.; Xu, J. Responses of rice yield, irrigation water requirement and water use efficiency to climate change in China: Historical simulation and future projections. Agric. Water Manag. 2014, 146, 249–261. [Google Scholar] [CrossRef]
- Huang, Z.; Xiao, Y.; Zhang, G.; Cao, Y.; Peng, B. Estimation and prediction of maize irrigation water requirement based on climate change in Songnen Plain, NE China. Acta Ecol. Sin. 2017, 37, 2368–2381. [Google Scholar]
- Wu, D.; Fang, S.; Li, X.; He, D.; Zhu, Y.; Yang, Z.; Xu, J.; Wu, Y. Spatial-temporal variation in irrigation water requirement for the winter wheat-summer maize rotation system since the 1980s on the North China Plain. Agric. Water Manag. 2019, 214, 78–86. [Google Scholar] [CrossRef]
- Li, B.; Wang, P.; Chi, D.; Han, L. Prediction of corn evapotranspiration by Penman-Monteith model under given soil moisture condition. J. Shenyang Agric. Univ. 2014, 45, 719–725. [Google Scholar]
- Tian, Z.; Zhong, H.; Shi, R.; Sun, L.; Fischer, G.; Liang, Z. Estimating potential yield of wheat production in China based on cross-scale data-model fusion. Front. Earth Sci. China 2012, 6, 364–372. [Google Scholar] [CrossRef]
- Tian, Z.; Liang, Z.; Shi, J.; Fisher, G.; Gu, T. Analysis of impact on China wheat potential productivity of climate change during 1961–2010. Chin. Agric. Sci. Bull. 2013, 29, 61–69. [Google Scholar]
- Wen, S.; Yang, Q.; Pan, L.; Zhang, Y. Research on the calculation methods of crop water requirement. J. Anhui Agric. Sci. 2009, 37, 442–445. [Google Scholar]
- Sargordi, F.; Farhadi, B.; Sharifi, M.A.; Keulen, H.V. Spatio-temporal variation of wheat and silage maize water requirement using CGMS model. Int. J. Plant Prod. 2013, 7, 207–224. [Google Scholar]
- Yang, J.; Mei, X.; Huo, Z.; Yan, C.; Ju, H.; Zhao, F.; Liu, Q. Water consumption in summer maize and winter wheat cropping system based on SEBAL model in Huang-Huai-Hai Plain, China. J. Integr. Agric. 2015, 14, 2065–2076. [Google Scholar] [CrossRef]
- Huang, H.; Han, Y.; Song, J.; Zhang, Z.; Xiao, H. Impacts of climate change on water requirements of winter wheat over 59 Years in the Huang-Huai-Hai Plain. Soil Water Res. 2016, 11, 11–19. [Google Scholar] [CrossRef]
- Pohlert, T. Use of empirical global radiation models for maize growth simulation. Agric. For. Meteorol. 2004, 126, 47–58. [Google Scholar] [CrossRef]
- Hijmans, R.; Cameron, S.E.; Parra, J.L.; Jones, P.G.; Jarvis, A. Very high resolution interpolated climate surfaces of global land areas. Int. J. Climatol. 2005, 25, 1965–1978. [Google Scholar] [CrossRef]
- Liu, Y.; Wang, L.; Ni, G.; Cong, Z. Spatial distribution characteristics of irrigation water requirement for main crops in China. Trans. Chin. Soc. Agric. Eng. 2009, 25, 6–12. [Google Scholar]
- Qi, X.; Feng, K.; Sun, L.; Zhao, D.; Huang, X.; Zhang, D.; Liu, Z.; Baiocchi, G. Rising agricultural water scarcity in China is driven by expansion of irrigated cropland in water scarce regions. One Earth 2022, 10, 1139–1152. [Google Scholar] [CrossRef]
- Fischer, G.; Tubiello, F.N.; Velthuizen, H.; Wiberg, D.A. Climate change impacts on irrigation water requirements: Effects of mitigation, 1990-2080. Technol. Forecast. Soc. Chang. 2007, 74, 1083–1107. [Google Scholar] [CrossRef]
- Wada, Y.; Wisser, D.; Eisner, S.; Florke, M.; Gerten, D.; Haddeland, I.; Hanasaki, N.; Masaki, Y.; Protmann, F.T.; Stacke, T.; et al. Multimodel projections and uncertainties of irrigation water demand under climate change. Geophys. Res. Lett. 2013, 40, 4626–4632. [Google Scholar] [CrossRef]
- Dong, H.; Chen, Y.; Zhou, X. Effects of irrigation and planting pattern on winter wheat water consumption characteristics and dry matter production. Chin. J. Appl. Ecol. 2013, 24, 1871–1878. [Google Scholar]
- Lin, Y.; Ren, H.; Yu, J.; Yao, Z. Balance between land use and water resources in the North China Plain. J. Nat. Resour. 2000, 15, 252–258. [Google Scholar]
- Zhan, S.; Yang, W. Reform of rural planting structure in China since the reform and opening-up and its main problems. Asian Agric. Res. 2019, 11, 1–5. [Google Scholar]
Publisher’s Note: MDPI stays neutral with regard to jurisdictional claims in published maps and institutional affiliations. |
© 2022 by the authors. Licensee MDPI, Basel, Switzerland. This article is an open access article distributed under the terms and conditions of the Creative Commons Attribution (CC BY) license (https://creativecommons.org/licenses/by/4.0/).