Abstract
This paper investigates the economic aspects of Managed Aquifer Recharge (MAR) techniques considered in the DINA-MAR (Depth Investigation of New Areas for Managed Aquifer Recharge in Spain) project. This project firstly identified the areas with potential for MAR for the whole of the Iberian Peninsula and Balearic Islands of Spain using characteristics derived from 23 GIS layers of physiographic features, spanning geology, topography, land use, water sources and including existing MAR sites. The work involved evaluations for 24 different types (techniques) of MAR projects, over this whole area accounting for the physiographic features that favor each technique. The scores for each feature for each type of technique were set based on practical considerations and scores were accumulated for each location. A weighting was assigned to each feature by “training” the integrated score for each technique across all the features with the existing MAR sites overlay, so that opportunities for each technique could be more reliably predicted. It was found that there were opportunities for MAR for 16% of the area evaluated and that the additional storage capacity of aquifers in these areas was more than 2.5 times the total storage capacity of all existing surface water dams in Spain. The second part of this work, which is considered internationally unique, was to use this GIS methodology to evaluate the economics of the various MAR techniques across the region. This involved determining an economic index related to key physiographic features and applying this as an additional GIS overlay. Again this was trained by use of economic information for each of the existing MAR sites for which economic data and supply or storage volume were available. Two simpler methods were also used for comparison. Finally, the mean costs of MAR facilities and construction projects were determined based on the origin of the water. Maps of potential sites for Managed Aquifer Recharge (or “MAR zones”) in the Iberian Peninsula and Balearic Islands of Spain and the results of the previous economic studies developed at the beginning of the project were used as the foundation for the economic analysis. Based on these data, a new specific mapping of the total expected costs for all “MAR zones” (€/m3) was proposed based on the techniques that were considered most appropriate for each Spanish study case. Capital costs ranged from Euro 0.08–0.58 per m3/year. Overall, this study investigates the opportunity and economic feasibility of implementing new MAR projects and provides support to decision makers in Spain. The novel mapping provides valuable guidance for the future development of Managed Aquifer Recharge projects for water managers and practitioners.
1. Introduction
This study analyzes the economic aspects in the DINA-MAR project related to the price of Managed Aquifer Recharge (MAR) water. These aspects range from simple ratios to advanced proposals based on GIS. This analysis was conducted to study the feasibility of implementing new building works and to provide support to decision makers in Spain. DINA-MAR (Depth Investigation of New Areas for Managed Aquifer Recharge in Spain) is a project financed by the Tragsa Group with the aim of determining the most suitable areas for MAR and how to implement MAR activities within Spain.
The use of GIS for determining opportunities for MAR is broadly mentioned in hydrogeological literature. Some other approaches have been consulted, especially in papers or reports from Portugal, India, Australia and Italy, which provide a different GIS mapping approach than the one displayed in this article.
A regional scale study was performed by Dudding et al., 2006, [1], for the Melbourne region for ASR potential as well as for depth aquifers.
An explanation of the main features in relation to opportunities for water banking is exposed in Hostetler, 2007 [2], although the aggregated features differs from specific opportunities for MAR.
Some papers from India on GIS approaches have been consulted, as for instance the analysis from Kallalia et al., 2007 [3] (pp. 111–119), for potential wastewater aquifer recharge sites, which assesses mapping MAR opportunities.
A GIS based expert system for selecting recharge methods is reported by Masciopinto et al., 1991 [4] (pp. 331–342). No reference could be found on the previous use of GIS for costing of MAR projects.
The study by Pedrero et al., 2011 [5] (pp. 105–116), describes a GIS-based multi-criteria analysis for site selection of aquifer recharge with reclaimed water. Another regional scale study was performed by Smith & Pollock, 2010 [6], who evaluated the artificial recharge potential for a superficial aquifer by means of GIS in the Perth region.
Three different lines of action have been accomplished and presented in the paper to analyze the economics of MAR.
First, the investment ratios of construction costs to storage volume and the mean life of the existing MAR projects with various techniques were evaluated and compared to dam and irrigation pond costs. Numerous examples were collected for statistical analysis.
Second, an advanced GIS methodology determined the “MAR zones” in Spain. After the identification of these zones, the most ideal devices were identified according to the inventory of 24 categories that were proposed in the project [7] (pp. 303–318).
Third, the origin of the water sources in the above two methods was considered. Water resources originating from either fluvial or sewage waters were then compared. Both of these water sources were budgeted.
The fluvial water is provided by a diversion structure in a river to an adequate aquifer for underground storage. Different premises have been considered according to the available flow, ease of application, suitability studies, feasibility studies and cost including exploitation and maintenance expenses. The sewage water option injects reclaimed water into deep boreholes and wells that are generally located near a sewage treatment plant. Economic studies have considered water flow, tertiary treatment, desalination, method of recharge to aquifers, construction costs, conservation costs, study costs and project costs.
Using the maps of potential sites or “MAR areas” for MAR in the Iberian Peninsula and Balearic Islands of Spain and the results of economic studies as the starting point of this study, we proposed a new specific mapping of the total expected costs for all “MAR zones” (€/m3) that depended on the most appropriate device for each case. This novel mapping provides guidelines that are intended to be valuable for water managers and practitioners for future development of Managed Aquifer Recharge projects.
2. Materials and Methods
The methodological approach consisted of a GIS study based on ARC/GIS and DINA-MAP programs. This process determines the most appropriate areas in Spain to apply MAR techniques with potential fluvial or waste waters.
The process is recursive because the method tests different algebraic map options on constructed maps with up to 83 layers and GIS coverage. Various parameters such as permeable outcrop layers, lithology, aquifers, water levels, fluvial riverbeds, water purifying plants, data collection stations with flow-rate measurements, slopes, altitudes, and distance to the coasts have been loaded in the system and taken into consideration (Table 1 and Figure 1).
To identify the MAR zones, 11 chloropeth maps of hydrographic basins were created. An example of the results for one of the most prospective basins is shown in Figure 2. The entire map series is available at DINA-MAR website [8].
This deductive process supported by algebra maps and analysis in GIS has two major drawbacks in information processing: different projection systems and an incorrect boundary overlay of the layers and thematic coverages used. An effort to unify the map was required.

Table 1.
Relating “Managed Aquifer Recharge (MAR) zones” by hydrographic major basins. Columns: basin name, the MAR zone area contained in the basin, the basin area, the percentage of the basin covered by a MAR zone and the percentage of an individual MAR of the total MAR area.
| ID | Major basin | MAR Zones Areas within Basin (km2) | Total Basin Areas (km2) | % MAR Zones/Basin | % Total |
|---|---|---|---|---|---|
| 1 | NORTH | 1,953 | 53,781 | 3.6 | 2.9 |
| 2 | DUERO | 21,565 | 78,955 | 27.3 | 32.3 |
| 3 | TAGUS | 10,186 | 55,815 | 18.2 | 15.2 |
| 4 | GUADIANA | 5,184 | 60,125 | 8.6 | 7.7 |
| 5 | GUADALQUIVIR | 4,878 | 63,298 | 7.7 | 7.3 |
| 6 | SOUTH | 1,458 | 18,408 | 7.9 | 2.2 |
| 7 | SEGURA | 2,283 | 18,833 | 12.1 | 3.4 |
| 8 | JUCAR | 7,892 | 42,682 | 18.5 | 11.8 |
| 9 | EBRO | 8,686 | 85,936 | 10.1 | 13.0 |
| 10 | PYRENEES | 1,746 | 16,555 | 10.6 | 2.6 |
| 11 | BALEARIC | 1,023 | 5,038 | 20.3 | 1.5 |
| Total | 66,854 | 499,428 | 13.4 | 100 |
In total, 23 main layers were employed with the assigned original number as follows:
- -
- Geology of Spain, scale 1:200 000. MMA, 2006;
- -
- Control of nitrates in the groundwater network;
- -
- Vulnerable areas to nitrates;
- -
- Irrigated areas and source of water;
- -
- Concentric polygons around rivers and reservoirs;
- -
- Risk of flooding;
- -
- Tilt cartography;
- -
- Tagus-Segura aqueducts;
- -
- Quality of water: conductivity;
- -
- Mines into aquifers. MMA, 2006;
- -
- Groundwater piezometric monitoring network;
- -
- Forest mapping for Spain, scale 1:50 000);
- -
- Hydrogeological units;
- -
- Sewage treatment plants;
- -
- Detailed urban areas;
- -
- Marine intrusion control network;
- -
- Altitude;
- -
- Dry wetlands;
- -
- Watersheds with water surplus;
- -
- Distance from shore;
- -
- Dune systems;
- -
- Administrative boundaries;
- -
- Current MAR sites.
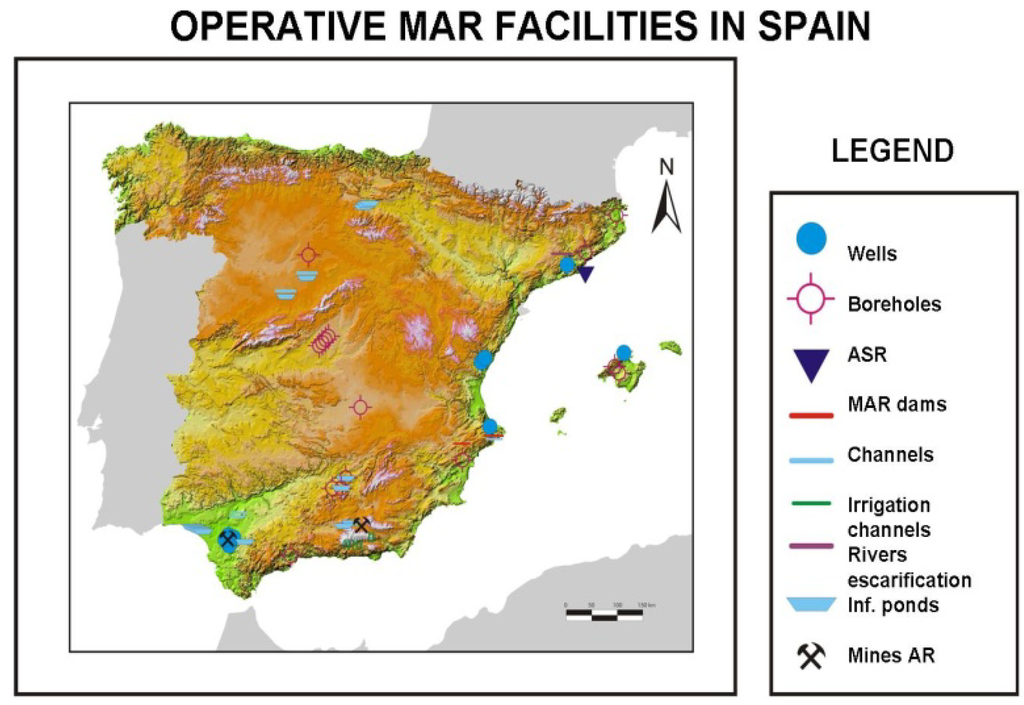
Figure 1.
Location map of the operative Managed Aquifer Recharge (MAR) sites in Spain.
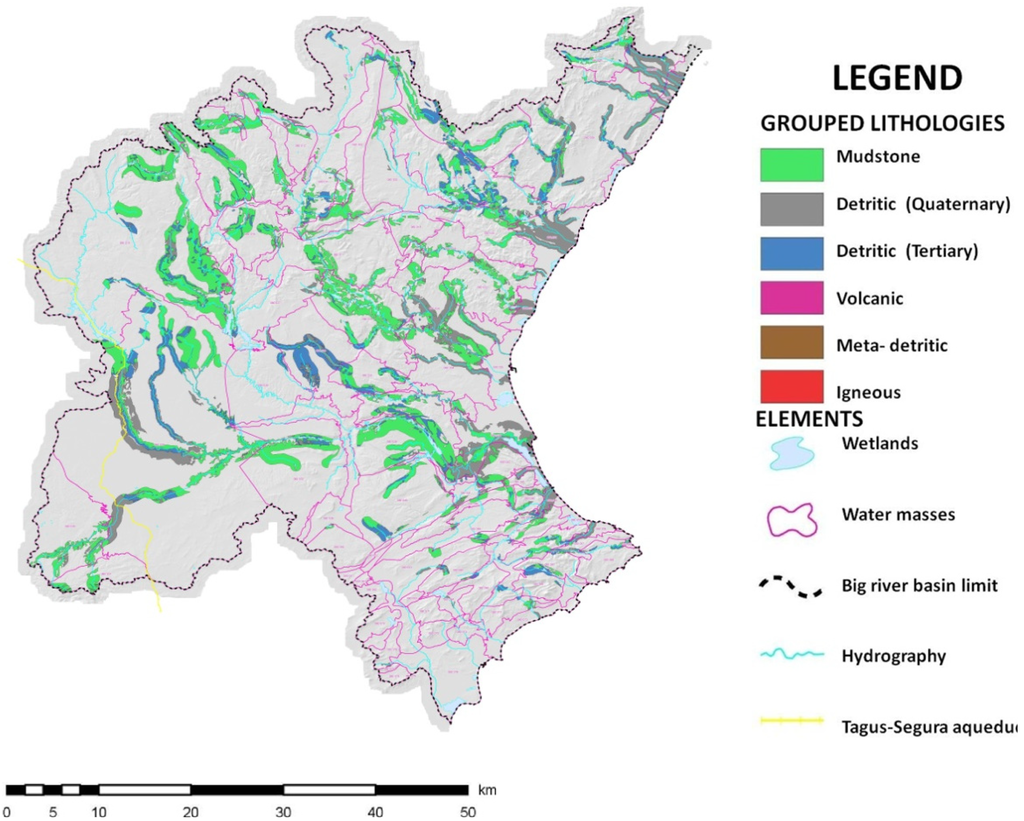
Figure 2.
Example of the distribution of “MAR zones” in the Spanish Jucar basin.
The main objective of this study was to identify a process producing similar results in existing inventories. The “MAR zones” in Spain were defined after several trials. The procedure that best represented these MAR activities in Spain was adopted (detailed explanation of this process in DINA-MAR, 2010 [7]). The pixel size for map overlays was 1 km × 1 km.
To determine the ideal devices for each “MAR zone”, an inventory of 24 devices previously proposed (Figure 3) was distributed and classified according to their characteristics and their most suitable environments.
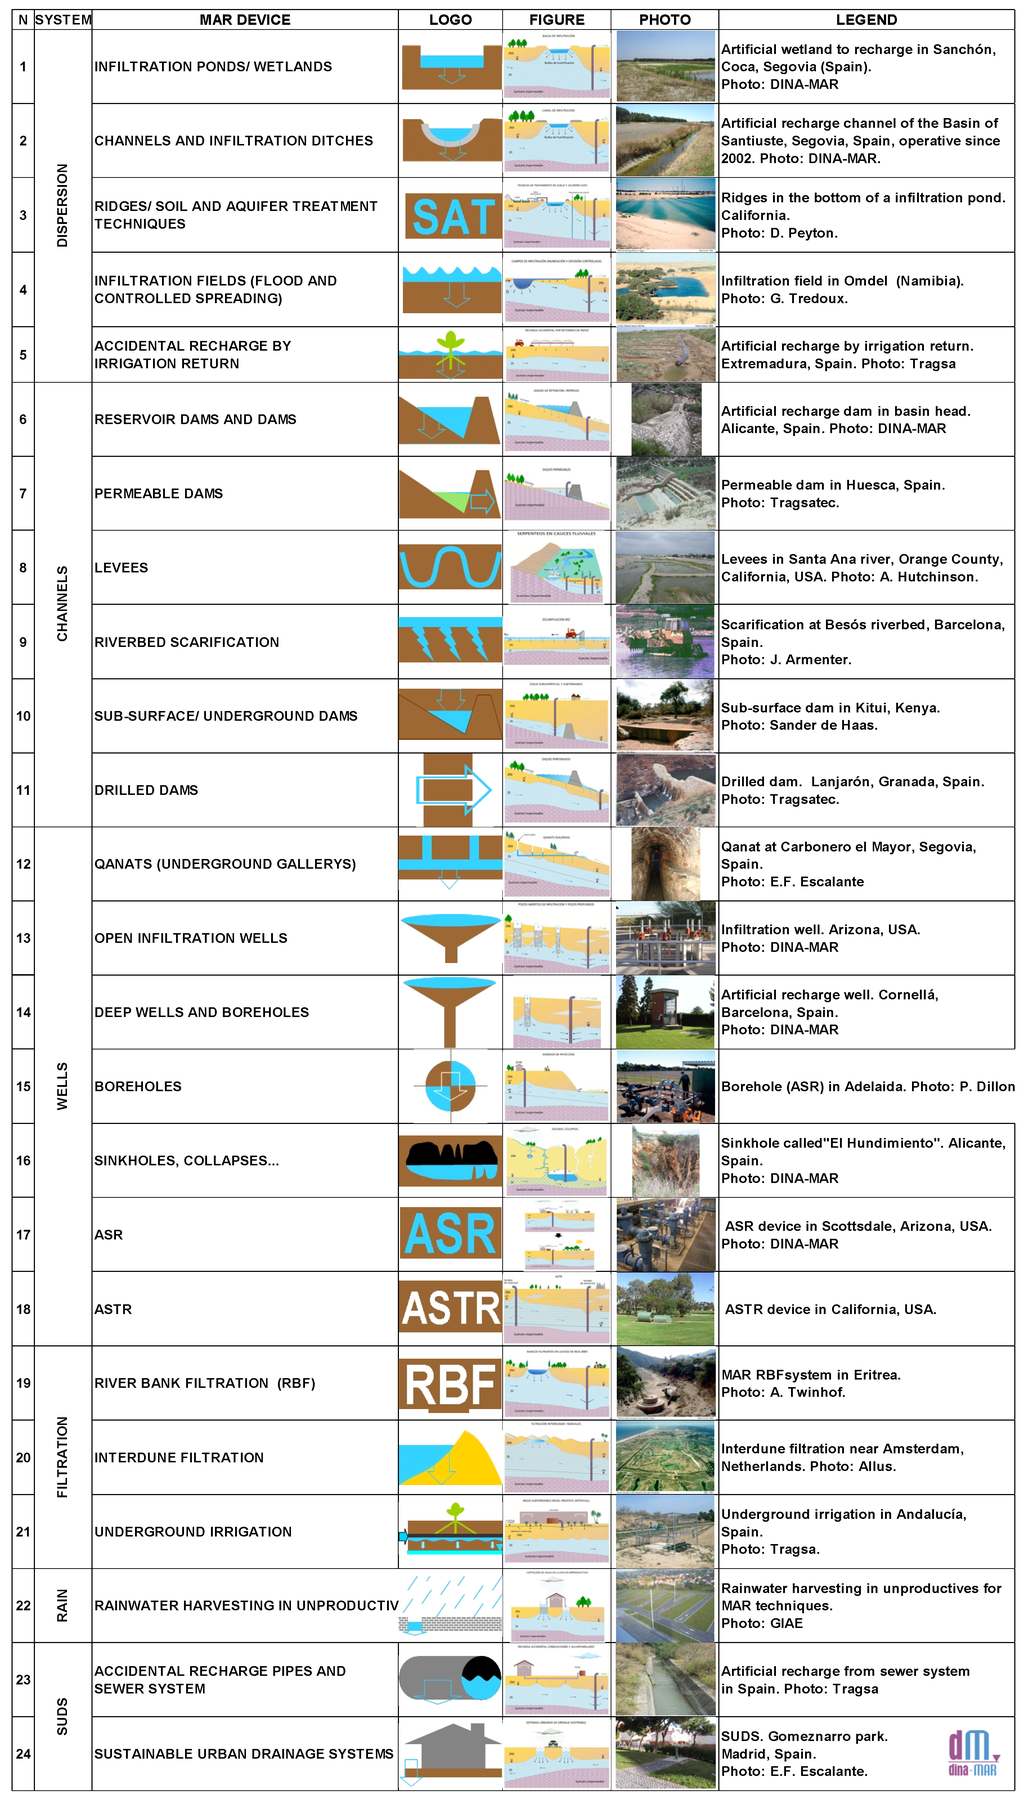
Figure 3.
Inventory of feasible and applicable MAR devices, modified from Fernández & San Sebastián [9] (pp. 5–6).
Numerous “if-then” conditions were designed into the system for each device or technique to obtain a group of ranked results for each area according to the specific conditions (Table 3).
A system of grades-weights was applied after studying each device individually; these values are presented in the “weight” column in Table 2.
Table 2.
Initial indicator to determine the suitability of MAR techniques according to costing based on the ratio between the investment costs and the initial storage volume. Mean costs taken from Tragsa Group projects performed for the Spanish Ministry of Agriculture.
| MAR facilities | Number of projects costed of this type | Mean investment cost ratio (€/m3) |
|---|---|---|
| Ponds | 18 | 9.75 |
| Dams | 16 | 0.80 |
| Surface MAR facilities (ponds, channels) | 8 ponds/58 km channel | 0.21 |
| Deep boreholes | 4 | 0.58 |
| Medium-deep boreholes | 25 | 0.36 |
After classifying the building projects performed by the Tragsa Group for the Spanish Government according to the origin of the water, a new specific mapping was proposed for total expected costs for all “MAR zones” (€/m3). This map depended on the most appropriate device for each case and featured a series of alternatives sorted according to technical suitability and cost.
The final map viewer is called “HydroGeoportal DINA-MAR” and is available at DINA-MAR “Visor cartográfico” website [10].
3. Results and Discussion
3.1. Investment Ratios of Building Costs against Storage Volume
The initial indicator to determine the suitability of MAR techniques according to costs was based on the ratio between the investment costs and the initial storage volume. The mean life of the devices was evaluated and compared to the cost of dams and irrigation ponds that have a 25 year lifespan.
The examples considered in this study were buildings constructed by the Tragsa Group for the Spanish Ministry of Agriculture for 18 irrigation ponds and 16 medium size dams versus the ratios for MAR facilities in the Arenales Aquifer (four projects) for surface infiltration facilities and in the Guadiana basin for 25 medium-depth infiltration boreholes.
Data for MAR deep boreholes was collected from Spanish water supply companies.
Mean Investment Ratios
Data sets were treated by statistical methods (eliminating the maximum and the minimum, etc.). The resulting ratios are as described in Table 2.
According to these results, the MAR technique results are rather cheap for basic economic indicators in comparison with other water management techniques.
3.2. Advanced GIS Methodology Based on Linear Combination of Map Layer Attributes
3.2.1. Previous Legal Considerations
In Spain, the legal and technical framework is suited to integrate more MAR devices in water management schemes, although several implementation issues remain: Currently, regulations consider MAR as a spill, which is an obstacle to the development and the implementation of this technique. Royal Decree 1620/2007 is too restrictive in terms of water quality whereas the regulations in other countries are more permissive. The laws in these other countries consider the sanitation aspects of MAR and do not regulate several effects such as the changes in sodium concentration during deep injection.
3.2.2. Determining “MAR Zones” in Spain
The main aim of this project was to determine the most suitable areas for MAR in Spain (excluding the Canary Islands on which desalination is the typical water management technique). The calculation methodology is summarized in the previous section. A detailed description may be found at DINA-MAR, 2010 [1] (pp. 215–216).
From the results, approximately 16% (67,000 km2) of the Spanish peninsular and Balearic Islands territory is suitable for recharge management. The most ideal basins are the Duero and Balearics basins, and the least ideal are the North and Guadalquivir basins.
The determined “MAR zones” or areas notably suitable to apply MAR activities are grouped by hydrographic basins in Table 1.
3.2.3. Potential for the MAR Technique in Spain
Based on the premise defined by DINA-MAR that the future of water depends on the storage capacity, the storage potential of currently unsaturated Spanish aquifers was compared to the storage capacity of dams.
Based on the storage in dams in Spain in January 2005, which reached 53,198 hm3, and the definition of the MAR zones, a GIS was used to compare the capacities based on the water level depth, aquifer permeability and storage coefficients. Spanish subsoil (excluding the Canary Islands) was found to have a storage capacity of, approximately, 2.0 hm3/km2 in the MAR zones. Therefore, approximately 260% of the stored volume in the dams could be stored in aquifers in safeguarding the quality and utility of the water. Utilizing underground storage would also enable surface occupation of the land.
Despite the uncertainty inherent in the calculations, these figures indicate the high potential for MAR activities in Spain to provide new integrated water management schemes.
3.2.4. Search Criteria Used to Associate Devices with Each “MAR Zone”
With the physical elements well defined and the specifications of the 24 inventoried AR techniques known (Figure 3), determining the most suitable technique was performed by a grades/weights system as the main association criteria. This system was designed and automated in such a way that each device receives a weight according to its suitability. This score is adjusted to the physical characteristics and other indicators with GIS support.
The established grades are the distribution of permeabilities, lithologies, nitrate contaminations, irrigable areas, irrigation origin, proximity to forests, purifying plants (with treatment types), dams (with associated capacities), wetlands, rivers (with average associated flows), distance to the coast, major aqueducts, slope, height, flood risk, water level, water quality, meteorological stations with sufficient rainfall or streamflow and urban areas. The weights range between zero (inadequate) and three (highly favorable).
By establishing a relational structure between physical factors and indicators with GIS support for MAR devices, an association matrix that supplies the HydroGeoportal DINA-MAR (Table 3) was designed and automated.
The weight columns appear to be subjective based on the suitability of each device. Because of the important role that the devices hold in the final ranking, additional criteria are adopted to minimize the subjectivity and are presented as ranges (Table 3, column 3). The ranges have been defined by the breakdown of each “layer” in different classes, generally distinguishing the different major types and establishing relevant groups to work with a reduced number of types. For example, the “water origin” layer distinguishes five types: surface water, groundwater, irrigation returns, water from treatment plants and water from desalination plants.
The weights (Table 3, column 4) appear in hierarchy according to their suitability and fit to the physical characteristics and remaining indicators. The weight assigned to each case and code directly intervenes in the process of SIG calculation because the database is associated with the calculation engine; then, an individual score is assigned to each polygon. For example, the calculation method to score device D1 (infiltration pond) is as follows. First, the fields D1, D2..., D24 are included in the layer in which all layers have been previously crossed to calculate the score for each device in these fields. The crosses table is then connected to the different facilities leader board, starting with the permeability, and D1 is calculated. Successive “joins” must be performed for each of the topics, and the formula of ranges-weights is applied to obtain a final value.
This process automatically calculates a score for each of the 24 techniques and the highest score determines the most appropriate technique.
The result is a large-scale map ranking the most to the least recommended devices (Figure 4).
The results of these calculations are expressed in the “Favorable Device” map (Figure 4).
This system has enabled several highly ideal MAR zones to be identified. For example, up to 11 MAR devices could be concentrated in the Lower Guadalhorce aquifer (Malaga) when water is withdrawn from the river and a wastewater treatment plant (Figure 5).
Table 3.
Relating physical factors and indicators (based on GIS support) for different MAR devices.
| Mar techniquesand devices | 1 | 2 | 3 | 4 | 5 | 6 | 7 | 8 | 9 | 10 | 11 | 12 | 13 | 14 | 15 | 16 | 17 | 18 | 19 | 20 | 21 | 22 | 23 | 24 | |||
|---|---|---|---|---|---|---|---|---|---|---|---|---|---|---|---|---|---|---|---|---|---|---|---|---|---|---|---|
| Mar zones | Dispersion | Channels | Wells | Filtrat. | Rain | Suds | |||||||||||||||||||||
| cases 1 | code | weight | infiltration ponds/ wetlands | channels and infiltration ditches | ridges/ soil and aquifer treatment techniques | infiltration fields (flood and controlled spreading) | accidental recharge by irrigation return | reservoir dams and dams | permeable dams | levees | riverbed scarification | sub-surface/ underground dams | drilled dams | qanats (underground gallerys) | open infiltration wells | deep wells and boreholes | boreholes | sinkholes, collapses | asr | astr | river bank filtration (rbf) | interdune filtration | underground irrigation | rainwater harvesting in unproductive | accidental recharge pipes and sewer system | sustainable urban drainage systems | |
| permeable outcrops mma2006 | very high | 3 | 3 | 3 | 2 | 3 | 2 | 3 | 2 | 2 | 3 | 1 | 2 | 1 | 3 | 3 | 1 | 3 | 1 | 1 | 1 | 3 | 1 | 1 | 1 | 1 | |
| high | 2 | 3 | 3 | 1 | 3 | 2 | 2 | 2 | 3 | 2 | 1 | 2 | 1 | 3 | 3 | 1 | 1 | 1 | 1 | 1 | 3 | 1 | 1 | 1 | 1 | ||
| medium | 1 | 2 | 2 | 1 | 1 | 2 | 2 | 2 | 1 | 1 | 1 | 2 | 1 | 2 | 2 | 1 | 1 | 3 | 3 | 1 | 2 | 1 | 1 | 1 | 1 | ||
| geology of spain. escale 1:200.000, mma 2006 | aluvial | 7 | 3 | 3 | 2 | 3 | 1 | 3 | 3 | 3 | 3 | 3 | 3 | 1 | 3 | 3 | 3 | 0 | 3 | 3 | 3 | 0 | 1 | 1 | 1 | 1 | |
| detritic | 5 | 3 | 3 | 2 | 1 | 1 | 2 | 2 | 1 | 0 | 3 | 3 | 3 | 2 | 2 | 3 | 0 | 3 | 3 | 0 | 3 | 1 | 1 | 1 | 1 | ||
| karstic | 6 | 2 | 2 | 2 | 2 | 1 | 3 | 3 | 2 | 0 | 1 | 2 | 3 | 3 | 3 | 2 | 3 | 2 | 2 | 0 | 0 | 1 | 1 | 1 | 1 | ||
| metamorphic | 4 | 0 | 2 | 2 | 0.5 | 1 | 2 | 2 | 0 | 0 | 1 | 3 | 1 | 1 | 1 | 1 | 0 | 1 | 1 | 0 | 0 | 1 | 1 | 1 | 1 | ||
| volcanic | 3 | 0 | 2 | 2 | 0.5 | 1 | 3 | 3 | 0 | 0 | 2 | 2 | 3 | 1 | 1 | 1 | 0 | 1 | 1 | 0 | 0 | 1 | 1 | 1 | 1 | ||
| intrusive | 2 | 0 | 2 | 2 | 0.5 | 1 | 2 | 2 | 0 | 0 | 2 | 2 | 1 | 2 | 1 | 1 | 0 | 1 | 1 | 0 | 0 | 1 | 1 | 1 | 1 | ||
| evaporitic | 1 | 0 | 0 | 0 | 0 | 0 | 1 | 0 | 0 | 0 | 1 | 1 | 1 | 2 | 1 | 1 | 0 | 1 | 1 | 0 | 0 | 0 | 1 | 1 | 1 | ||
| nitrates network for groundwater | nitrate content | <50 | 1 | 1 | 1 | 1 | 1 | 3 | 1 | 1 | 1 | 1 | 1 | 1 | 1 | 1 | 1 | 1 | 1 | 1 | 1 | 1 | 1 | 1 | 1 | 1 | 1 |
| ≥50 | 2 | 1 | 1 | 1 | 2 | 2 | 1 | 1 | 1 | 1 | 1 | 1 | 1 | 1 | 1 | 1 | 0 | 0 | 0 | 1 | 1 | 1 | 1 | 1 | 1 | ||
| vulnerablezones 2005 | 1:vulnerable zones, 0: no vulnerable zones | 1 | 1 | 1 | 1 | 2 | 2 | 1 | 1 | 1 | 1 | 1 | 1 | 1 | 1 | 1 | 1 | 1 | 0 | 0 | 1 | 1 | 1 | 1 | 1 | 1 | |
| water origin | surface water | 4 | 3 | 3 | 3 | 3 | 3 | 3 | 3 | 3 | 3 | 1 | 3 | 1 | 3 | 3 | 1 | 3 | 1 | 3 | 1 | 1 | 2 | 1 | 1 | 1 | |
| groundwater | 2 | 1 | 1 | 1 | 0.5 | 1 | 1 | 1 | 0 | 0 | 1 | 1 | 1 | 1 | 1 | 0 | 0 | 2 | 2 | 1 | 0 | 2 | 0 | 0 | 0 | ||
| irrigation return | 4 | 0 | 3 | 1 | 2 | 3 | 1 | 1 | 0 | 0 | 1 | 1 | 0 | 1 | 1 | 1 | 0 | 0 | 0 | 0 | 0 | 1 | 0 | 0 | 0 | ||
| ww treatment plants | 6 | 1 | 1 | 1 | 1 | 1 | 1 | 1 | 0 | 1 | 2 | 1 | 0 | 1 | 2 | 1 | 1 | 1 | 1 | 0 | 1 | 2 | 0 | 0 | 1 | ||
| desalination plants | 4 | 2 | 1 | 0 | 1 | 0 | 0 | 0 | 0 | 0 | 1.5 | 0 | 0 | 2 | 2 | 2 | 1 | 2 | 1 | 0 | 1 | 2 | 0 | 0 | 0 | ||
| areas up to 2 km far from dams | 1:zone 2 km dams 0 bigger distance | ≤ 2 km | 1 | 2 | 2 | 2 | 0 | 1 | 2 | 0 | 2 | 2 | 1 | 1 | 1 | 1 | 1 | 3 | 3 | 3 | 3 | 3 | 0 | 2 | 0 | 0 | 0.5 |
| concentric poligons close to medium flowrate rivers (1 to 5 km) | 0–0.45 | ≤ 1 km | 3 | 3 | 1 | 3 | 3 | 1 | 2 | 0 | 3 | 0 | 1 | 2 | 1 | 1 | 1 | 3 | 2 | 3 | 3 | 3 | 0.5 | 1 | 0 | 0 | 0 |
| >0.45–1.65 | >1 to ≤ 2 | 3 | 1 | 2 | 1 | 1 | 1 | 1 | 1 | 0 | 0 | 1 | 0 | 2 | 1 | 1 | 3 | 1 | 3 | 3 | 0 | 1 | 1 | 0 | 0 | 0 | |
| >1.65–7.26 | >2 to ≤ 3 | 4 | 1 | 2 | 1 | 0.5 | 1 | 1 | 0 | 0 | 0 | 1 | 0 | 2 | 2 | 2 | 1 | 1 | 2 | 3 | 0 | 0 | 1 | 0 | 0 | 0 | |
| >7.26–27.5 | >3 to ≤ 4 | 5 | 1 | 2 | 0 | 0.5 | 1 | 1 | 0 | 0 | 0 | 0.5 | 0 | 2 | 2 | 2 | 1 | 1 | 1 | 2 | 0 | 0 | 1 | 0 | 0 | 0 | |
| >27.5 | >4 to ≤ 5 | 6 | 1 | 3 | 0 | 0.5 | 1 | 1 | 0 | 0 | 0 | 0.5 | 0 | 2 | 3 | 3 | 3 | 1 | 1 | 1 | 0 | 0 | 1 | 0 | 0 | 0 | |
| overflood risk | no risk | 4 | 3 | 2 | 1 | 0 | 3 | 0 | 0 | 0 | 0 | 1 | 0 | 1 | 3 | 3 | 3 | 1 | 3 | 3 | 0 | 1 | 1 | 1 | 1 | 0.5 | |
| maximum | 1 | 0 | 0 | 2 | 3 | 0 | 3 | 2 | 3 | 3 | 1 | 2 | 0 | 0 | 0 | 0 | 1 | 0 | 0 | 2 | 1 | 0 | 0 | 0 | 1 | ||
| mean | 2 | 1 | 1 | 2 | 3 | 0.5 | 2 | 2 | 1 | 0 | 1 | 3 | 1 | 1 | 0 | 0 | 1 | 0 | 0 | 1 | 1 | 0.5 | 0 | 0 | 1 | ||
| minimum | 3 | 2 | 1 | 1 | 2 | 1 | 1 | 1 | 0 | 0 | 1 | 2 | 1 | 3 | 3 | 1 | 1 | 1 | 1 | 0 | 1 | 1 | 1 | 1 | 1 | ||
| slope intervals | % | 0–10 | 2 | 3 | 3 | 1 | 3 | 1 | 1 | 1 | 3 | 3 | 3 | 1 | 1 | 3 | 3 | 3 | 1 | 3 | 3 | 3 | 1 | 1 | 1 | 1 | 1 |
| 10–20 | 2 | 2 | 2 | 1 | 0 | 1 | 2 | 1 | 1 | 1 | 2 | 1 | 1 | 3 | 2 | 1 | 1 | 2 | 2 | 0.5 | 0 | 1 | 1 | 1 | 1 | ||
| 20–30 | 3 | 1 | 1 | 2 | 0 | 0.5 | 2 | 2 | 0 | 0 | 1 | 3 | 2 | 2 | 1 | 1 | 1 | 1 | 1 | 0 | 0 | 1 | 1 | 1 | 1 | ||
| 30–40 | 4 | 0 | 0 | 2 | 0 | 0 | 3 | 2 | 0 | 0 | 0 | 2 | 2 | 1 | 1 | 1 | 1 | 1 | 1 | 0 | 0 | 0 | 0 | 0 | 0 | ||
| 40–50 | 5 | 0 | 0 | 2 | 0 | 0 | 3 | 0 | 0 | 0 | 0 | 2 | 1 | 0 | 0 | 0 | 0 | 0 | 0 | 0 | 0 | 0 | 0 | 0 | 0 | ||
| areas until 1 km far away from wetlands | 1:influency zones from wetlands/ no | ≤1 km | 0.5 | 1 | 2 | 0 | 3 | 1 | 2 | 2 | 0 | 1 | 2 | 1 | 1 | 2 | 3 | 1 | 1 | 0 | 0 | 1 | 1 | 1.5 | 0 | 0 | 0 |
| areas distant up to km from tagus-segura acueduct | 1:zones influency tagus-segura/ no | ≤1 km | 2 | 2 | 2 | 1 | 1 | 1 | 0 | 0 | 2 | 1 | 0 | 0 | 1 | 2 | 2 | 2 | 2 | 2 | 2 | 0 | 0 | 1 | 0 | 0 | 0 |
| water quality. conductivity ›2500 us/cm | 1: zones conduct <2500 | < 2500 | 1 | 2 | 2 | 2 | 2 | 2 | 2 | 2 | 2 | 2 | 3 | 2 | 2 | 2 | 2 | 2 | 2 | 2 | 2 | 2 | 3 | 2 | 2 | 1 | 1 |
| 2: zones conduct >2500 | > 2500 | 1 | 0 | 0 | 1 | 0 | 0 | 1 | 0 | 0 | 0 | 1 | 0 | 0 | 0 | 0 | 0 | 0 | 0 | 0 | 0 | 2 | 0 | 0 | 0 | 0 | |
| mines in aquifers. buffer 2 km | 1:zones influency mines/0:zones no influency | ≤ 2 km | 2 | 2 | 2 | 1 | 1 | 0 | 1 | 0 | 0 | 0 | 1 | 1 | 3 | 3 | 1 | 1 | 0 | 1 | 2 | 0 | 0 | 0.5 | 0 | 0 | 0 |
| land use. from corine land cover | forestry | 1 | 0 | 2 | 3 | 0 | 0 | 3 | 3 | 0 | 0 | 3 | 3 | 2 | 1 | 0 | 0 | 3 | 0 | 0 | 0 | 1 | 0 | 0 | 0 | 0 | |
| subdesertic | 1 | 0 | 0 | 0 | 1 | 0 | 1 | 0 | 2 | 0 | 3 | 3 | 3 | 2 | 2 | 0 | 1 | 1 | 1 | 0 | 0 | 0 | 0 | 0 | 0 | ||
| meadows and pastures | 4 | 1 | 2 | 2 | 2.5 | 2 | 1 | 1 | 1 | 2 | 0.5 | 0 | 0 | 2 | 2 | 1 | 2 | 0 | 0 | 0 | 0 | 1 | 2 | 0 | 0 | ||
| weight according to artificiality | agrary | 4 | 3 | 3 | 2 | 3 | 3 | 1 | 2 | 2 | 3 | 1 | 3 | 0 | 3 | 3 | 3 | 0 | 3 | 3 | 1 | 0 | 3 | 2 | 0 | 0 | |
| barren | 2 | 1 | 0 | 0 | 0 | 0 | 1 | 1 | 1 | 0 | 2 | 1 | 2 | 2 | 2 | 1 | 3 | 1 | 1 | 0 | 3 | 0 | 0 | 0 | 0 | ||
| glaciars & permanent snow | 1 | 0 | 0 | 3 | 0 | 0 | 3 | 3 | 0 | 0 | 1.5 | 0 | 0 | 0 | 0 | 0 | 0 | 0 | 0 | 0 | 0 | 0 | 0 | 0 | 0 | ||
| wetlands | 3 | 2 | 2 | 0 | 3 | 1 | 2 | 2 | 2 | 3 | 1 | 0 | 0 | 0 | 0 | 0 | 0 | 0 | 0 | 2 | 1 | 0 | 0 | 0 | 0 | ||
| infraestruct. hidraulic | 4 | 3 | 3 | 0 | 0 | 0 | 2 | 2 | 1 | 0 | 3 | 3 | 1 | 0 | 0 | 0 | 0 | 0 | 0 | 0 | 0 | 0 | 0 | 0 | 0 | ||
| infraestruct. transport | 5 | 0 | 0 | 0 | 0 | 0 | 0 | 2 | 0 | 0 | 1.5 | 0 | 0 | 0 | 0 | 0 | 0 | 0 | 0 | 0 | 0 | 0 | 3 | 2 | 1 | ||
| urban | 5 | 2 | 1 | 0 | 0.5 | 1 | 0 | 0 | 0 | 0 | 0.5 | 0 | 0 | 3 | 3 | 2 | 0 | 2 | 2 | 3 | 0 | 2 | 3 | 3 | 3 | ||
| industrial | 5 | 0 | 0 | 0 | 0 | 0 | 0 | 0 | 0 | 0 | 0 | 0 | 0 | 2 | 2 | 3 | 0 | 2 | 2 | 2.5 | 0 | 0 | 3 | 2 | 2 | ||
| buffer 1 o 5 km urban areas | 1 km | nº InhabitantS < 20.000 | 1.5 | 1 | 1 | 1 | 1 | 1 | 1 | 1 | 1 | 1 | 1 | 1 | 1 | 2 | 2 | 1 | 1 | 1 | 1 | 1 | 1 | 1 | 3 | 2 | 2 |
| 5 km | nº InhabitantS ≥ 20000 | 2 | 1 | 1 | 1 | 1 | 1 | 1 | 1 | 1 | 1 | 1 | 1 | 1 | 1 | 1 | 1 | 1 | 3 | 3 | 1 | 1 | 1 | 3 | 3 | 3 | |
| groundwater table 2008 | isolines purple color | <25 | 1 | 3 | 3 | 1 | 3 | 3 | 3 | 1 | 3 | 3 | 3 | 1 | 3 | 3 | 1 | 0 | 1 | 0 | 0 | 3 | 1 | 3 | 1 | 1 | 3 |
| >25 to ≤ 50 | 2 | 2 | 2 | 1 | 1 | 2 | 1 | 1 | 1 | 2 | 3 | 1 | 2 | 2 | 3 | 1 | 1 | 1 | 1 | 0.5 | 1 | 2 | 1 | 1 | 2 | ||
| >50 to ≤ 150 | 3 | 1 | 1 | 0 | 0 | 0.5 | 0 | 0 | 0 | 0 | 0 | 0 | 0 | 0 | 2 | 3 | 1 | 3 | 2 | 0 | 0 | 0 | 1 | 1 | 2 | ||
| >150 | 3 | 0 | 0 | 0 | 0 | 0 | 0 | 0 | 0 | 0 | 0 | 0 | 0 | 0 | 0 | 3 | 1 | 3 | 3 | 0 | 0 | 0 | 0 | 0 | 2 | ||
| depth groundwatertable 2008 | isolines pink color | P >200 m | 3 | 0 | 0 | 0 | 0 | 0 | 0 | 0 | 0 | 0 | 0 | 0 | 0 | 0 | 0 | 3 | 0 | 3 | 3 | 0 | 0 | 0 | 0 | 0 | 0 |
| forestry masses. escale 1:50.000 | forests | 3 | 1 | 1 | 2 | 1 | 1 | 3 | 3 | 1 | 1 | 3 | 1 | 1 | 1 | 1 | 1 | 1 | 1 | 1 | 1 | 1 | 1 | 1 | 1 | 3 | |
| hydrogeology units suitable to be recherged according toigme, 1991 | 3 | 2 | 2 | 1 | 1 | 1 | 2 | 2 | 1 | 1 | 2 | 1 | 1 | 2 | 1 | 1 | 1 | 1 | 1 | 2 | 1 | 1 | 1 | 1 | 1 | ||
| areas distant up to 1 km from waste water treatment plants | buffer of 1 km and eq inhabitant data | <20.000 | 1 | 1 | 1 | 1 | 1 | 1 | 2 | 1 | 1 | 1 | 1 | 1 | 1 | 3 | 1 | 1 | 3 | 1 | 1 | 1 | 1 | 1 | 1 | 1 | 1 |
| ≥20000 to<200.000 | 2 | 1 | 1 | 1 | 1 | 1 | 2 | 1 | 1 | 1 | 1 | 1 | 1 | 1 | 3 | 3 | 1 | 2 | 2 | 2 | 1 | 1 | 1 | 1 | 2 | ||
| ≥200.000 | 3 | 2 | 2 | 1 | 1 | 1 | 2 | 1 | 1 | 1 | 1 | 1 | 1 | 1 | 1 | 2 | 1 | 3 | 3 | 2 | 1 | 1 | 1 | 1 | 3 | ||
| lagoon wwtp | buffer of 1 km | 2 | 3 | 1 | 1 | 2 | 1 | 1 | 1 | 1 | 1 | 1 | 1 | 1 | 3 | 1 | 1 | 1 | 1 | 1 | 1 | 1 | 1 | 1 | 1 | 1 | |
| areas up to 5 km away from marine intrusion | buffer of 5 km ptos intrusion | 5 km | 3 | 0 | 0 | 0 | 0 | 0 | 0 | 0 | 0 | 0 | 0 | 0 | 0 | 0 | 2 | 3 | 0 | 3 | 3 | 0 | 0 | 0 | 0 | 0 | 1 |
| altitude range | masl | > 0 to <20 | 1 | 2 | 0 | 2 | 2 | 2 | 0 | 1 | 2 | 1 | 1 | 1 | 1 | 2 | 2 | 2 | 1 | 2 | 2 | 1 | 2 | 1 | 1 | 1 | 1 |
| >20 to <1500 | 2 | 2 | 2 | 2 | 2 | 2 | 2 | 2 | 2 | 1 | 1 | 1 | 1 | 2 | 2 | 2 | 1 | 2 | 2 | 1 | 1 | 1 | 1 | 1 | 1 | ||
| >1500 | 1 | 1 | 1 | 0.5 | 0.5 | 0 | 3 | 2 | 0 | 0 | 0 | 0 | 1 | 1 | 0 | 0 | 1 | 0 | 0 | 1 | 0 | 1 | 1 | 1 | 1 | ||
| arid zones | precipitation | >400 mm | 3 | 2 | 1 | 0 | 2 | 2 | 2 | 1 | 2 | 1 | 1 | 1 | 1 | 1 | 1 | 1 | 1 | 1 | 1 | 1 | 1 | 1 | 1 | 1 | 1 |
| ≤400 mm | 1 | 1 | 0 | 0 | 0.5 | 0.5 | 3 | 0 | 0 | 0 | 3 | 2 | 3 | 1 | 1 | 1 | 1 | 1 | 1 | 0.5 | 3 | 2 | 2 | 1 | 1 | ||
| meteo stations with watersurplus | sub-basins water surplus | 2 | 2 | 1 | 1 | 2 | 2 | 2 | 2 | 2 | 1 | 1 | 2 | 1 | 3 | 1 | 1 | 2 | 1 | 1 | 2 | 2 | 1 | 2 | 2 | 3 | |
| distance to the coast | < 2 km | 1 | 1 | 1 | 1 | 1 | 1 | 1 | 1 | 1 | 1 | 1 | 1 | 1 | 1 | 1 | 1 | 1 | 1 | 1 | 1 | 3 | 1 | 1 | 1 | 1 | |
| > 2 to < 5 km | 1 | 1 | 1 | 1 | 1 | 1 | 1 | 1 | 1 | 1 | 1 | 1 | 1 | 1 | 1 | 1 | 1 | 1 | 1 | 1 | 0 | 1 | 1 | 1 | 1 | ||
| ≥ 5 km | 1 | 1 | 1 | 1 | 1 | 1 | 1 | 1 | 1 | 1 | 1 | 1 | 2 | 2 | 1 | 1 | 1 | 1 | 1 | 3 | 1 | 1 | 1 | 1 | 1 | ||
| dunar systems(corine) | 1 | 1 | 1 | 1 | 1 | 1 | 1 | 1 | 1 | 1 | 1 | 1 | 1 | 1 | 1 | 1 | 1 | 1 | 1 | 1 | 3 | 1 | 1 | 1 | 0 | ||
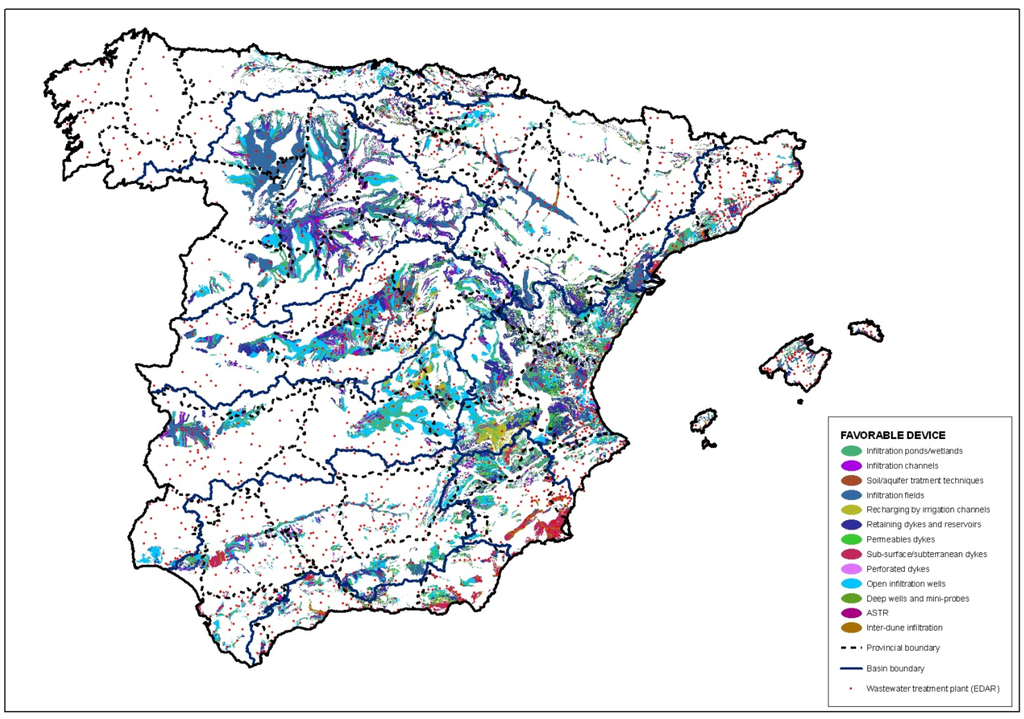
Figure 4.
Map of MAR areas and the most appropriate MAR devices. The “HydroGeoportal DINA-MAR” [10] package also provides additional options for each zone.
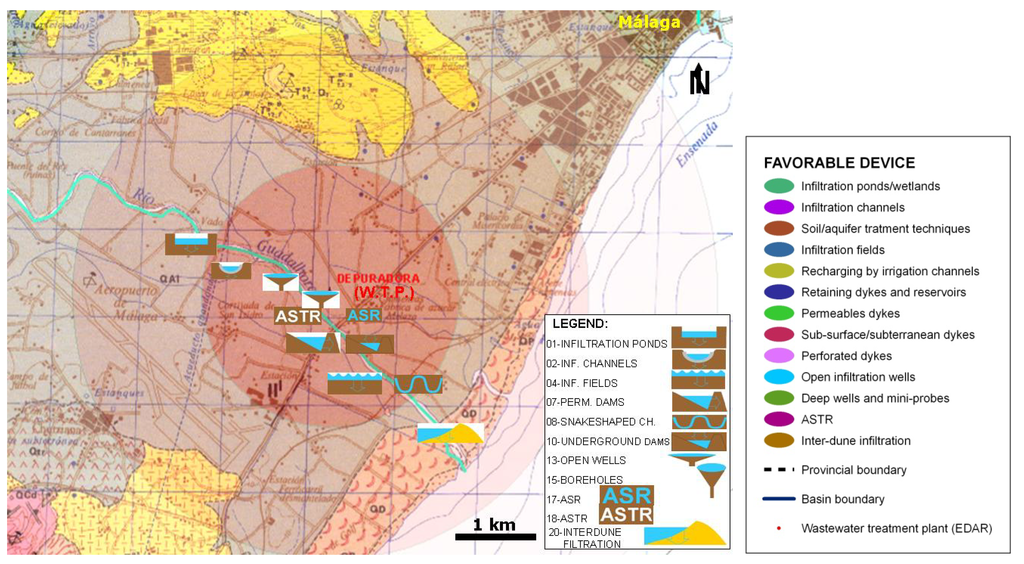
Figure 5.
“HydroGeoportal” predicting suitable areas to apply a MAR technique, notably in the Lower Guadalhorce aquifer (Malaga, Spain). The map displays the proposed location of MAR devices obtained through the exposed grades/weights system.
3.3. Economic Studies for MAR Activities Implementation Based on the Origin of the Water and Its Incorporation into “Hydrogeoportal” Map Viewer
An economic study was developed based on the investment ratio or the cost of the device in relation to the recovered water. The ratios for superficial MAR devices are approximately 1/5 of the ratio of the dams, whereas the ratio for ASR is similar to the dams ratio.
The referred study provides two alternatives for decision-making according to the origin of the sources of water, either of fluvial origin or sewage waters.
Table 4 shows the estimation process of the cost intervals. Column 3 differentiates six types according to either the origin of the water or the context in which each device is intended to be implemented. The five distinct classes are as follows: devices in river areas (wells, ponds and canals), dams and dikes in either surface or underground alluvial terrain, urban sustainable drainage systems, drilled wells less than 50 m deep and deep boreholes (deeper than 50 m).
The first alternative diverts running water from a river, channeling the water to an adequate aquifer (underground storage). This technique has several advantages including minimal occupation of the surface, less evaporation, preserved water quality, and the relatively low costs for the storage. For example, from the first row, using a river as a source of intake has a potential cost per action (investment ratio) of close to € 0.20/m3 for an 8 km conduction pipe and the artificial recharge is performed using channels, infiltration ponds and wells. The cost for each activity is estimated to be close to 1.2 M€. Exploitation and maintenance costs have been estimated at € 0.01 m3/year (real data taken from budgets of building projects performed by the company that the authors work for, in DINA-MAR, 2010 [7]).
The other considered alternative is the direct injection of reclaimed water during managed aquifer recharge (files 5 and 6) using deep injection boreholes and wells. These injection sites are generally located in the vicinity of sewage treatment plants. The water must be tertiary treated, osmotized and inserted into the aquifers. The flow availability is more regular than in the previous alternative. This study considered flows between 50 and 80 l/s to be recharged through 50 m depth wells. Flows exceeding 100 l/s require boreholes approximately 500 m in depth (average values). This technique does not require special water surpluses and can be used for numerous purposes such as irrigation, combating marine intrusion, environmental practices, and industrial supply. The unit cost of investment is € 0.23/m3 (50 m) and € 0.58/m3 (500 m) (tertiary treatment was not considered). An average estimated cost for a 50 m building project is 172,500 €, and 580,000 € is estimated for a borehole 500 m depth plus additional MAR facilities. The estimated costs of conservation per year are € 0.13/m3 (50 m) and € 0.15/m3 (500 m).
The premises considered were the variability of the available flow (100 to 1000 l/s) and the possibility of applying this technique in approximately 16% of the Spanish territory (excluding the Canary Islands). This investigation also considered that the projects must be subject to concessions and require detailed suitability and feasibility studies.
The standards for water quality are ambitious in Spain; therefore, the costs may be lower for countries with less rigorous regulations.
Table 4.
The averaged economic index prior to connection with inventoried devices and “MAR zones” in the “HydroGeoportal DINA-MAR” iso-costs layer. The top numbers are specified in Figure 2 (inventory). 1/0 indicates applies/not applies.
| Mar techniques and devices | 1 | 2 | 3 | 4 | 5 | 6 | 7 | 8 | 9 | 10 | 11 | 12 | 13 | 14 | 15 | 16 | 17 | 18 | 19 | 20 | 21 | 22 | 23 | 24 | |||
|---|---|---|---|---|---|---|---|---|---|---|---|---|---|---|---|---|---|---|---|---|---|---|---|---|---|---|---|
| Dispersion | Channels | Wells | Filtration | Rain | Suds | ||||||||||||||||||||||
| cases 1 | code | weight | infiltration ponds/wetlands | channels and infiltration ditches | ridges/ soil and aquifer treatment techniques | infiltration fields (flood and controlled spreading) | accidental recharge by irrigation return | reservoir dams and dams | permeable dams | levees | riverbed scarification | sub-surface/underground dams | drilled dams | qanats (underground gallerys) | open infiltration wells | deep wells and boreholes | boreholes | sinkholes, collapses | asr | astr | river bank filtration (rbf) | interdune filtration | underground irrigation | rainwater harvesting in unproductive | accidental recharge pipes and sewer system | sustainable urban drainage systems | |
| Economic index (average inversion) | euros/m3/year | fluvial | 0.20 | 1 | 1 | 1 | 1 | 1 | 0 | 0 | 1 | 1 | 0 | 0 | 0 | 1 | 1 | 0 | 1 | 0 | 0 | 1 | 0 | 0 | 0 | 0 | 0 |
| river dams | 0.10 | 0 | 0 | 0 | 0 | 0 | 1 | 1 | 0 | 0 | 0 | 1 | 0 | 0 | 0 | 0 | 0 | 0 | 0 | 0 | 0 | 0 | 0 | 0 | 0 | ||
| buried dikes in rivers | 0.22 | 0 | 0 | 0 | 0 | 0 | 0 | 0 | 0 | 0 | 1 | 0 | 0 | 0 | 0 | 0 | 0 | 0 | 0 | 0 | 0 | 0 | 0 | 0 | 1 | ||
| suds (urban) | 0.08 | 0 | 0 | 0 | 0 | 0 | 1 | 0 | 0 | 0 | 0 | 0 | 1 | 0 | 0 | 0 | 1 | 0 | 0 | 0 | 1 | 1 | 1 | 1 | 0 | ||
| wwtp <50 l/s | 0.23 | 0 | 0 | 0 | 0 | 0 | 0 | 0 | 0 | 0 | 0 | 0 | 0 | 1 | 0 | 1 | 0 | 0 | 0 | 0 | 0 | 0 | 0 | 0 | 0 | ||
| wwtp >50 l/s | 0.58 | 0 | 0 | 0 | 0 | 0 | 0 | 0 | 0 | 0 | 0 | 0 | 0 | 0 | 0 | 1 | 0 | 1 | 1 | 0 | 0 | 0 | 0 | 0 | |||
Using the maps of potential “MAR Zones” for Managed Aquifer Recharge in Spain Iberian Peninsula and Balearic Islands (in [8]) as the starting point, a new specific mapping is proposed using the total expected costs for each zone (€/m3) that depended on the most appropriate device for each case. The result is a novel map (Figure 6).
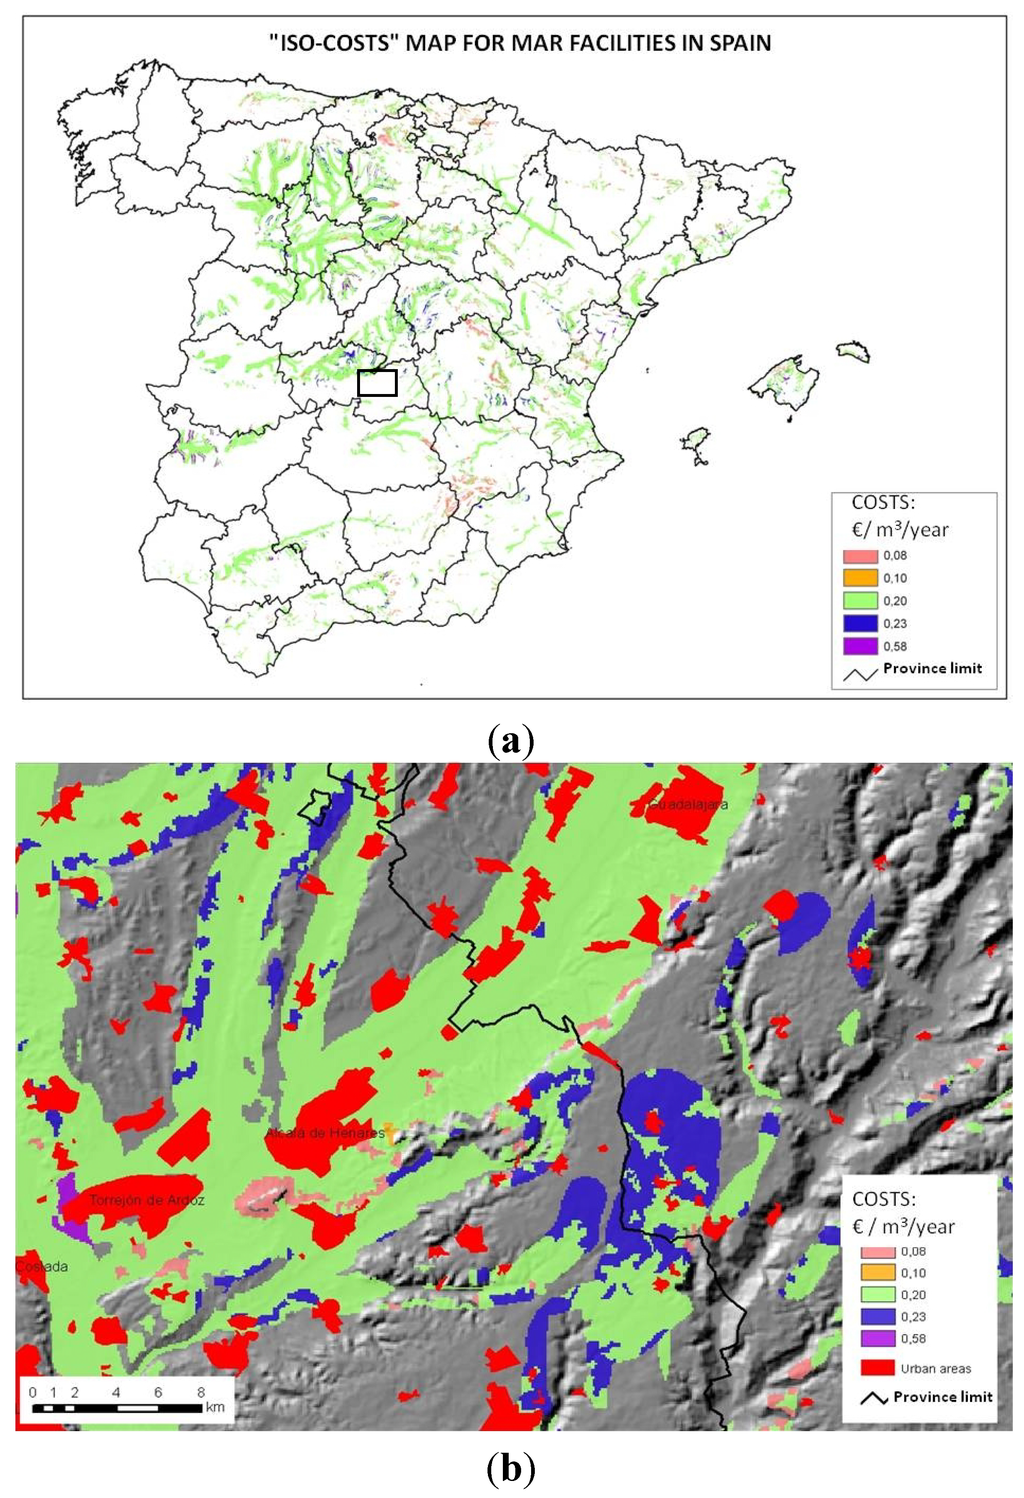
Figure 6.
(a) Choroplethic map of “iso-costs” for the best MAR facilities in each “MAR Zone” for Spanish Peninsula and Balearic Islands; (b) Detailed view for the East of Madrid province (square in Figure 6a). These results are available at DINA-MAR [8].
Classes:
- -
- € 0.08 /m3. Urban (SUDS) /forestry runoff capture;
- -
- € 0.10 /m3 Surface devices from river origin;
- -
- € 0.20 /m3 MAR from buried dikes in rivers;
- -
- € 0.23 /m3 Wells and boreholes with an injection capacity below 50 l/s;
- -
- € 0.58 /m3 Boreholes with an injection capacity exceeding 50 l/s.
This novel mapping provides valuable guidance for future development of MAR projects. Water managers and practitioners are anticipated to be able to utilize these innovative results.
4. Conclusions and Comments
Results show that 16% of the 500,000 km2 area studied using GIS has potential for MAR using a range of techniques adapted to the local situation. In these areas MAR is rather cheap in comparison to surface water storage techniques. The net savings in capital costs if MAR was practiced instead of dams is about 75% for superficial facilities (ponds and channels), about 50% for medium deep wells and 27% for deep boreholes.
Detailed calculations are necessary to support the results and justify future actions. Calculations may be inaccurate, and the resulting figures may cause water managers to consider opportunity costs prior to decision making.
Regarding legality, reviewing current legislation would be desirable (despite the associated difficulty of this goal) because often regulations “fall behind” technological advances. Additionally, the new charges and expenses caused by the economic crisis, some of which may take the form of higher taxes in some communities, have reduced the interest of private investors to undertake MAR projects.
The further understanding of the economics of MAR and an evaluation of the environmental and social effects are necessary. Additionally, the involvement of industry (e.g., agro-industries, desalination agents, waste water treatment agents, and golf courses) in MAR is crucial.
The work presented here could be applied in other countries with appropriate modifications. One aspect to consider in calculations of the “MAR zones” is that the terrain of other countries could vary from the conditions in Spain. The terrain type determines the surface runoff (e.g., plains, plateaus, and moors) and the groundwater flow. Additionally, applying and understanding MAR techniques in heavily deforested areas is desirable according to the results in Figure 2 and Figure 4.
New designs may encompass as many “low cost” devices (example in Figure 7) as possible according to necessities.
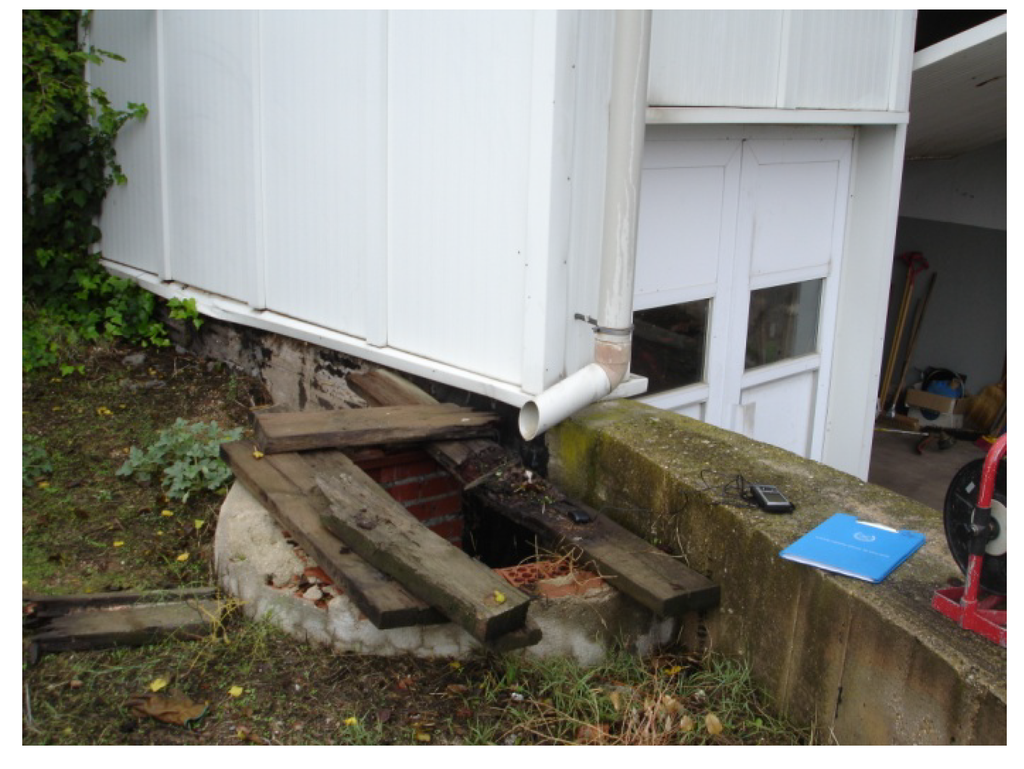
Figure 7.
Example of a “very low cost” domestic MAR device in Madrid.
Acknowledgments
This study was performed and written within the Framework of the R&D DINA-MAR project code 30/13.053 and was financed by the SEPI & Tragsa Group. Special thanks to Peter Dillon for revising the text and to two anonymous reviewers and the journal invited editor for their thoughtful reviews and suggestions.
Author Contributions
The authors participated in different stages during the “Hydro-geoportal” production. Enrique Fernández and María A. San Miguel developed the application and coordinated the different stages. Rodrigo Calero calculated the cost and value of the different options for real-building work budgets. Fernando Sánchez provided the IT input for the GIS to be incorporated into a map viewer and studied its compatibility with the EU INSPIRE Directive.
Conflicts of Interest
The authors declare no conflict of interest.
References
- Dudding, M.; Evans, R.; Dillon, P.; Molloy, R. Report on Broad Scale Map of ASR Potential in Melbourne; SKM and CSIRO Report to Smart Water Fundation; CSIRO: Melbourne, Australia, March 2006; p. 49. [Google Scholar]
- Hostetler, S. Water Banking; Department of Agriculture, Fisheries and Forestry and the Bureau of Rural Sciences: Canberra, ACT, Australia, 2007. [Google Scholar]
- Kallalia, H.; Ananea, M.; Jellalia, S.; Tarhounib, J. GIS-based multi-criteria analysis for potential wastewater aquifer recharge sites. Desalination 2007, 215, 111–119. [Google Scholar] [CrossRef]
- Masciopinto, C.; Palmisano, V.; Tangorra, F.; Vurro, M. A decision support system for artificial recharge plant. Water Sci. Technol. 1991, 24, 331–342. [Google Scholar]
- Pedrero, F.; Albuquerque, A.; Marcos do Monte, H.; Cavaleiro, V.; Alarcon, J. Application of GIS-based multi-criteria analysis for site selection of aquifer recharge with reclaimed water. Resour. Conserv. Recycl. 2011, 56, 105–116. [Google Scholar] [CrossRef]
- Smith, A.; Pollock, D. Artificial Recharge Potential of the Perth Region Superficial Aquifer: Lake Preston to Moore River; Water for a Healthy Country National Research Flagship; CSIRO Publishing: Canberra, ACT, Australia, 2010. [Google Scholar]
- DINA-MAR (multiauthor). DINA-MAR. La gestión de la recarga artificial de acuíferos en el marco del desarrollo sostenible. Desarrollo tecnológico. Coord. Enrique Fdez. Escalante. Serie Hidrogeología Hoy, No 6. Método Gráfico. Available online: http://goo.gl/6lp4m (accessed on 3 January 2014).
- DINA-MAR Website. Available online: http://www.dina-mar.es/ (accessed on 3 January 2014).
- Fernández Escalante, E.; San Sebastián Sauto, J. Rechargeable Sustainability. The Key Is the Storage. Available online: http://goo.gl/dgM6HD (accessed on 3 January 2014).
- DINA-MAR website “Visor cartográfico”. Available online: http://sig3.tragsatec.es/visor_dina-mar/ (accessed on 3 January 2014).
© 2014 by the authors; licensee MDPI, Basel, Switzerland. This article is an open access article distributed under the terms and conditions of the Creative Commons Attribution license (http://creativecommons.org/licenses/by/3.0/).