The 2011 Brisbane Floods: Causes, Impacts and Implications


Abstract
:1. Introduction

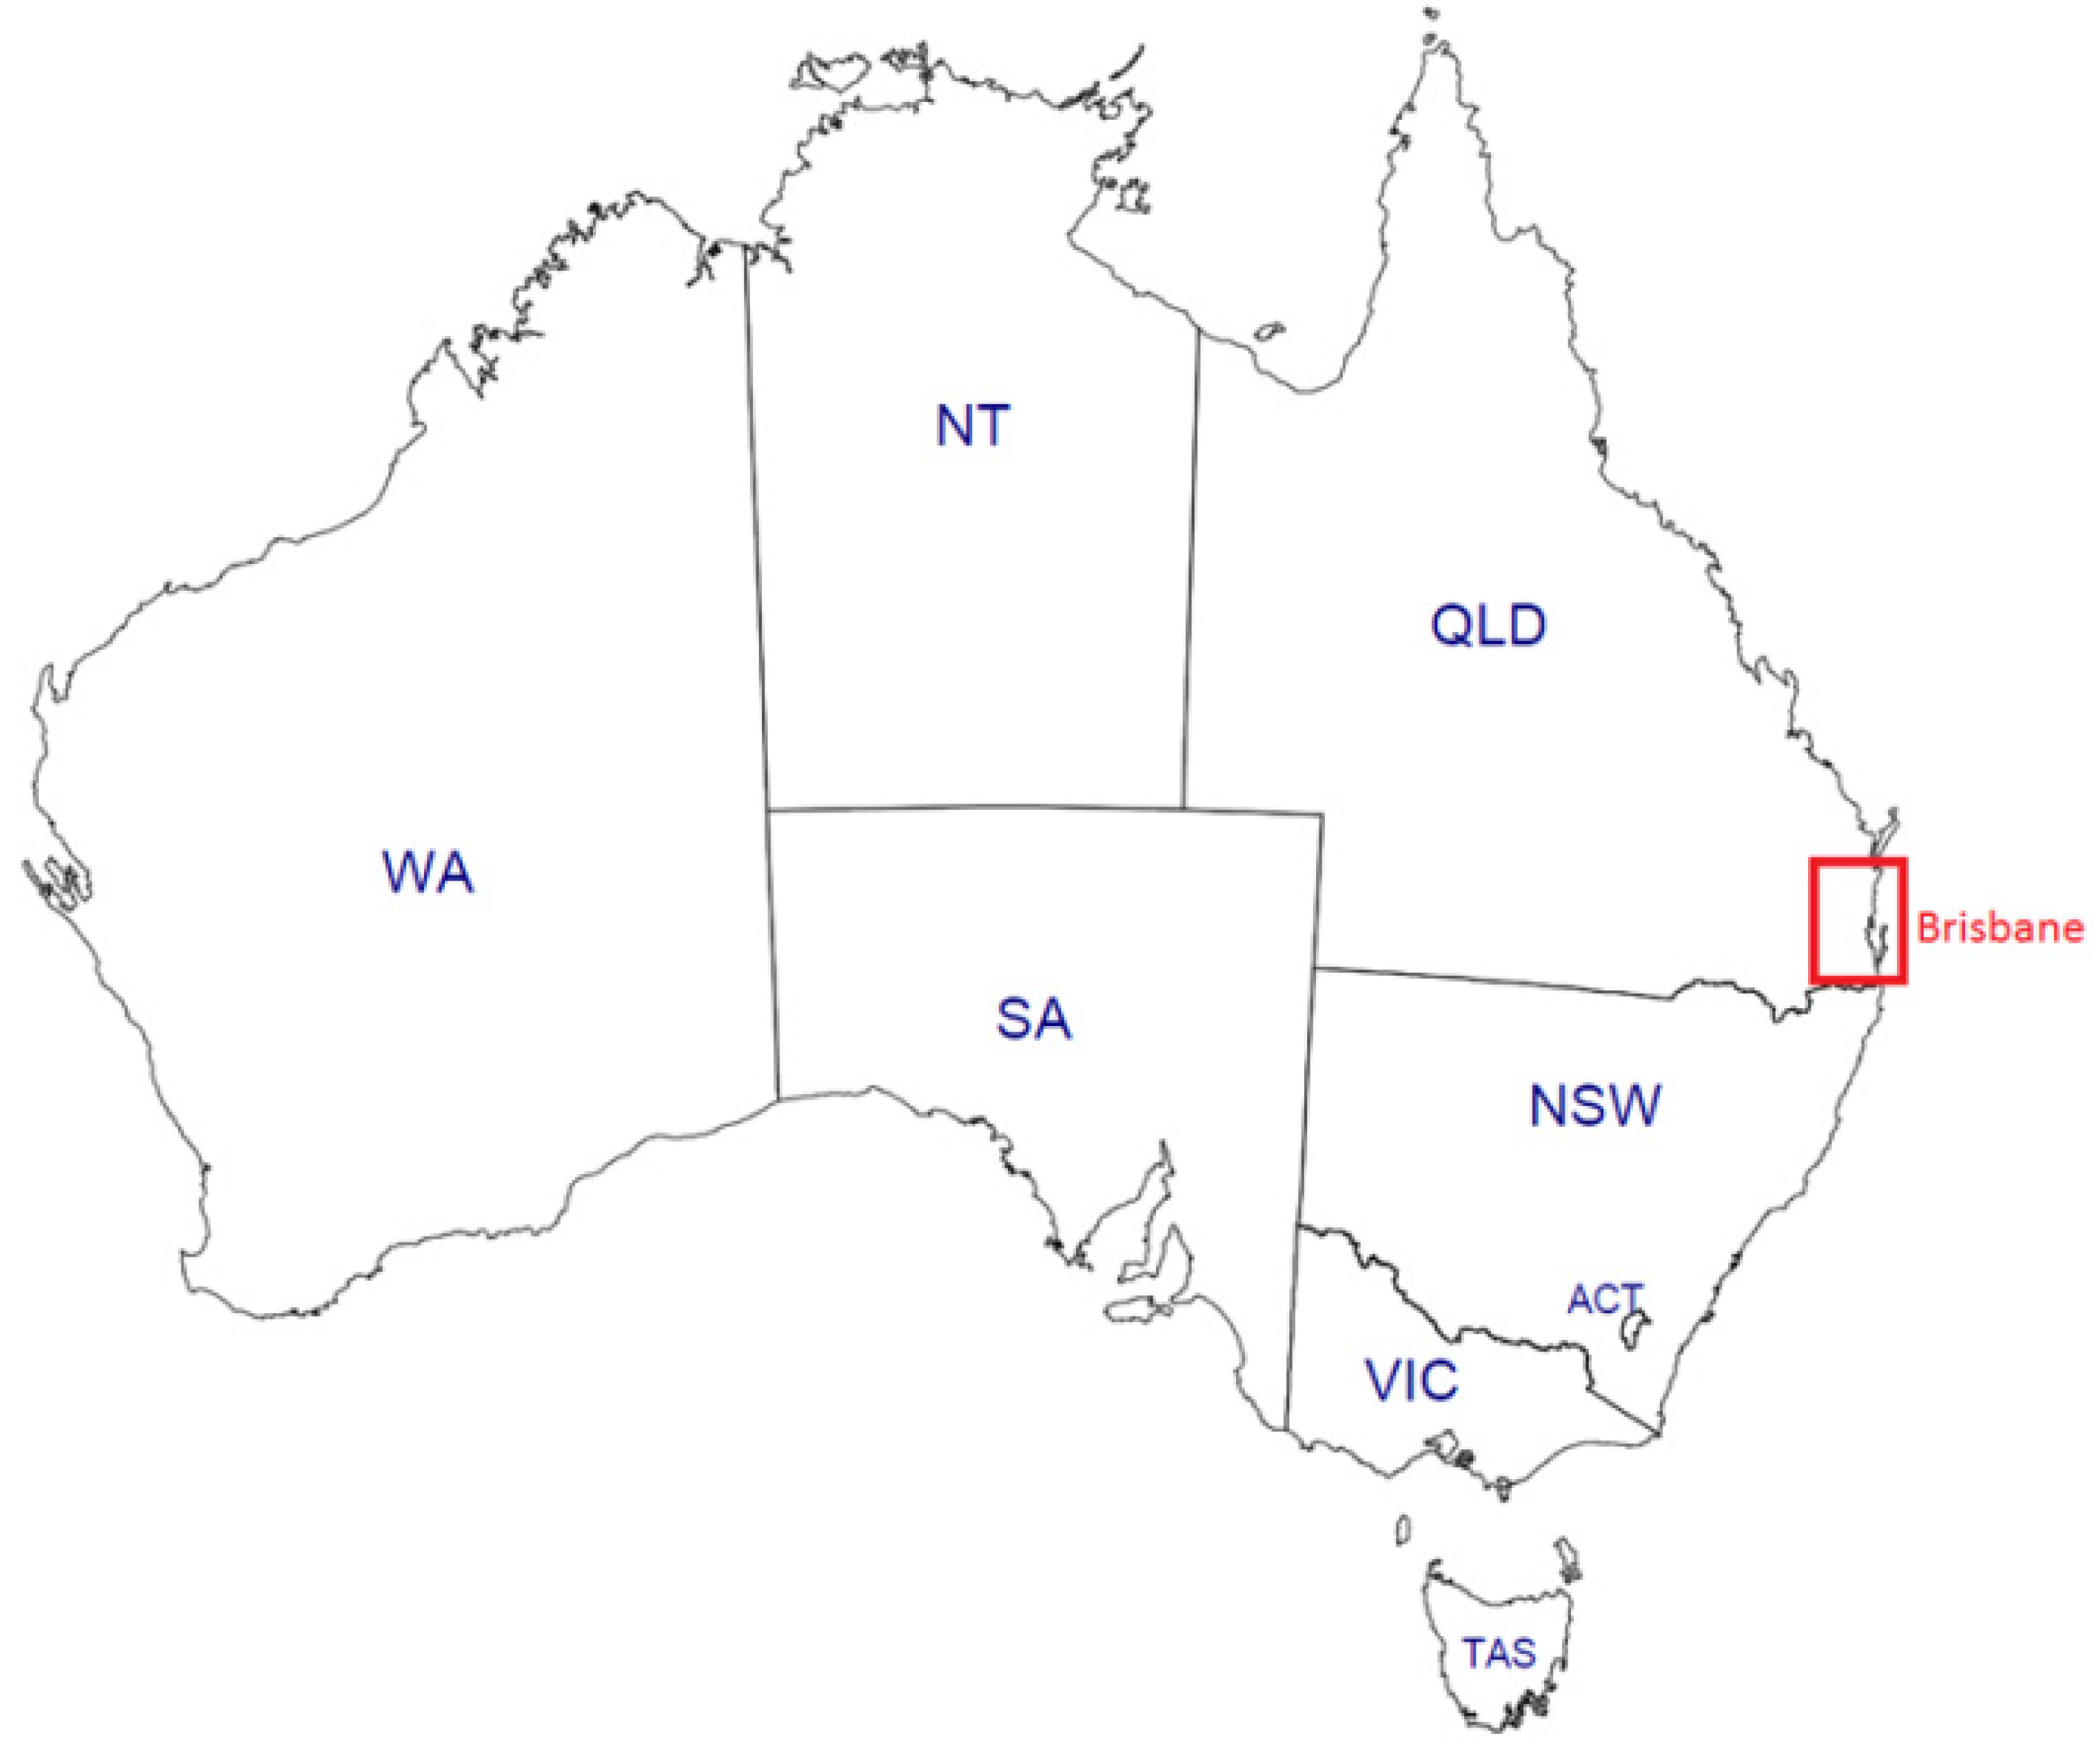
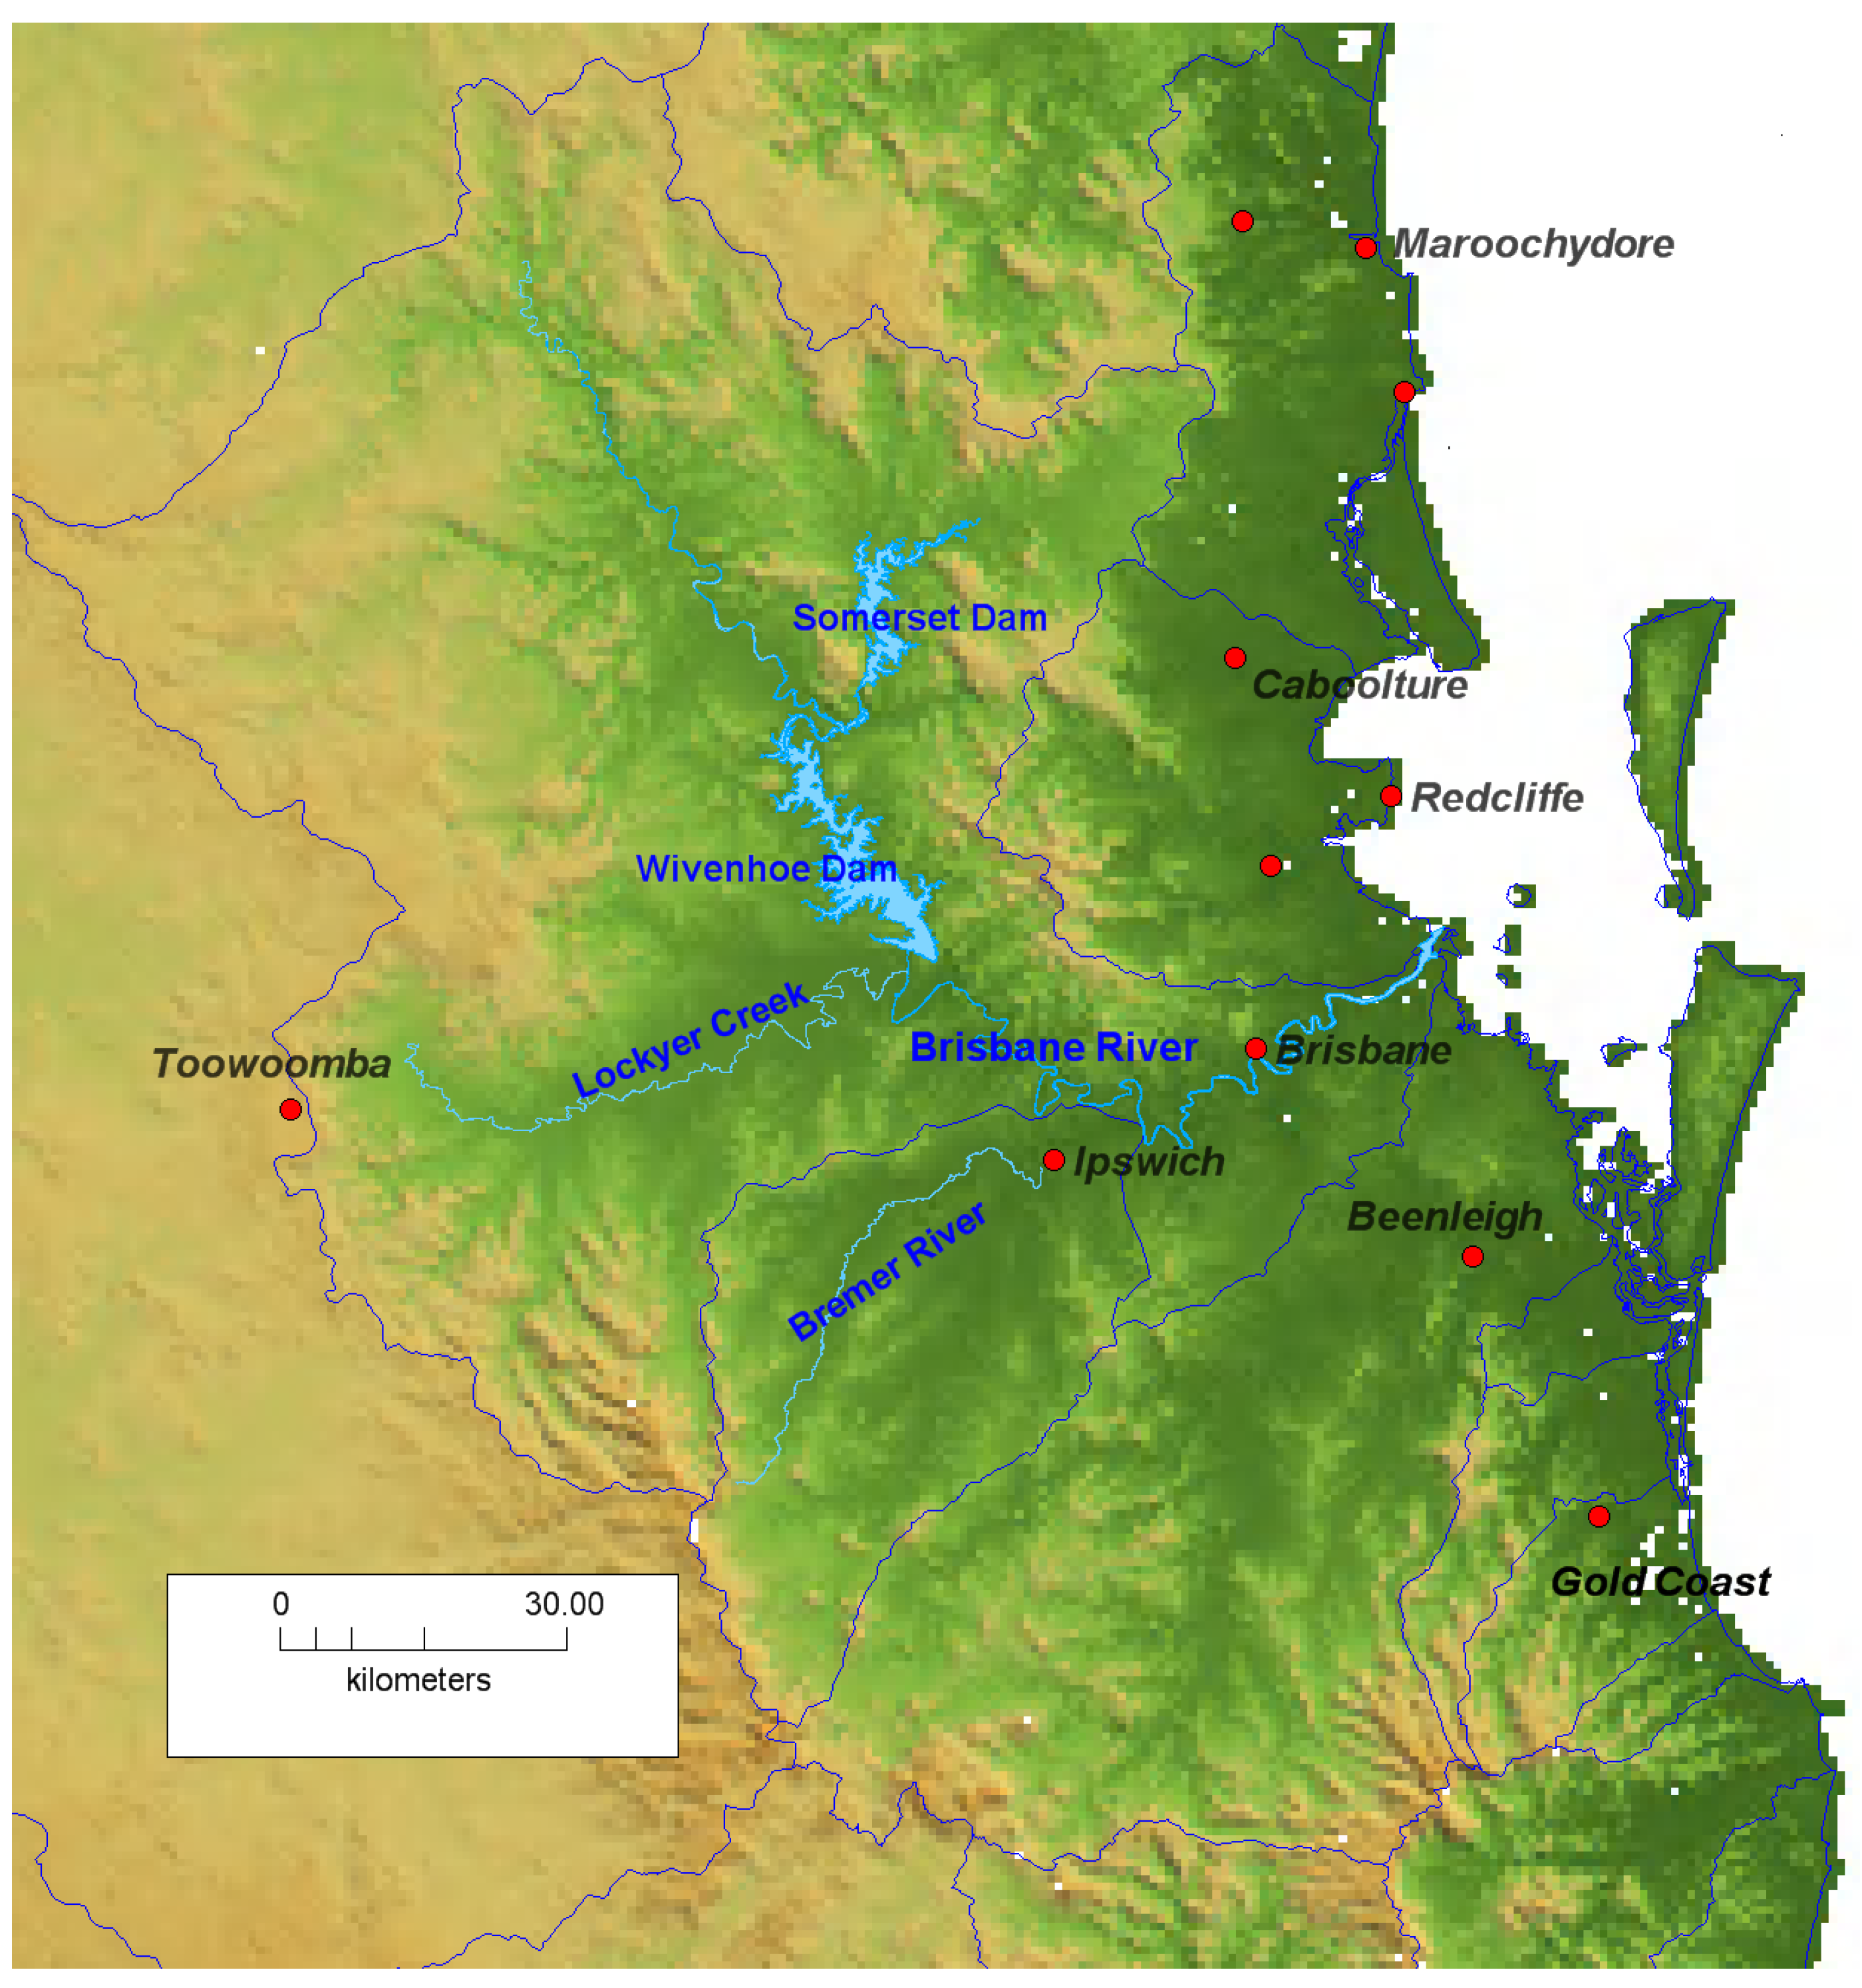
2. The Brisbane River Catchment
2.1. The Brisbane River
2.2. The Brisbane River Catchment

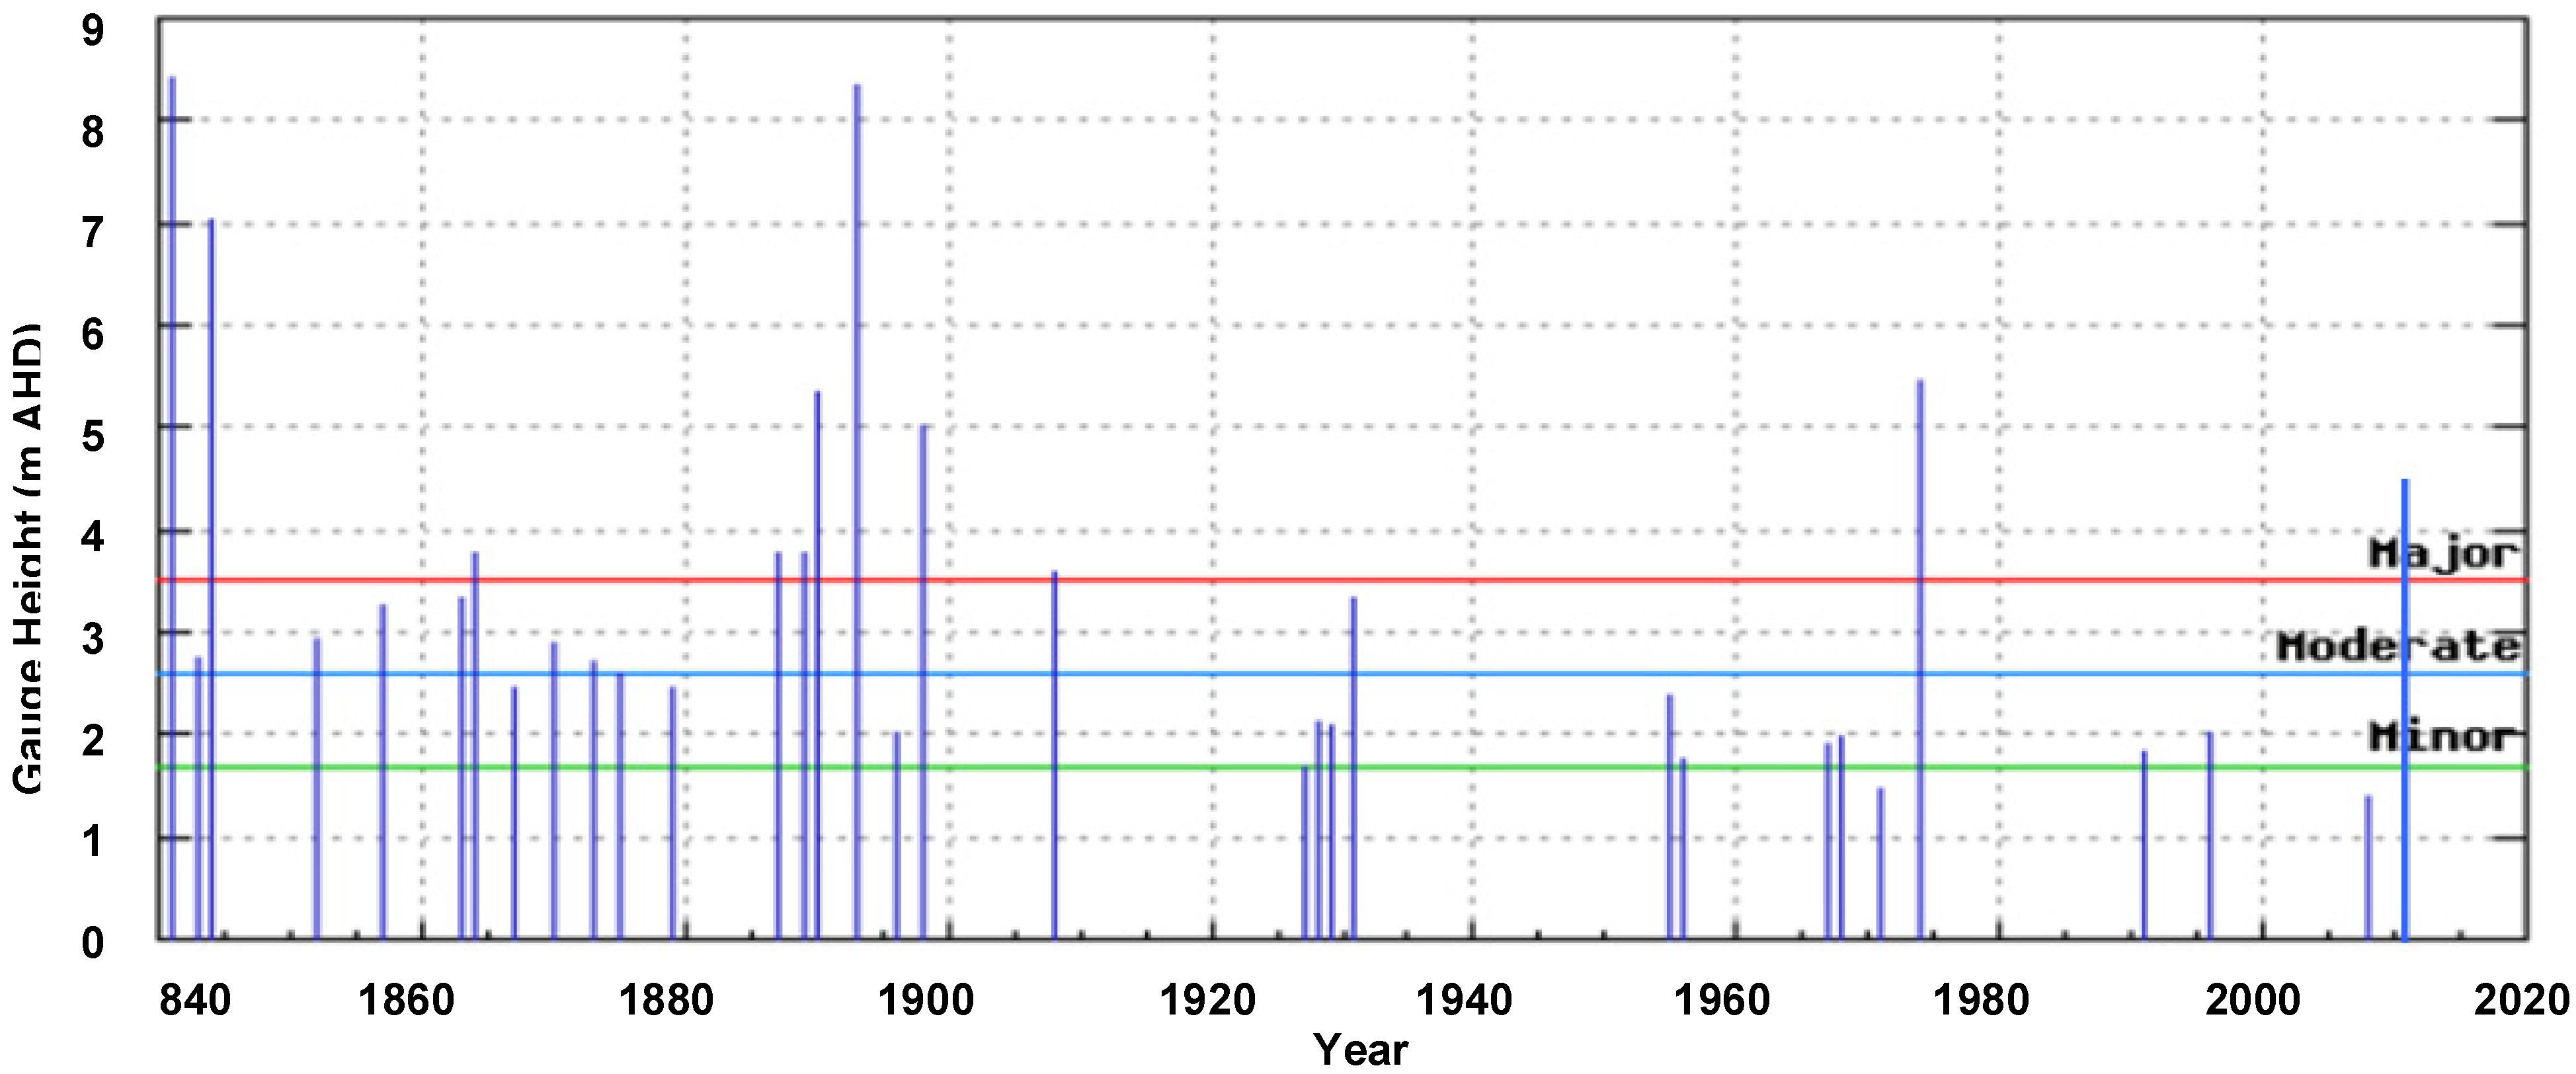
3. Historical Flood Events on the Brisbane River

| Station | February 1893 | January 1974 |
|---|---|---|
| Deaths | 35 | 16 |
| Injuries | 300 | 300 |
| Persons left homeless | 5,000 | 9,000 |
| Persons evacuated | 9,000 | |
| Buildings damaged | 5,000 | 7,000 |
| Cars damaged or destroyed | 1,000 |
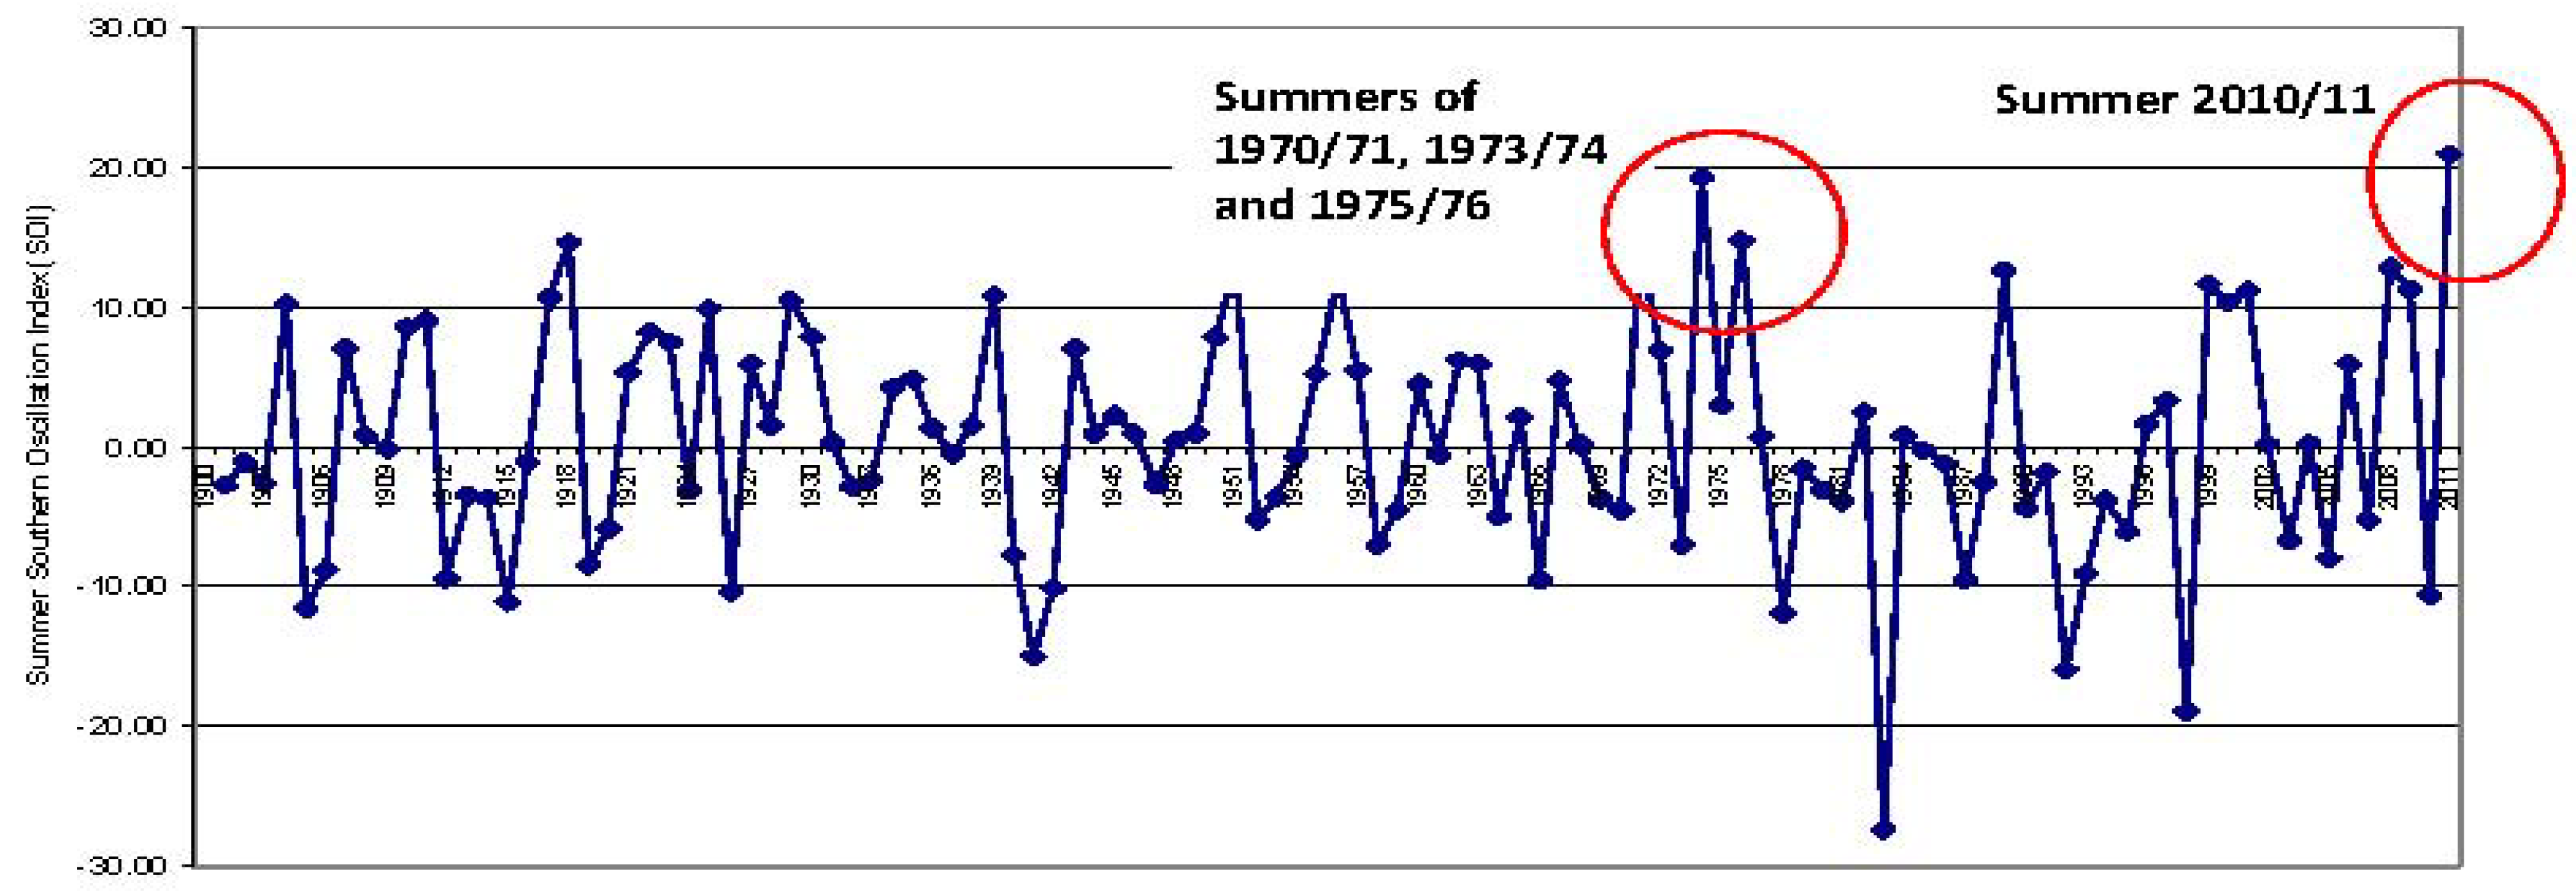
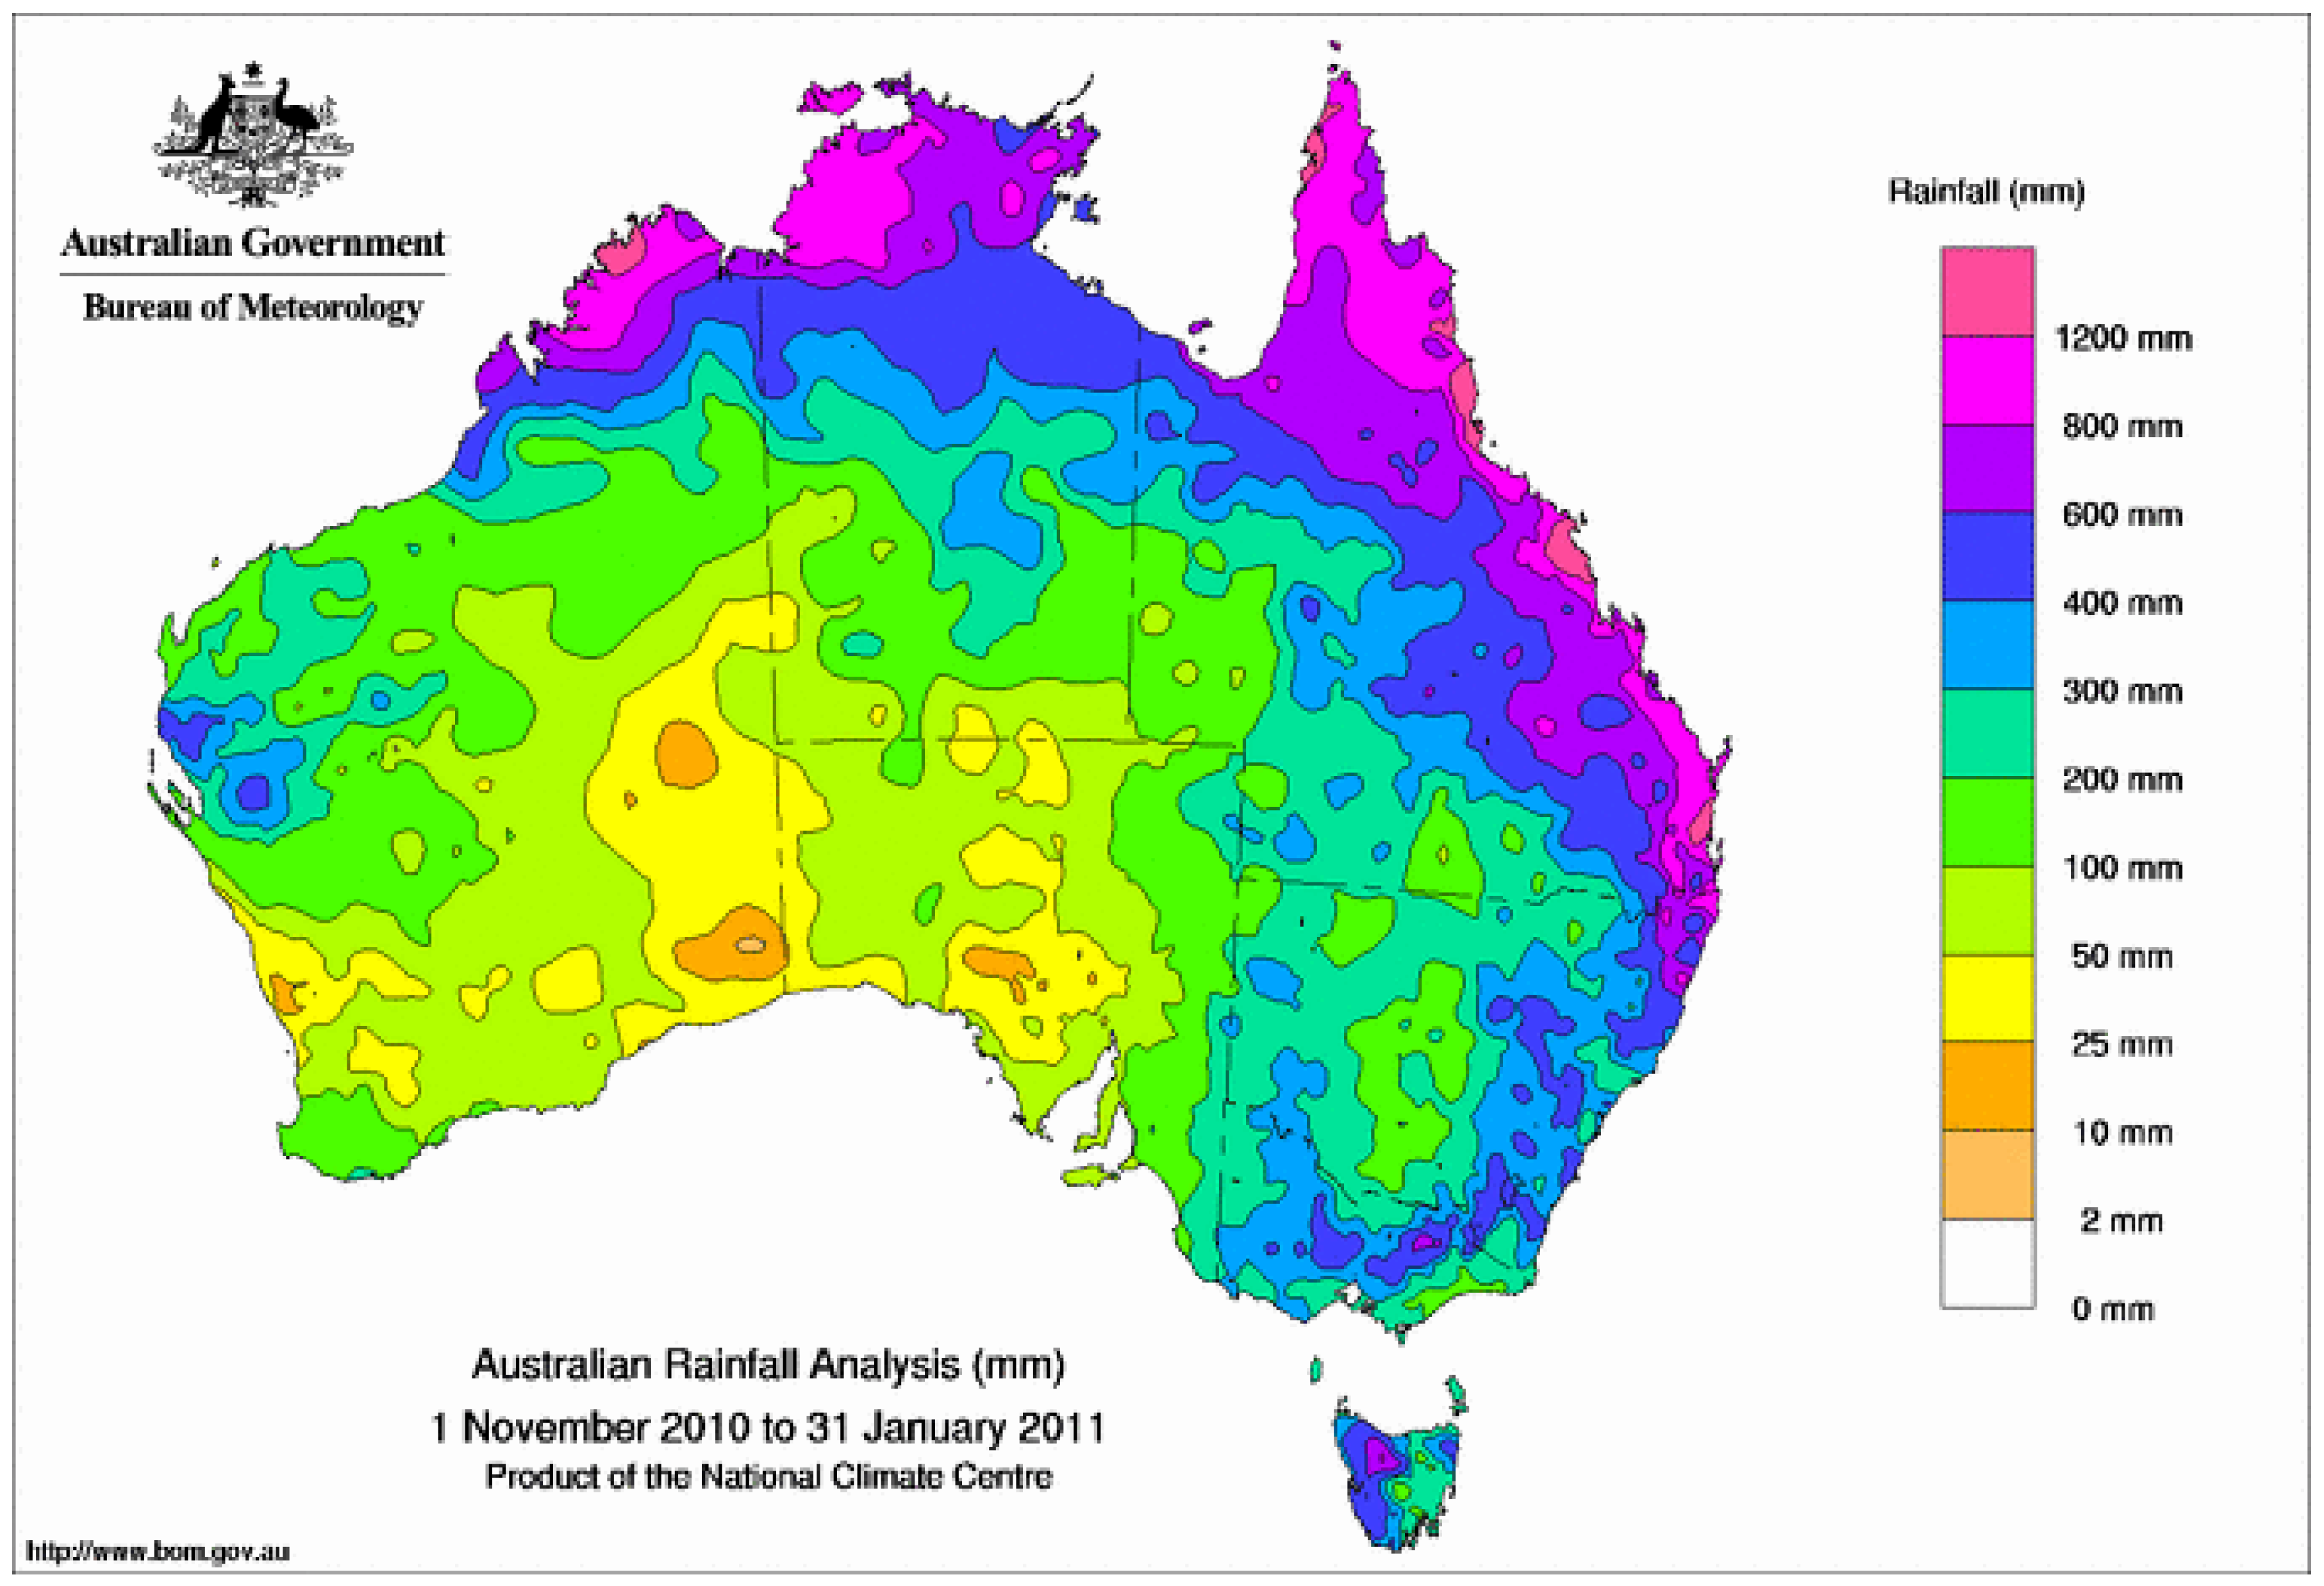
4. Causes (1): Rainfall in Eastern Australia: December 2010 to January 2011
4.1. Rainfall During December 2010 and January 2011


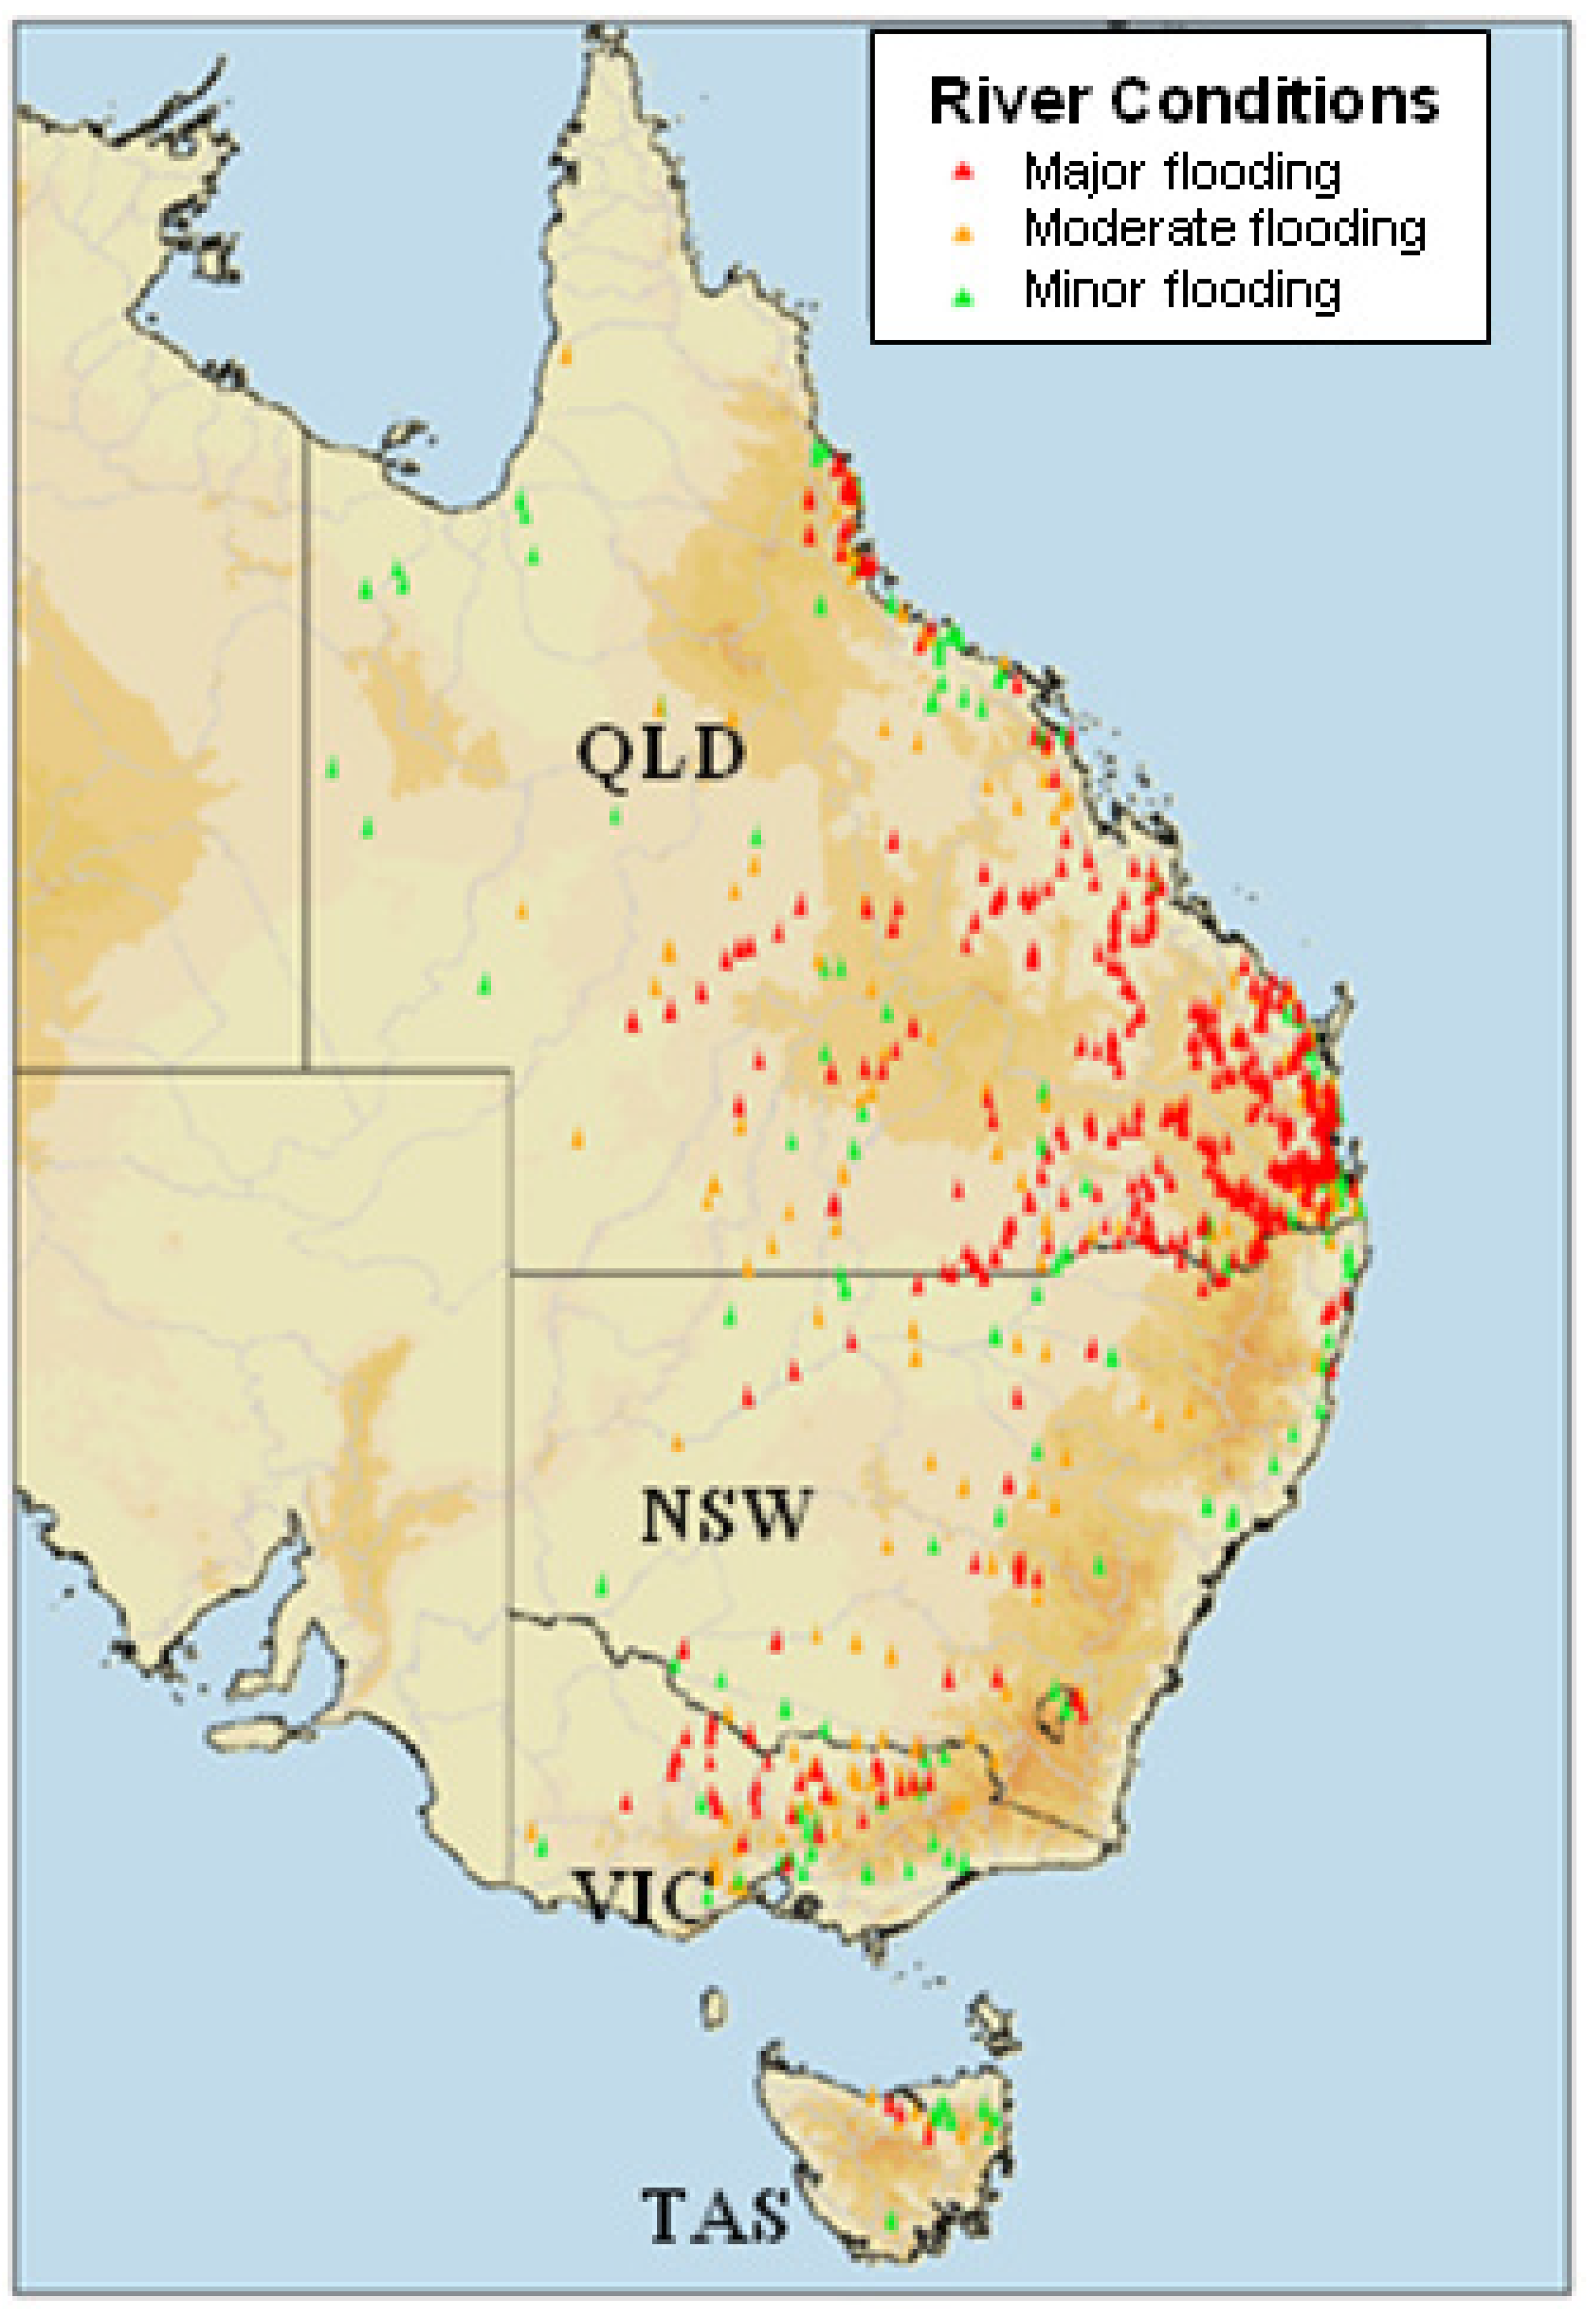
4.2. Flooding in Eastern Australia
4.3. Rainfall Meteorology in South East Queensland During 8th to 12th January 2011
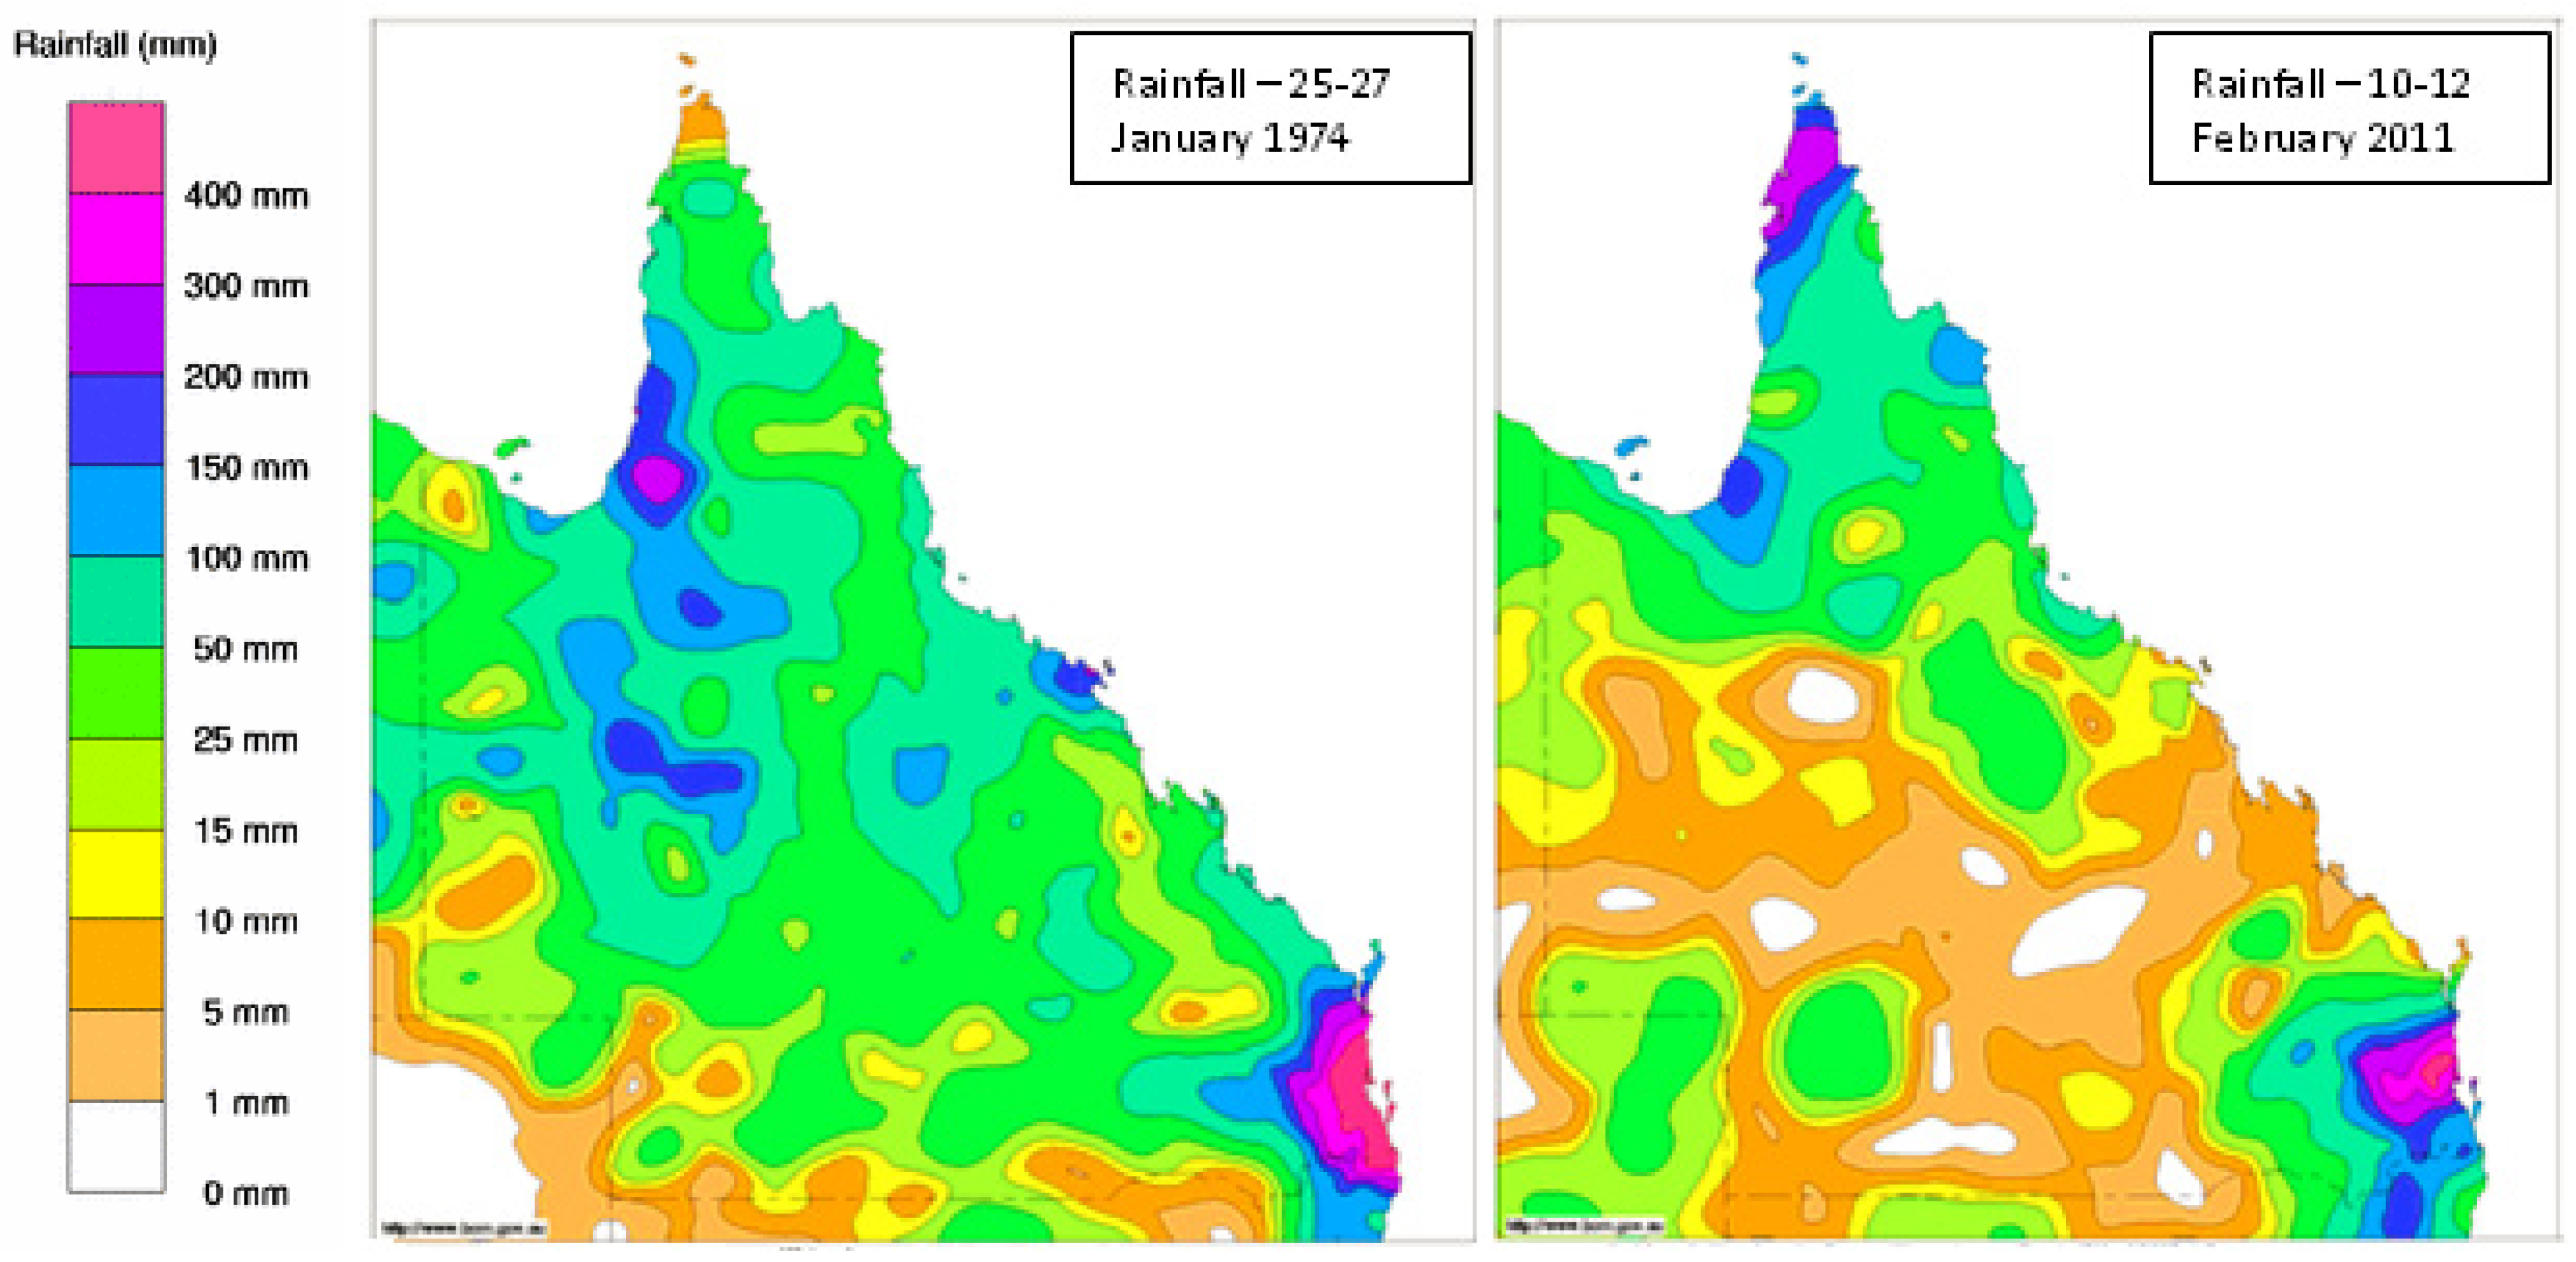
4.4. Comparing the Three-Day Rainfall Totals from the January 2011 Flood Event with Those of the January 1974
- (1)
- Peak rainfalls in 1974 were substantially heavier than those in 2011. A number of rainfall stations in southeast Queensland had three-day rainfall totals in excess of 1,000 mm in 1974 compared with a maximum of 648 mm recorded during the 2011 event. Over the Brisbane River catchment as a whole, the average three-day rainfall in 1974 was 349 mm, compared with 286 mm in 2011, and all four major sub-catchments were also wetter in 1974 than in 2011, although by small margins in the cases of the Bremer (442 mm vs. 417 mm) and Lockyer (331 mm vs. 292 mm) sub-catchments [9].
- (2)
- The above observation also extends to metropolitan Brisbane where three-day and one-day totals of 600 mm and 314 mm in 1974 were significantly greater than the 166 mm and 111 mm recorded in 2011 [9].
- (3)
- In 1974 the heaviest rains in south east Queensland occurred close to the coast, whereas in 2011 the heaviest rainfalls spread further inland, particularly on the western fringe of the Brisbane River catchment and on the Great Dividing Range.
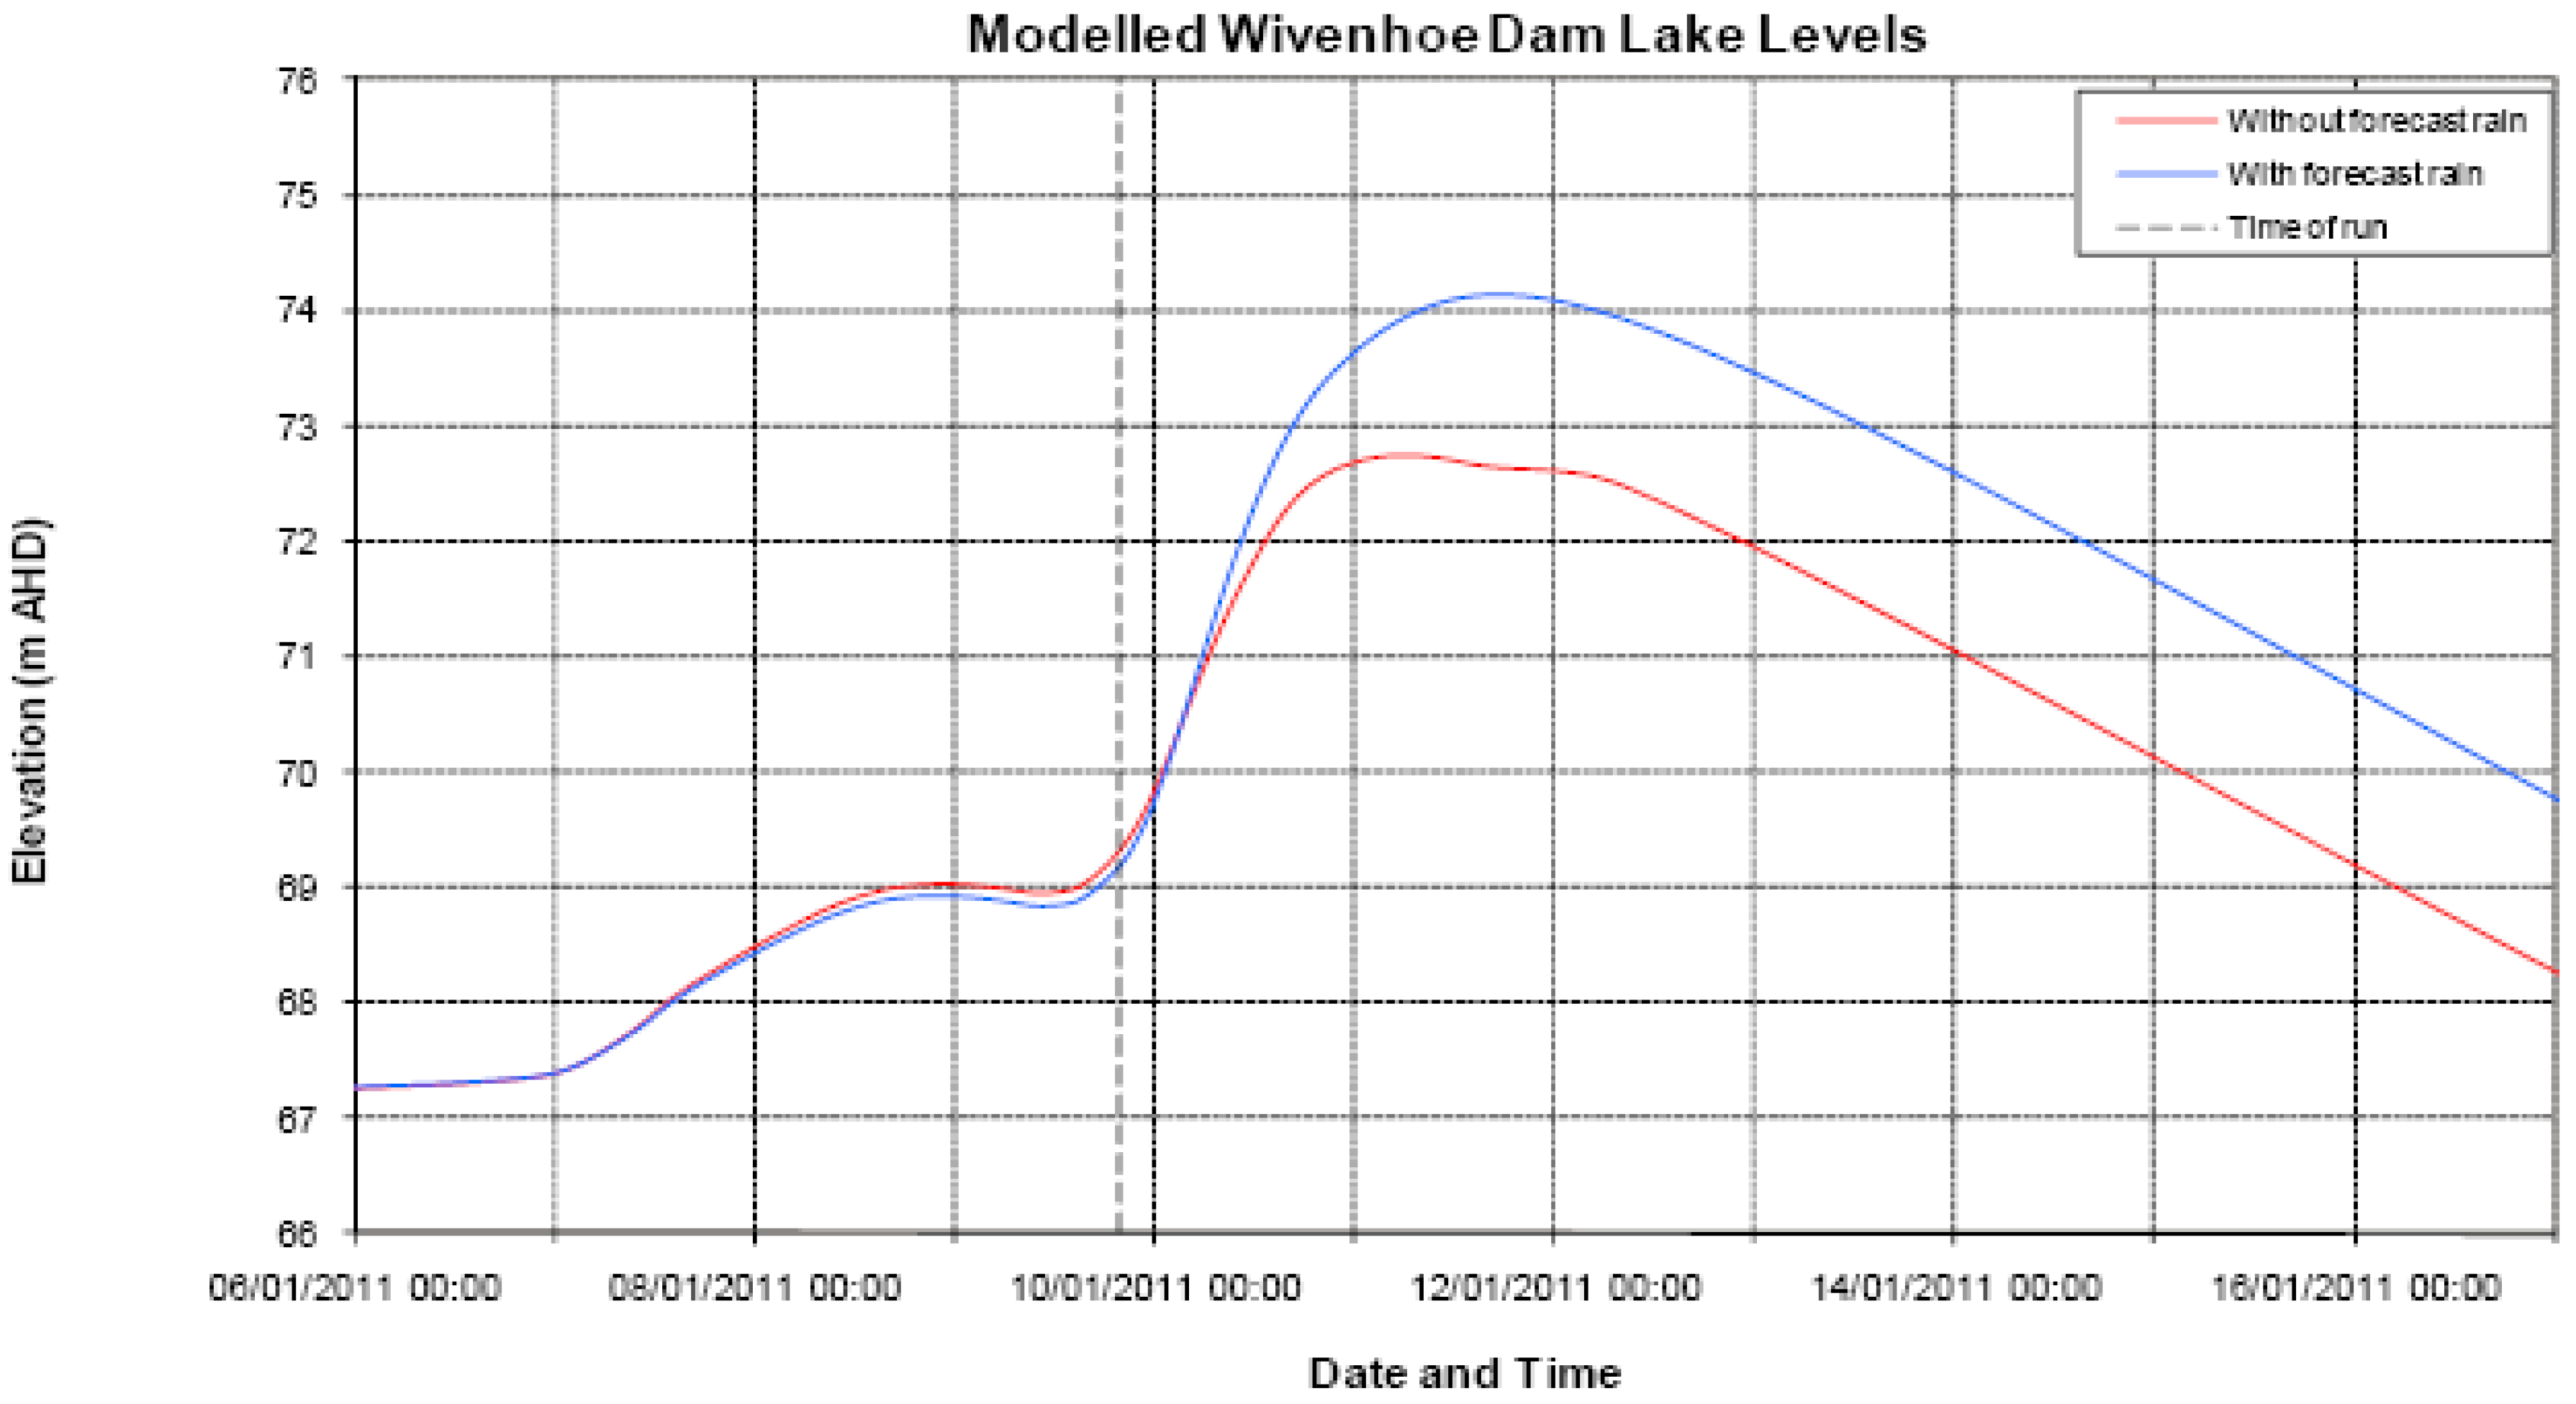
5. Causes (2): Water Releases from Wivenhoe Dam
- (1)
- ensuring the structural safety of the dams;
- (2)
- providing optimum protection of urbanised areas from inundation;
- (3)
- minimising disruption to rural life in the valleys of the Brisbane and Stanley Rivers;
- (4)
- retaining the storage at Full Supply Level (for water supply purposes) at the conclusion of the Flood Event;
- (5)
- minimising impacts to riparian flora and fauna during the drain down phase of the flood.
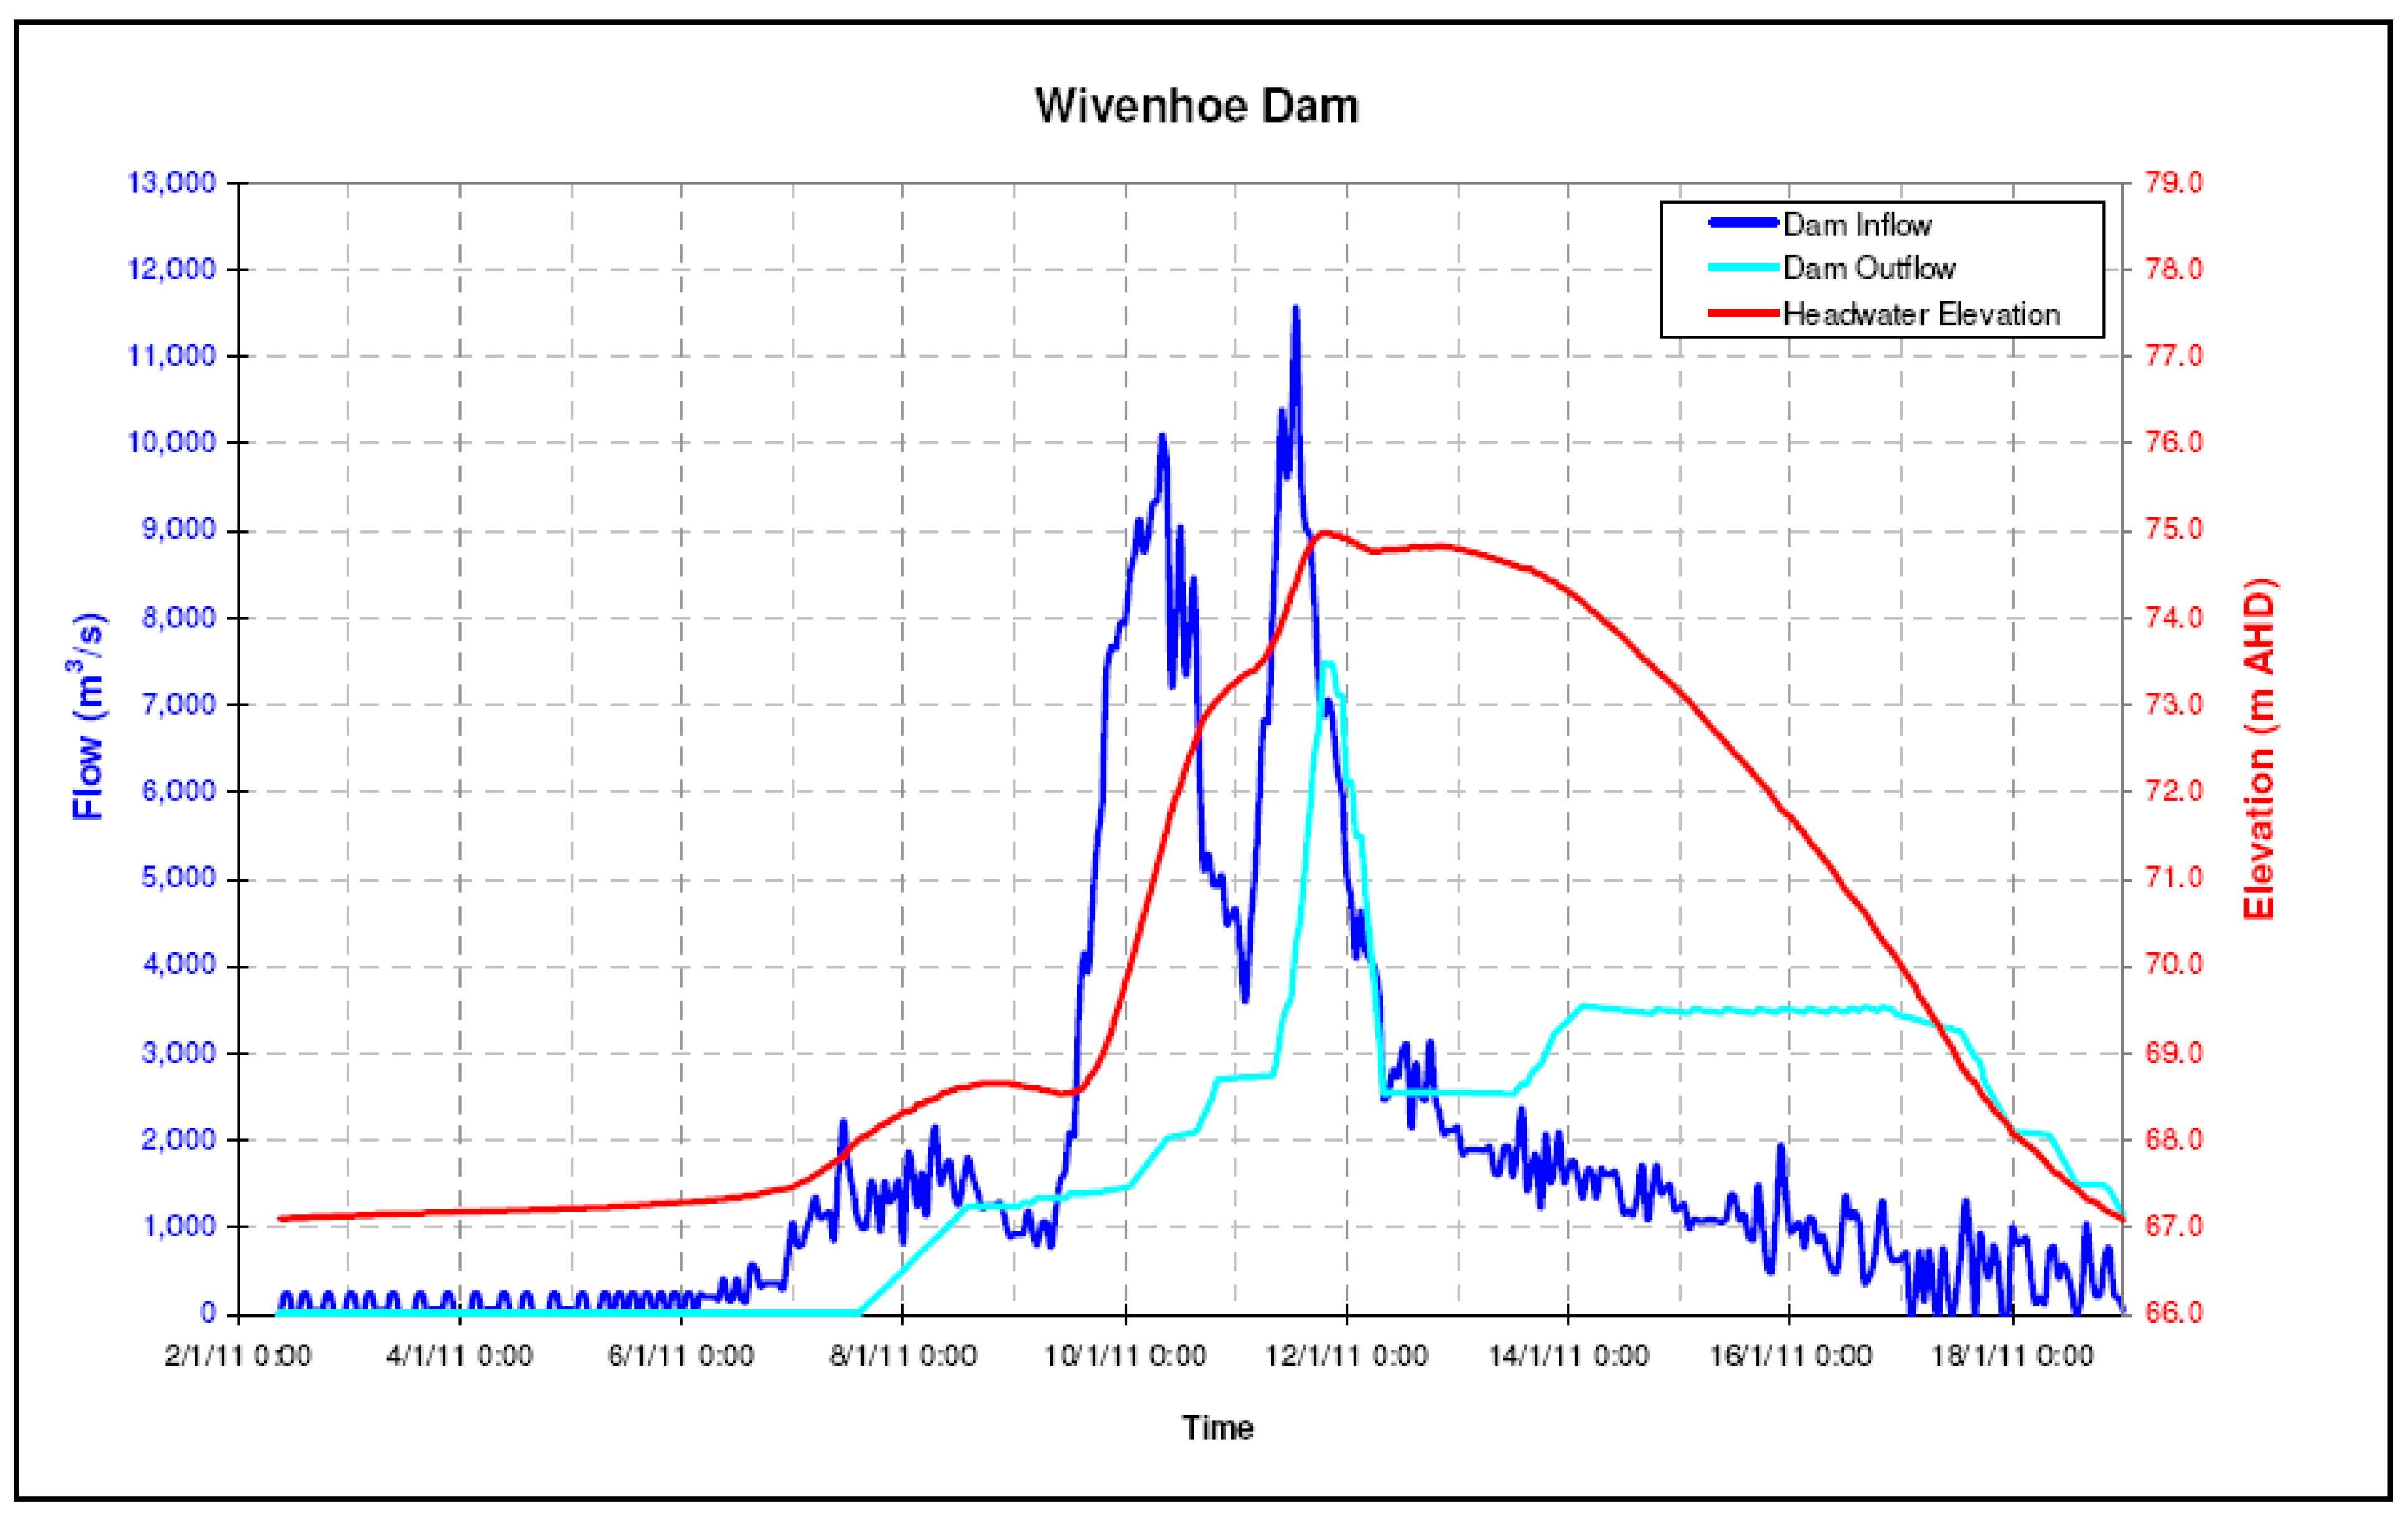
Two distinct flood peaks entered Wivenhoe Dam during the flood event. The first flood into Wivenhoe Dam was similar in nature and magnitude to the comparable flood flows of the January 1974 event. The combined mitigation effect of Somerset and Wivenhoe Dams ensured that this first flood did not result in urban damage below Moggill (some 20 km upstream from Brisbane CBD), however achieving this result did cause significant filling of the dams’ flood storage compartments. The second flood was also similar in nature and magnitude to the comparable flood flows of the January 1974 event. The flood compartments of the dams were filled to a high level by the first flood and there was not sufficient time to release this water prior to the second flood arriving. Accordingly, the second flood could not be completely contained without risking the safety of the dams. The resulting inflow of water into the Brisbane River, combined with floodwaters from Lockyer Creek, the Bremer River and the Lower Brisbane River resulted in significant urban damage. However, the extent of this damage was greatly reduced by the operation of the dams.[15]

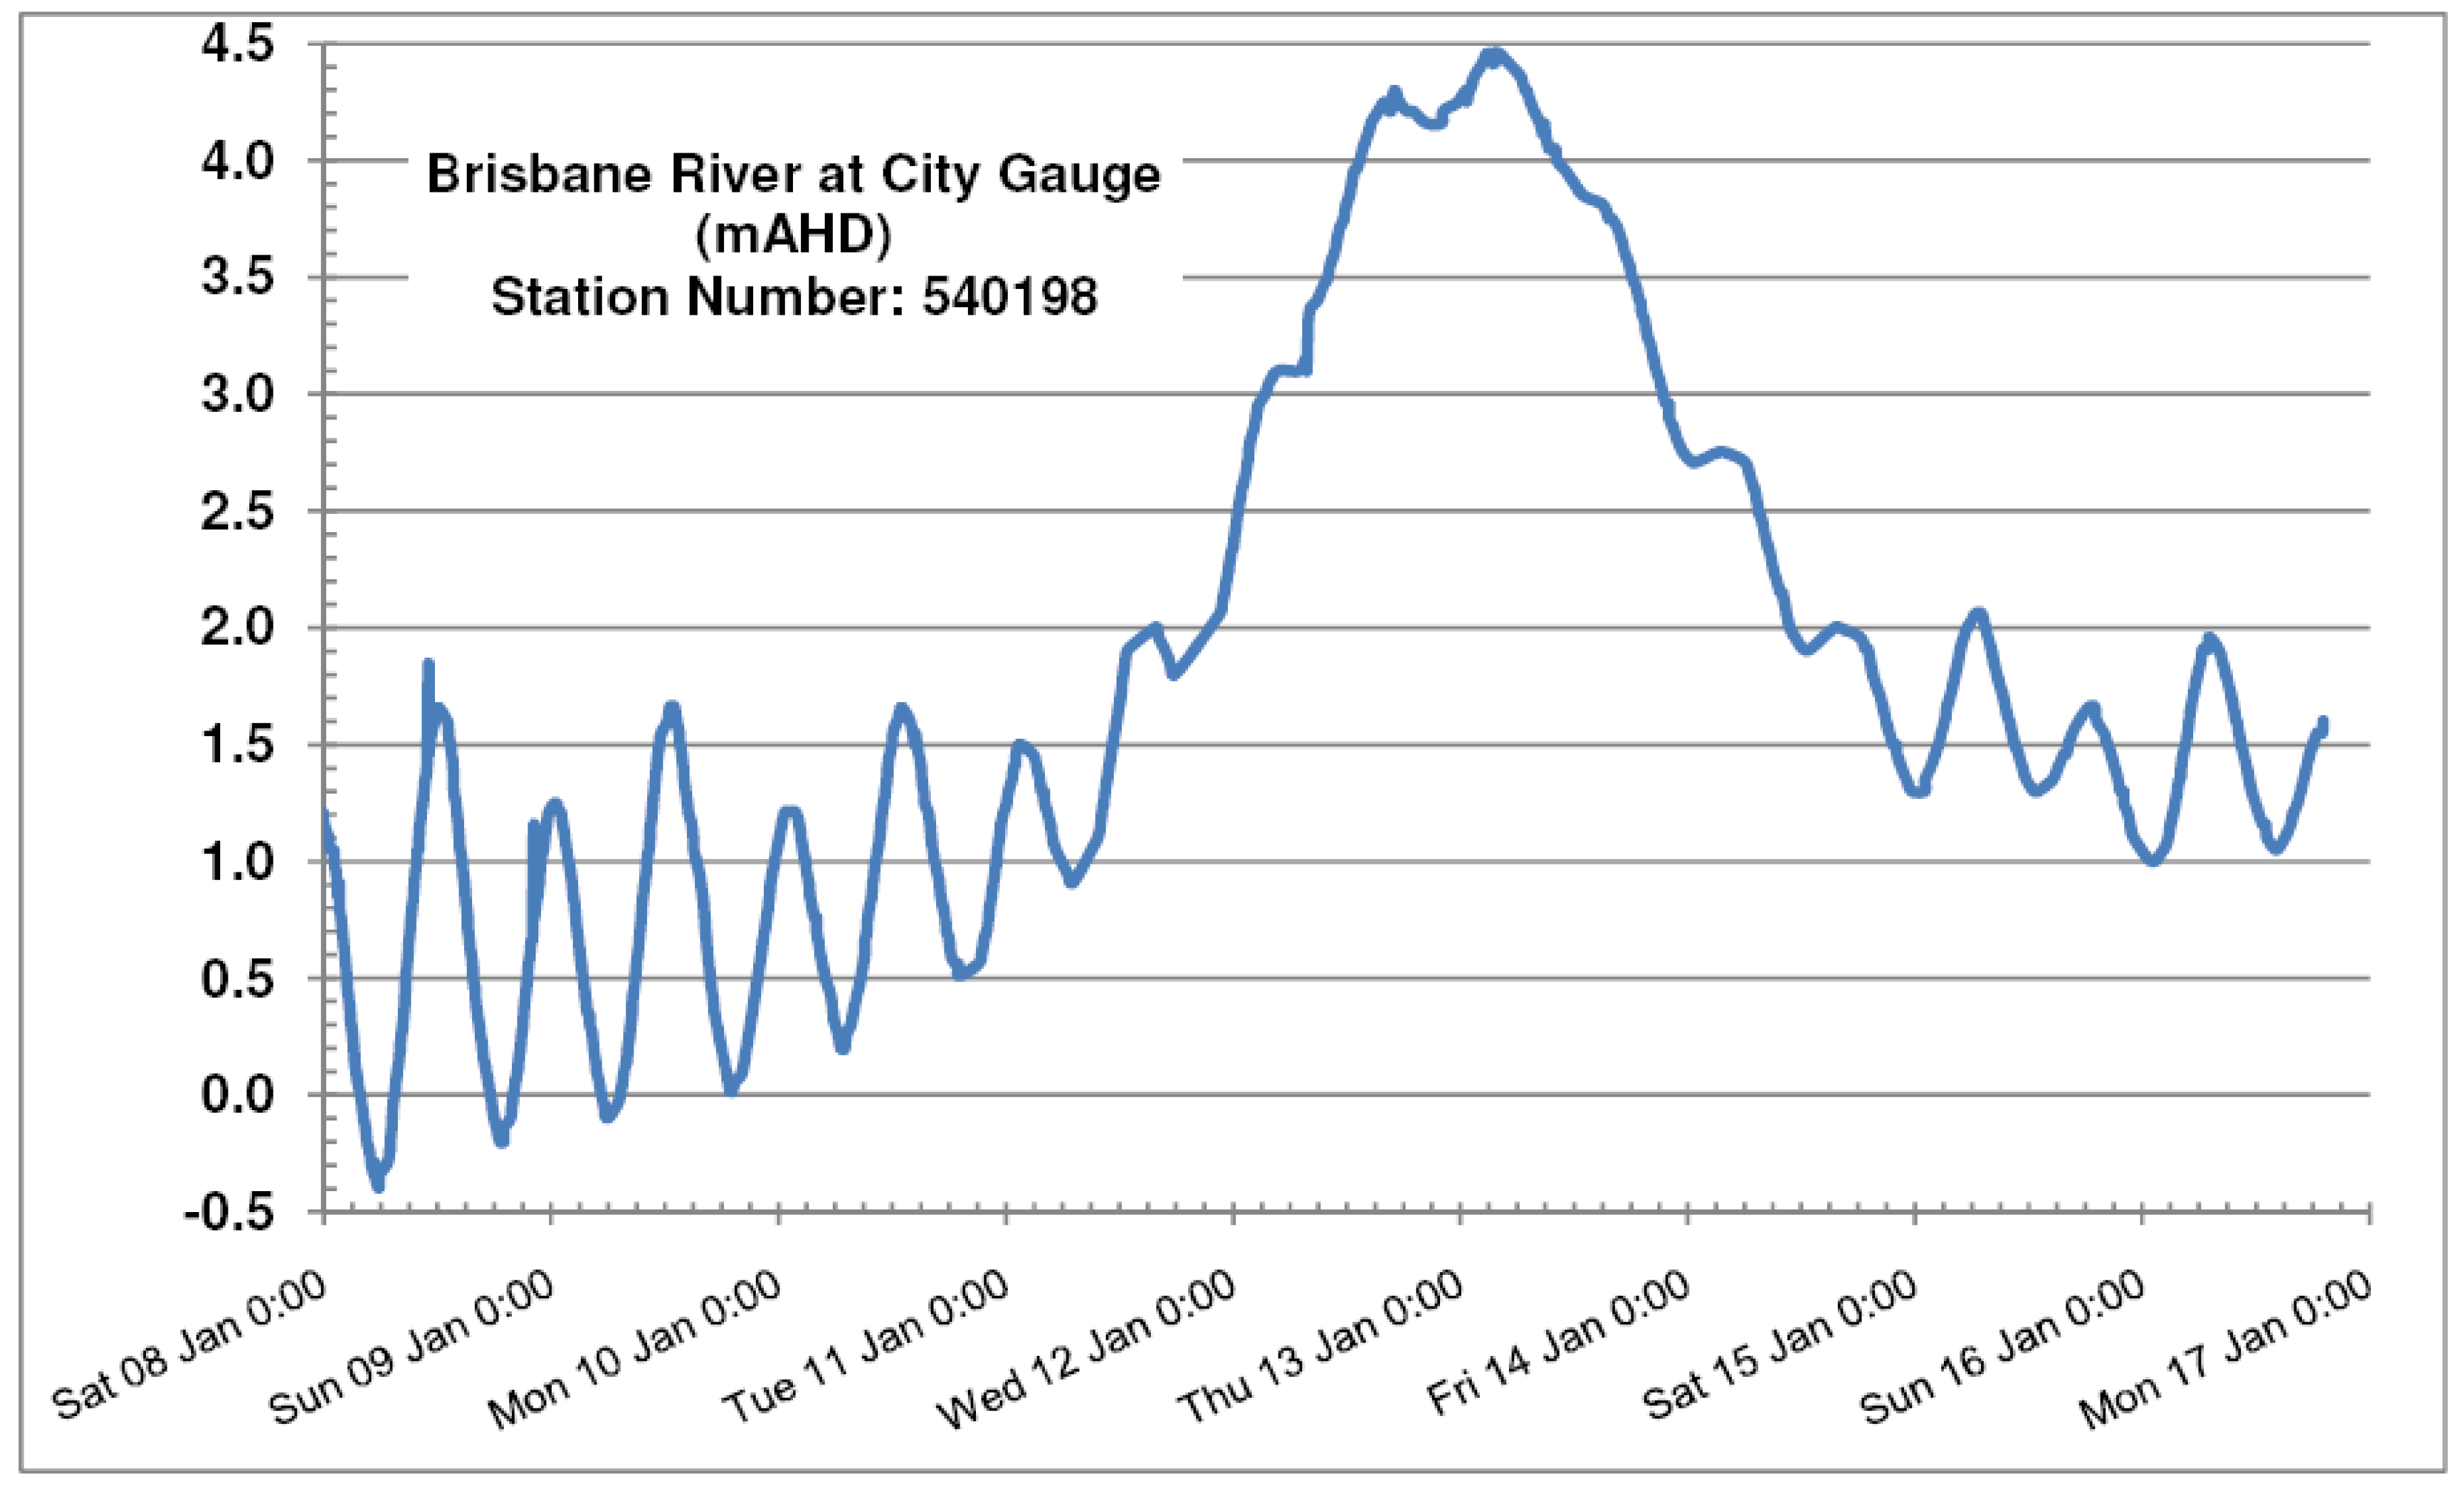
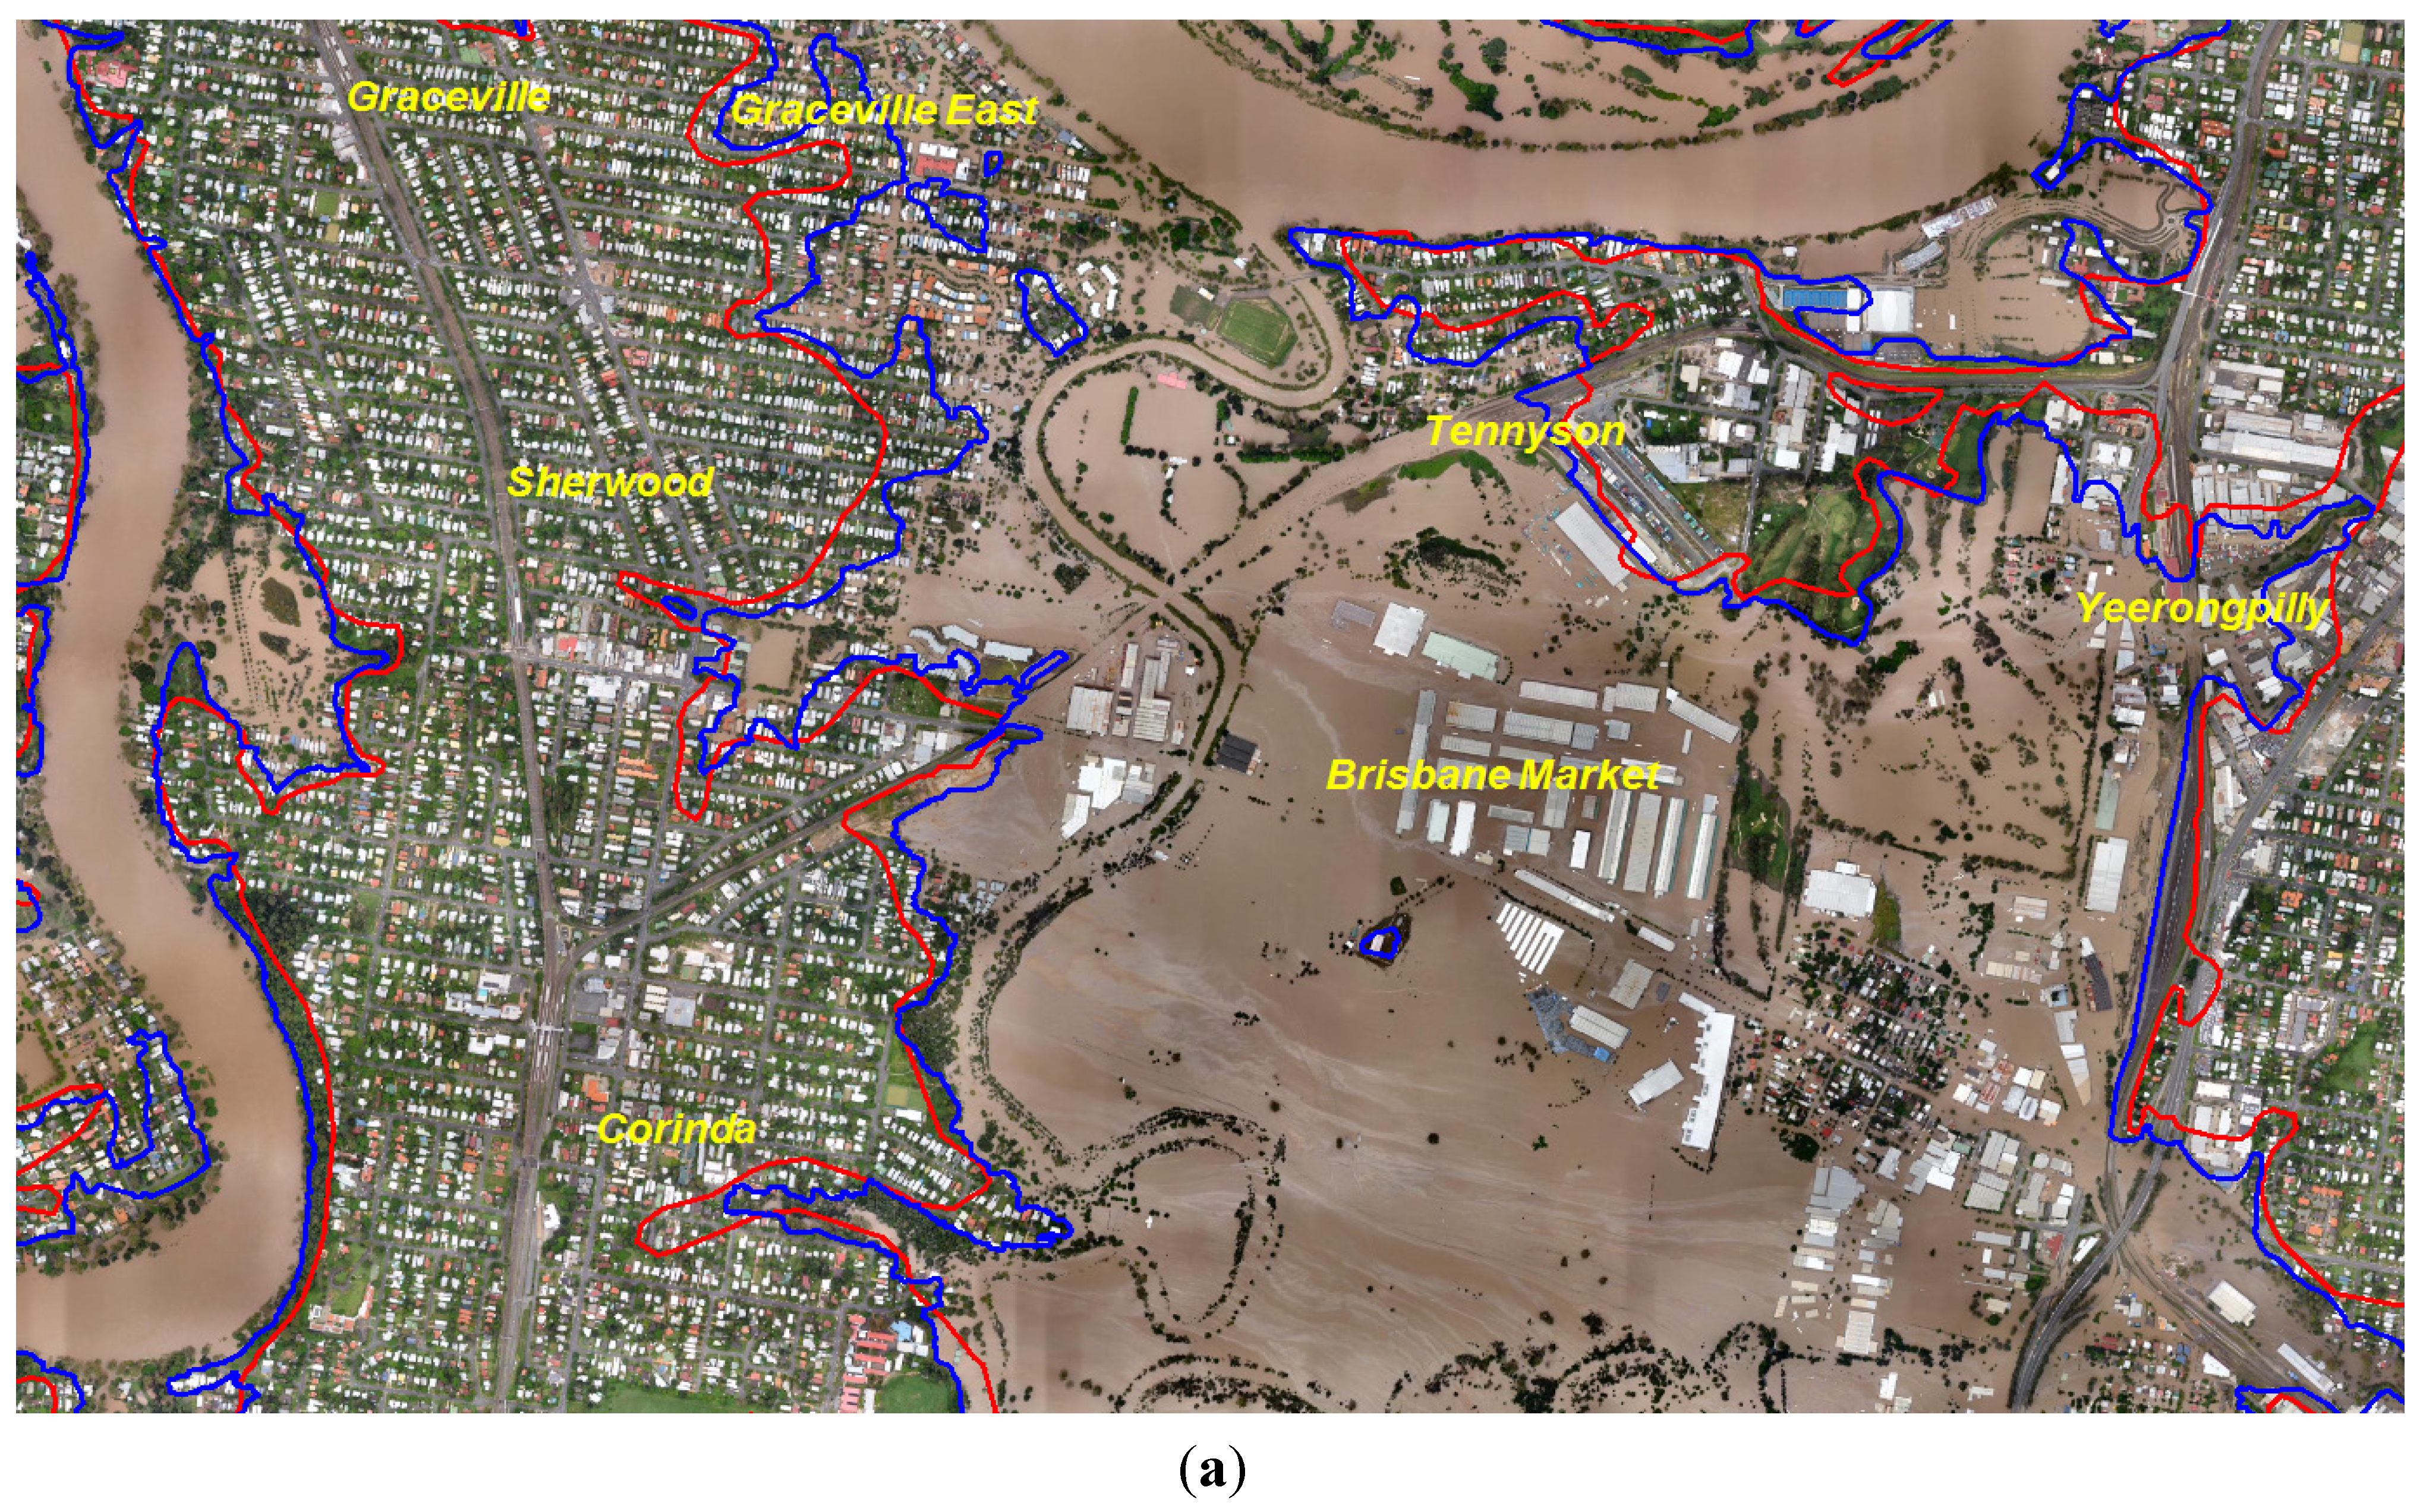
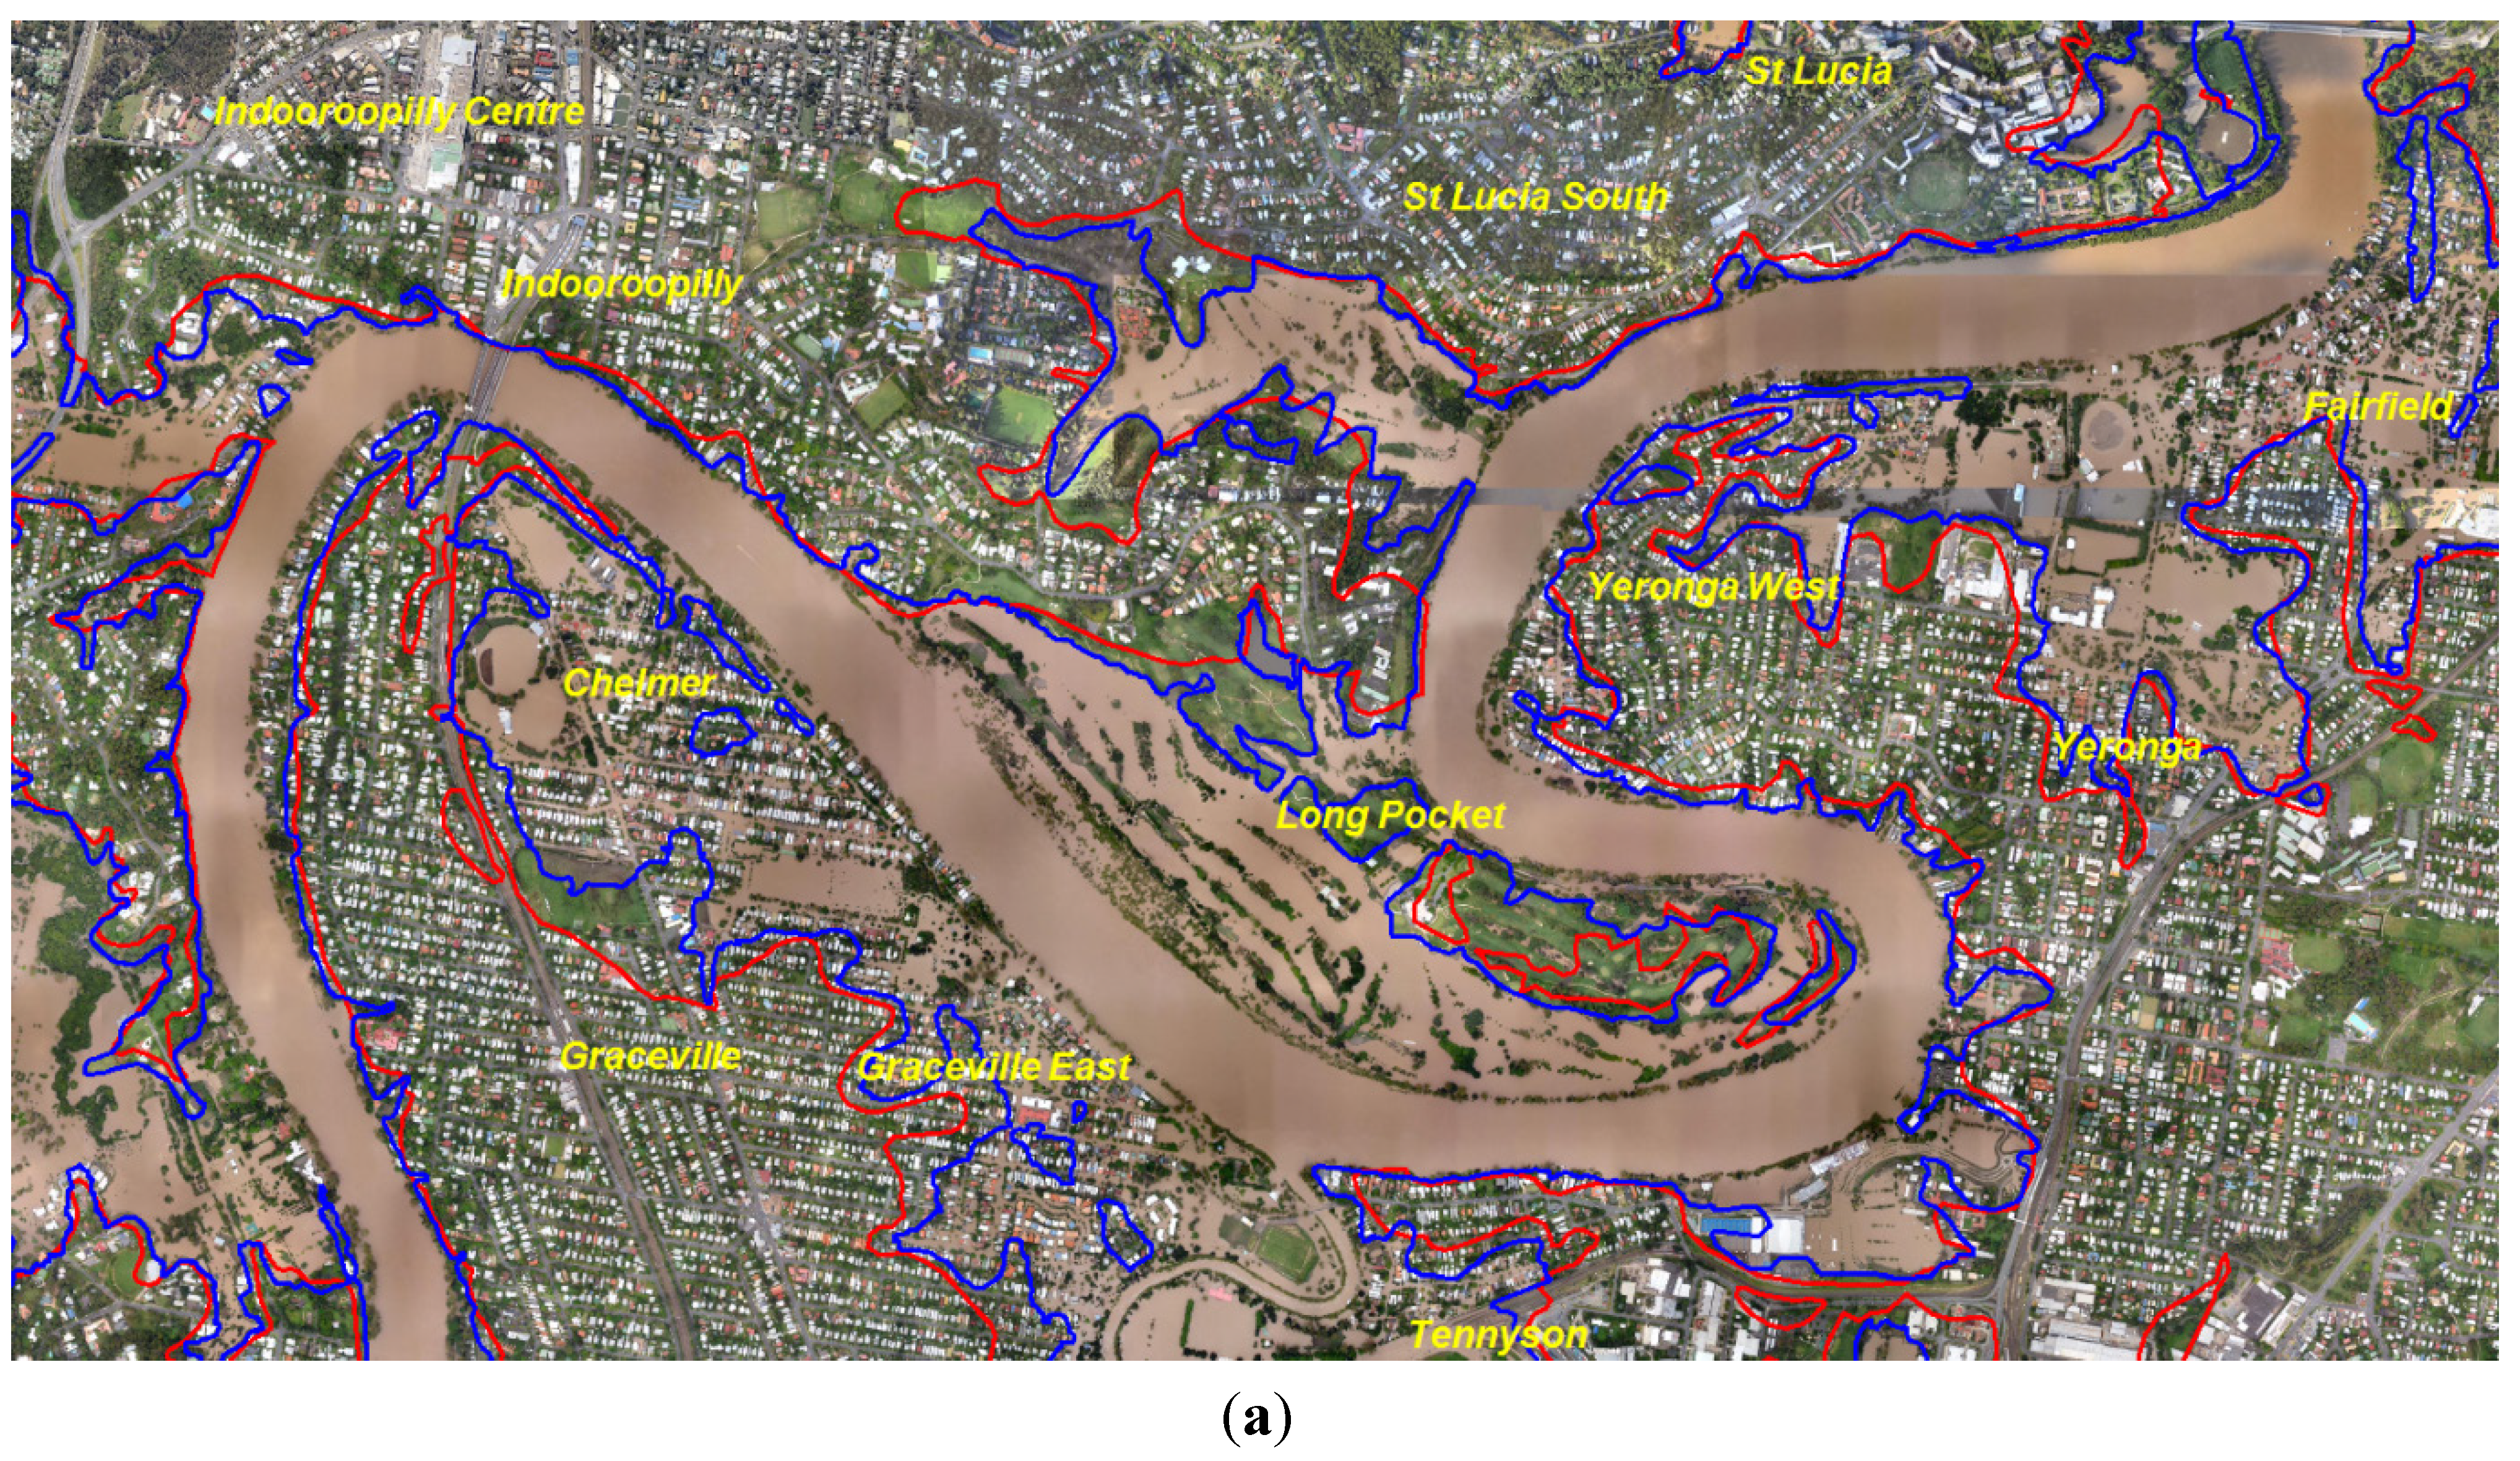
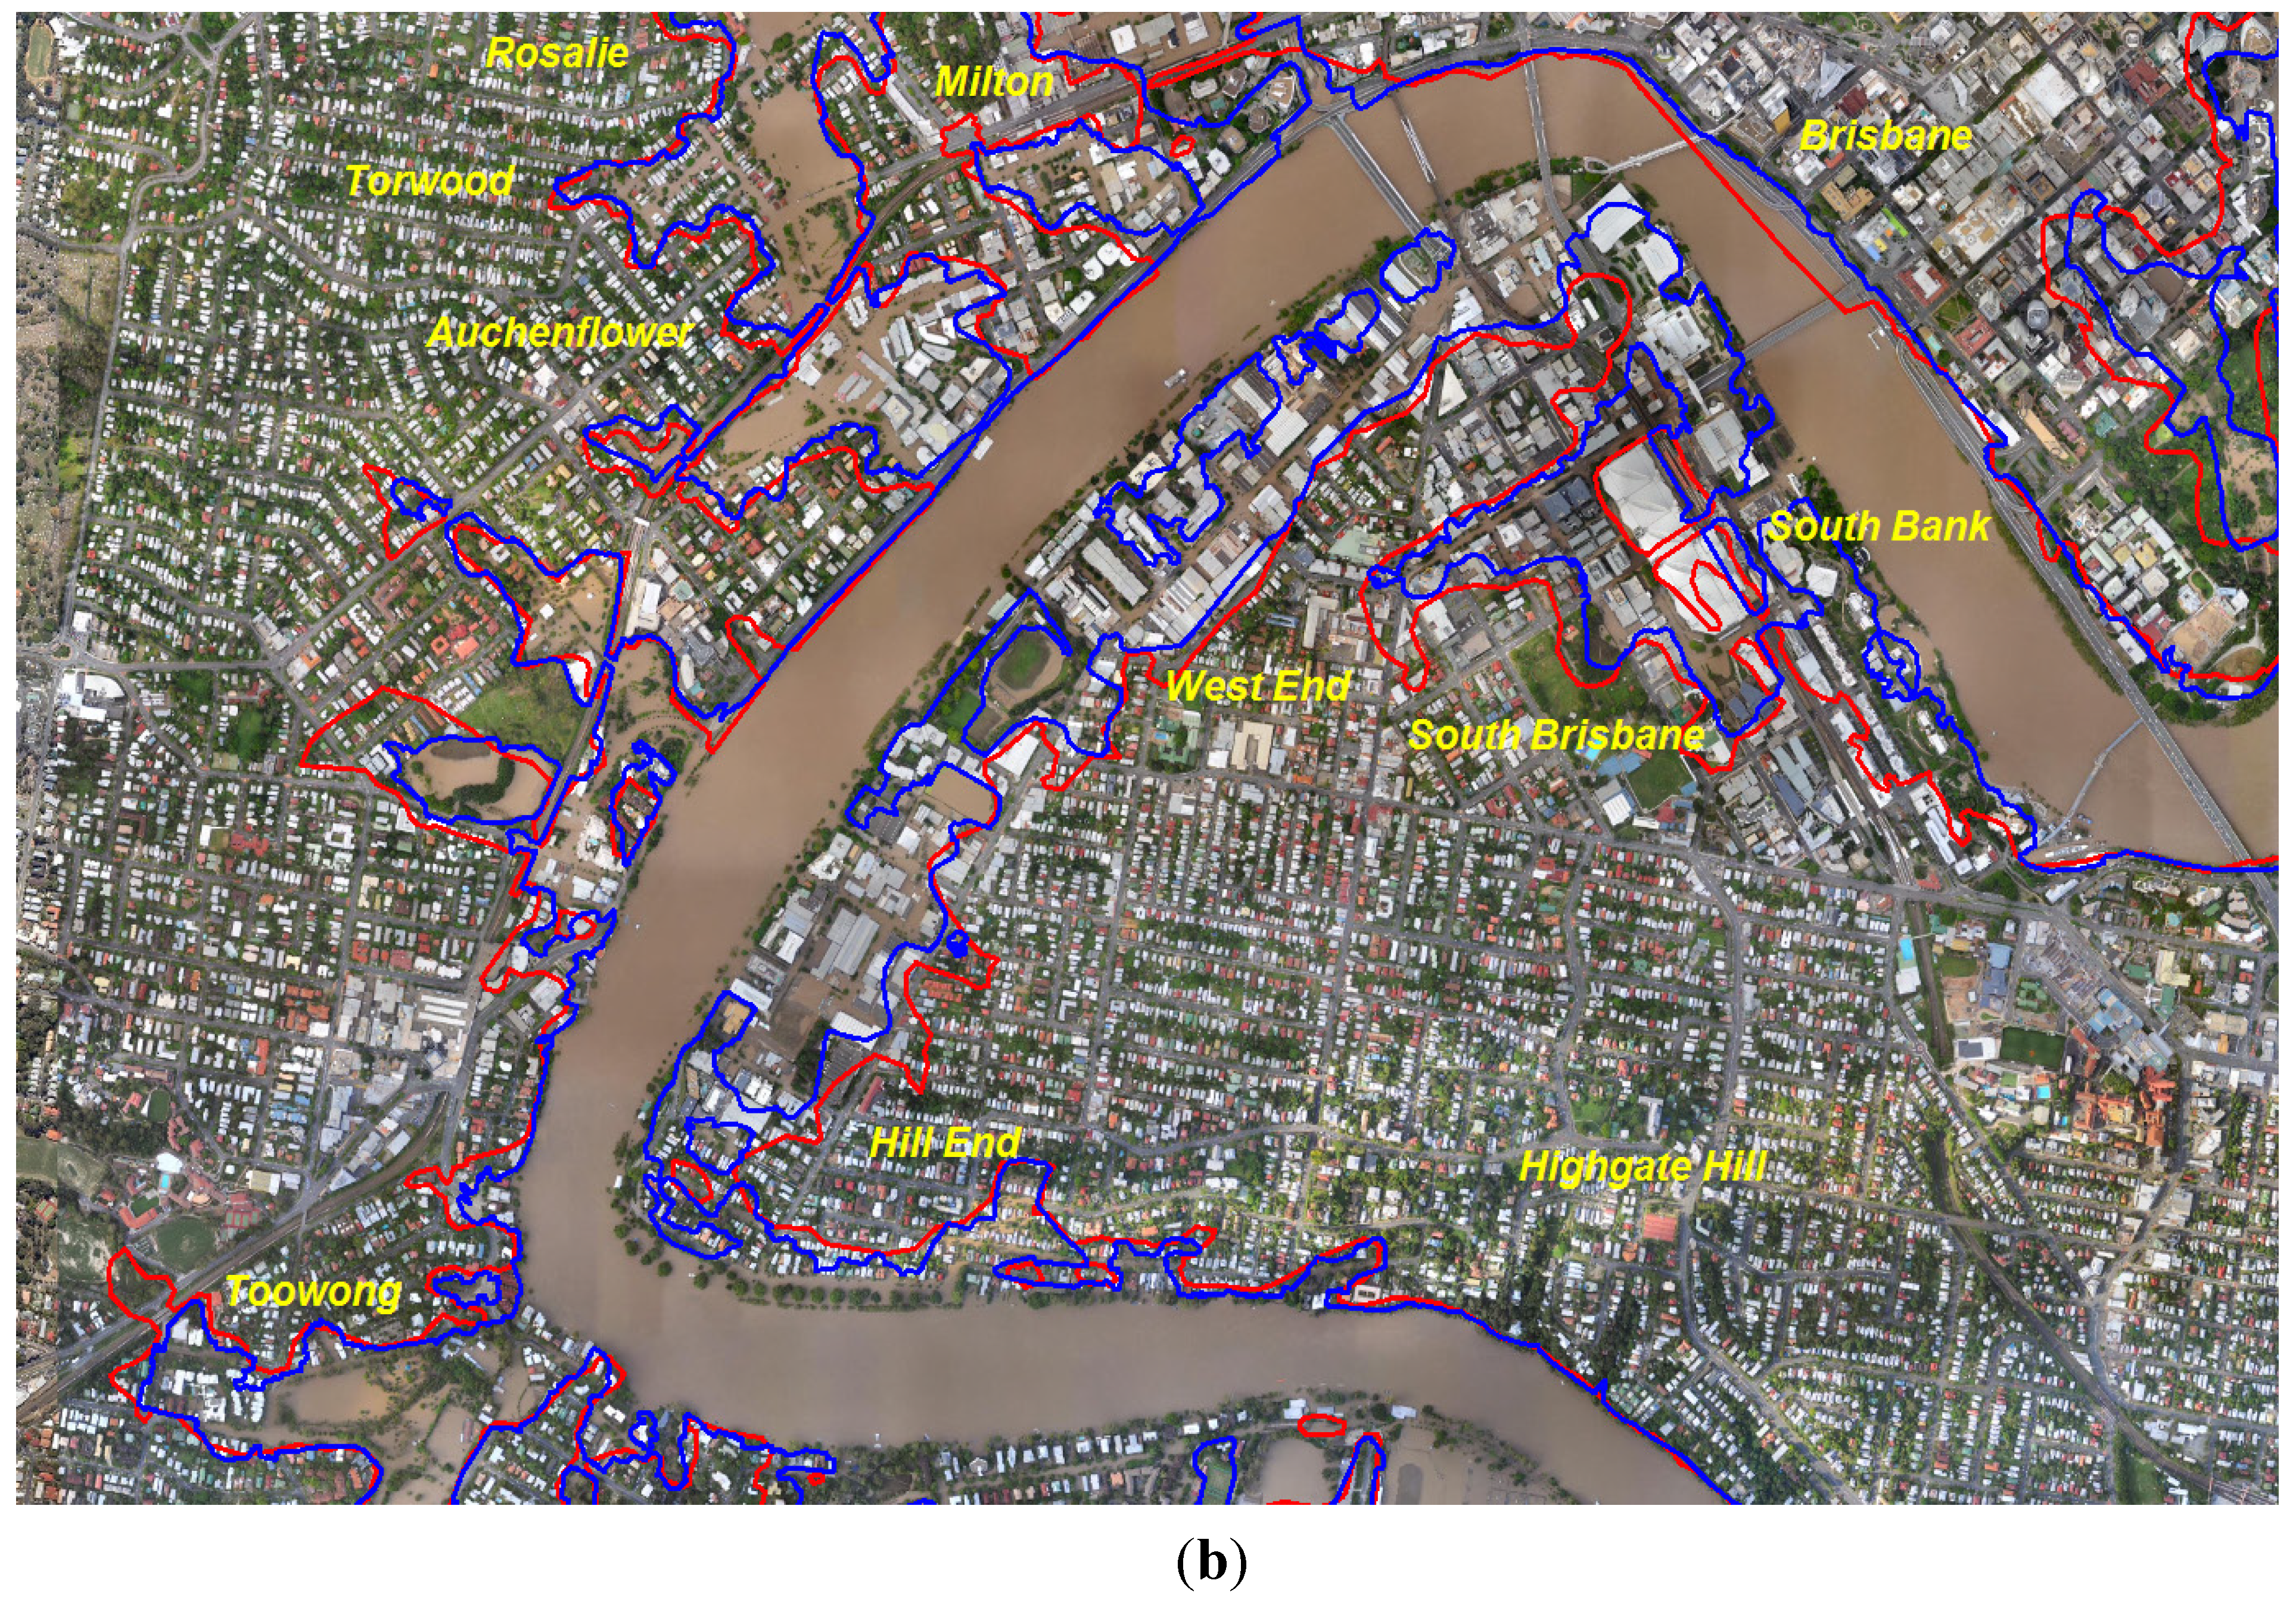
6. Impacts and Flooding

- 14:15 Wednesday 12th January
- 02:34 Thursday 13th January
- 14:54 Thursday 13th January


7. Implications
7.1. Queensland Floods Commission of Inquiry
- preparation and planning for the flooding by governments at all levels, emergency services and the community;
- supply of essential services during the floods;
- adequacy of forecasts and early warning systems, with particular reference to Toowoomba and the Lockyer Valley;
- compliance with, and the suitability of, dam operational procedures for safety and flood mitigation.
7.2. Insurance Issues and Implications for Land-Use Planning
- insurers, as a necessary input to enable them to assess and price flood risk;
- homeowners seeking to assess their personal flood risk; and
- councils as part of their planning and risk management.
8. Conclusions
References
- 2011a Submissions; Floods Commission of Inquiry: Brisbane, QLD, Australia, 2011. Available online: http://www.floodcommission.qld.gov.au/submissions (accessed on 6 September 2011).
- Flood Warning System for the Brisbane River below Wivenhoe Dam to Brisbane City; Bureau of Meteorology: Melbourne, Australia, 2011. Available online: http://www.bom.gov.au/hydro/flood/qld/brochures/brisbane_lower/brisbane_lower.shtml#PreviousFlooding (accessed on 31 March 2011).
- Joint Flood Taskforce. Joint Flood Taskforce Report March 2011; Report prepared for the Brisbane City Council: Brisbane, QLD, Australia, 2011. [Google Scholar]
- Known Floods in the Brisbane & Bremer River Basin, Including the Cities of Brisbane and Ipswich; Bureau of Meteorology: Melbourne, Australia, 2011. Available online: http://www.bom.gov.au/hydro/flood/qld/fld_history/brisbane_history.shtml (accessed on 1 April 2011).
- Brisbane Floods—January 1974; Bureau of Meteorology: Melbourne, Australia, 1974. Available online: http://www.bom.gov.au/hydro/flood/qld/fld_reports/brisbane_jan1974.pdf (accessed on 31 March 2011).
- Crompton, R.P.; McAneney, K.J. Normalised Australian insured losses from meteorological hazards: 1967–2006. Environ. Sci. Policy 2008, 11, 371–378. [Google Scholar] [CrossRef]
- Crompton, R.P.; Risk Frontiers, Macquarie University, NSW, Australia. Personal communication, 2011.
- EMA Disasters Database; Australian Emergency Management Australia: Canberra, Australia, 2011. Available online: http://www.disasters.ema.gov.au/Browse/Search.aspx (accessed on 1 April 2011).
- Frequent Heavy Rain Events in Late 2010/Early 2011 Lead to Widespread Flooding Across Eastern Australia; Special Climate Statement 24; National Climate Centre, Bureau of Meteorology: Melbourne, Australia, 2011.
- SOI (Southern Oscillation Index) Archives—1876 to present; Bureau of Meteorology: Melbourne, Australia, 2011. Available online: http://www.bom.gov.au/climate/current/soihtm1.shtml (accessed on 31 March 2011).
- Archive—Daily rainfall totals for Australia; Bureau of Meteorology: Melbourne, Australia, 2011. Available online: http://www.bom.gov.au/jsp/awap/rain/archive.jsp (accessed on 31 March 2011).
- Interim Report, 1 August 2011; Queensland Floods Commission of Inquiry: Brisbane, Australia, 2011. Available online: http://www.floodcommission.qld.gov.au/publications/interim-report (accessed on 23 August 2011).
- Insurance Council of Australia. Flooding in the Brisbane River Catchment, January 2011; ICA Hydrology Panel: Sydney, Australia, 20 February 2011. [Google Scholar]
- Manual of Operational Procedures for Flood Mitigation at Wivenhoe Dam and Somerset Dam; Revision 7, November 2009. Seqwater: Brisbane, QLD, Australia, 2009. Available online: http://resources.news.com.au/files/2011/01/20/1225992/005512-110121-dam-manual.pdf (accessed on 3 May 2011).
- Seqwater. January 2011 Flood Event: Report on the Operation of Somerset Dam and Wivenhoe Dam; Seqwater: Brisbane, QLD, Australia, 2 March 2011. [Google Scholar]
- The January 2011 Flood Event; Seqwater: Brisbane, QLD, Australia, 2011. Available online: http://www.seqwater.com.au/public/sites/default/files/userfiles/Factsheet-January_2011_FloodEvent.pdf (accessed on 3 May 2011).
- Transcript of Proceedings; Queensland Floods Commission of Inquiry: Brisbane, QLD, Australia, 11 April 2011; pp. 77–96. Available online: http://www.floodcommission.qld.gov.au/__data/assets/pdf_file/0018/3762/2011-04-11-QFCI-Day-2-Brisbane.pdf (accessed on 3 May 2011).
- Ayre, R. Feasibility of Making Pre-releases from SEQWC Reservoirs; Seqwater: Brisbane, QLD, Australia, 2001. [Google Scholar]
- Drought situation reports (Department of Employment, Economic Development and Innovation); Queensland Government: Brisbane, Australia, 2011. Available online: http://www.longpaddock.qld.gov.au/queenslanddroughtmonitor/queenslanddroughtreport/index.php (accessed on 6 September 2011).
- Raiffa, H. Decision Analysis: Introductory Readings on Choices under Uncertainty; McGraw Hill: New York, NY, USA, 1997. [Google Scholar]
- Krige, D.G. A Statistical Approach to Some Mine Valuations and Allied Problems at the Witwatersrand. Master Thesis, University of Witwatersrand, Johannesburg, South Africa, 1951. [Google Scholar]
- Matheron, G. Principles of geostatistics. Econ. Geol. 1963, 58, 1246–1266. [Google Scholar] [CrossRef]
- Clemen, R.T. Making Hard Decisions: An Introduction to Decision Analysis; PWS-KENT: Boston, MA, USA, 1997. [Google Scholar]
- Coates, L.; Haynes, K.; Gissing, A.; Radford, D. The Australian experience and the Queensland Floods of 2010–2011. In The Handbook of Drowning: Prevention, Rescue, Treatment, 2nd ed.; Bierens, J.J.L.M., Ed.; Springer-Verlag Publishing: Berlin, Germany, 2012; Chapter 10–17, in press. [Google Scholar]
- O’Brien, M.J. Brisbane Flooding January 2011—An Avoidable Disaster; Queensland Floods Commission of Inquiry: Brisbane, Australia, 20 March 2011. [Google Scholar]
- Latest River Heights for Brisbane River at City Gauge; Station No 540198; Bureau of Meteorology: Melbourne, Australia, 2011. Available online: http://reg.bom.gov.au/fwo/IDQ65389/IDQ65389.540198.tbl.shtml (accessed on 1 November 2011).
- Historical and Current Disaster Statistics; Insurance Council of Australia: Sydney, Australia, 2011. Available online: http://www.insurancecouncil.com.au/Default.aspx?tabid=1572 (accessed on 23 August 2011).
- Flood Assistance; Lockyer Valley Regional Council: Gatton, Australia, 2011. Available online: http://www.lockyervalley.qld.gov.au/news-events/news/1270-lockyer-valley-road-closures-271210 (accessed on 9 September 2011).
- Chen, K. Risk Frontiers; NearMap Pty Ltd.: West Perth, Australia, 2011. Available online: http://www.nearmap.com (accessed on 1 November 2011).
- Queensland Government Response to the Floods Commission of Inquiry Interim Report; Queensland Government: Brisbane, Australia, 2011. Available online: http://www.premiers.qld.gov.au/publications/categories/reports/assets/response-to-flood-inquiry.pdf (accessed on 23 August 2011).
- Risk Frontiers. State-Wide Natural Hazard Risk Assessment; Report prepared for Queensland Department of Community Safety: Brisbane, QLD, Australia, 2011. [Google Scholar]
- Insurance in Australia; Australian Trade Commission: Canberra, Australia, 2009.
- Natural Disaster Insurance Review. quiry into Flood Insurance and Related Matters; Commonwealth of Australia: Canberra, Australia, 2011. Available online: http://www.ndir.gov.au/content/issuespapers/NDIRIssuesPaper.pdf (accessed on 23 August 2011).
- Johnston, E.; Needham, K.; Tovey, J. Insurers Say no to Brisbane; Brisbane Times: Brisbane, Australia, 21 January 2011. Available online: http://www.brisbanetimes.com.au/environment/weather/insurers-say-no-to-brisbane-20110120-19y3m.html (accessed on 23 August 2011).
- Williams, R. Victims Discover Insurance doesn’t always Cover Flooding; Sydney Morning Herald: Sydney, Australia, 16 January 2011. Available online: http://www.smh.com.au/small-business/managing/victims-discover-insurance-doesnt-always-cover-flooding-20110117-19t31.html (accessed on 20 September 2011).
- Insurance Council of Australia Response to the Natural Disaster Insurance Review; Insurance Council of Australia: Sydney, Australia, July 2011. Available online: http://www.ndir.gov.au/content/submissions/issues_paper_submissions/Insurance_Council_of_Australia.pdf (accessed on 12 October 2011).
- Burby, R.J. Hurricane Katrina and the paradoxes of government disaster policy: Bringing about wise government decisions for hazardous areas. Ann. Am. Acad. Polit. Soc. Sci. 2006, 604, 171–191. [Google Scholar] [CrossRef]
- Roche, K.M.; McAneney, K.J.; van den Honert, R.C. Policy options for managing flood insurance. Environ. Hazards 2010, 9, 369–378. [Google Scholar] [CrossRef]
- Crompton, R.P.; McAneney, K.J. Normalised Australian insured losses from meteorological hazards: 1967–2006. Environ. Sci. Policy 2008, 11, 371–378. [Google Scholar] [CrossRef]
- Victorian State Government. Bushfire Appeal Funds to Help Rebuild and Recover; Premier of Victoria: Melbourne, Australia, 2009. Available online: http://www.premier.vic.gov.au/component/content/article/6508.html (accessed on 6 September 2011).
- Crompton, R.P.; McAneney, K.J.; Chen, K.; Pielke, R.A., Jr.; Haynes, K.A. Influence of location, population and climate on building damage and fatalities due to Australian bushfire: 1925–2009. Weather Clim. Soc. 2010, 2, 300–310. [Google Scholar] [CrossRef]
- Chen, K.; McAneney, K.J. Quantifying bushfire penetration into urban areas in Australia. Geophys. Res. Lett 2004, 31, L12212. [Google Scholar] [CrossRef]
- Australian-First Deal to Relocate Grantham Residents; Lockyer Valley Regional Council: Gatton, Australia, 2011. Available online: http://www.lockyervalley.qld.gov.au/news-events/news/1318-australian-first-deal-to-relocate-grantham-residents (accessed on 9 September 2011).
- ‘Defined Flood Level’ revised; Mullins Lawyers: Brisbane, Australia, 2011; Available online: http://www.mullinslaw.com.au/FeaturedItem.aspx?EntityId=106754 (accessed on 9 September 2011).
- Box, P.; Thomalla, F.; van den Honert, R.C.; McAneney, K.J. How can residents know their flood risk? A review of online flood information availability in Australia. Aust Planner 2012. in submit. [Google Scholar]
- Hawkesbury-Nepean Floodplain Management Committee. Achieving a Hawkesbury-Nepean Flood plain Management Strategy; Report prepared for the Hawkesbury-Nepean Flood Management Advisory Committee: Sydney, Australia, 1997. [Google Scholar]
- Chen, K.; Risk Frontiers, Macquarie University, NSW, Australia. Personal communication, 2011.
- Wilson, L. State Goes it Alone in Shunning Insurance; The Australian: Sydney, Australia, 3 February 2011. Available online: http://www.theaustralian.com.au/in-depth/cyclone-yasi/state-goes-it-alone-in-shunning-insurance/story-fn7rj0ye-1225999067129 (accessed on 25 August 2011).
- Flood Levy; Australian Government Treasury: Canberra, Australia, 2011. Available online: http://www.treasury.gov.au/contentitem.asp?NavId=022&ContentID=1949 (accessed on 25 August 2011).
© 2011 by the authors; licensee MDPI, Basel, Switzerland. This article is an open access article distributed under the terms and conditions of the Creative Commons Attribution license (http://creativecommons.org/licenses/by/3.0/).
Share and Cite
Van den Honert, R.C.; McAneney, J. The 2011 Brisbane Floods: Causes, Impacts and Implications. Water 2011, 3, 1149-1173. https://doi.org/10.3390/w3041149
Van den Honert RC, McAneney J. The 2011 Brisbane Floods: Causes, Impacts and Implications. Water. 2011; 3(4):1149-1173. https://doi.org/10.3390/w3041149
Chicago/Turabian StyleVan den Honert, Robin C., and John McAneney. 2011. "The 2011 Brisbane Floods: Causes, Impacts and Implications" Water 3, no. 4: 1149-1173. https://doi.org/10.3390/w3041149
APA StyleVan den Honert, R. C., & McAneney, J. (2011). The 2011 Brisbane Floods: Causes, Impacts and Implications. Water, 3(4), 1149-1173. https://doi.org/10.3390/w3041149