Abstract
Heavy metals released from industrial effluents accumulate in the human body through the ecosystem, causing several health disorders. This study investigated the removal of cadmium (Cd2+) using Micellar-Enhanced Ultrafiltration (MEUF). This study employed sodium dodecyl sulfate (SDS) and flat-sheet polyethersulfone (PES) ultrafiltration membranes to separate Cd2+ ions from lab-simulated water. The experiments involved examining the removal efficiency of membranes without SDS usage, optimizing SDS concentration for Cd2+ removal, and evaluating the long-term membrane performance. Other parameters include analyzing the removal percentage of varying Cd2+ at constant SDS dosage, examining the effect of pH, and electrolyte concentrations on the removal of Cd2+. Several analytical characterizations were performed, such as FT-IR, and SEM. The FTIR confirms the aromatic C-H group at 620–867 cm−1, the sulfone group at 1100–1200 cm−1, and the ether group at 1230–1270 cm−1 and the SEM analysis indicates no significant fouling, which aligns with the stable flux observed over time. The result showed that the optimum SDS concentration for Cd2+ removal was 1 Critical Micellar Concentration (CMC), achieving over 99% removal. The presence of an electrolyte decreased Cd2+ removal efficiency, while the pH (3 to 9) had no effect on removal. Our findings suggest that the SDS-aided ultrafiltration process is suitable for eliminating Cd2+ from wastewater.
1. Introduction
Rapid industrialization and urbanization are significant contributors to water pollution. Among the various contaminants contributing to water pollution, heavy metals represent a significant class of pollutants introduced into ecosystems primarily through anthropogenic activities [1]. Heavy metals have been used for centuries for various industrial and medical purposes. Effluent released from industrial processes such as operating thermal power plants, mining operations, and the recycling and disposal of waste significantly contaminates water sources with heavy metals [2]. The United Nations estimates that 80% of all urban and industrial wastewater in developing nations is discharged into the environment without treatment [3]. Chattopadhyay et al. [4] mentioned that fuel and power industries contribute around 2.4 million tons of chromium, cadmium, arsenic, mercury, lead, copper, zinc, nickel, vanadium, and selenium to the environment. Similarly, agricultural processes add 1.4 million tons of these metal ions yearly, the metal industry contributes 0.39 million tons annually, and 0.72 million tons are contributed by waste disposal. Heavy metals in wastewater have long drawn huge attention due to their toxicity, tendency to persist attributed to significantly long half-life, and capacity for bioaccumulation within the human body [5]. Growing concentrations of heavy metals in wastewater ultimately taint the food chain. Once entering the human body, heavy metals impact human health as they interfere with the function of DNA and damage organs such as the liver, kidneys, neurological system, and bones. In an ecosystem, heavy metals create a persistent chain of contamination that impacts the air, soil, water, plants, living organisms, and ultimately human beings [5].
Cadmium (Cd2+) is a very toxic and carcinogenic element, and is categorized as a non-essential heavy metal since it serves no purpose in physiological and biochemical roles in the metabolic processes of animals and plants After the discovery of Cd in 1817 in Germany, the first use of Cd was for pigment due to its ability to produce vibrant red, orange, and yellow colors. Cd2+ is released into the environment from industrial activities involving electroplating, pigmentation, the cadmium-nickel battery industry, textiles, refining industries, and alloy fabrication. Also, refined petroleum products, phosphate fertilizers, and Zn extraction significantly contribute to Cd2+ release into the environment and the ocean [6]. Studies have shown annual Cd2+ consumption to be around 20,000 to 24,000 tons [7]. Cd2+ enters the ocean through aerial loading, agricultural runoffs, mining runoffs, and riverine discharges. The United States Environmental Protection Agency (U.S.EPA) has classified Cd2+ under the Resource Conservation and Recovery Act (RCRA) 8 to manage this element from cradle to grave because of its toxicity and possible adverse effects on human health and the environment. The wastewater containing Cd2+ should meet certain regulatory standards before being discharged into any source. The RCRA has established a limit of 1 mg/L for Cd2+-containing wastewater to be discharged into water sources [8].
The primary route through which exposure occurs is through contaminated food or water, and inhalation of cigarette smoke. High levels of Cd2+ are reported in water sources around historical and existing Cd processing industries. People fishing in the local rivers near those industries can accumulate Cd2+ in their bodies by consuming such aquatic species. [9]. Data collected over three years were evaluated to monitor surface water quality over major river systems in Northern Greece using multivariate statistical techniques [10]. The study concluded that heavy metals such as Cd, Pb, and Zn were mixed into the surface water due to anthropogenic activities. In a study, the level of heavy metals in the surface sources of drinking water of Dakahlia Governorate, Egypt, was evaluated [11]. Heavy metals Pb and Cd concentrations were above the acceptable limits of the WHO guidelines. The study suggested that the sources of heavy metal contamination were the region’s steel, plastics, and battery industries. Gowd et al. 2008, evaluated the contamination of surface water bodies from the industrial effluent in the Ranipet industrial area, India [12].
Cd2+ is resistant to biochemical degradation, such as oxidation, reduction, or alkylation, which usually breaks down other nutrients. Since Cd2+ has a very long half-life of around 10–35 years, the body cannot remove it rapidly, causing accumulation. The kidneys and bones are the primary targets of the ingested Cd2+. Cd2+ affects the kidney by damaging the renal tubular and glomerular structures, and impacts bones by reducing bone mineralization and increasing the risk of bone fractures [9]. In the early 20th century, a disease called Itai-Itai was discovered in Toyama Prefecture, Japan. The consumption of rice irrigated with Cd2+ contaminated water from Jinzu River caused this disease. Slag from the Kamioka mine, 30 km upstream, was the source of Cd2+ contamination. Older women suffering from “Itai-Itai” have shown symptoms such as osteomalacia, renal tubular dysfunction, and osteoporosis [13]. The harmful effects of Cd on various tissues and organs may be attributed to the formation of reactive oxygen species caused by oxidative stress. The generation of ROS causes carcinogenesis, immunotoxicity, and nephrotoxicity due to Cd exposure. The United States EPA classified Cd as a Class B1 carcinogen, whereas IARC categorized Cd as a Group 1 carcinogen. Cd is believed to cause lung cancer and has been proven by several studies. One of the earliest studies conducted in 1976 revealed that hourly workers exposed to Cd had a significantly higher mortality rate from lung malignant neoplasms. A follow-up evaluation through 1978 revealed that malignant neoplasms in the airways had high standardized mortality rates. Along with lung cancer, chronic exposure to Cd causes other respiratory problems, such as damage to the olfactory epithelium, which ultimately leads to anosmia, chronic rhinitis, and bronchitis [9]. Also, exposure to Cd2+ has several other harmful effects, such as pulmonary edema, coronary heart disease, strokes, hepatic impairment, and cancers of the breast, prostate, bladder, pancreas, and nasopharynx [6].
Numerous techniques, such as chemical precipitation [14], ion exchange [15], adsorption [16], and membrane technology [17] have been used to treat Cd2+ present in wastewater. However, these techniques have several major disadvantages, which reduce the overall process’s efficiency. The major drawbacks of these techniques are the production of excessive toxic sludge, secondary pollution, high cost, and the inability to totally separate pollutants due to the minute particle size [14]. Although these methods can remove some contaminants overall, they become highly expensive when treating large volumes of samples at low concentrations, and high cleaning standards must be met. These limitations are overcome by the micellar-enhanced ultrafiltration techniques using surfactants. When surfactants are used, larger macromolecular complexes are formed by binding with metal ions, which can be easily removed by ultrafiltration (UF) membranes. The use of UF membranes with appropriate pore sizes blocks the passage of macromolecular complexes formed, resulting in a permeate solution with a negligible amount of contamination. The large macromolecular species developed above the Critical Micellar Concentration (CMC) are called micelles [18]. MEUF has been used to separate various heavy metals such as Cd, Co, Pb, Zn, Ni, Cu, Cr, etc. Xu et al. 2007, used surfactant SDS to separate Cd2+ from lab-made wastewater using a hollow fiber UF membrane made up of polysulfone [19]. The removal efficiency achieved through this experiment was 99%. Similarly, in 2019, Huang et al. evaluated the removal of the same metal ion (Cd2+) in the presence of surfactant SDS using polyether sulfone (PES) UF membranes of MWCO 5 kDa, 10 kDa, and 30 kDa [20]. At a concentration of 4 mmol L−1 of SDS (0.5 CMC), 90% of 50 mg L−1 Cd2+ ions were retained in the membrane. They also studied the rejection mechanisms of Cd2+. The accumulation of monomeric SDS formed a hemimicelle layer on the membrane surface at a concentration of 4 mmol L−1 (0.5 CMC). The continuous accumulation caused pore blocking and cake layer formation, which facilitated Cd2+ retention at low SDS concentrations.
Many researchers investigated the efficiency of the MEUF system for the simultaneous removal of multiple metal ions. An investigation was performed employing the MEUF technique using sodium dodecyl sulfate (SDS) surfactant to simultaneously remove Cd2+ and Zn2+ metal ions from wastewater using a polysulfone hollow UF membrane [21]. The result demonstrated that the concentrations of Cd2+ and Zn2+, initially 50 mg L−1, were reduced to 1–4 mg/L after running through the UF system at a SDS concentration of 2.15 g L−1. The adsorption mechanism was studied, where these metals were adsorbed following second-order kinetics and the Langmuir isotherm laws. Second-order kinetics governed the adsorption process for Cd2+/Zn2+ and SDS micelles. After roughly 30 min, equilibrium was reached, and Cd2+/Zn2+ had 600 min with no noticeable desorption. Likewise, Aguirre et al., 2011, published in Separation and Purification Technology reported the simultaneous removal of heavy metals Zn2+ and Cd2+ using SDS [18]. The study established the relationship that surfactant and heavy metal concentrations in the feed affect the removal efficiency. The result showed that the optimum ratio of surfactant/metal ions was 27.8 for Zn2+ to achieve a removal of 98.0% and 28.4 for Cd2+ to achieve a reduction of 99.0%. Also, in another investigation, more than 99% removal of nickel and cobalt metal ions was achieved using cross-flow MEUF from the aqueous solution utilizing 20 kDa polysulfone membranes [22].
In this study, we employed micellar-enhanced ultrafiltration techniques to remove the heavy metal Cd2+ from wastewater and investigated the effects of solution pH, changes in metal ion concentration in the feed solution, and the influence of salt on Cd2+ removal. This is among the first systematic demonstrations of Cd2+ removal using MEUF with a 30 kDa PES membrane over extended operation. The study provides a 40 h continuous performance evaluation, rarely reported in prior MEUF literature. New mechanistic insights are presented on removal behavior below CMC and at elevated feed concentrations.
2. Materials and Methods
2.1. Materials
Cadmium solution was prepared using chemical cadmium nitrate tetrahydrate (Cd(NO3)2·4H2O) of 99% purity purchased from Arcos Organics (Geel, Belgium). The surfactant sodium dodecyl sulfate (SDS) (CH3(CH2)11OSO3−Na+) of 99% purity was distributed by Fisher Bioreagents (Waltham, MA, USA). All the solutions used in the experiment were prepared using deionized water. The flat-sheet ultrafiltration membrane, made of Polyether Sulfone (PES), was used as the filtration membrane and was purchased from Sterlitech Corporation, located in Auburn, WA, USA. This was a pre-cut, flat-sheet membrane with an area of 0.004209 m2 (Table 1).

Table 1.
Properties of the membrane.
2.2. Experimental
The experiment was performed in the CF042D Sterlitech membrane system. The transmembrane pressure of 413.68 kPa was maintained for the UF membrane. The feed solution was pumped to the membrane at a flow rate of 1.6 GPM. A fresh UF membrane was dipped in deionized (DI) water for 5 min to get rid of the protective chemical deposited on the membrane’s surface. After the cleaning, the membrane was kept in the membrane cell. Before using the feed solution for the experiment, DI water was filtered through the new membrane at a transmembrane pressure of 413.46 kPa. The DI water helped to stabilize the membrane’s pure water flux. The wastewater was simulated by mixing a calculated amount of Cd2+ with SDS into DI water. The feed solution, which contained metal ions/surfactant-metal ions, was kept in the feed tank, and each experiment was conducted until 0.6 L of the feed solution remained in the tank. The permeate was collected in a vessel kept above the weighing balance, and the weight per minute was recorded, whereas the retentate solution was circulated back to the feed tank. A computer recorded stable 4 h of data on the mass of the permeate solution. Usually, the permeate flux took half an hour to stabilize. All experiments were conducted at a temperature of approximately 25 °C.
After each experiment, the membrane was cleaned with deionized water for 30 min. This procedure was followed by 0.1 mol/L NaOH for 30 min, and then repeated with deionized water for an additional 30 min. The deionized water was filtered again to find the permeate flux and assess the membrane’s permeability. All experiments were performed in duplicates.
2.3. Sample Analysis
The remaining Cd2+ concentrations were measured by using Agilent 3510 Atomic Absorption Spectrometry (AAS) (Agilent Technologies, Santa Clara, CA, USA).
The Cd2+ removal efficiency was calculated using Equation (1):
where Cp is the concentration of Cd2+ in the permeate (mg L−1);
Cf is the concentration of Cd2+ in the feed solution (mg L−1).
The volume of fluid that passes through the membrane area at a specific time interval is known as the permeate flux, and it is computed using Equation (2):
where J is the permeate flux (L m−2 h−1);
V is the permeate volume (L);
t is the processing time (h);
A is the membrane’s operational surface area (m2).
2.4. Characterization
Fourier-Transform Infrared Spectroscopy (FTIR) spectra for the raw and after UF membranes were generated using a Nicolet FTIR Spectrometer purchased from Thermo Electron North America LLC., Madison, WI, USA. Membranes were dried at room temperature and analyzed for the change in the functional group of the membrane surface. Scanning electron microscopy (SEM) combined with Energy-Dispersive X-ray Spectroscopy (EDS) was performed using the JSM-6010LA, JEOL, Tokyo, Japan to evaluate the surface morphology.
3. Results
3.1. Characterization
The FTIR spectra of raw UF membranes and membranes used for Cd2+ removal (4 h and 40 h) are shown in Figure 1. The functional groups found in raw membranes and membranes used for 4 and 40 h exhibited no major differences. The FTIR spectra showed O–H stretching at 3350 cm−1 and the characteristic PES peaks corresponding to aromatic C–H (620–867 cm−1), sulfone (1100–1200 cm−1), and ether groups (1230–1270 cm−1). Because FTIR primarily detects bulk chemical functionality and has limited sensitivity toward thin surface deposits, the similarity of the spectra indicates that no significant chemical modification of the membrane occurred during operation. Minor or localized fouling layers, if present, would not substantially shift the dominant PES absorption bands; thus, FTIR results should be interpreted as evidence of the absence of major chemical fouling rather than confirmation of a completely clean membrane surface.
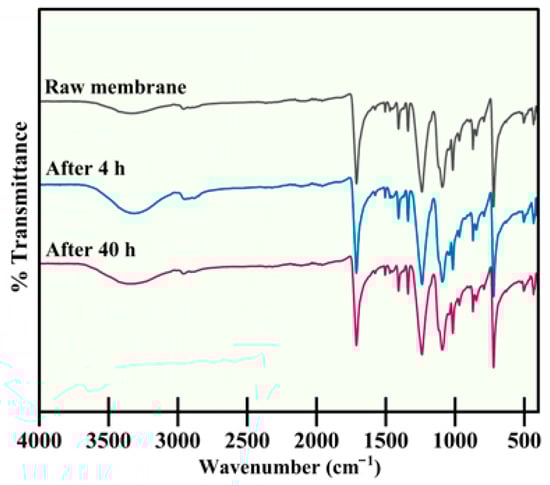
Figure 1.
FTIR spectra of raw UF membrane, after 4 h usage, and after 40 h usage for Cd2+ removal.
SEM images and corresponding EDS spectra (Figure 2) show the surface morphology for raw membranes, membranes exposed to Cd2+ for 4 h, and those used for 40 h. The raw membrane displayed a smooth surface free of visible pore blockage. After 4 h of use, light, scattered deposition was observed, while after 40 h, thin, discontinuous deposits were visible (Figure 2e). EDS analysis showed that the elemental composition (C, O, S) of the PES membrane remained nearly unchanged after 4 h and 40 h of operation. EDS, being semi-quantitative, cannot definitively rule out thin or patchy deposits; however, the negligible variation in elemental composition suggests that fouling was minimal and did not result in substantial surface accumulation of Cd-containing species. These surface observations are consistent with the flux results (Figures 5a and 7a), which showed no flux decline, providing stronger evidence of low fouling than microscopic or spectroscopic analysis alone.
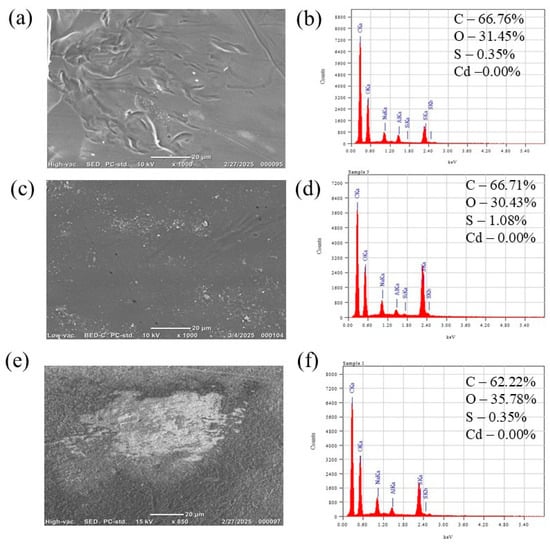
Figure 2.
The SEM images and its corresponding EDS graphs showing the topography of (a,b) raw UF membrane, (c,d) after 4 h usage and (e,f) after 40 h usage for Cd2+ removal.
Figure 3 shows a thin black layer on the membrane after 40 h of operation. Although the layer was visible, it was extremely thin, loosely associated, and did not impact the permeate flux. Quantitative flux recovery measurements confirmed that >95% of the pure water flux was restored following the standard cleaning protocol, supporting the conclusion that fouling was minor and easily reversible.
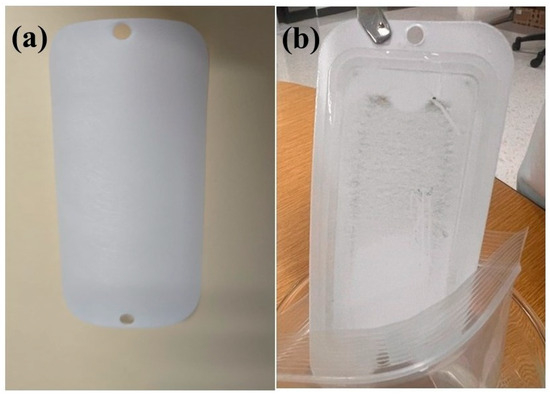
Figure 3.
(a) UF pristine membrane and (b) Membrane after 40 h run of Cd2+.
3.2. Electrical Conductivity to Determine the Critical Micelles Concentration (CMC) of SDS
Conductivity is the ability of the medium to transfer an electric charge through it. The use of electric conductivity measurement to determine the CMC of surfactants has been in practice for a long time. Surfactants in ionic form undergo substantial changes in slope once the aggregation of monomers begins, that is, CMC is reached. The breaking point where the slope of the lines changes is assigned as a CMC point [23].
Surfactant monomers act as strong electrolytes before achieving the CMC. The electric current that passed through the electrolyte was higher below the CMC point, as most of the monomers that were in an ionic state transferred the current. Once the surfactant reached the CMC, monomers aggregated to form micelles. The number of free monomers was relatively lower in comparison. Hence, less current was passed, and the slope change occurred in the plot of k versus C. Figure 4 illustrates the conductivity–concentration relationship for SDS and the corresponding. The intersection of the pre-micellar and post-micellar linear regions occurred at 8.14 mmol L−1, which was taken as the CMC for SDS under the experimental conditions. This value aligns with literature-reported CMC values for SDS at 25 °C, confirming the validity of the measurement. It should be noted that the CMC determined in pure SDS solution may shift in the presence of metal ions or electrolytes due to reduced electrostatic repulsion among head groups. These shifts are later discussed in Section 3.3 and Section 3.7, where removal efficiencies below the bulk CMC are mechanistically interpreted [24].
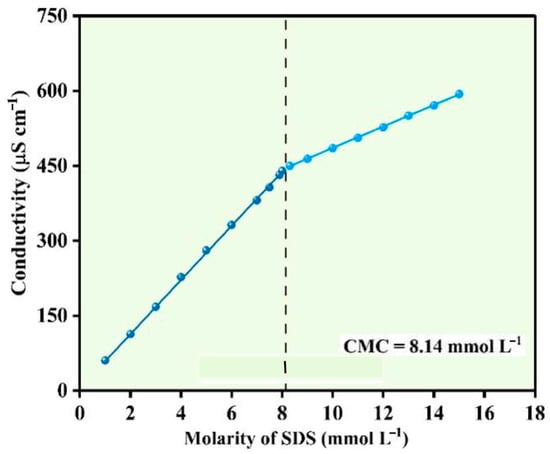
Figure 4.
Calibration curve between the conductivity versus molarity of SDS solution.
3.3. Effect of SDS Concentrations on the Flux and Removal/Reduction of Cd2+ Metal Ions
The impacts of the different SDS concentrations on permeate flux are shown in Figure 5a. The concentration of Cd2+ was used at 50 mg L−1 for this study, and four different solutions with no SDS (50 mg L−1 of Cd2+), 0.5 CMC SDS, 1 CMC SDS, and 1.5 CMC SDS were made. The flux for the UF membrane for DI water was 234.44 ± 1.43 L m−2 h−1. The membrane’s flux without SDS was around 229.25 ± 2.43 L m−2 h−1. The fluxes decreased once the surfactant was introduced. The fluxes were around 170.86 ± 3.04 L m−2 h−1 for 0.5 CMC SDS, 168.29 ± 1.51 L m−2 h−1 for 1 CMC SDS, and 159.25 ± 1.60 L m−2 h−1 for 1.5 CMC SDS.
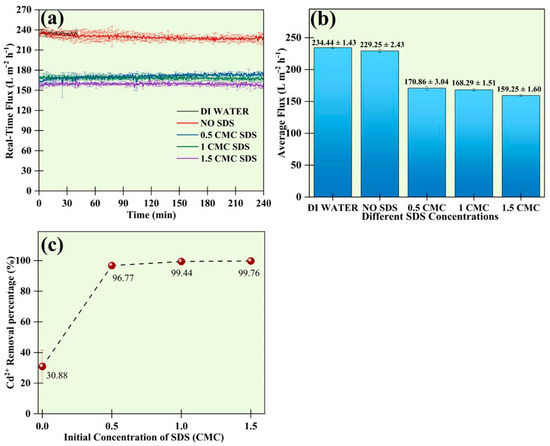
Figure 5.
(a) Real-time flux changes during the UF process, (b) average fluxes, and (c) removal efficiency of 50 mg L−1 of Cd2+ at different concentrations of SDS.
In comparison, the flux of a system with a low SDS concentration was higher than that of a solution with a high SDS concentration. The difference in flux was because the number of SDS micelles was higher in a concentrated solution. The reason could be that the eutropy of free water molecules will be reduced when introducing SDS, where the sulfonic group can make ionic interactions and H-bonds with water molecules. Several factors, such as adsorption of solutes, development of cake layer, concentration polarization, and fouling, result in the decrease in flux. In the case of these experiments, flux remained stable throughout all experiments. After the completion of each experiment of 4 h run, each membrane surface was visually observed and found to be free of any cake layer deposition [25].
Figure 5b illustrates the effect of initial SDS concentration on the removal efficiency of Cd2+.The Cd2+ removal strongly depended on the SDS concentration from 0 to 1.5 CMC. The UF membrane removed 30.88 ± 10.8% of Cd2+ in the absence of SDS. The high amount of Cd2+ removal in the absence of SDS was facilitated by mechanisms such as direct membrane adsorption and concentration polarization on the membrane surface. During adsorption, some of the Cd2+ ions get adsorbed directly inside the membrane pores. Additionally, concentration polarization causes metal ions to accumulate on the surface, acting as a secondary resistance to mass transfer and restricting the free passage of Cd2+ ions. A removal of above 30% was reported in the absence of SDS in one study by Zeng et al. [26]. The introduction of SDS to the system increased the removal efficiency of Cd2+. It was noted that the removal of Cd2+ ions started before reaching the CMC, which is theoretically impossible. At 0.5 CMC SDS, the percentage removal of Cd2+ was 96.77 ± 0.03%. The primary contributors to this unexpected removal below the CMC can be attributed to the reduction of the CMC in the presence of metal ions and concentration polarization. When metal ions are present, the repelling effect between the heads of the surfactant monomers decreases, which lowers the surfactant CMC. In addition, concentration polarization is a major phenomenon that occurs on the surface of the membrane, resulting in the accumulation of solute particles, preventing the free passage of Cd2+ and SDS monomers before reaching the CMC.
Concentration polarization facilitates the formation of the adjacent secondary layer near the membrane with an SDS concentration equal to CMC, which helps to remove the Cd2+ ions by binding to the surface [26]. Below the CMC, at first, SDS monomers started binding to the surface of the membrane, and micelles formed once sufficient SDS was aggregated. CMC was reached at 8.14 mM in a pure SDS system. The removal of Cd2+ increased at the CMC and reached 99.44 ± 0.68% as depicted in Figure 5c. Hence, we selected 1 CMC of SDS as the optimal SDS concentration for efficient removal.
3.4. Effect of pH on the Removal Efficiency of Cd2+
The pH adjustment to the acidic range was made by adding 1 mol L−1 HCl, and the basic range by adding 1 mol L−1 NaOH. The pH of the feed solution was around 6.5 before the adjustment. The change in pH influenced the real-time flux of the UF membrane. The flux of the solution decreased when the pH increased, as shown in Figure 6a. The fluxes of the membranes were 183.02 ± 1.97 L m−2 h−1, 171.97 ± 1.55 L m−2 h−1, 166.86 ± 1.55 L m−2 h−1, and 164.56 ± 1.79 L m−2 h−1 at pH 3, 5, 7, and 9, respectively.
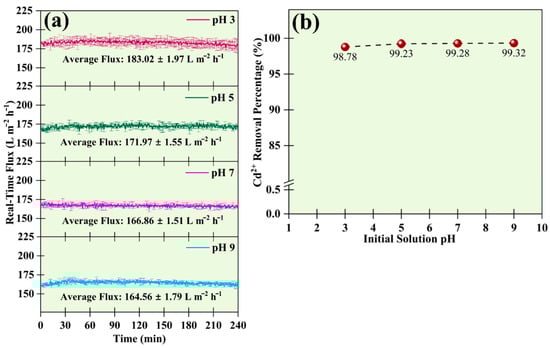
Figure 6.
Effects of pH on (a) real-time flux during the UF process, and (b) removal efficiency of 50 mg L−1 of Cd2+ at 1 CMC of SDS.
Figure 6b shows a relation between the effect of pH on the removal efficiency of 50 mg L−1 Cd2+ at 1 CMC SDS. In the neutral pH, the Cd2+ removal efficiency was around 99.28 ± 0.14%; at the basic pH (pH 9), 99.32 ± 0.09% removal was achieved. When the pH was in the lower range, that is, pH 3 and 5, the removal efficiency of 98.78 ± 0.28% and 99.23 ± 0.63% was achieved, respectively. In acidic pH, free H+ ions have higher selectivity towards sulfonic groups in micelles than Cd2+. Some of the H+ ions substituted Cd2+ ions from the binding site. However, sufficient micelles ensured binding spots for H+ and Cd2+ ions at pH 3 and 5. So, the removal percentage remained above 98% for all these cases. However, some studies have shown a decrease in percentage removal below pH 3 [27]. The availability of more H+ ions in the acidic medium caused the replacement of Cd2+ ions, hence reducing the percentage removal. In a study published in the Journal of Hazardous Materials, the author reported the removal of more Cd2+ ions with the increase in the solution pH [26]. According to the study, the availability of free SDS micelles’ head groups easily trapped the Cd2+ cations due to the free binding site at higher pH.
3.5. Evaluation of Membrane Performance and Removal Efficiency for Cd2+ over 40 h
The experiment was conducted continuously for 40 h to analyze the removal efficiency and study the UF membrane’s flux. The Cd2+ concentration was maintained at 50 mg L−1, and the SDS concentration was kept at 1 CMC. The flux of the membrane remained consistent for the overall study (Figure 7a). Also, the samples of permeate solution were collected at intervals of 5 h to test whether the removal efficiency would decrease with time. The results obtained through the AAS showed that the removal efficiency remained consistent at over 98.5% for all the samples collected (Figure 7b). From the result, it can be concluded that the membrane was resistant to fouling for long hours and performed well.
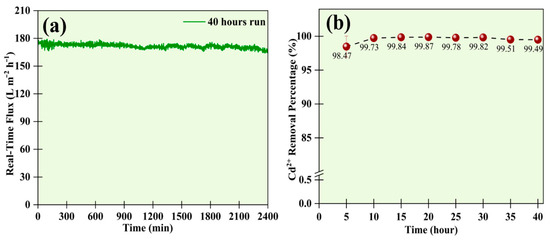
Figure 7.
Evaluation of (a) real-time flux during the UF process, and (b) removal efficiency for 50 mg L−1 of Cd2+ over 40 h.
3.6. Relation Between the Removal Efficiency of Cd2+ at Different Concentrations
This section depicts the relationship between the variation in real-time flux with changing concentrations of Cd2+ and the percentage removal of Cd2+ at those concentrations. For this study, the concentration of Cd2+ was changed between 10 mg L−1 and 50 mg L−1, and the SDS concentration was maintained at 1 CMC. The relation between permeate flux at different concentrations of Cd2+ is presented in Figure 8a. The real-time flux of the UF membrane for the higher concentration of Cd2+ was relatively lower and vice versa. This is because more metal ions were available in the solution at high concentrations. The increase in cationic concentration in any solution reduces the repelling force between the head groups of SDS monomers, aiding in the formation of micelles. Also, the availability of more metal ions reduced the CMC of SDS. Thus, the increase in metal ion concentration resulted in the formation of more SDS micelles, which prevented the free flow of the mass through the membrane pores, resulting in a decrease in the permeate flux [28]. Hence, the permeate flux for the membrane followed a descending pattern from 10 mg L−1 to 50 mg L−1 of Cd2+ solution. At 10 mg L−1, it was 178.04 ± 1.76 L m−2 h−1, it reached 174.04 ± 1.97 L m−2 h−1 at 20 mg L−1, further dropped to 171.36 ± 1.84 L m−2 h−1 at 30 mg L−1 and was 168.29 ± 1.51 L m−2 h−1 at 50 mg L−1.
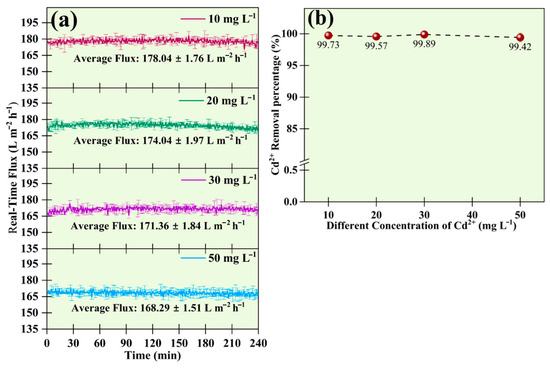
Figure 8.
Effects of change in concentration on (a) real-time flux during the UF process, and (b) removal efficiency of 50 mg L−1 of Cd2+ at 1 CMC of SDS.
Figure 8b depicts the percentage removal of Cd2+ at different concentrations using a fixed SDS dosage of 1 CMC. The result suggested that Cd2+ removal efficiency remained almost constant, that is, above 99% for all the concentrations tested.
3.7. Effect on the Removal Efficiency of Cd2+ in the Presence of an Electrolyte
Figure 9a,b illustrate the influence of the electrolyte on the real-time flux and on the percentage removal of Cd2+. This study was carried out using the sodium nitrate (NaNO3) salt. The concentration of NaNO3 was changed from 0.01 mol L−1 to 0.05 mol L−1, the Cd2+ concentration was kept at 50 mg L−1, and the SDS concentration was maintained at 1 CMC. NaNO3 dissociates into a positively charged Na+ cation and a negatively charged NO3− anion in the aqueous state. The nature of the charge present in Cd2+ and Na+ was the same. The Na+ cation from the dissociated electrolyte in the feed solution competed to occupy the same binding site as Cd2+ ions. Thus, free Cd2+ ions were released and passed through the pores during UF. However, this phenomenon was less significant in low salt concentration. Figure 9b shows decreased removal efficiency of Cd2+ with increased salt concentration. The presence of NaNO3 electrolytes had an adverse effect on the removal of Cd2+ metal ions. At a concentration of 0.01 mol L−1 of NaNO3, the removal efficiency was 98.84 ± 0.12%. As we increased the concentration of the solution to 0.03 mol L−1 of NaNO3, a removal efficiency of 90.44 ± 0.23% was achieved. And at 0.05 mol L−1 of NaNO3, the removal efficiency dropped to 78.12 ± 0.01%. Studies have suggested that the addition of salt has a positive impact as it reduces the CMC of the solution, thus preventing the leakage of surfactant monomers into the permeate. However, the result suggested that NaNO3 addition offset the benefit, as it reduced the performance of the overall MEUF system [29].
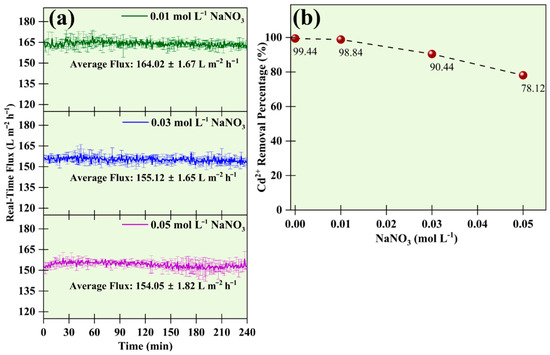
Figure 9.
Effect of salt on (a) real-time flux during the UF process, and (b) removal efficiency of 50 mg L−1 of Cd2+ and 1 CMC SDS.
The permeate flux also varied slightly depending on the salt in the feed solution. The surge in the electrolyte concentration induced concentration polarization by decreasing the CMC of micelles, causing a decline in permeate flux [25]. The permeate flux for the UF membrane was 164.02 ± 1.67 L m−2 h−1 at 0.01 mol L−1, 155.12 ± 1.65 L m−2 h−1 at 0.03 mol L−1, and 154.05 ± 1.82 L m−2 h−1 at 0.05 mol L−1 of NaNO3.
3.8. Comparison of MEUF Performance with Reported Literature
A comparison table where MEUF effectively removed various heavy metal contaminants, such as Cd2+, Cu2+, Zn2+, Ni2+, and other metal ions, is presented in Table 2.
Table 2.
Comparison of MEUF performance with reported literature.
4. Conclusions
The study investigated the removal of Cd2+ metal ions using anionic surfactant SDS using the MEUF process. Membrane filtration was carried out using a PES ultrafiltration membrane of MWCO of 30 kDa, which showed that removal efficiency above 99% was achieved using both membranes. Cd2+ removal was achieved at a surfactant concentration of 0.05 CMC, where micelles were theoretically absent. The optimum SDS concentration was at 1 CMC, with a removal percentage greater than 99%. The removal of Cd2+ ions improved with the increase in feed SDS concentration, but the increase in SDS concentration decreased the permeate flux of the membrane. The performance of the UF membrane was evaluated for a 40 h duration for Cd2+ removal. The flux of the UF membrane remained stable without any drop for this period. The FTIR analysis showed no change in the functional group and EDS showed no change in the constituent of the element, suggesting the absence of the fouling layer in both UF membranes. Several parameters were studied, such as the effect of pH, the change in concentration of metal ions, and the addition of salt. The result suggested that MEUF was effective for Cd2+ removal in a wide range of pH (3 to 9), and this mechanism was also applicable to different concentrations of metal ions. However, the presence of salt had negatively impacted the removal of metal ions.
In sum, this investigation established that the initial SDS concentration influenced the removal of metal ions Cd2+. The outcome showed the potential of this technique in removing toxic contaminants such as heavy metals in industrial settings. Further studies are required to apply this technique to real wastewater and evaluate the membrane’s effectiveness in real wastewater. In a future study, we plan to enhance the present method with a microfiltration system and test it with different heavy metals as pollutants.
Author Contributions
Conceptualization, P.S., S.B.M. and R.R.K.; methodology, P.S. and S.B.M.; software, P.S.; data curation, P.S. and S.B.M.; investigation, P.S. and S.B.M.; resources, R.R.K.; writing—original draft preparation, P.S.; supervision, S.B.M. and R.R.K.; funding acquisition, R.R.K.; writing—reviewing and editing, S.B.M. and R.R.K. All authors have read and agreed to the published version of the manuscript.
Funding
This work was supported by the National Science Foundation (NSF) through the CREST Center for Energy and Environmental Sustainability-Phase II (CEES) (Award #1914692).
Data Availability Statement
Data are contained within the article.
Acknowledgments
The authors would like to acknowledge the support of the Center for Energy and Environmental Sustainability (CEES) at PVAMU and the Department of Chemistry at PVAMU. The authors acknowledge Bishweshwar Pant, Gabriel Morales, and Prashan Rodrigo for reviewing the manuscript.
Conflicts of Interest
The authors declare no conflicts of interest.
Abbreviations
The following abbreviations are used in this manuscript:
| CMC | Critical micelle concentration |
| SDS | Sodium dodecyl sulfate |
| RCRA | Resource Conservation and Recovery Act |
| MWCO | Molecular weight cutoff |
| FTIR | Fourier-transform infrared |
| AAS | Atomic Absorption Spectrophotometer |
References
- Aryanti, N.; Nafiunisa, A.; Giraldi, V.F.; Buchori, L. Separation of organic compounds and metal ions by micellar-enhanced ultrafiltration using plant-based natural surfactant (saponin). Case Stud. Chem. Environ. Eng. 2023, 8, 2–11. [Google Scholar] [CrossRef]
- He, Z.L.; Yang, X.E.; Stoffella, P.J. Trace elements in agroecosystems and impacts on the environment. J. Trace Elem. Med. Biol. 2005, 19, 125–140. [Google Scholar] [CrossRef] [PubMed]
- World Water Assessment Programme (WWAP). World Water Development Report 2018: Nature-Based Solutions for Water; UNESCO: Paris, France, 2018. [Google Scholar]
- Chattopadhyay, S. Toxic Effect of Metal Ions in Water Resources. Glob. J. Sci. Front. Res. 2016, 16, 15–18. [Google Scholar]
- Mitra, S.; Jyoti, A.; Montakim, A.; Bin, T.; Nainu, F.; Khusro, A.; Idris, A.M.; Uddin, M.; Osman, H.; Alhumaydhi, F.A.; et al. Journal of King Saud University—Science Impact of heavy metals on the environment and human health: Novel therapeutic insights to counter the toxicity. J. King Saud Univ.—Sci. 2022, 34, 101865. [Google Scholar] [CrossRef]
- Shah, S.B. Heavy Metals in the Marine Environment—An Overview; Springer Nature: New York, NY, USA, 2021. [Google Scholar]
- Kiran; Bharti, R.; Sharma, R. Effect of heavy metals: An overview. Mater. Today Proc. 2021, 51, 880–885. [Google Scholar] [CrossRef]
- As, R. The RCRA 8 Metals: What You Need to Know Table of Contents. No. Cd, 2023. Available online: http://www.alsglobal.com/en/news-and-publications/2023/10/rcra-8-metals-guide (accessed on 7 January 2026).
- Krajewski, A. Analysis of Heavy Metal Exposures and Evaluation of Detection Methods for Heavy Metals in Drinking Water. Rev. Bras. Ergon. 2016, 9, 10. [Google Scholar]
- Simeonov, V.; Stratis, J.A.; Samara, C.; Zachariadis, G.; Voutsa, D.; Anthemidis, A.; Sofoniou, M.; Kouimtzis, T. Assessment of the surface water quality in Northern Greece. Water Res. 2003, 37, 4119–4124. [Google Scholar] [CrossRef]
- Mandour, R.A.; Azab, Y.A. The prospective toxic effects of some heavy metals overload in surface drinking water of Dakahlia Governorate, Egypt. Int. J. Occup. Environ. Med. 2011, 2, 245–253. [Google Scholar]
- Srinivasa Gowd, S.; Govil, P.K. Distribution of heavy metals in surface water of Ranipet industrial area in Tamil Nadu, India. Environ. Monit. Assess. 2008, 136, 197–207. [Google Scholar] [CrossRef]
- University Andreas Kubiera; Wilkinb, R.T.; Pichlera, T. EPA Public Access. In Atmospheric Environment; 2017; Volume 23, pp. 248–258. Available online: https://catalog.data.gov/dataset/wilkin-et-al-2018-prb-long-term-performance-tce (accessed on 7 January 2026).
- Aziz, H.A.; Adlan, M.N.; Ariffin, K.S. Heavy metals (Cd, Pb, Zn, Ni, Cu and Cr(III)) removal from water in Malaysia: Post treatment by high quality limestone. Bioresour. Technol. 2008, 99, 1578–1583. [Google Scholar] [CrossRef]
- Hubicki, Z.; Kołodyńska, D. Selective Removal of Heavy Metal Ions from Waters and Waste Waters Using Ion Exchange Methods. Intech 2016, 11, 13. [Google Scholar] [CrossRef]
- Fu, F.; Wang, Q. Removal of heavy metal ions from wastewaters: A review. J. Environ. Manag. 2011, 92, 407–418. [Google Scholar] [CrossRef] [PubMed]
- Thaçi, B.S.; Gashi, S.T. Reverse osmosis removal of heavy metals from wastewater effluents using biowaste materials pretreatment. Polish J. Environ. Stud. 2019, 28, 337–341. [Google Scholar] [CrossRef]
- Landaburu-Aguirre, J.; Pongrácz, E.; Sarpola, A.; Keiski, R.L. Simultaneous removal of heavy metals from phosphorous rich real wastewaters by micellar-enhanced ultrafiltration. Sep. Purif. Technol. 2012, 88, 130–137. [Google Scholar] [CrossRef]
- Xu, K.; Zeng, G.; Huang, J.; Wu, J.; Fang, Y.; Huang, G.; Li, J.; Xi, B.; Liu, H. Removal of Cd2+ from synthetic wastewater using micellar-enhanced ultrafiltration with hollow fiber membrane. Colloids Surf. A Physicochem. Eng. Asp. 2007, 294, 140–146. [Google Scholar] [CrossRef]
- Huang, J.; Shi, L.; Zeng, G.; Li, H.; Huang, H.; Gu, Y.; Shi, Y.; Yi, K.; Li, X. Removal of Cd(Ⅱ) by micellar enhanced ultrafiltration: Role of SDS behaviors on membrane with low concentration. J. Clean. Prod. 2019, 209, 53–61. [Google Scholar] [CrossRef]
- Huang, J.H.; Zeng, G.M.; Zhou, C.F.; Li, X.; Shi, L.J.; He, S.B. Adsorption of surfactant micelles and Cd2+/Zn2+ in micellar-enhanced ultrafiltration. J. Hazard. Mater. 2010, 183, 287–293. [Google Scholar] [CrossRef]
- Karate, V.D.; Marathe, K.V. Simultaneous removal of nickel and cobalt from aqueous stream by cross flow micellar enhanced ultrafiltration. J. Hazard. Mater. 2008, 157, 464–471. [Google Scholar] [CrossRef]
- Shanks, P.C.; Franses, E.I. Estimation of micellization parameters of aqueous sodium dodecyl sulfate from conductivity data. J. Phys. Chem. 1992, 96, 1794–1805. [Google Scholar] [CrossRef]
- Mitsionis, A.I.; Vaimakis, T.C. Estimation of AOT and SDS CMC in a methanol using conductometry, viscometry and pyrene fluorescence spectroscopy methods. Chem. Phys. Lett. 2012, 547, 110–113. [Google Scholar] [CrossRef]
- Yaqub, M.; Lee, S.H. Heavy metals removal from aqueous solution through micellar enhanced ultrafiltration: A review. Environ. Eng. Res. 2019, 24, 363–375. [Google Scholar] [CrossRef]
- Zeng, G.M.; Li, X.; Huang, J.H.; Zhang, C.; Zhou, C.F.; Niu, J.; Shi, L.J.; He, S.B.; Li, F. Micellar-enhanced ultrafiltration of cadmium and methylene blue in synthetic wastewater using SDS. J. Hazard. Mater. 2011, 185, 1304–1310. [Google Scholar] [CrossRef]
- Huang, J.; Yuan, F.; Zeng, G.; Li, X.; Gu, Y.; Shi, L.; Liu, W.; Shi, Y. Influence of pH on heavy metal speciation and removal from wastewater using micellar-enhanced ultrafiltration. Chemosphere 2017, 173, 199–206. [Google Scholar] [CrossRef]
- Massarweh, O.; Abushaikha, A.S. The use of surfactants in enhanced oil recovery: A review of recent advances. Energy Rep. 2020, 6, 3150–3178. [Google Scholar] [CrossRef]
- Miyagishi, S.; Okada, K.; Asakawa, T. Salt effect on critical micelle concentrations of nonionic surfactants, N-acyl-N-methylglucamides (MEGA-n). J. Colloid Interface Sci. 2001, 238, 91–95. [Google Scholar] [CrossRef] [PubMed]
- Bade, R.; Lee, S.H.; Jo, S.; Lee, H.S.; Lee, S. Micellar enhanced ultrafiltration (MEUF) and activated carbon fibre (ACF) hybrid processes for chromate removal from wastewater. Desalination 2008, 229, 264–278. [Google Scholar] [CrossRef]
- Landaburu-Aguirre, J.; García, V.; Pongrácz, E.; Keiski, R.L. The removal of zinc from synthetic wastewaters by micellar-enhanced ultrafiltration: Statistical design of experiments. Desalination 2009, 240, 262–269. [Google Scholar] [CrossRef]
- Yenphan, P.; Chanachai, A.; Jiraratananon, R. Experimental study on micellar-enhanced ultrafiltration (MEUF) of aqueous solution and wastewater containing lead ion with mixed surfactants. Desalination 2010, 253, 30–37. [Google Scholar] [CrossRef]
Disclaimer/Publisher’s Note: The statements, opinions and data contained in all publications are solely those of the individual author(s) and contributor(s) and not of MDPI and/or the editor(s). MDPI and/or the editor(s) disclaim responsibility for any injury to people or property resulting from any ideas, methods, instructions or products referred to in the content. |
© 2026 by the authors. Licensee MDPI, Basel, Switzerland. This article is an open access article distributed under the terms and conditions of the Creative Commons Attribution (CC BY) license.