3.2.1. Zonal Health Evaluation
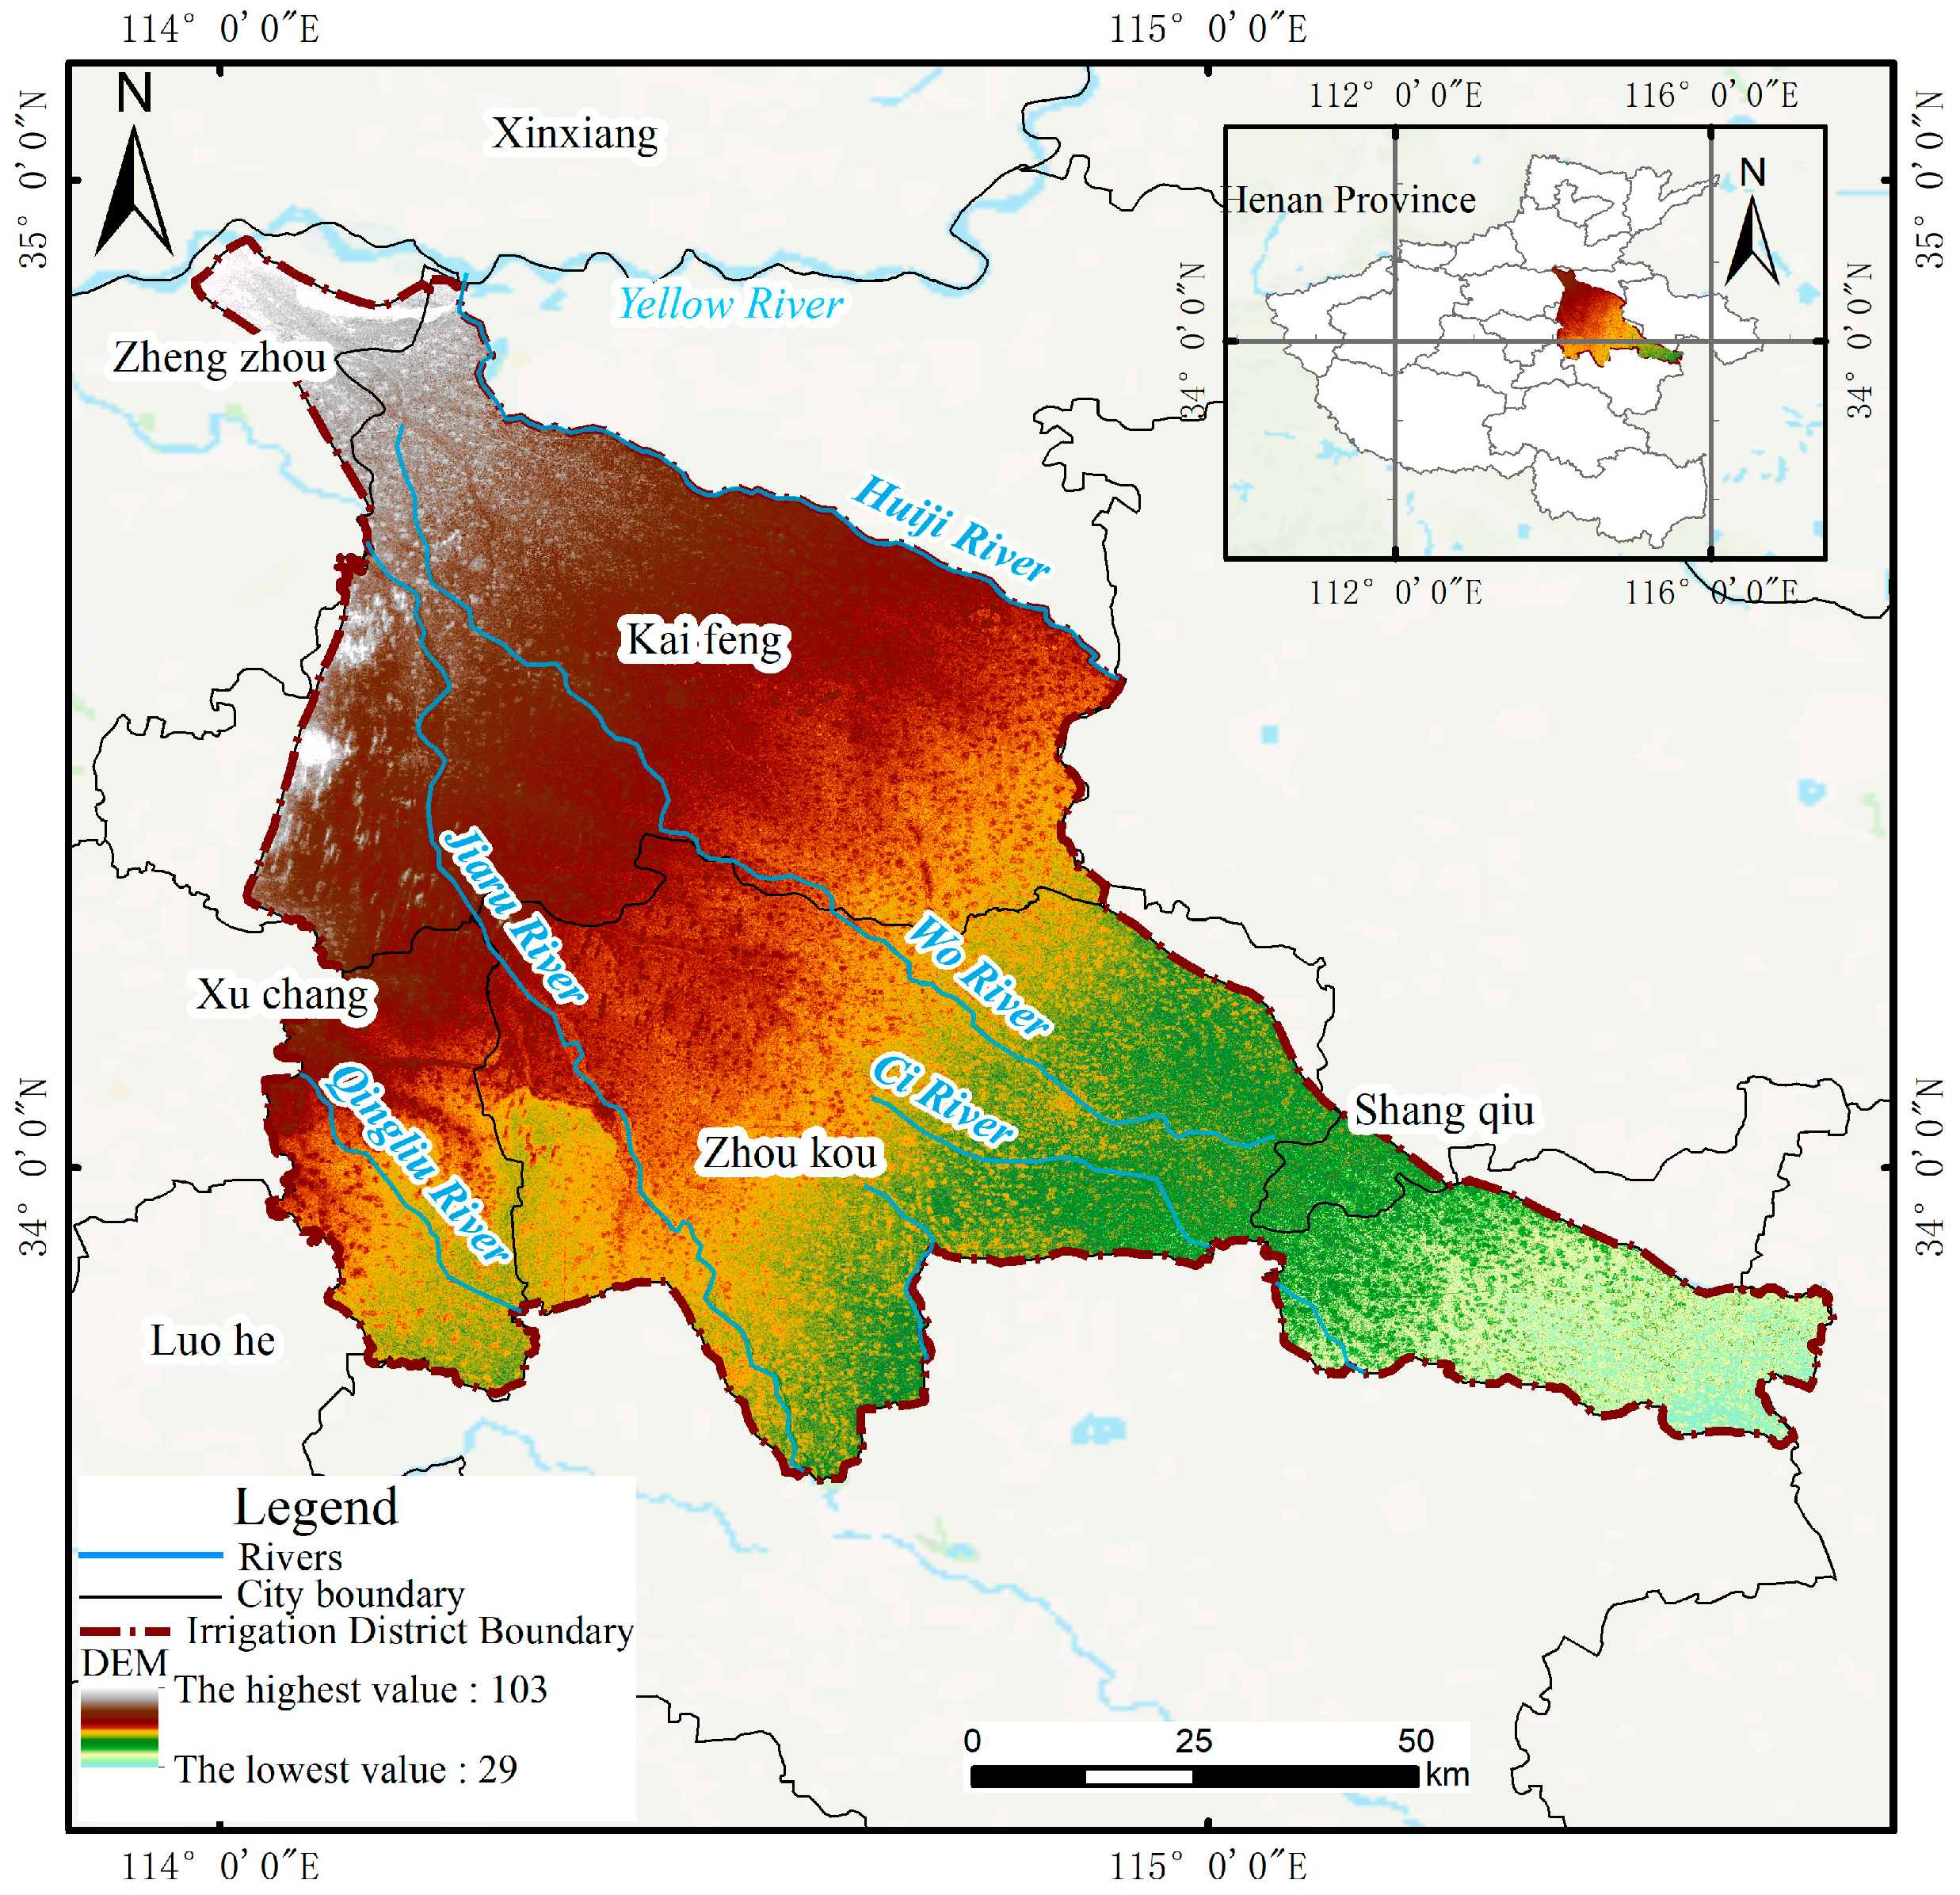
According to the administrative division of the region where it is located, the Zhaokou irrigation district is divided into five areas, namely, Zhengzhou, Kaifeng, Zhoukou, Shangqiu, and Xuchang areas.
Under the theoretical framework of the “natural–artificial–social” composite ecosystem proposed for irrigation districts, this paper performed zonal health evaluation from three dimensions (ecological health, economic health, and social health) based on the three core goals of engineering construction in irrigation districts (ecological health, efficient water saving, and high-quality development) and the comprehensive evaluation system for Yellow River irrigation districts in Henan Province [
9]. At the methodological level, the B1 indicator group was defined as the basis of ecological health evaluation through attribute classification, the B2–B3 indicator group constitutes the economic health evaluation system, and the B4–B6 indicator group forms the benchmark of social health evaluation. Relying on the natural breakpoint method and grid-based spatial analysis technique in ArcGIS, the health level of each attribute of the Zhaokou irrigation district at the county scale was quantitatively graded to finally obtain the distribution map of the multi-dimensional and comprehensive health evaluation levels of the Zhaokou irrigation district, as shown in
Figure 3 and
Figure 4.
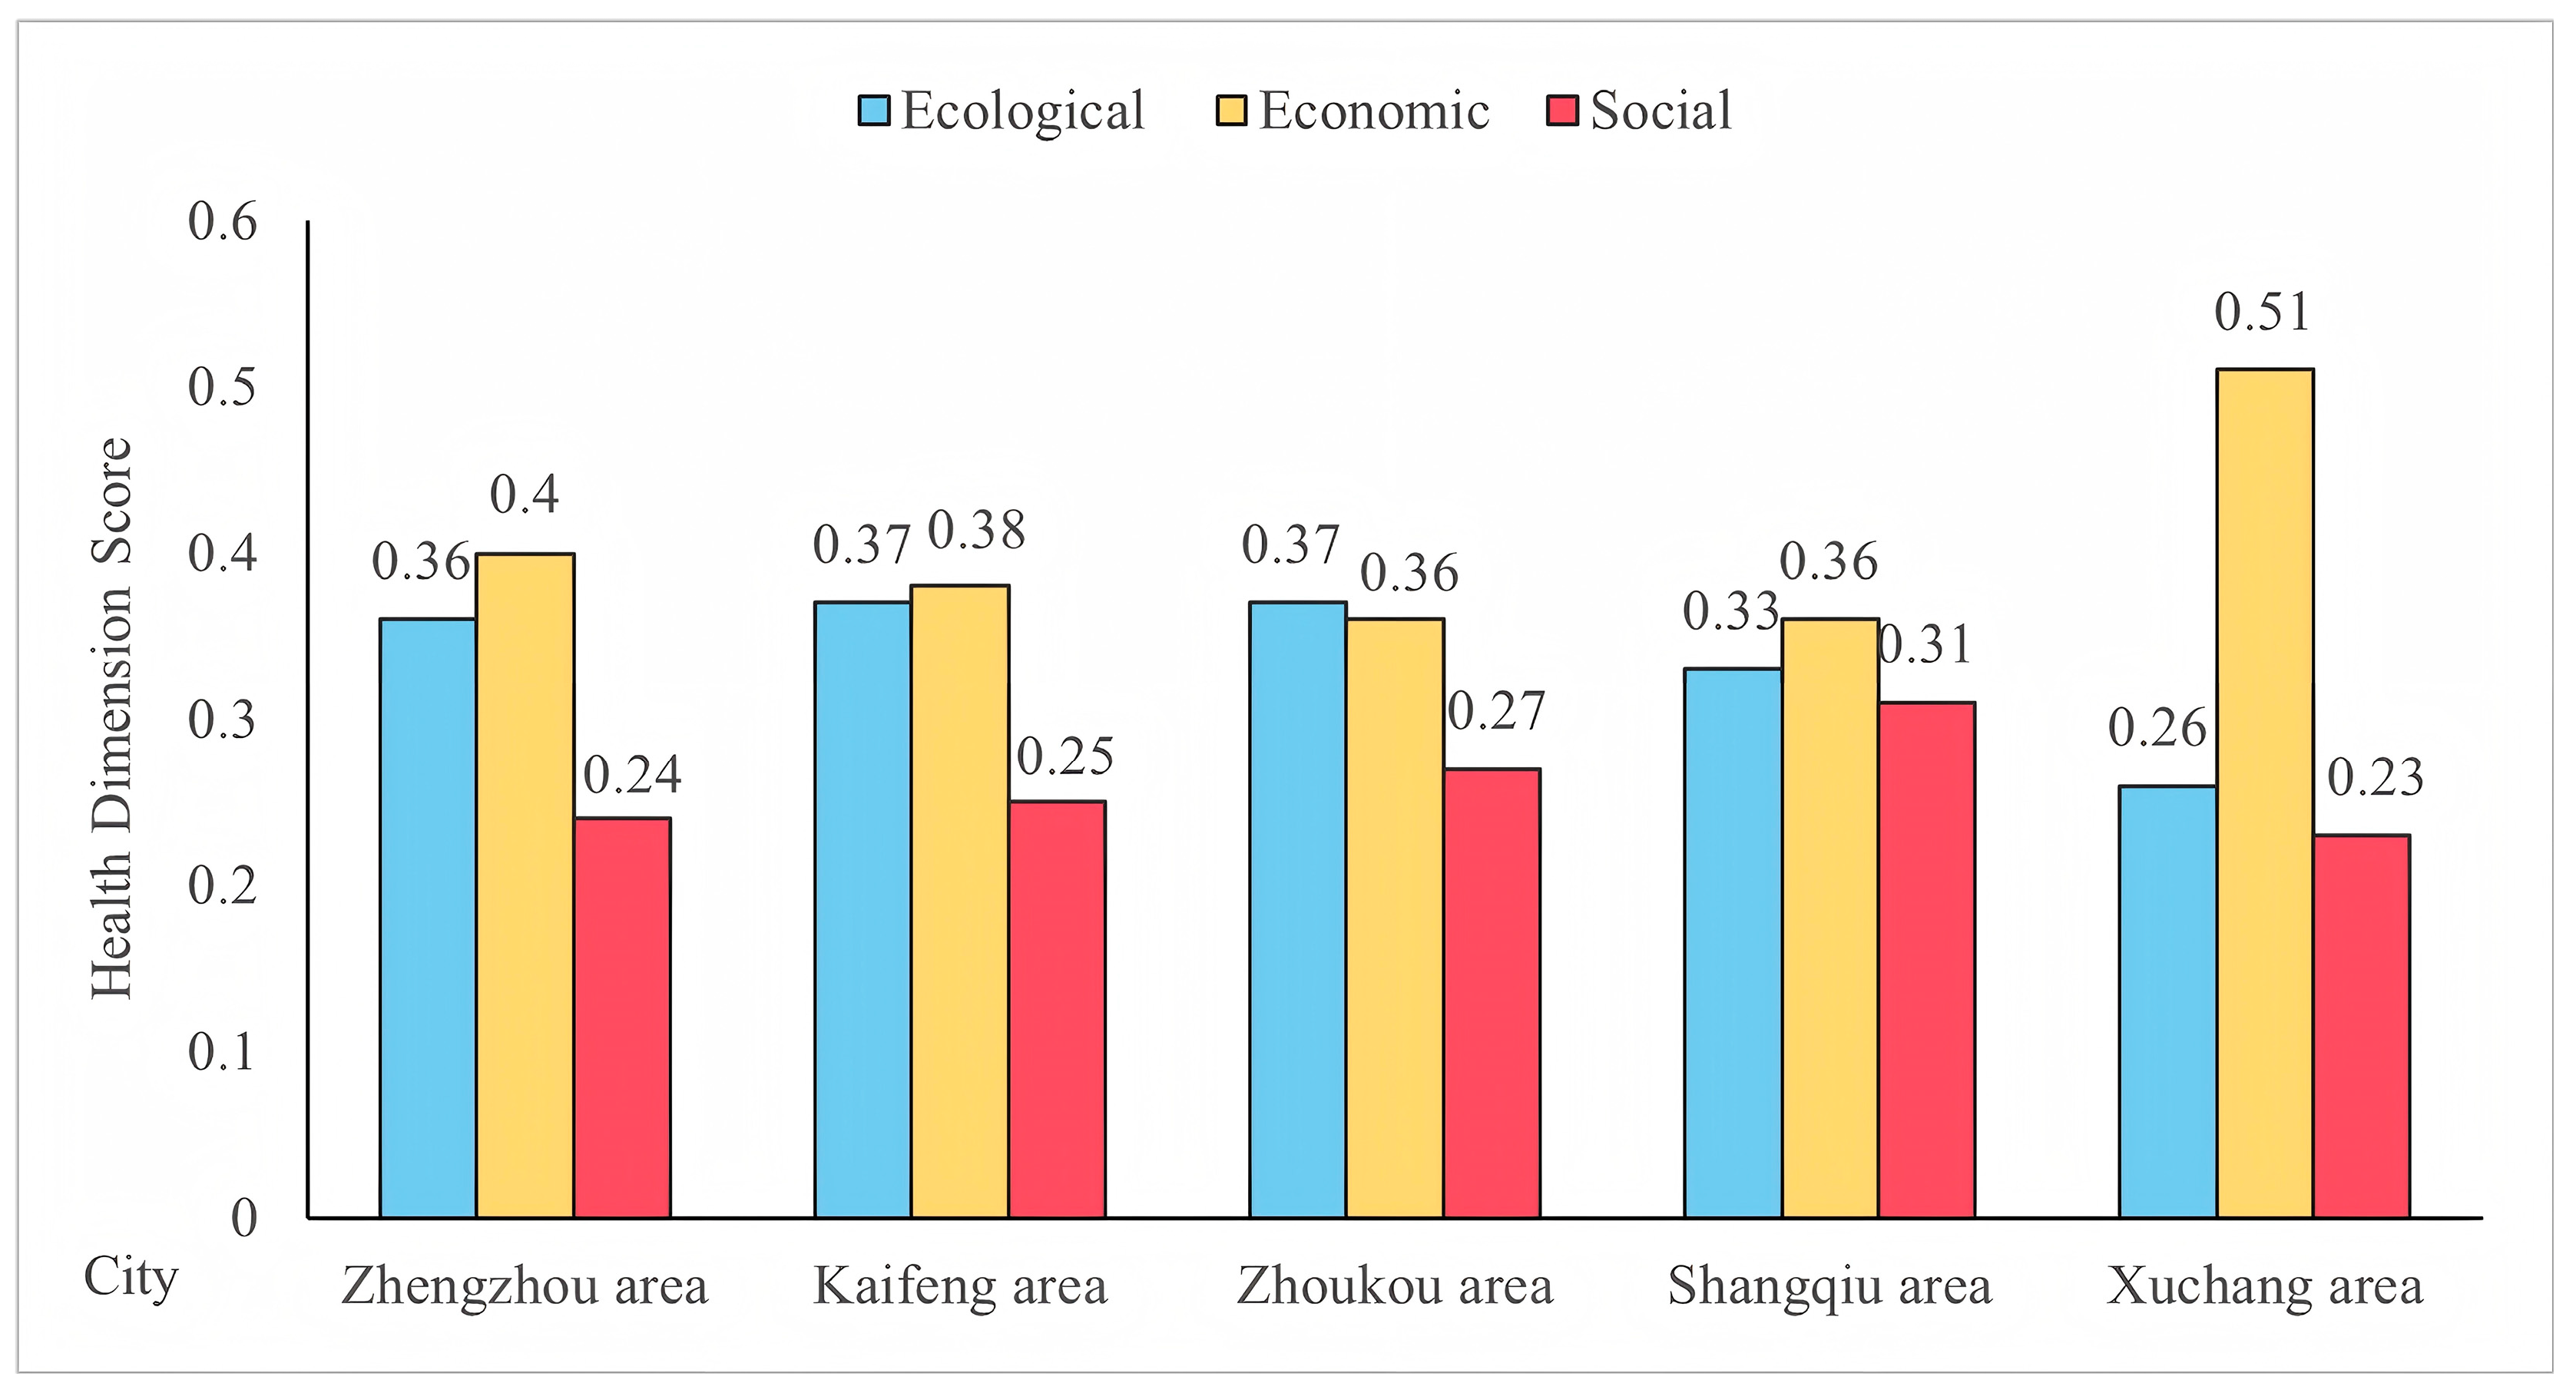
In combination with the analysis of
Figure 3, the ecological health score for the Kaifeng and Zhoukou areas was 0.37. Its advantage lies in the key indicators, such as the rural sewage treatment rate (41.8% and 47.8%) and weather conditions (64.33% and 69%). Comparatively speaking, Zhengzhou area in the north, limited by poor surface water quality, had relatively high proportions of grade IV water, and the ecological health score dropped to 0.36. The score for the Shangqiu area in the southeast was 0.33, mainly constrained by the low index value of residential green space, which was far below the average value of 13.24 m
3 for the irrigation area. Although the Xuchang area in the southwest had a 0.26 ecological health score, the maximum difference in ecological health scores between different areas in the whole region was only 0.11. The economic health dimension showed a significant decreasing trend from north to south. The economic health scores for the Zhengzhou and Xuchang areas were 0.40 and 0.51, respectively, mainly attributable to their significant advantages in the proportion of water-saving irrigation areas and their regional leading positions in farmers’ disposable income. Kaifeng area was 0.38, mainly because its low grain yield per unit area was lower than the regional average of 6000 kg/ha, combined with the negative effects of a high water consumption index per 10,000 yuan of GDP. The two areas of Zhoukou and Shangqiu were constrained by water-use efficiency indicators, with an economic health score of 0.36. The social health dimension presented a decreasing trend from south to north. To be specific, Zhoukou and Shangqiu areas in the south relied on their advantages in surface water yield coefficient, with social health scores of 0.27 and 0.31, respectively. The scores for the Kaifeng area in the middle and the Zhengzhou area in the north were 0.25 and 0.24, respectively. The lowest social health score, in Xuchang, was 0.23. They showed convergent traits in social health indicators, such as the completion rate of supporting water conservancy projects and the proportion of people with a bachelor’s degree or above exceeding 90%. Their differences in health levels were mainly due to the gradual attenuation of social service indicators, such as the surface water yield coefficient, which were 0.30, 0.23, and 0.22.
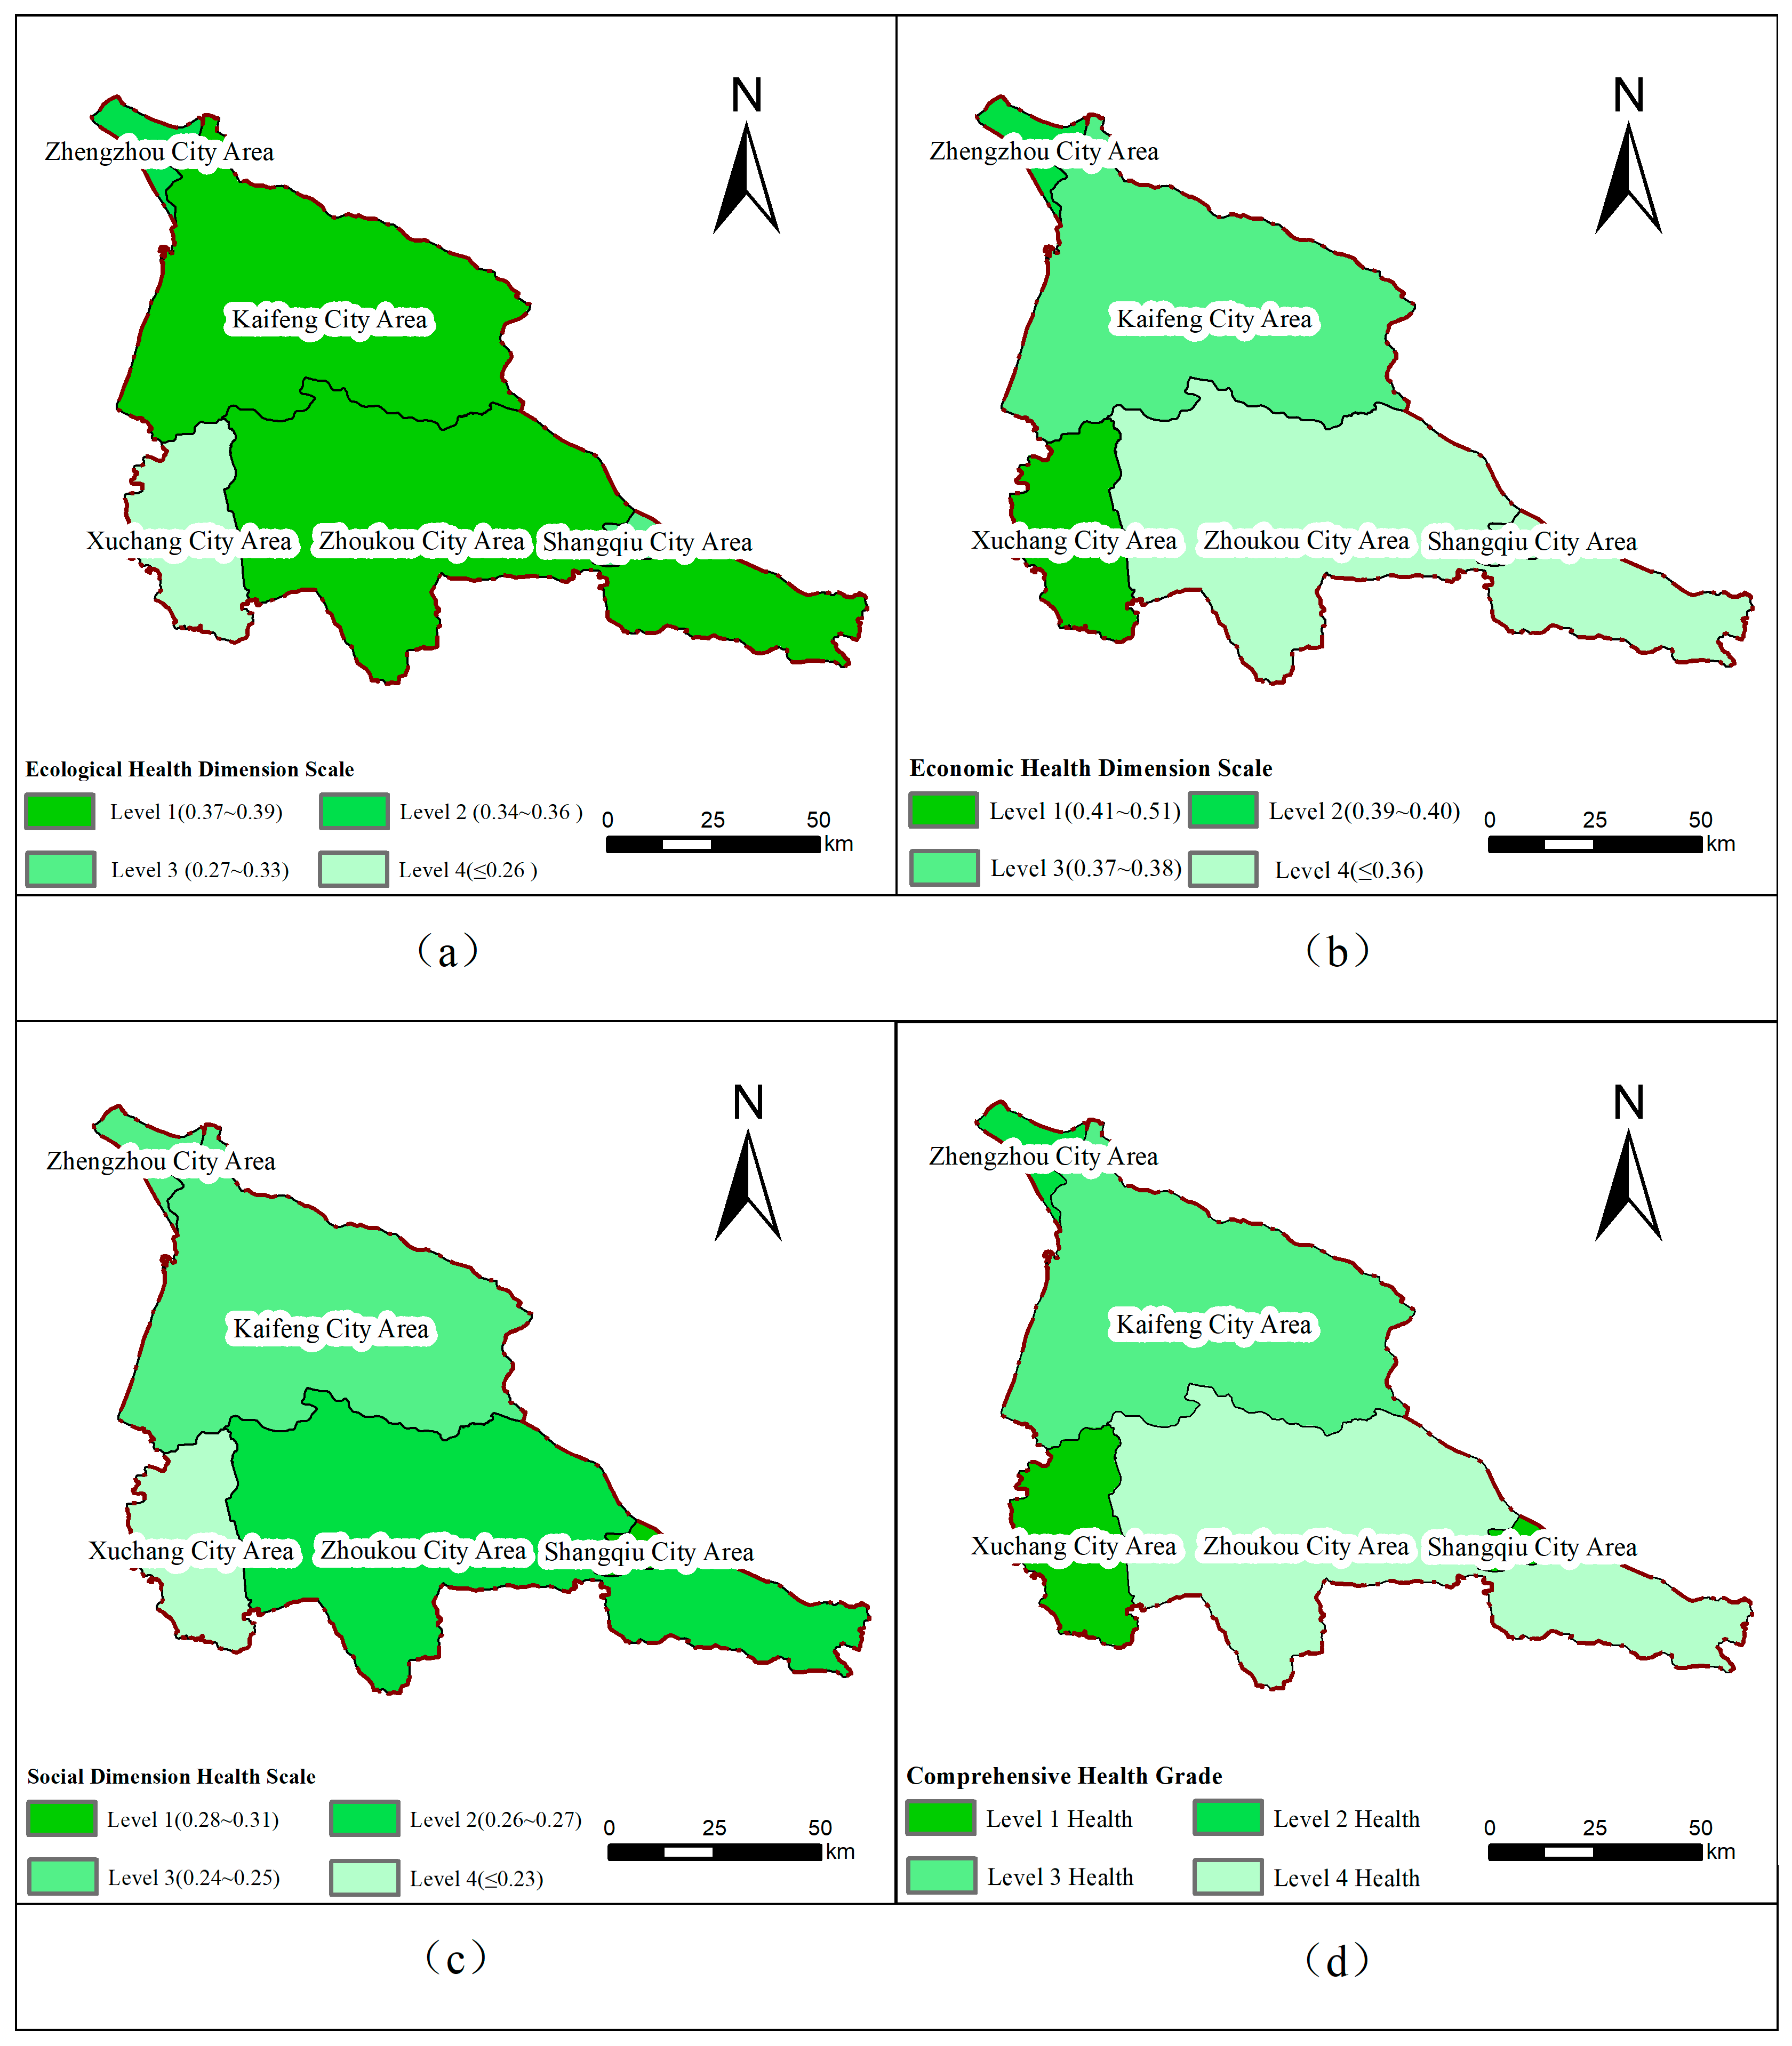
According to the analysis of
Figure 4, the multi-dimensional health evaluation model revealed that the health levels of various areas showed significant spatial heterogeneity, that is, the distribution of health status was characterized by “high at the peripheries and low in the middle”. Shangqiu and Xuchang areas had a grade I health level, while Zhengzhou area, Zhoukou area, and Kaifeng area were grade II, grade III, and grade IV, respectively. These results are basically consistent with the actual situation.
Shangqiu and Xuchang areas showed systematic health advantages, with pesticide application intensities of 550 tons and 612 tons and fertilizer application intensities of 46,893 tons and 36,135 tons, all of which were lower than the average values in the study area. When these factors were combined with their advantages in the proportion of high-standard farmland and the surface water yield coefficient, an ecological–water-saving–social synergistic gain effect was produced, so they were established as grade I health areas. Zhengzhou area had outstanding performance in ecological health and economic health, with the rate of excellent or good weather conditions being 65% and a high farmers’ disposable income, with the latter exceeding the regional average by 42%. However, limited by factors such as the threshold of surface water resources development and population density, Zhengzhou area had a low social health indicator, and was accordingly assigned grade II. Kaifeng area faced the typical challenges of structural imbalance. To name a few, its proportion of water-saving irrigation area (35.6%) was 17% lower than the average value, and it was also subject to the dual constraints of low total power of agricultural machinery and low availability of surface water resources (82 million tons). These challenges caused economic–social health bottlenecks, for which Kaifeng area was rated as grade III. The multi-dimensional health development of Zhoukou area was relatively slow. The current values of ecological health indicators, such as pesticide and fertilizer application intensity, were quite high, at 2137 tons and 90,294 tons, respectively. Its key indicators in the economic health dimension, i.e., farmers’ disposable income and water consumption per 10,000 yuan GDP, were at the medium level. Its social indicators, such as average annual precipitation and public satisfaction, were also at the medium level. With a low multi-dimensional health indicator, it was ultimately classified as grade IV. On the whole, the differences in comprehensive health between areas in the Zhaokou irrigation district were within a controllable range.
3.2.2. Functional Zoning of Irrigation District Development
A functional zoning classification system was constructed for the irrigation district under the theoretical framework of the composite ecosystem [
20]. After the establishment of three functional attributes of development (ecology, water saving, and society), a functional evaluation framework for irrigation district development was constructed based on the evaluation indicator system for Yellow River irrigation districts in Henan Province. The functional attribute of ecology was characterized by the B1 indicator system at the core (with a weight of 0.5), the functional attribute of water saving integrated indicators in the two dimensions of B2 and B4 (with a weight of 0.3), and the functional attribute of society coupled indicators in the three dimensions of B3, B5, and B6 (with a weight of 0.2). The calculation results of the functional attribute scores for different areas and their spatial distribution are shown in
Figure 5 and
Figure 6.
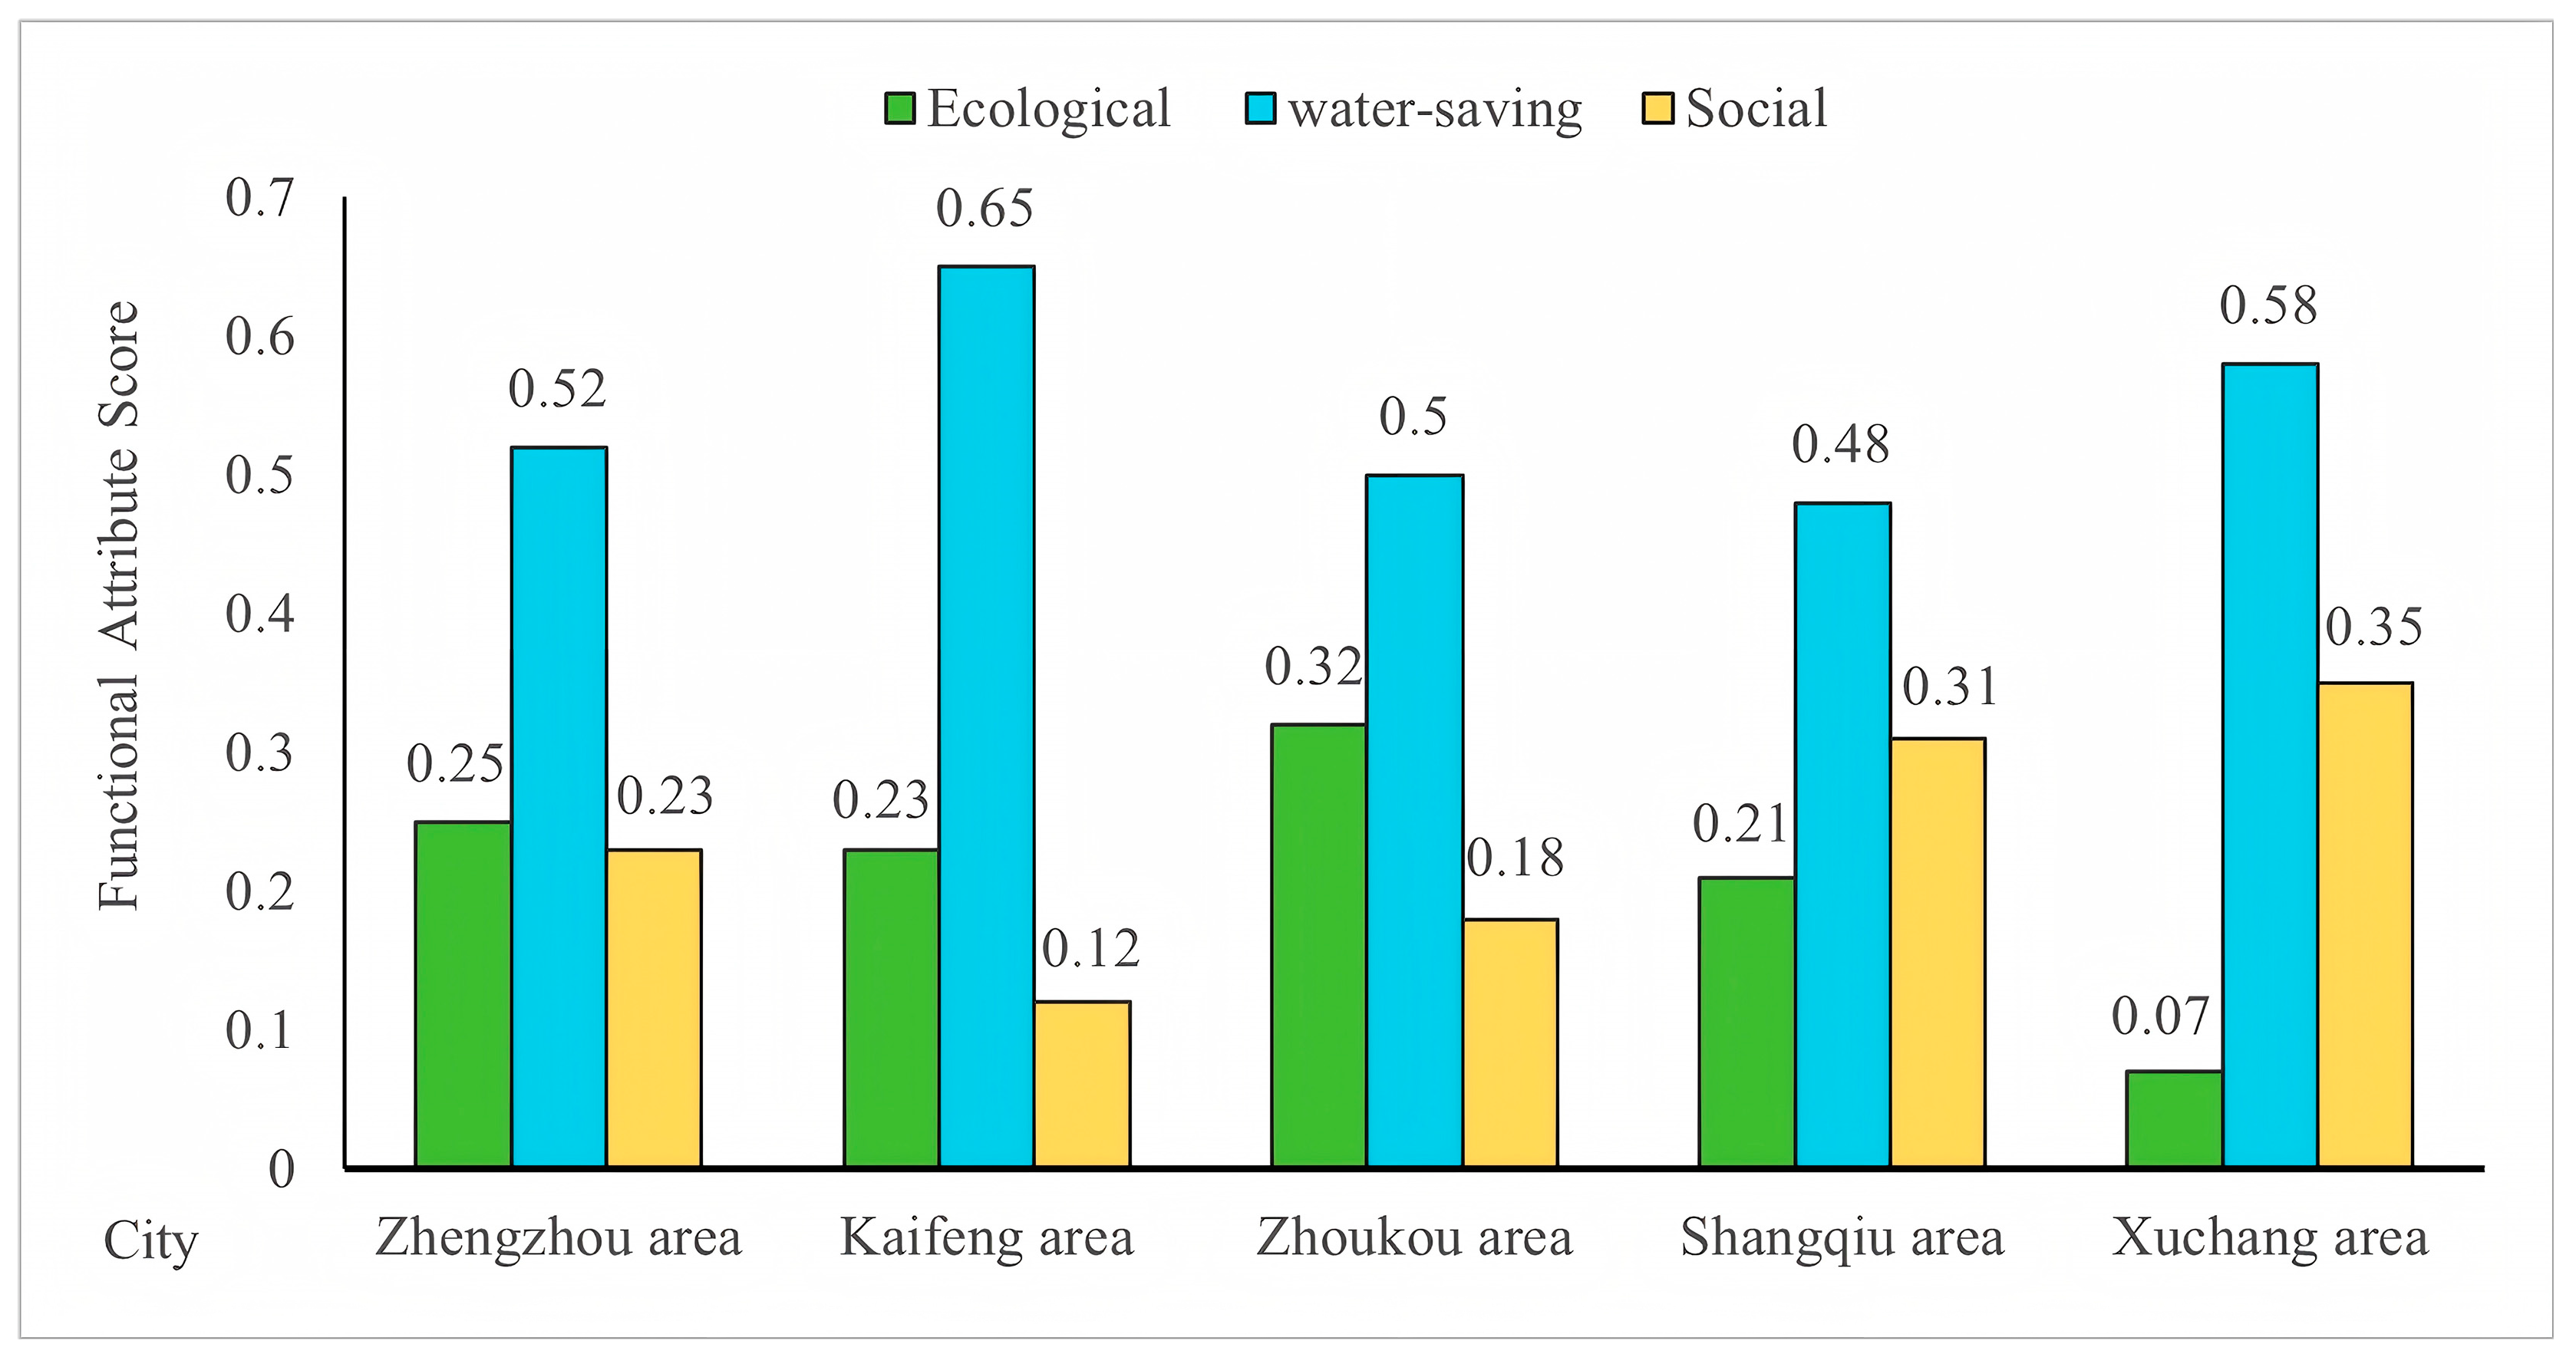
From
Figure 5, it can be seen that in the Zhaokou irrigation area, the score proportion of water-saving functional attributes was the highest, accounting for about 50% or more. In the Zhengzhou, Kaifeng, and Zhoukou areas, the score proportion of ecological functional attributes was higher than that of social attributes, while in the Shangqiu and Xuchang areas, the score proportion of social functional attributes was higher than that of ecological attributes.
The functional attribute ratio method (that is, the contribution rate of the functional attributes of development ≥ 20%) was adopted to analyze the spatial heterogeneity of the Zhaokou irrigation district with the aid of ArcGIS mapping. The results showed that the irrigation district could be divided into three composite functional types, namely, ecological–water-saving–social composite areas, ecological–water-saving composite areas, and water-saving–social composite areas, as shown in
Figure 6. Ecological–water-saving–social composite areas were mainly distributed in Zhengzhou and Shangqiu areas. The per capita green area of Zhengzhou area reached 16.5 m
2, 20% higher than the average level of the irrigation district. There were also natural ecological landscapes in this area, including Yanming Lake, and the ecological environment was favorable. Water conservancy projects and water-saving facilities and measures were also relatively complete, and the completion rate of supporting water conservancy projects exceeded 90%. This area also boasted sound social attributes and balanced ecological–water-saving–social attributes. In comparison, Shangqiu area had grade II groundwater quality, with the best groundwater quality in the study area. In terms of water-saving attributes, its proportion of high-standard farmland reached 85%; in terms of social attributes, its surface water yield coefficient reached 36%, higher than the overall level of the irrigation district. It also had many rivers (such as the Huiji River and the Guohe River), was rich in surface water resources, and conformed to the concept of constructing ecological–water-saving–social composite areas.
Ecological–water-saving composite areas were concentrated in Kaifeng and Zhoukou. The Jialu River and Qingshui River water system networks have been constructed, and coordinated air pollution control has been carried out (the number of days with excellent or good weather conditions per year > 220), so they both had favorable ecological attributes. They served as core areas in the grain security strategy of Henan Province, with their coefficients of effective utilization of farmland irrigation water being 0.84 and 0.71, respectively. With the continuous increase in the proportion of high-standard farmland, their water-saving benefits were also increasing, and the ecological–water-saving attributes were in line with the characteristics of the two areas.
Xuchang area was a representative of water-saving–social composite areas. Relying on the dual regulation of the proportion of water-saving irrigation area (>75%) and water consumption per 10,000 yuan of GDP (<40 m3), it has built an efficient water-saving agricultural system, which highlights the strong coupling relationship between water-saving measures and socioeconomic development. However, it is facing the potential threat posed by a low rural sewage treatment rate to water quality. Generally speaking, the water-saving–social attribute was its main attribute.
To sum up, compared with traditional irrigation districts where the excessive pursuit of water-saving technical indicators has led to ecological degradation, the Zhaokou irrigation district has strengthened ecological protection and given due consideration to social attributes while maintaining water-saving benefits. It is worth noting that, ecological–water-saving–social composite areas, as the functional units with the highest degree of synergy among the three attributes, correspond to the practical value of the theoretical framework of “ecological protection as foundation, empowerment by water saving, and quality improvement from social dimension” [
21]. However, as revealed by spatial statistical analysis, this optimal type only accounted for 3.72% of the total area. This highlights the spatial heterogeneity of the construction of a functional irrigation district and the need to promote the functional radiation of core areas (such as Zhengzhou and Shangqiu) to surrounding areas.


