Abstract
Understanding watershed-scale interactions among landscape patterns, river morphology, and water quality is essential for effective water management. However, quantitative assessment of their coupled effects remains challenging. Utilizing water quality observation data, this study analyzed the independent and interactive influences of landscape pattern and river structure on the water quality of inlet rivers in the Chaohu Lake Basin (CLB) using correlation analysis and partial least squares structural equation modelling (PLS-SEM). The main conclusions are as follows: (1) The river water quality showed significant spatial distribution characteristics, and the northwestern part of the CLB formed a pollution aggregation area. (2) Ammonia nitrogen correlated positively with impervious surfaces but negatively with forest cover and patch cohesion, permanganate index linked positively to water surface but negatively to forest cover, and water temperature exhibited a significant negative correlation with network connectivity. (3) PLS-SEM results showed that both river structure (path coefficient = 0.877, p < 0.001) and landscape pattern (path coefficient = 0.177, p < 0.05) significantly influenced CLB water quality, with river structure having a stronger effect. This study supports source-based water quality control for Chaohu Lake Basin.
1. Introduction
Water quality is an important environmental issue of global concern [1]. River water quality is affected by both natural factors and human activities, with a complex network of interconnected rivers playing a key role in urban water security [2]. With rapid urbanization, there has been a dramatic increase in impermeable surfaces and significant changes in landscape patterns, which have fundamentally altered water flow paths and put significant pressure on river water quality [3]. Chaohu Lake, located downstream of the Yangtze River system, is one of the five largest freshwater lakes in China. For the watershed in which it is located, Chaohu Lake has irreplaceable and important value in terms of social services, economic support, and ecological balance [4]. However, with the rapid development of industrialization and urbanization, excessive discharge of industrial and municipal wastewater has led to serious pollution of Chaohu Lake in recent years. This may result in impediments to local economic development, as well as threats to human health [5,6,7].
Landscape patterns include the overall characteristics of land use patterns, land spatial configurations, and landscape pattern indices and their ecological effects [8]. The multi-scale nature of land-use patterns and differences in spatial and temporal distribution patterns bring uncertainty to the study of river water quality based on land-use patterns [9]. Previous studies have found that forest and grassland areas were positively correlated with river water quality, while water bodies, farmland, and construction land areas were inversely correlated with river water quality [10]. The maximum patch indicators were positively correlated with pollutant concentration and negatively correlated with patch richness density, patch shape, and landscape shape indicators [11]. This suggests that as anthropogenic disturbance of the landscape increases, patch fragmentation decreases, patch richness decreases, and landscape shape becomes homogenized, ultimately leading to increased water pollution [12]. Many studies have considered river channels and networks in plain areas as corridors and networks based on landscape ecology concepts [13]. Consequently, they have explored quantitative and descriptive indicators, such as the water surface ratio, river connectivity and water system fractal, to elucidate their associations with variations in river water quality [14]. All these indicators can be used to describe the features of different water systems and are collectively referred to as “river structure” [15]. River structure usually reflects anthropogenic factors and influences water quality through the hydrological cycle of a basin [16,17]. Ref. [17] showed that river networks have a complex structure, high connectivity, and relatively even distribution and morphology. Important river structure indicators affecting water quality include the water surface ratio (Wp) and multifractal features (∆α, ∆f) while important river connectivity indicators include circuitry (α) and network connectivity (γ). River structure has a more complex effect on water quality than connectivity. Ref. [18] identified a positive correlation between water body area and dissolved oxygen (DO) content as well as permanganate index (CODMn). The above studies have demonstrated from different perspectives that factors such as landscape pattern and river structure can directly or indirectly affect water quality parameters in rivers. However, the mechanism of the compounding effect of multiple factors on water quality is not yet clear [17]. This study focuses on the coupled effects of landscape pattern and river structure to fill the research gap in this area in the region.
Traditional methods such as regression analysis can only reveal the linear relationships between multiple independent variables and dependent variables but overlook the interactions among the factors. Partial least squares structural equation modelling (PLS-SEM) considers not only the direct effects of various factors on the study objectives, but also the interactions among the factors. Compared with traditional multivariate statistical methods like multiple regression, PLS-SEM is able to simultaneously analyze the correlation between structures consisting of multiple variables, clearly showing the strength of correlation between variables [19]. In recent years, PLS-SEM has received a lot of attention in the field of earth sciences [20]. For example, refs. [9,21] used the PLS-SEM method to analyze the compound mechanism of water quality in the Taihu Lake basin. The results show that water quality changes show obvious differential effects under the combined effects of river structural features and hydrodynamics. Specifically, hydrodynamic factors regulate the water quality significantly beyond the influence of river structure, and this finding provides a new theoretical basis for understanding the evolution of water quality in plain river network areas.
Existing studies on the water environment of the Chaohu Lake basin have mostly focused on the effects of landscape patterns [22,23,24]. In addition to the influence of landscape patterns, the influence of river structure on the water quality of Chaohu Lake is also crucial, but the cooperation between landscape patterns, river structure, and water quality in the whole Chaohu Lake basin is still unclear. In this study, we use PLS-SEM to investigate the mechanism of the coupled influence of landscape pattern and river structure on the water quality of inlet rivers in the Chaohu Lake Basin to support the comprehensive management of the watershed’s water environment. Specific objectives include the following: (1) to analyze the spatial characteristics of water quality, river structure, and landscape pattern in the Chaohu Lake Basin, (2) to investigate the correlations between river water quality and landscape pattern as well as river structure, (3) using structural equation modelling to reveal interactions between river structure and landscape patterns and water quality. This study innovatively constructed a coupled analysis framework of landscape pattern and river structure and systematically analyzed the synergistic influence mechanism of the two on water quality for the first time in the Chaohu Lake Basin, which broke through the limitation of traditional studies examining a single driver in isolation and made up for the inadequacy of existing Chaohu Lake Basin research, which is mostly confined to the independent effect of landscape pattern.
2. Materials and Methods
2.1. Overview of the Study Area
Chaohu Lake is located in Anhui Province, China, on the north bank of the lower reaches of the Yangtze River, with geographical coordinates of 30°52′25″–32°7′53″ N, 116°23′59″–118°22′5″ E longitude, and a basin area of 1.35 × 10⁵ km2, accounting for about 9.3% of the total area of Anhui Province. It has a subtropical humid monsoon climate, with a predominantly plain landform and high altitudes in the west and low in the east (Figure 1). Chaohu Lake is one of the five major freshwater lakes in China, with an area of about 769 km2 and an average depth of 2.8 m. The Chaohu Lake Basin is densely populated, accounting for 15.8% of the population of Anhui Province and contributing 29.4% of the Gross Domestic Product (GDP) of Anhui Province, but industrial wastewater, agricultural non-point source pollution, and domestic sewage discharge have a great impact on water quality, seriously damaging the ecological environment in the basin and around Chaohu Lake [24].
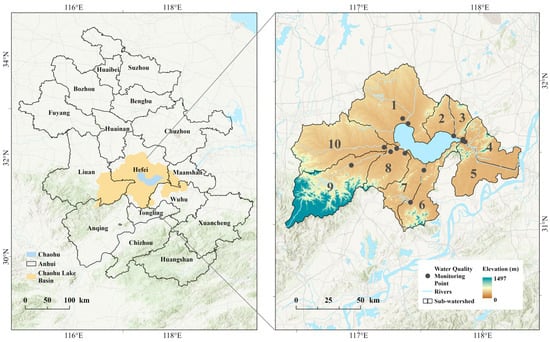
Figure 1.
Overview maps of the study area.
2.2. Data Sources
The data used in this study includes river water quality data, national water system vector maps, land use datasets, and sub-watershed boundary data (Table 1). The river water quality data were provided by the Anhui Ecological Environment Monitoring Centre (https://sthjt.ah.gov.cn/szsjtj/index.html, accessed on 10 June 2024) and contained 11 monitoring indicators such as total nitrogen (TN), ammonia nitrogen (NH3-N), dissolved oxygen (DO), total phosphorus (TP), temperature (T), turbidity (TURB), permanganate index (CODMn), and chemical oxygen demand, etc. In this study, we used the annual average water quality monitoring data for 2023 and selected NH3-N, DO, T, PH, CODMn, and TURB as the main water quality indicators.

Table 1.
Data used in this study.
The river network data is sourced from the 2022 version of the 1:100,000 National Basic Geographical Database (NGCC) from the Natural Resources Ministry’s National Basic Geographical Information Centre. After updating and verifying with 1:50,000 scale topographic maps, the river network density error was controlled within ±5%.
The 2023 land use dataset used in this study is derived from the China 30 m resolution yearly land cover dataset (CLDC) developed by Wuhan University [25] using 335,709 Landsat satellite images (https://zenodo.org/records/12779975, accessed on 15 June 2024). The overall accuracy of the dataset reaches 92.3% after field validation.
The nested sub-watershed boundary data used in this study is from the Hydro BASINS dataset produced based on a Digital Elevation Model (DEM) with a 15-arc-second resolution, which was jointly developed by the International Institute for Applied Systems Analysis and the Worldwide Fund for Nature (https://www.hydrosheds.org/products/hydrobasins, accessed on 20 June 2023). It covers the global landmass except for Antarctica, containing 12 levels of nested sub-watershed polygons and ancillary attribute information [26].
2.3. Methodology
In this study, the water quality of inlet rivers in the Chaohu Lake Basin was taken as the research object, and a multi-source data fusion method was used to determine the scope of the study, based on the data of water quality monitoring sitesprovided by the Anhui Ecological Environmental Monitoring Center; the effective monitoring sites located in the boundary of the Chaohu Lake Basin were extracted through spatial analysis of the Arc GIS 10.8.1. At the same time, the 1:1 million water system data of the National Basic Geographic Information Centre (NBGIC) version 2022 were integrated, and the spatial overlay analysis method was used to screen the main rivers entering the lake that matched the water quality monitoring site so as to ensure that the research object had both hydrological integrity and monitoring data support (Figure 2). Firstly, the sub-watershed unit corresponding to each monitoring site was divided based on the hydrological demarcation principle to provide a clear spatial analysis scope for the study. Secondly, on this basis, Fragstats 4.2 software was used to calculate the landscape pattern indices of each sub-watershed, and the river structure was calculated to quantify the landscape characteristics and hydrographic features of the study area. Thirdly, Pearson correlation analyses were used to screen for key representative indicators with correlations between landscape patterns, river structure, and water quality indicators. Finally, partial least squares structural equation modelling (PLS-SEM) was applied to assess the compounding effects of representative indicators of landscape pattern and river structure on water quality (Figure 2).
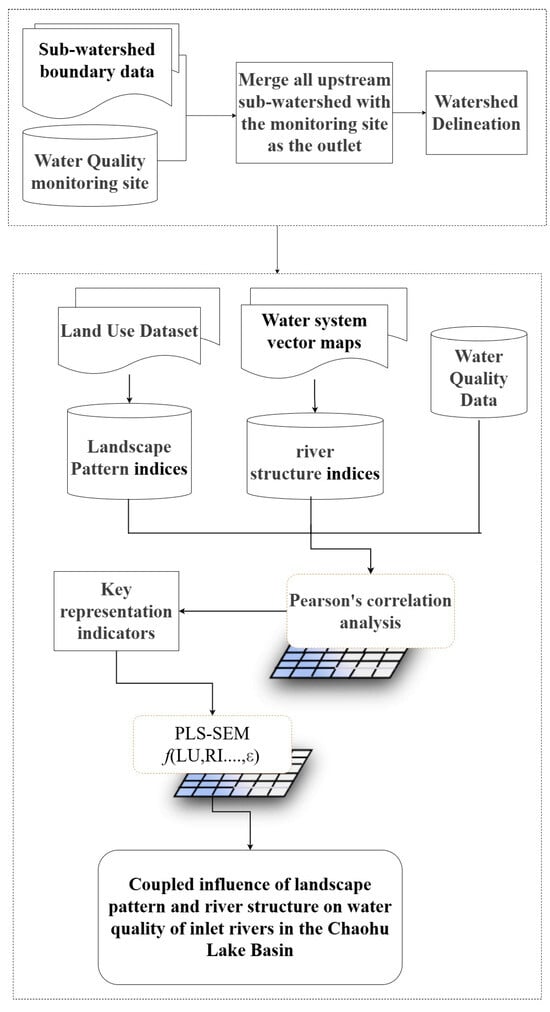
Figure 2.
Flowchart of methodology.
2.3.1. Sub-Watershed Delineation
In this study, the data of water quality monitoring sites in the lake basin were obtained from the Anhui Ecological Environment Monitoring Center, and the effective monitoring sites located within the vector boundary of the Chaohu Lake Basin were extracted by Arc GIS 10.8.1 spatial analysis; based on the distribution characteristics of water quality monitoring sites, the following method was used to construct the sub-watershed unit system of the Chaohu Lake Basin (Figure 1). All sub-watersheds located upstream of each monitoring site location were merged using the location of each monitoring site as an outlet. The merging strategy was constrained by two key conditions: (1) each merged sub-watershed unit had at least one water quality monitoring site and (2) each sub-watershed had an independent and intact hydrological boundary. For sub-watersheds with multiple monitoring sites, water quality indicators were calculated by arithmetic averaging. The process followed the natural hierarchy of upstream and downstream watersheds, and the resulting sub-watershed units were systematically numbered in a clockwise direction, starting from the north.
2.3.2. Calculation of Landscape Pattern Indices
The landscape pattern index, as a key feature of the study of regional landscape pattern and spatial configuration, is a highly condensed spatial analysis index created by transforming complex landscape patterns into quantifiable characteristic parameters through mathematical modelling methods. The multi-dimensional landscape pattern evaluation system constructed in this study mainly discusses landscape fragmentation, landscape aggregation and landscape diversity in a comprehensive manner. Among them, a larger value of landscape fragmentation indicates a higher degree of landscape fragmentation, a larger value of landscape aggregation reflects better physical connection between patches, and a larger value of landscape diversity shows richer landscape types, following [9] (Table 2). These indices were calculated for each sub-watershed based on land use datasets.
Table 2.
Landscape pattern indices.
2.3.3. Calculation of River Structure Indicators
Inlet rivers of the Chaohu Lake Basin were screened based on the 1:1 million water system data of the National Centre for Basic Geographic Information from 2022 and the spatial distribution of water quality monitoring sites in the Chaohu Lake Basin, and the major rivers overlapping with the monitoring sites were finally retained as study objects. This study conducted a quantitative analysis of river network structural characteristics using high-precision national water system vector data of the Chaohu Lake Basin. To investigate the river structure and water quality relationship, we selected six representative structural indicators and analyzed them at the sub-watershed scale across the Chaohu Lake Basin. The methodology comprised three main steps: (1) identification of critical watershed nodes using network analysis, (2) extraction of total river length and tributary count per unit through spatial measurement functions, and (3) computation of six structural indicators (river density, river frequency, water surface ratio, circuits, network connectivity, and edge–node ratio). Detailed definitions and computational formulas for these metrics are provided in Table 3. The Jenks Natural Breaks method was used to classify the river structure parameters into three levels: high, medium, and low.
Table 3.
Definitions of river structure.
2.3.4. Pearson Correlation Analysis
Pearson correlation coefficients were used to quantify the linear correlations between river structure, landscape pattern indices, and water quality indicators. They were obtained by calculating the covariance ratio of the two variables to their standard deviation, where a larger absolute value indicates a higher correlation and its sign represents the direction (positive/negative) of the correlation. Before formal analyses, all variables were first tested for normality using the Shapiro–Wilk test. A significance threshold of α = 0.05 was set for the statistical analyses, and a two-tailed test was used to assess the statistical significance of the correlations [27]. This method can not only identify the strength of linear correlation among environmental factors, but also screen out key river structure and landscape pattern indices that are statistically significantly (p < 0.05) related to water quality indicators.
2.3.5. Partial Least Squares Structural Equation Modelling (PLS-SEM)
Partial least squares structural equation modelling (PLS-SEM) is a predictio
n-oriented statistical analysis method especially suitable for exploratory causal studies and small sample data analysis [28], which consists of a structural model and a measurement model.
The structural model depicts correlations among latent variables, while the measurement model defines correspondences between latent variables and manifest variables. Relationships between variables are represented by one-way arrows to reflect predictive or causal relationships, where the path coefficients of the structural model reflect the extent to which the predictor variables have a direct influence on the explanatory variables, which can be defined as Equation (1),
where is a vector of all latent variables, and the path coefficient (r) indicates the direct effect between the two variables. The strength and direction of the relationship between explanatory variables and response variables are examined through the path coefficient.
The measurement model, also known as the external model, is an explanatory model that comprises both latent variables (Equation (2)) and manifest variables (Equation (3)).
Λ represents the relationship between the manifest and latent variables, while δ and ε represent the measurement errors.
A negative path coefficient indicates a negative correlation between the variables, while the absolute value of the path coefficient reflects the strength of the effect [21]. In this study, based on the results of the Pearson correlation analysis, the key representation indicators were first screened out at the significance level of p < 0.05, and then PLS-SEM was used to construct a comprehensive quantitative model of the relationship between river structure, landscape pattern, and water quality indicators on the basis of the screened indicator data. Two analysis modules were constructed for PLS-SEM. The first one takes each water quality indicator as a latent variable, quantifies the pathways of key representation indicators on water quality indicators, and directly analyzes the mechanisms of interaction among indicators. The second one integrates water quality, river structure, and landscape pattern and constructs a higher-order latent variable model, which reveals the coupling relationships among them.
3. Results and Discussion
3.1. Spatial Analysis of Water Quality in Sub-Watersheds
The water quality indicators in the Chaohu Lake Basin showed obvious spatial heterogeneity (Figure 3). The lower dissolved DO content in the northwestern region may be related to the lower density of the river network, the poor mobility of the water body, and the higher proportion of construction land in the region. The northern sub-watersheds (sub-watersheds 1, 2, and 3) showed significant water quality volatility, and dissolved DO variability was prominent, especially in sub-watershed 1, which fluctuated drastically during the year, and may have been related to seasonal hydrological variations and intermittent pollution inputs; meanwhile, pH was unstable in the region, and the low pH anomalies in sub-watershed 3 imply that there is a risk of acidic geological or industrial pollution. The overall water quality in the southern sub-watersheds (sub-watersheds 6, 7 and 8) was relatively stable, with a concentrated distribution of DO and turbidity maintained at a low level, but the abnormally high ammonia nitrogen in sub-watershed 8 suggests the possible presence of domestic sewage or livestock- and poultry-breeding pollution. The western sub-watersheds (sub-watersheds 9 and 10) showed typical two-sided characteristics: on the one hand, they had better natural water quality conditions (high median DO, low turbidity, stable background value of ammonia nitrogen), reflecting the strong self-purification ability of the water body; on the other hand, the CODMn was significantly high, indicating that there was a risk of industrial organic pollution. The eastern sub-watersheds (sub-watersheds 4 and 5), on the other hand, were significantly characterized by high turbidity, the extremely high values of which may have been closely related to agricultural surface pollution and soil erosion. This pattern of spatial differentiation provides an important basis for differentiated watershed management [21]. Based on a box plot of water quality parameters (Figure 3) and comprehensive analysis of sub-watershed area data, it can be concluded that there is an obvious correlation between watershed area and water quality and an overall pattern of “the smaller the area, the better the water quality; the larger the area, the poorer the water quality”. Specifically, sub-watershed 1 (2561.38 km2) and sub-watershed 10 (1958.40 km2), which are larger in area, had significantly higher concentrations of TURB, CODMn, and NH3-N, with sub-watershed 1 having a median turbidity of about 80 NTU and ammonia nitrogen of about 1.8 mg/L; whereas sub-watershed 3 (330.85 km2), which is smaller in area, had relatively better water quality than sub-watershed 2 and sub-watershed 8 (789.33 km2) and showed better performance in these indicators, e.g., turbidity was only about 20 NTU in sub-watershed 3. DO showed an opposite trend, with low concentrations in large watersheds and high concentrations in small watersheds. Temperature and pH varied less among watersheds, indicating that these parameters are less influenced by area. This difference may stem from the fact that large watersheds are more prone to the accumulation of surface source pollutants, while small watersheds are relatively more self-purifying, but the exact mechanism needs to be thoroughly analyzed in relation to the land use types within the watersheds.
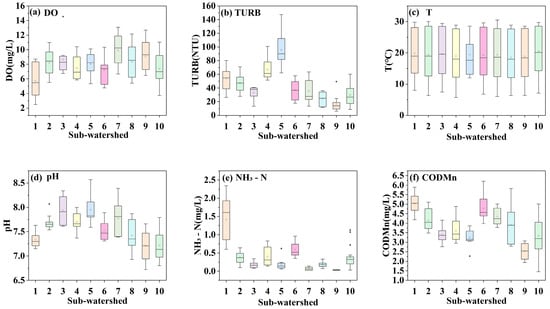
Figure 3.
Box plot of the distribution of water quality indicators in the sub-watersheds; the box represents the interquartile range (IQR), with the lower and upper edges indicating the first quartile and third quartile respectively. The line inside the box denotes the median, and the square indicates the mean.
3.2. Impact of Landscape Pattern on River Water Quality
The landscape of Chaohu Lake Basin shows obvious spatial heterogeneity (Figure 4). Its sub-watersheds can be divided into three categories based on their dominant landscape pattern. Natural vegetation-dominated sub-watersheds (sub-watersheds 4, 6, and 9) are characterized by high forest cover, constituting an important ecological barrier in the watershed. Agricultural production sub-watersheds (sub-watersheds 2, 3, 5, 7, 8 and 10) are dominated by a 40–60% share of farmland in conjunction with a 10–15% distribution of shrubs and bare land, forming a typical agricultural landscape pattern. Urban agglomeration sub-watersheds (sub-watershed 1) have impervious surfaces exceeding 30%, showing significant urbanization characteristics. This spatial gradient of “ecology-agriculture-urbanism” shows that the natural backgrounds of the eastern and western sub-watersheds are well preserved, while the southern sub-watersheds are dominated by agriculture, and the northern sub-watersheds show a clear trend of urban expansion. It is worth noting that the small lakes in sub-watersheds 1, 7, and 9 form a special land–water interface landscape and that the proportion of secondary land types in each region is generally less than 10%, which together reinforce the decisive role of the dominant land-use type in the landscape pattern. This pattern of spatial differentiation clearly reflects regional differences in the intensity of human activities and provides an important basis for the interpretation of landscape patterns in order to analyze the spatial variability of water quality indicators in the watershed [12,27].
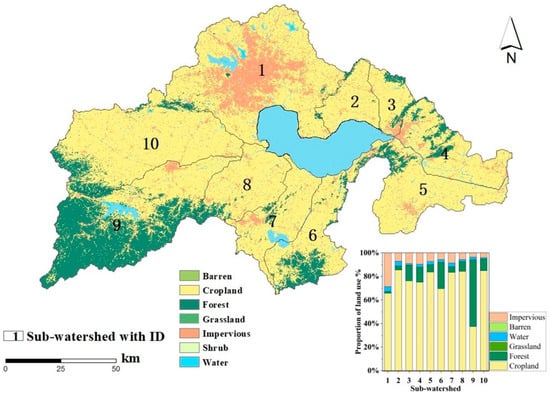
Figure 4.
Proportion of landscape pattern composition of sub-watersheds.
We investigated the influence of watershed landscape patterns on the water quality of inlet rivers in the Chaohu Lake Basin using Pearson correlation analysis (Figure 5). The results showed that water quality indicators were significantly associated with landscape patterns, with DO concentrations positively correlated with Barren and Grassland occupancy and negatively correlated with Cropland occupancy, reflecting the fact that the complexity and homogeneity of the landscape pattern influence DO dynamics by regulating organic matter inputs [12]. Diverse landscapes often have more complex vegetation cover and diverse habitat types, which are conducive to gas exchange between water bodies and the atmosphere, whereas monocultured, highly aggregated arable landscapes may exacerbate oxygen depletion processes in water bodies due to increased inputs of agricultural surface pollution [29]. It was positively correlated with the proportion of Barren and Grassland and negatively correlated with the proportion of Forest, which may be attributed to differences in the absorption and reflection characteristics of solar radiation between different landscape types [30]. This may be due to differences in the absorption and reflection of solar radiation between different landscape types. Bare ground and grassland have lower heat capacities and higher albedo, leading to higher surface temperatures and thus affecting water temperature, while forest canopy reduces the heat exposure of water bodies through shading effects. TURB was positively correlated with the proportion of Water, Impervious and Cropland and negatively correlated with the proportion of Forests, Barren and Grassland, a phenomenon that reveals the key role of landscape patterns in regulating sediment transport. Highly fragmented landscape patterns promote sediment transport to water bodies by increasing surface runoff connectivity, with rapid runoff from impervious surfaces and soil disturbance from cropland being the main contributing factors, while forest vegetation plays a turbidity-reducing role by intercepting runoff and fixing soil, and bare land and grassland play a joint role in reducing the erosive power of runoff.
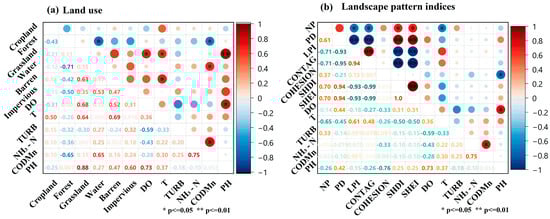
Figure 5.
Correlation analysis between water quality indicators and landscape pattern.
The correlation analysis between landscape pattern indices and water quality showed that PH was positively correlated with SHDI, SHEI, and PD, and negatively correlated with COHESION and NP, which may be because areas of high landscape diversity usually contain more vegetation cover and wetland systems that can regulate the acid–base balance of water bodies through the secretion of organic acids by the root system and the activities of microorganisms, as well as promote the biodegradation of pollutants; high NH3-N concentration showed a significant negative correlation with COHESION, which is likely due to the fact that large monoculture landscapes (e.g., intensive farmland or urban built-up areas) can input a large amount of nitrogenous pollutants through surface runoff, and at the same time, lack sufficient buffer zones for nitrogen retention and conversion, resulting in ammonia nitrogen in rivers. TURB is positively correlated with NP and COHESION but negatively correlated with PD, a phenomenon that can be explained from two perspectives: on the one hand, a high level of anthropogenic landscape fragmentation can exacerbate soil disturbance and erosion; on the other hand, small patch density (high PD) may form an effective sediment filtering system, whereas contiguous developed areas (high COHESION) promote suspended sediment inputs due to increased surface exposure. Water temperature (T) was negatively correlated with diversity index and positively correlated with LPI, reflecting the fact that large areas of continuous vegetation (e.g., forests) can effectively regulate water temperatures through shading and transpiration, whereas fragmented landscapes contribute to higher water temperatures due to the heat island effect and lack of vegetation cover. The mechanism of dissolved oxygen exchange was positively correlated with landscape diversity possibly stemming from diverse ecosystems supporting richer aquatic communities that add oxygen through photosynthesis and turbulence, whereas the negative correlation with cropland and aggregation may reflect oxygen depletion by organic matter due to agricultural surface source pollution.
3.3. Impact of River Structure on Water Quality
The river structure of the Chaohu Lake Basin showed significant spatial heterogeneity (Figure 6). The Rd was overall homogeneously distributed in the middle range, and the high values in the southern part of the watershed confirmed the high development of the river network in this area. High β in sub-watershed 8 originated from the topological complexity formed by dense river branching, which significantly exacerbated the risk of pollutants spreading in multiple paths. Low β in the southern part of the basin was closely related to the sparseness of the river corridor. The distribution of high α values in the west highlights the locational specificity of the pollutant transport probability among nodes and forms spatial differentiation with the high-value area of Rf in sub-watershed 2 in the north, which reveals the differentiation pattern of watershed pollutant transport pathways. The spatial pattern showed that the southeastern part of the Rf indicators was dominated by medium and high values, and the low-value area in the northwestern part was less than 12%, which corroborated the active character of the development of the southeastern water system. The northern high-value area of Wp is highly coupled with the distribution of polder water networks and small lakes, especially the southern interfluvial river system in sub-watershed 1, whose water body enrichment effect significantly enhances the dilution efficacy of pollutants and the carrying capacity of transport. The spatial gradient of γ is particularly significant; low γ values in the north reflect the structural stability of the river network, which is conducive to the regulation of pollutant directional transport, while high connectivity in the southeast may trigger the diffusion of pollutants across subsystems. Accordingly, a spatially adapted governance framework is proposed, deploying a multi-scale water quality monitoring network in the high connectivity zone in the southeast, implementing an ecological barrier project in the complex branch reaches in the northwest, and relying on the high Wp zone in the north to strengthen the natural purification function, so as to establish a precise pollution prevention and control system oriented to the topological characteristics of the river network [31].
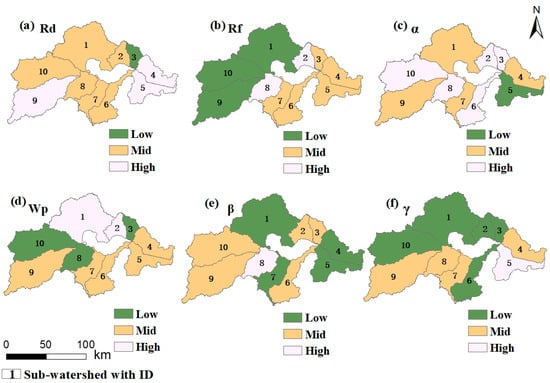
Figure 6.
River structure indicators in sub-watersheds.
Pearson correlation analysis reveals the multifaceted regulatory mechanisms of river structure on water quality (Figure 7). α was significantly positively correlated with DO (r = 0.68), which was consistent with the probabilistic pollutant transfer characteristics characterized by the α indicator, indicating that the complex flow interactions between the river network nodes significantly enhanced the oxygen exchange efficiency at the water–air interface, whereas the negative correlation between γ and DO (r = −0.68) reflected that the highly connected river network might lead to a unitary path of water flow, which could weaken the natural reoxygenation capacity of the water body. Regarding the distribution of NH3-N, it was negatively correlated with Rd and Rf and positively correlated with Wp, suggesting that ammonia nitrogen was imported by agricultural surface pollution through extended water surface. TURB showed a strong negative correlation with α (r = −0.93) and a significant positive correlation with γ, indicating that turbulence promotes the settling of suspended matter, while high connectivity is detrimental to the diffusion of particulate matter. Temperature characterization showed a strong negative correlation (r = −0.94) with γ, highlighting the shading effect of riparian vegetation, while the negative correlation with Rd indicated that the dense river network enhanced water cooling. In addition, the positive correlation between CODMn and Wp (r = 0.64) confirms that the extended water surface accumulates organic pollutants. Based on the above findings, a multi-objective synergistic management framework is proposed, which focuses on optimizing the flow rate threshold to balance the self-purification capacity of the water body and turbidity control and regulating the river network topology to coordinate shading by vegetation with the reoxygenation process in the atmosphere. This framework can provide theoretical support for integrated watershed management and guide practical applications such as ecological restoration of urban rivers, optimal scheduling of water quality in reservoirs, and early warnings on water quality in stormwater runoff [32]. Further studies showed highly significant correlations between Wp, γ, and α and river water quality indicators. Wp directly regulates the sediment transport process through the flow shear force and affects riverbed siltation dynamics. γ characterizes the boundary conditions that change the energy dissipation pattern of the water flow, which determines the stability of the river channel. α, on the other hand, integrates the feedback regulation of hydrodynamic processes by longitudinal river morphology [2].
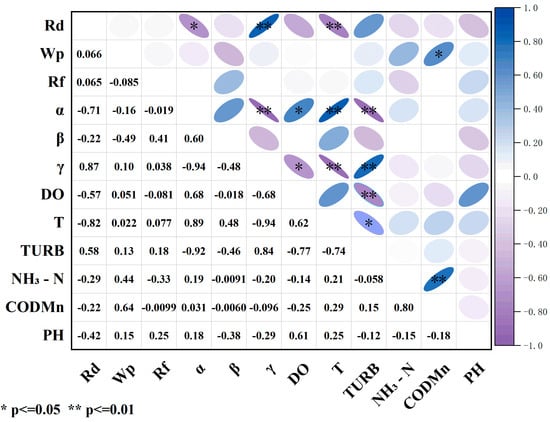
Figure 7.
Correlation coefficient diagram between water quality and river structure.
3.4. Coupled Effects of River Structure and Landscape Pattern on Water Quality
Key representation indicators were selected using Pearson correlation analysis and tested for significance at the p < 0.05 significance level. The indicator data were then analyzed using partial least squares structural equation modelling (PLS-SEM). The variant inflation factor (VIF) of all variables was greater than one (Table 4), indicating that the contribution of each explanatory variable to the model met the statistical requirements. The explanatory power R2 = 0.957 indicates that the exogenous variables collectively explain 95.7% of the variance of the endogenous variables. This result confirms that this study almost completely captures the core drivers of the water quality impact mechanisms (Figure 8). More importantly, the effect sizes (f2) [33] of all pathways exceeded the strong effect threshold of 0.3. This confirms that the predictor variables based on the p < 0.05 screening do have substantial effects on the outcome variables; secondly, this strong relationship may reflect the stabilizing mechanism of action that exists in the study system, where the positive path coefficients characterize the extent to which the predictor variables (river structure, landscape pattern) have a direct effect on water quality in the structural model, and the negative path coefficients indicate a negative correlation.
Table 4.
Validity and reliability analysis.
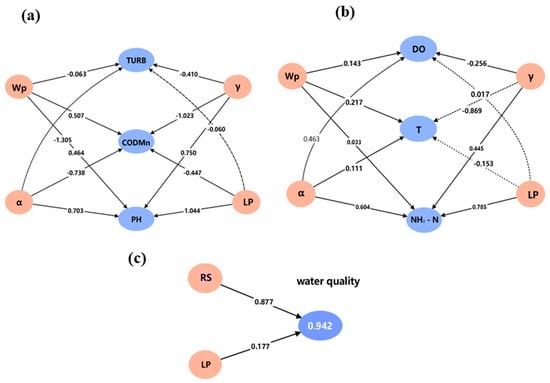
Figure 8.
(a) Effects of river structure and landscape pattern on TURE, CODMn, and PH; (b) effects of river structure and landscape pattern on DO, T, and NH3-N; (c) effects of river structure (RS) and landscape pattern (LP) on overall water quality.
From the results of the PLS-SEM analysis (Figure 8), the path coefficient of α to TURB is −1.305, indicating that α may significantly alleviate the turbidity of the water body. For CODMn, the path coefficient of α to CODMn is −0.738, while that of γ to CODMn is −1.023, demonstrating that both γ and α negatively affect CODMn, with γ exerting a stronger influence; this suggests that a higher water network density may be more beneficial for water quality. The path coefficient of temperature to γ is −0.869, indicating that γ may significantly mitigate water temperature. Meanwhile, the path coefficient of LP to PH is 1.044, demonstrating that LP has a positive promoting effect on PH. The path coefficient of LP on NH3-N is 0.785 and that of α on NH3-N is 0.604, indicating that α has less effect on NH3-N than LP. This result may stem from the significant contribution of ammonia nitrogen in cropland and suggests that landscape pattern has a greater influence than river structure on a single water quality indicator [34].
The PLS-SEM analysis revealed distinct contribution patterns of environmental factors to different water quality parameters. For CODMn, the contribution rates followed the following order: Wp > γ > NP > Cropland. DO was primarily influenced by PD > LPI > γ > Barren > α > Grassland > SHEI. In the case of NH3-N concentrations, the key contributing factors were ranked as PD > Impervious > SHEI > NP > Forest > Grassland > Water. Regarding PH levels, COHESION exhibited the strongest influence, followed by Grassland and Barren. These ordered contribution rates provide quantitative insights into the relative importance of various landscape and hydrological factors in shaping specific water quality characteristics.
The PLS-SEM model revealed the coupled influence of landscape pattern and river structure on water quality of inlet rivers in the Chaohu Lake Basin. The explanatory power of the model on water quality reached 94.2% (R2 = 0.942). The results of the analysis based on the PLS-SEM model (Figure 8c) showed that river structure (RS) had a significant positive driving effect on water quality (path coefficient 0.877), highlighting the central position of optimizing river structure in sub-watershed water quality management. Maintaining the natural morphology of the river channel or enhancing the connectivity of the water system could positively influence the improvement of water quality through mechanisms such as promoting the self-flow of water bodies, enhancing self-purification capacity, and maintaining ecological balance. In contrast, the LP has a relatively limited direct impact on water quality (path coefficient 0.177), which indicates that the sub-watershed landscape pattern can have some positive impact on water quality through trapping surface source pollutants and regulating hydrological processes.
4. Conclusions and Outlook
Based on the water quality monitoring data of the Chaohu Lake Basin, this study analyzed the independent and interactive influence mechanisms of landscape pattern and river structure on the water quality of rivers entering Chaohu Lake Basin, using a combination of correlation analyses and partial least squares structural equation modelling (PLS-SEM). Overall water quality was better in the south than in the north and in the west than in the east. The proportion of imperviousness and the proportion of cultivated land had a negative effect on river water quality, while the proportion of grassland and the proportion of forest had an improving effect on river water quality. Areas with higher landscape diversity tended to have more complex vegetation cover and richer habitat types, which favored gas exchange between water bodies and the atmosphere, whereas monolithic, highly concentrated cropland landscapes may accelerate the process of oxygen depletion in water bodies as a result of increased inputs of agricultural nonpoint source pollution. Increased connectivity of the river network contributed to the improvement of river water quality, whereas a high percentage of impervious surfaces had a negative effect on water quality. These studies based on the PLS-SEM model show that, for the water quality of rivers entering Chaohu Lake Basin, the positive influence of river structure on water quality is significantly stronger than that of landscape pattern, and this strong positive influence mainly stems from its comprehensive role in maintaining river stability and regulating ecological functions. The morphological characteristics and connectivity of the river itself have a significantly stronger influence on water quality than the surrounding landscape pattern.
Since the Chaohu Lake Basin spans four cities with different landscape pattern characteristics, the successful application of this method shows that it has strong generalizability and a high value and can be applied to other watersheds, given that there are enough water quality observation data available. Based on empirical analysis of multiple landscape patterns in the Chaohu Lake Basin, the coupled landscape pattern-river structure analysis method constructed in this study has remarkable scientific universality, but it needs to be adapted to different basin characteristics. It is worth noting that, given the limited scope of the study area, homogenization of the hydrological conditions of the sub-watersheds was assumed to simplify the analysis, without taking into account the significant differences in hydrological characteristics of the sub-watersheds due to geographic and climatic differences [32]. The topography and geomorphology of different sub-watersheds are different, which may significantly affect the water flow rate and catchment area. In addition, uneven spatial and temporal distribution of precipitation and seasonal changes in temperature may have an impact on the water quantity and quality of the river as well as its hydrodynamic conditions, which may affect the conclusions of this study. Moreover, this study did not consider the potential impacts of the water diversion project from the Yangtze River to the Huaihe River on the hydrology and water quality of Chaohu Lake. Through the Yangtze River–Chaohu Lake–Huaihe River water allocation, the water transfer may change the original hydrological rhythm of Chaohu Lake. If it is not properly dispatched, it may disturb the stability of the wetland ecosystem or trigger risk of secondary pollution caused by pollutant inputs from the Yangtze River. In contrast, it could also improve the fluidity of the water body, thus improving its self-purification ability. Follow-up studies will continue to pay attention to the dynamic changes in the water quality of Chaohu Lake under the impact of the water diversion project from the Yangtze River to the Huaihe River.
Author Contributions
Conceptualization, H.Z. and S.W.; methodology, H.Z.; software, H.Z.; validation, H.W., C.H., and H.Z.; formal analysis, H.Z.; investigation, S.W.; resources, C.H.; data curation, H.Z.; writing—original draft preparation, H.Z.; writing—review and editing, S.W. and Y.L.; visualization, H.Z.; supervision, C.H.; project administration, C.H.; funding acquisition, C.H. All authors have read and agreed to the published version of the manuscript.
Funding
This research was funded by the National Natural Science Foundation of China, grant number 42005126 and 42471023, and the College Students’ Innovation and Entrepreneurship Training Program (202510370626).
Data Availability Statement
The water quality data were provided by the Anhui Ecological Environment Monitoring Center (https://sthjt.ah.gov.cn/szsjtj/index.html, accessed on 10 June 2024). The river network data is provided by the Institute of Geographic Sciences and Natural Resources Research, Chinese Academy of Sciences. The land use dataset used in this study is derived from the China 30 m resolution yearly land cover dataset (CLDC) developed by Wuhan University (https://zenodo.org/records/12779975, accessed on 15 June 2024). Datasets will be made available from the corresponding author on reasonable request.
Acknowledgments
During the preparation of this manuscript/study, the authors used DeepSeek-V3 for the purposes of language editing. The authors have reviewed and edited the output and take full responsibility for the content of this publication.
Conflicts of Interest
The authors declare no conflicts of interest.
Abbreviations
The following abbreviations are used in this manuscript:
| CLB | Chaohu Lake Basin |
| CODMn | Permanganate index |
| COHESION | Patch cohesion index |
| CONTAG | Contagion |
| DO | Dissolved oxygen |
| LPI | Largest patch index |
| NH3-N | Ammonia nitrogen |
| NP | Number of patches |
| PD | Patch density |
| PLS-SEM | Partial least squares structural equation modelling |
| Rd | River density |
| Rf | River frequency |
| SHDI | Shannon diversity |
| SHEI | Shannon evenness index |
| T | Temperature |
| TN | Total nitrogen |
| TP | Total phosphorus |
| TURB | Turbidity |
| Wp | Water surface ratio |
| α | Circuits |
| β | Edge–node ratio |
| γ | Network connectivity |
References
- Nguyen, G.T.; Truong, D.H. Risks of Surface Water Pollution in Southern Vietnam. Civ. Eng. J. 2023, 9, 2725–2735. [Google Scholar] [CrossRef]
- Shi, Y.; Yang, Y.; Zhao, J.; Li, X.; Yu, J.; Qian, G. Changes in Reticular River Network under Rapid Urbanization: A Case of Pudong New Area, Shanghai. Water 2022, 14, 523. [Google Scholar] [CrossRef]
- Oswald, C.J.; Kelleher, C.; Ledford, S.H.; Hopkins, K.G.; Sytsma, A.; Tetzlaff, D.; Toran, L.; Voter, C. Integrating urban water fluxes and moving beyond impervious surface cover: A review. J. Hydrol. 2023, 618, 129188. [Google Scholar] [CrossRef]
- Xi, S.; Liu, G.; Zhou, C.; Wu, L.; Liu, R. Assessment of the sources of nitrate in the Chaohu Lake, China, using a nitrogen and oxygen isotopic approach. Environ. Earth Sci. 2015, 74, 1647–1655. [Google Scholar] [CrossRef]
- Yang, X.; Cui, H.; Liu, X.; Wu, Q.; Zhang, H. Water pollution characteristics and analysis of Chaohu Lake basin by using different assessment methods. Environ. Sci. Pollut. Res. 2020, 27, 18168–18181. [Google Scholar] [CrossRef]
- Yu, H.; Xi, B.; Jiang, J.; Heaphy, M.J.; Wang, H.; Li, D. Environmental heterogeneity analysis, assessment of trophic state and source identification in Chaohu Lake, China. Environ. Sci. Pollut. Res. 2011, 18, 1333–1342. [Google Scholar] [CrossRef]
- Xi, S.-S.; Zhou, C.-C.; Liu, G.-J.; Wu, L.; Wang, P.-H. Spatial and Temporal Distributions of Nitrogen and Phosphate in the Chaohu Lake. Huan Jing Ke Xue = Huanjing Kexue 2016, 37, 542–547. [Google Scholar]
- Liu, J.; Liu, X.; Wang, Y.; Li, Y.; Jiang, Y.; Wang, M.; Wu, J. Landscape pattern at the class level regulates the stream water nitrogen and phosphorus levels in a Chinese subtropical agricultural catchment. Agric. Ecosyst. Environ. 2020, 295, 106897. [Google Scholar] [CrossRef]
- Wu, D.; Zheng, L.; Wang, Y.; Gong, J.; Li, J.; Chen, Q. Dynamics in construction land patterns and its impact on water-related ecosystem services in Chengdu-Chongqing urban agglomeration, China: A multi-scale study. J. Clean. Prod. 2024, 469, 143022. [Google Scholar] [CrossRef]
- Ren, W.; Wu, X.; Ge, X.; Lin, G.; Feng, L.; Ma, W.; Xu, D. Study on the Water Quality Characteristics of the Baoan Lake Basin in China under Different Land Use and Landscape Pattern Distributions. Int. J. Environ. Res. Public Health 2022, 19, 6082. [Google Scholar] [CrossRef]
- Liang, X.; Pan, Y.; Li, C.; Wu, W.; Huang, X. Evaluating the Influence of Land Use and Landscape Pattern on the Spatial Pattern of Water Quality in the Pearl River Basin. Sustainability 2023, 15, 15146. [Google Scholar] [CrossRef]
- Zhang, Y.; Zhao, Y.; Zhang, H.; Cao, J.; Chen, J.; Su, C.; Chen, Y. The Impact of Land—Use Composition and Landscape Pattern on Water Quality at Different Spatial Scales in the Dan River Basin, Qin Ling Mountains. Water 2023, 15, 3276. [Google Scholar] [CrossRef]
- Xu, Q.Y.; Wang, P.; Shu, W.; Ding, M.J.; Zhang, H. Influence of landscape structures on river water quality at multiple spatial scales: A case study of the Yuan river watershed, China. Ecol. Indic. 2021, 121, 107226. [Google Scholar] [CrossRef]
- Liu, Y.; Zhang, H.; Zeng, P.; Wang, Y.; Li, G.; Sun, F.; Che, Y. Linking hydraulic geometry, land use, and stream water quality in the Taihu Basin, China. Environ. Monit. Assess. 2021, 193, 484. [Google Scholar] [CrossRef]
- Yu, Z.; Wang, Q.; Xu, Y.; Lu, M.; Lin, Z.; Gao, B. Dynamic impacts of changes in river structure and connectivity on water quality under urbanization in the Yangtze River Delta plain. Ecol. Indic. 2022, 135, 108582. [Google Scholar] [CrossRef]
- Zimmer, M.A.; Burgin, A.J.; Kaiser, K.; Hosen, J. The unknown biogeochemical impacts of drying rivers and streams. Nat. Commun. 2022, 13, 4. [Google Scholar] [CrossRef]
- Wang, Y.; Wang, W.; Liu, L.; Wang, R.; Tang, X.; Li, Y.; Li, X. Spatial heterogeneity of the effects of river network patterns on water quality in highly urbanized city. Sci. Total Environ. 2024, 937, 173549. [Google Scholar] [CrossRef]
- Deng, X.J.; Xu, Y.P.; Han, L.F. Impacts of human activities on the structural and functional connectivity of a river network in the Taihu Plain. Land Degrad. Dev. 2018, 29, 2575–2588. [Google Scholar] [CrossRef]
- Urbach, N.; Ahlemann, F. Structural equation modeling in information systems research using Partial Least Squares. J. Inf. Technol. Theory Appl. 2010, 11, 2. [Google Scholar]
- Ahmed, M.F.; Mokhtar, M.B.; Alam, L. Factors influencing people’s willingness to participate in sustainable water resources management in Malaysia. J. Hydrol. Reg. Stud. 2020, 31, 100737. [Google Scholar] [CrossRef]
- Peng, S.; Wu, P.; Lu, Y.; Chen, L.; Wang, Z.; Lu, Y. Influence of river structure and hydrodynamics on water quality in the upper Taihu Basin, China. J. Clean. Prod. 2024, 453, 142262. [Google Scholar] [CrossRef]
- Cai, Y.J.; Wei, J.H.; Zhang, S.Y.; Wang, X.L.; Zhang, Z.M.; Gao, J.F. Spatial Risk Assessment and Source Identification of Heavy Metals in Riverine Sediments of Lake Chaohu Basin, China. Ecosyst. Health Sustain. 2023, 9, 0040. [Google Scholar] [CrossRef]
- Lu, S.; Wu, L.; Guan, H.; Hu, X.; Yang, B.; Luo, W.; Xu, Z.; Zhang, Y.; Liu, B.; Cai, W. Geochemical sedimentary records of eutrophication and environmental change in Chaohu Lake, East China. Open Geosci. 2024, 16, 20220649. [Google Scholar] [CrossRef]
- Chang, W.; Xu, S.-D.; Liu, T.; Wu, L.-L.; Liu, S.-T.; Liu, G.; Sun, J.; Luo, Y.-X.; Gao, L.; Li, H.; et al. Risk prioritization and experimental validation of per- and polyfluoroalkyl substances (PFAS) in Chaohu Lake: Based on nontarget and target analyses. J. Hazard. Mater. 2025, 492, 138179. [Google Scholar] [CrossRef]
- Yang, J.; Huang, X. The 30 m Annual Land Cover Datasets and Its Dynamics in China from 1985 to 2023. 2024. Available online: https://zenodo.org/records/8176941 (accessed on 15 June 2024).
- Lehner, B.; Grill, G. Global river hydrography and network routing: Baseline data and new approaches to study the world’s large river systems. Hydrol. Process. 2013, 27, 2171–2186. [Google Scholar] [CrossRef]
- Zhang, M.; Li, W.; Zhang, L.; Jin, H.; Mu, Y.; Wang, L. A Pearson correlation-based adaptive variable grouping method for large-scale multi-objective optimization. Inf. Sci. 2023, 639, 118737. [Google Scholar] [CrossRef]
- Leveque, J.G.; Burns, R.C. A Structural Equation Modeling approach to water quality perceptions. J. Environ. Manag. 2017, 197, 440–447. [Google Scholar] [CrossRef] [PubMed]
- Ahmad, W.; Iqbal, J.; Nasir, M.J.; Ahmad, B.; Khan, M.T.; Khan, S.N.; Adnan, S. Impact of land use/land cover changes on water quality and human health in district Peshawar Pakistan. Sci. Rep. 2021, 11, 16526. [Google Scholar] [CrossRef]
- Coffey, R.; Benham, B.; Wolfe, M.L.; Dorai-Raj, S.; Bhreathnach, N.; O’Flaherty, V.; Cormican, M.; Cummins, E. Sensitivity of streamflow and microbial water quality to future climate and land use change in the West of Ireland. Reg. Environ. Chang. 2016, 16, 2111–2128. [Google Scholar] [CrossRef]
- Deng, X.J. Correlations between water quality and the structure and connectivity of the river network in the Southern Jiangsu Plain, Eastern China. Sci. Total Environ. 2019, 664, 583–594. [Google Scholar] [CrossRef] [PubMed]
- Parker, G.T.; Droste, R.L.; Rennie, C.D. An objective test of stochastic behavior in riverine water quality models. Water Sci. Technol. 2009, 59, 159–165. [Google Scholar] [CrossRef] [PubMed]
- Liu, Y.; Du, Y. The Effect of Generative AI Ethics on Users’ Continuous Usage Intentions: A PLS-SEM and fsQCA Approach. Int. J. Hum.-Comput. Interact. 2025; early access. [Google Scholar] [CrossRef]
- Liu, C.; Zhang, F.; Wang, X.; Chan, N.W.; Rahman, H.A.; Yang, S.; Tan, M.L. Assessing the factors influencing water quality using environment water quality index and partial least squares structural equation model in the Ebinur Lake Watershed, Xinjiang, China. Environ. Sci. Pollut. Res. 2022, 29, 29033–29048. [Google Scholar] [CrossRef] [PubMed]
Disclaimer/Publisher’s Note: The statements, opinions and data contained in all publications are solely those of the individual author(s) and contributor(s) and not of MDPI and/or the editor(s). MDPI and/or the editor(s) disclaim responsibility for any injury to people or property resulting from any ideas, methods, instructions or products referred to in the content. |
© 2025 by the authors. Licensee MDPI, Basel, Switzerland. This article is an open access article distributed under the terms and conditions of the Creative Commons Attribution (CC BY) license (https://creativecommons.org/licenses/by/4.0/).