1. Introduction
Water, an indispensable resource for all life forms, plays a pivotal role in sustaining ecosystems, supporting human activities, and ensuring public health. However, the looming threat of climate change poses a significant risk to both the availability and quality of water [
1]. Changes in precipitation patterns, directly linked to climate change, are anticipated to exacerbate water scarcity, affecting millions of people in the forthcoming decades [
2]. To address the depletion of freshwater resources and tackle water stress stemming from changing climate conditions, untreated wastewater is increasingly being utilized in agriculture [
3]. Regrettably, this practice contributes to pollution and poses risks to both the environment and human health, as untreated wastewater sourced from various sectors contains contaminants such as heavy metals associated with ecological toxicity [
4,
5]. Presently, an alarming 400 billion cubic meters of wastewater are generated globally each year, with only 24% undergoing treatment before discharge or reuse in agriculture [
6]. To tackle the magnitude of this issue, it is imperative to treat wastewater as a valuable resource for efficient utilization in urban and agricultural settings. This approach not only curtails water wastage but also eases the strain on freshwater sources. Enhancing wastewater treatment becomes crucial in mitigating the adverse impacts on water resources, ecosystems, and public health [
7]. The utilization of biochar as a cost-effective sorbent to eliminate metallic contaminants from aqueous solutions is an emerging and promising wastewater treatment technology, as evidenced by previous studies [
8,
9,
10,
11]. The adsorption treatment of polluted water using biochar as an adsorbent demonstrates a high removal efficiency with respect to heavy metals [
12].
Copper (Cu
2+) was selected as a representative heavy metal ion due to its widespread occurrence in natural and anthropogenic environments. It is continuously introduced into ecosystems through industrial discharge from processes such as electroplating, mining, metal finishing, and the production of pesticides and fertilizers. These activities often lead to the contamination of aquatic systems, where Cu
2+ can enter the food chain and pose significant health risks to humans and other organisms. Excessive levels of Cu
2+ in the environment are associated with severe ecological and health hazards. In humans, prolonged or high-level exposure to Cu
2+ can lead to adverse effects such as severe headaches, kidney damage, nausea, hypoglycemia, and disorders like Wilson’s disease and Menkes syndrome. Given these detrimental effects, it is crucial to develop effective methods for the removal of Cu
2+ from contaminated environments to mitigate its negative impacts on both ecosystems and public health [
13,
14,
15].
Biochar from various feedstocks, including sawdust, paddy husk, coconut husk, and seaweed, has been utilized to remove copper from aqueous solutions under different conditions. Biochar was applied in both modified and non-modified forms and subjected to varying pyrolysis and adsorption conditions, resulting in diverse adsorption capacities. Acid-modified biochar derived from coconut husk exhibited an adsorption capacity of 175.44 mg/g for copper, while biochar derived from seaweed demonstrated a higher adsorption capacity of 223 mg/g for this pollutant. This shows the influence of feedstock type, modification processes, and pyrolysis conditions on the adsorption performance of biochar for copper removal [
13,
16,
17].
Incorporating kitchen waste as a biochar feedstock presents significant environmental advantages aligned with circular economy principles and sustainable waste management practices. Globally, approximately 1.3 billion tons of food waste are generated each year from human consumption [
18]. Utilizing organic residues such as fruit and vegetable peels and coffee grounds helps divert biodegradable waste from landfills, thereby reducing methane emissions—a potent greenhouse gas. Additionally, this approach lessens the burden on landfills by mitigating issues related to odor, germ proliferation, and leachate generation. It also reduces harm to wildlife, including birds and cattle, by minimizing their exposure to improperly disposed waste [
18].
The selection of activation methods is critical for optimizing biochar’s physicochemical properties and adsorption performance, particularly in heavy metal removal applications. Acidic activation is generally preferred over alkaline treatments for water purification and soil amendment [
19]. In this study, sulfuric acid, phosphoric acid, and silver nitrate were evaluated for their efficacy in enhancing copper adsorption [
20]. Sulfuric acid (H
2SO
4) activation introduces sulfonic groups that increase surface acidity and electrostatic attraction to Cu
2+ ions, significantly improving adsorption capacity [
21]. It also enhances porosity in biochars derived from agro-industrial residues; however, excessive acid treatment may degrade the carbon structure, compromising long-term stability [
22]. Phosphoric acid (H
3PO
4) is an environmentally safer alternative that promotes mesoporosity and introduces phosphorus-containing functional groups beneficial for metal binding [
23]. Over-impregnation, however, may form a polyphosphoric acid layer that obstructs pores and reduces surface area [
23]. Silver nitrate introduces silver nanoparticles that modify surface chemistry and impart antimicrobial properties, potentially enhancing adsorption [
24]. The effectiveness of each method depends on feedstock, pyrolysis parameters, and target contaminants. Thus, activation strategies must be carefully optimized to balance performance, environmental impact, and structural integrity.
In this study, biochar was produced from a unique blend of kitchen waste components—orange peels, banana peels, potato peels, and coffee residue to evaluate its effectiveness in copper removal from aqueous solutions under varying experimental conditions. Seven key parameters were systematically investigated for their influence on the adsorption process: initial copper concentration (50–250 ppm), biochar dosage (0.5–2.5 g), contact time (30 min to 29 h), temperature (20–80 °C), pH (2.67–8.07), and the performance of activated versus non-activated biochar. Biochar activation was conducted using phosphoric acid (H3PO4), silver nitrate, and sulfuric acid (H2SO4), and silver nitrate-modified biochar was synthesized to compare the adsorption performance of modified versus unmodified materials. Comprehensive physicochemical characterization was performed before and after each modification to assess the effects on adsorption properties.
The approach of this work lies in the new combination of biochar feedstocks derived entirely from household organic waste (kitchen waste) and the specific blend used, which has not been previously reported, and the manner in which the effectiveness of biochar for pollutant removal is influenced by its physicochemical properties and factors like temperature, flow rate, pH, and contact time. Furthermore, the wide range of adsorption conditions explored, including simultaneous assessment of multiple activation agents and detailed parametric variation, provides new insights into the optimization of low-cost, sustainable biochars for copper removal.
2. Materials and Methods
2.1. Biochar Characteristics
2.1.1. Materials
All chemical reagents utilized in this study were of analytical grade. Phosphoric acid (H3PO4, 85%) and sulfuric acid (H2SO4, 95%) were sourced from UNI-CEM Pvt. Ltd., Punjab, India. Silver nitrate (AgNO3, molecular weight 169.88 g/mol, purity 99.8%) was also obtained from UNI-CEM Pvt. Ltd., Punjab, India. Sodium hydroxide (NaOH) pellets (purity 98%) were supplied by Alfa Aesar GmbH & Co., Karlsruhe, Germany, while ethanol (95% laboratory grade) was procured from Sigma-Aldrich Chemie GmbH, Taufkirchen, Germany.
2.1.2. Biochar Preparation
The experiment utilized different biomass types collected from local markets in Beirut, Lebanon, during the winter of 2023. These included banana peels, potato peels, orange peels, and coffee grounds sourced from a local coffee shop. Pretreatment and pyrolysis of the biomass followed the methodology described by Kataya et al. (2023) [
25]. Biochar modification treatments with H
3PO
4, H
2SO
4, and silver nitrate are detailed in the
Supplementary Materials Section S1 [
26,
27].
2.1.3. Biochar Characterization
Biochar characterization involved a comprehensive method encompassing both chemical and physical traits. The analysis included Raman spectroscopy, Brunauer–Emmett–Teller (BET), Fourier transform infrared spectroscopy (FTIR), X-ray photoelectron spectroscopy (XPS), zeta potential, and SEM-EDX. Details of the characterization techniques are mentioned in the
Supplementary Materials Section S2.
2.2. Batch Adsorption Experiment
Batch adsorption experiments were conducted in 50 mL glass bottles at room temperature and environmental pressure, with all experiments performed in triplicate and average results reported, including blank solution measurements for quality control. A stock solution of Cu2+ (1000 mg L−1) was prepared by dissolving appropriate amounts of copper sulfate pentahydrate (CuSO4·5H2O) in ultra-pure water, with different factors studied to evaluate their impact on biochar adsorption capacity. The pH was maintained at 4.05 throughout the experiments.
Seven factors were systematically studied to evaluate their influence on the adsorption efficiency of biochar for copper ions. For each factor, only the parameter under investigation was varied, while all other experimental conditions were kept constant to ensure accurate assessment of its individual effect. The general experimental setup involved batch adsorption in 50 mL glass bottles, with shaking at 220 rpm under ambient pressure. Unless otherwise stated, the default conditions were as follows: biochar dose of 0.5 g per 50 mL, solution pH of 4.05 (as measured without adjustment), initial Cu2+ concentration of 100 ppm, ambient temperature (~25 °C), and contact time of 1 h.
Factor 1: Initial metal concentration varied from 50 to 250 ppm, while keeping the biochar dosage at 0.5 g, pH at 4.05, temperature at 25 °C, and contact time at 1 h. Factor 2: Biochar dosage ranged from 0.5 to 2.5 g per 50 mL of solution, with the initial Cu2+ concentration fixed at 100 ppm under the same pH, temperature, and contact time conditions. Factor 3: Contact time was explored over a range from 30 min to 29 h, using 0.5 g biochar and 100 ppm Cu2+ at 25 °C and pH 4.05. Factor 4: Temperature effects were examined at 20 °C, 40 °C, 60 °C, and 80 °C, while maintaining constant values for biochar mass (0.5 g), Cu2+ concentration (100 ppm), pH (4.05), and contact time (1 h). Factor 5: pH was adjusted from 2.67 to 8.07 using 0.1 M H2SO4 or NaOH to study its influence on adsorption efficiency, under the same fixed biochar mass, metal concentration, temperature, and contact time. Factor 6: Biochar type involved comparing the copper removal efficiency of non-activated biochar with that of biochar activated using phosphoric acid (H3PO4), sulfuric acid (H2SO4), and modification with silver nitrate. For this comparison, the experimental setup included a constant biochar dose (0.5 g), pH (4.05), temperature (25 °C), and contact time (1 h), with Cu2+ concentrations ranging from 50 to 200 ppm.
All the samples were shaken for the specified time at 220 rpm and 25 °C to separate the adsorbate from the solution. Samples were then filtered by vacuum filtration and by micro filter paper (0.45 μm) assembly prior to the measurement of the residual metal concentration in each sample by flame atomic absorption spectrometry (FAAS, Rayleigh, WFX-200 AA Spectrophotometer, Beijing, China).
The equilibrium adsorptions of copper by adsorbent were calculated as in Equation (1), as follows:
where qe is the equilibrium adsorption capacity (mg/g); C0 and Ce are the initial and equilibrium copper concentrations in the water (ppm), respectively; V is the volume of water used (L); and m is the mass of the biochar (g).
The removal rate (R) can be calculated as in Equation (2):
2.3. Adsorption Isotherm
The adsorption isotherm was used to describe the linear relationship between the adsorption capacity and the equilibrium concentration of the adsorbents at equilibrium.
The Langmuir and Freundlich models were utilized to investigate isotherm parameters using Equations (3) and (4):
where
Ce and
qe represent the equilibrium concentration (mg/L) of copper solution and equilibrium adsorption capacity (mg/g), respectively,
qm is the maximum adsorption capacity of copper (mg/g),
KL is the Langmuir constant (L/mg), and
KF is the Freundlich constant (L/mg).
3. Results and Discussion
3.1. Biochar Characteristics
3.1.1. Specific Surface Area (BET)
Table 1 illustrates the surface area of various biochar products. Biochar activated with sulfuric acid exhibits the highest surface area at 33 m
2/g, approximately seven times greater than non-modified biochar. However, when silver nitrate was loaded onto biochar, the surface area decreased to 3.37 m
2/g, indicating the occupation of biochar pores by silver particles. This situation was similarly observed by Eltaweil et al. (2022) [
24].
Interestingly, biochar activated with phosphoric acid shows a reduction in surface area instead of an increase. This anomaly could be attributed to errors or structural damage occurring during the activation process. This observation aligns with findings by Peixoto et al. (2021) [
28], where sulfuric acid activation resulted in a smaller surface area compared to the precursor. It was proposed that the reduction in surface area may result from the formation of larger pores during oxidation. This phenomenon is commonly associated with the aggressive nature of oxidizing agents at high concentrations, leading to the degradation of pore walls. In discussing biochar activation, acid treatment stands out for its ability to enhance porosity. While sulfuric acid activation leads to a trade-off between external and micropore areas, phosphoric acid activation produces different effects. Acid treatment significantly increases biochar surface area, pore volume, and functional groups. Moreover, acid quickly diffuses post-pyrolysis, dissociating weakly bonded components and creating new functional groups, both internally and externally, resulting in negatively charged surface areas [
29]. These findings emphasize the potential of acid activation in refining biochar properties, but careful consideration of specific acids and activation conditions is essential for informed application.
3.1.2. XPS
XPS characterization was conducted to determine the chemical composition of the sample (
Table 2). The atomic percentage results obtained by XPS confirmed the successful modification of the biochar. Ag was detected in the biochar-Ag composites, and S was present in the biochar activated by sulfuric acid. It is evident that the non-modified biochar samples lack sulfur (S) and silver (Ag). However, the phosphorus (P) detected in the non-modified biochar likely originates from the raw biomass itself, primarily potato and coffee residues, as indicated by the elemental composition of the initial materials and as confirmed by the literature [
30,
31]. P was absent in the biochar activated by sulfuric acid but was present in minimal amounts in other biochars, attributable to its presence in the original materials. Despite the expectation that the biochar activated by phosphoric acid would exhibit higher levels of P, the results were unexpected due to the degradation of this biochar.
Nevertheless, one of the most important factors affecting the surface area and yield of biochar is the pyrolysis temperature. Usually, high pyrolysis temperatures lower the biochar yield as a result of the enhanced thermal degradation of volatile constituents, but they increase the specific surface area. This growth is a result of decomposition of organic compounds and formation of microporous architectures, as per Chen and Chen (2009) and Rafiq et al. (2016) [
32,
33]. However, it may not always be a straight-line or predictable trend because surface area also depends on feedstock matrix, rate of heating, residence time, and other process conditions. Moreover, characteristics such as lignocellulosic biomass degassing processes might produce lower measured surface areas, as evidenced by Tomczyk et al. (2020) and Ali et al. (2019) [
34,
35].
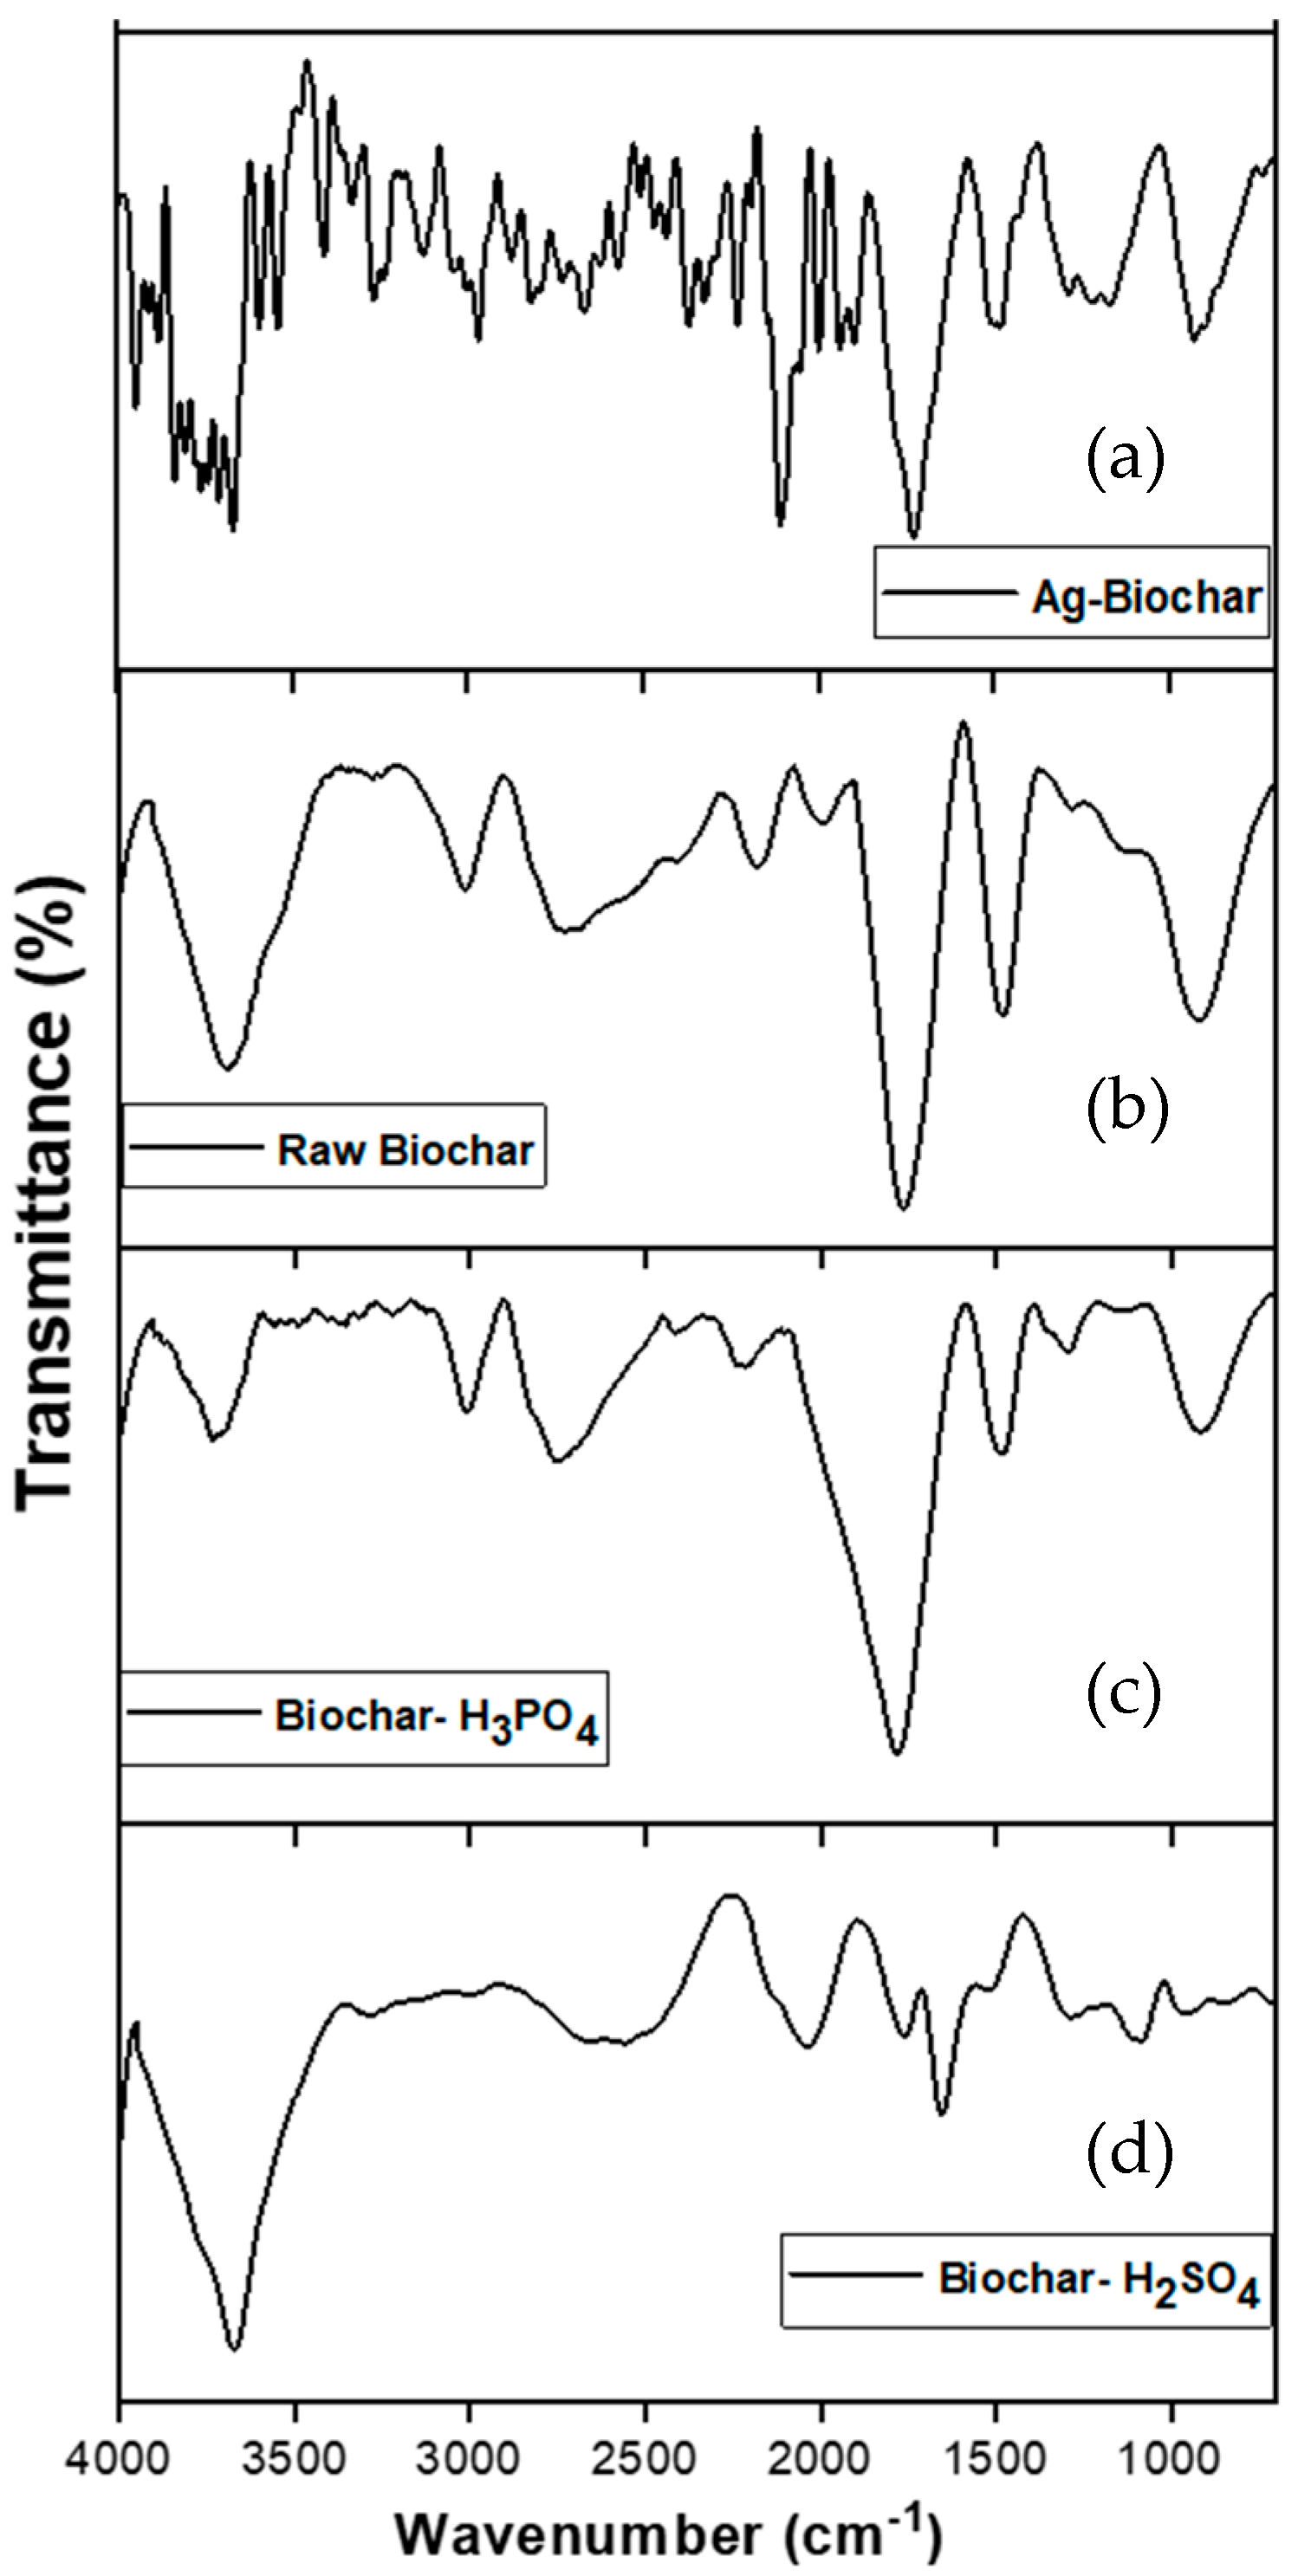
3.1.3. FTIR
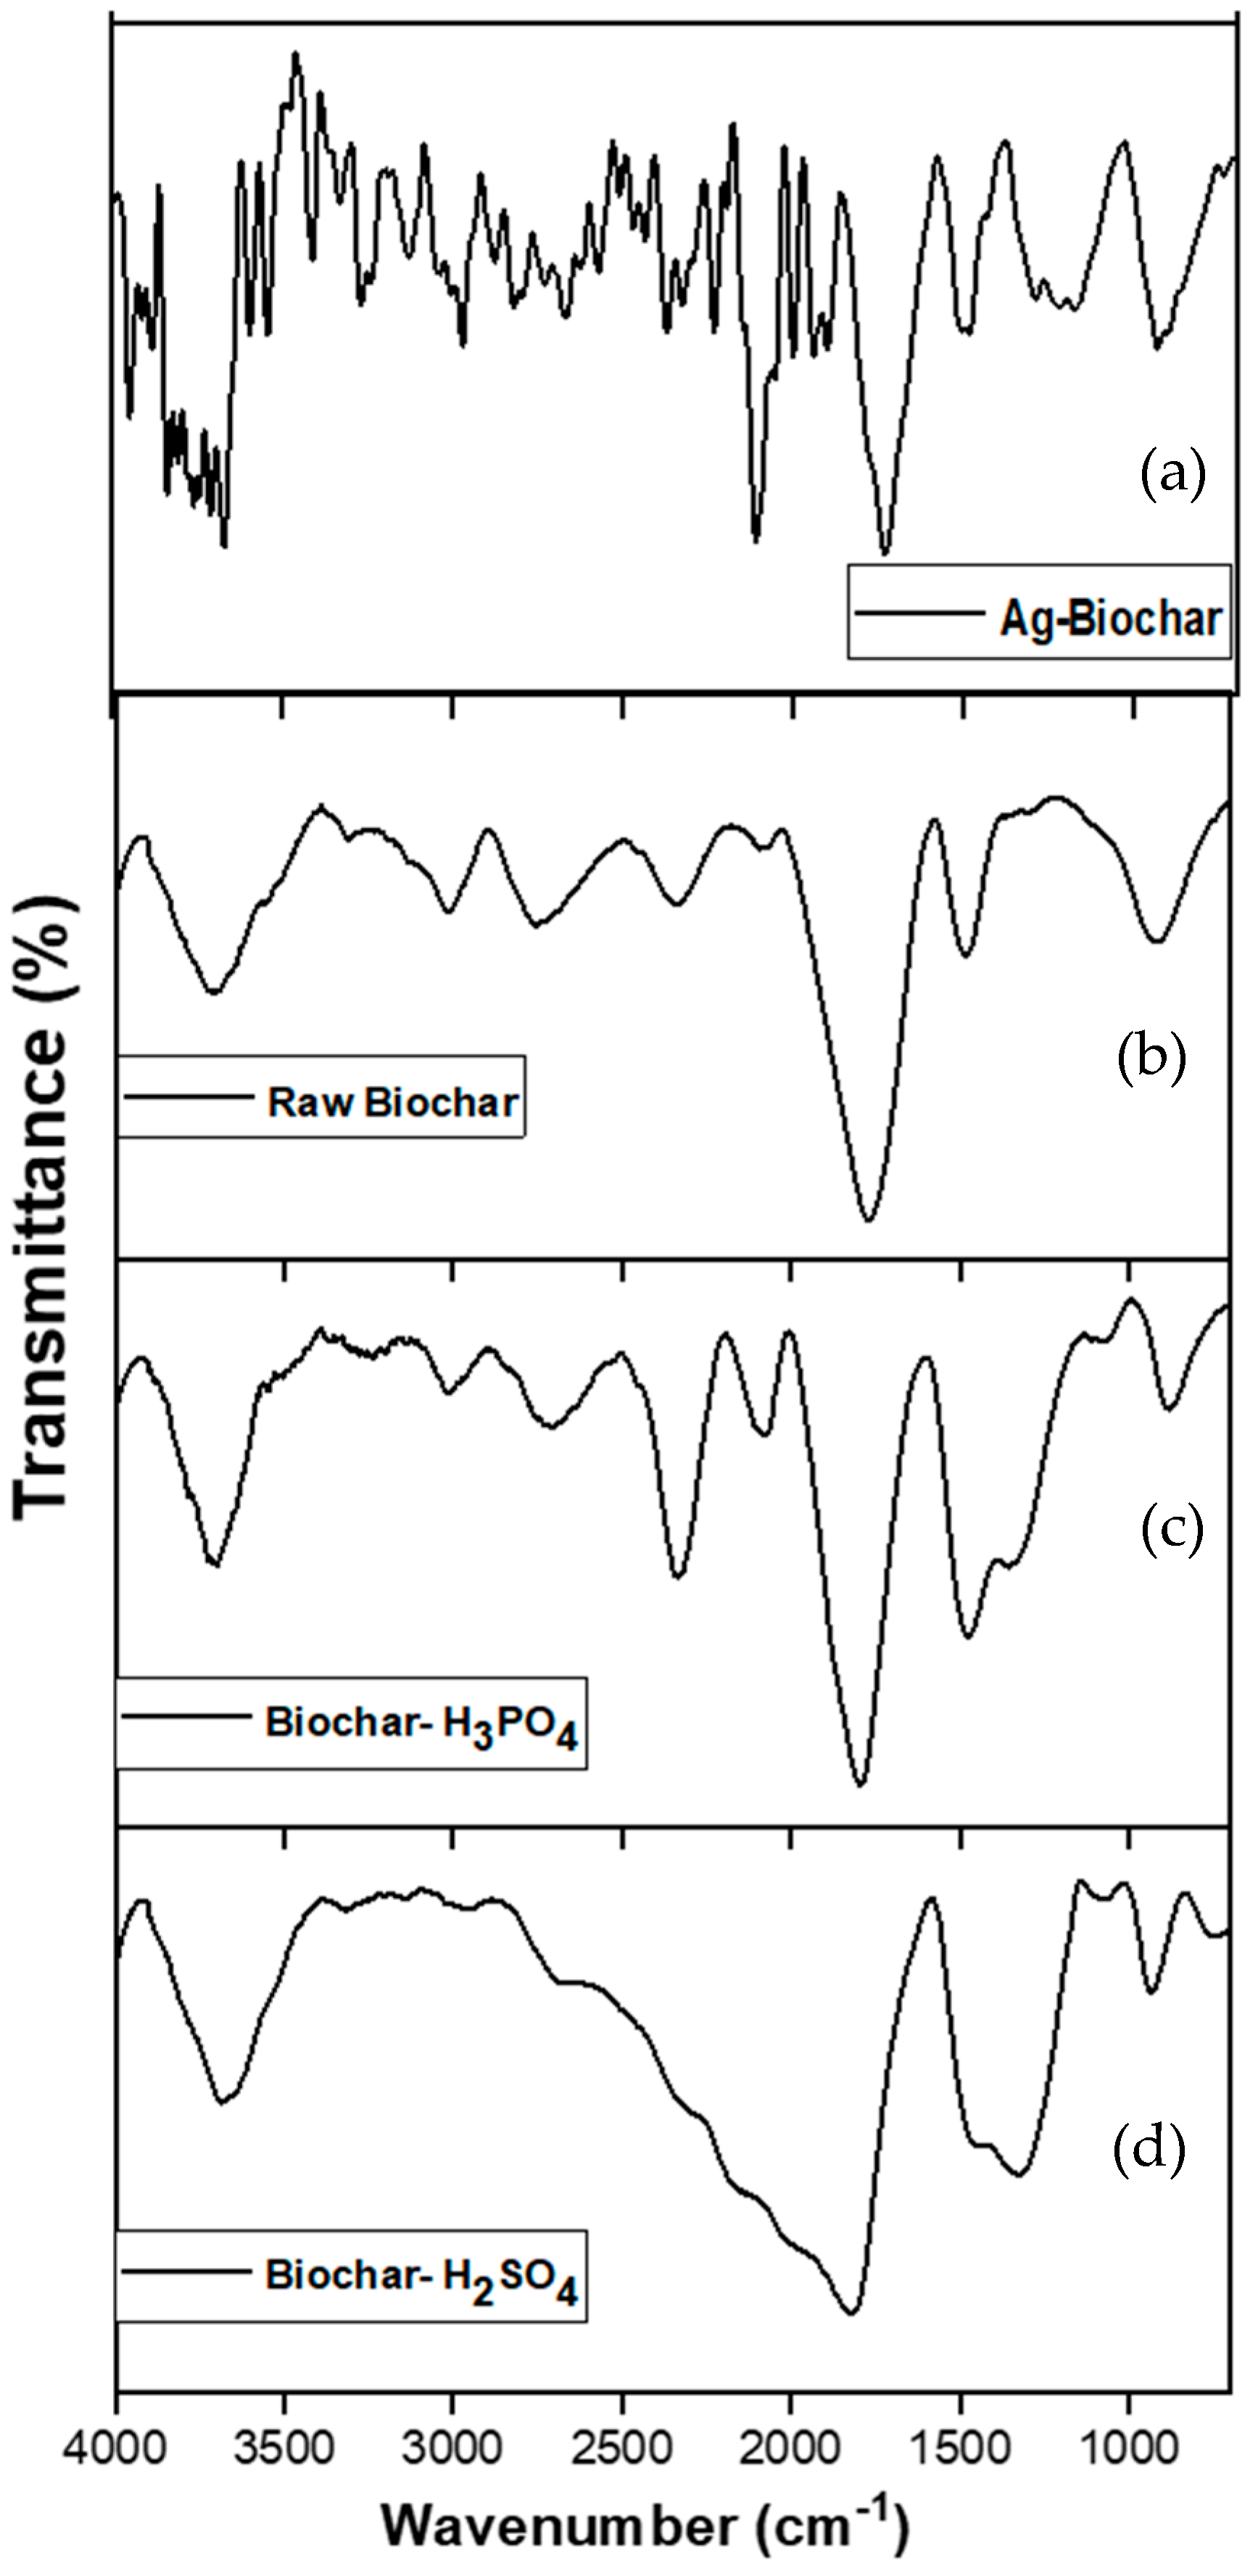
The FTIR spectrum of the biochar samples, observed within the 4000–500 cm
−1 wavelength range, confirmed the complex chemical composition of the biochar. As shown in
Figure 1, the absorbance peak at 3490 cm
−1 is associated with OH stretching vibrations, indicating the presence of alcoholic and phenolic functional groups linked to cellulose, hemicellulose, and lignin in the feedstocks. Additionally, the peak at 2910 cm
−1 corresponds to the aliphatic C–H stretching vibration, suggesting the presence of alkanes derived from various carbohydrate monomers.
The three biochar samples—modified by sulfuric acid, phosphoric acid, and the non-modified biochar—exhibit similar profiles; however, peak intensity shows a change corresponding to each modification. Ag-biochar exhibited irregular peaks, suggesting the incorporation of silver and possible metal–organic interactions. Acid-treated biochar (H
3PO
4 and H
2SO
4) showed distinct new peaks in the 1000–1300 cm
−1 region, corresponding to phosphate (P=O, P-O-C) and sulfate (S=O) functional groups, respectively [
28]. These modifications also altered the intensity of aromatic C=C and hydroxyl (-OH) stretching bands, indicating enhanced surface hydrophilicity and functional group availability, which could improve adsorption properties. Previous studies, including those by Sbizzaro et al. (2021) and Fawzy et al. (2021) [
36,
37], have shown that biochar with higher aromaticity demonstrates enhanced adsorption capacity, improved potential for carbon sequestration, and increased stability in soil. FTIR after copper adsorption is presented in
Section 3.8.
3.1.4. Zeta Potential
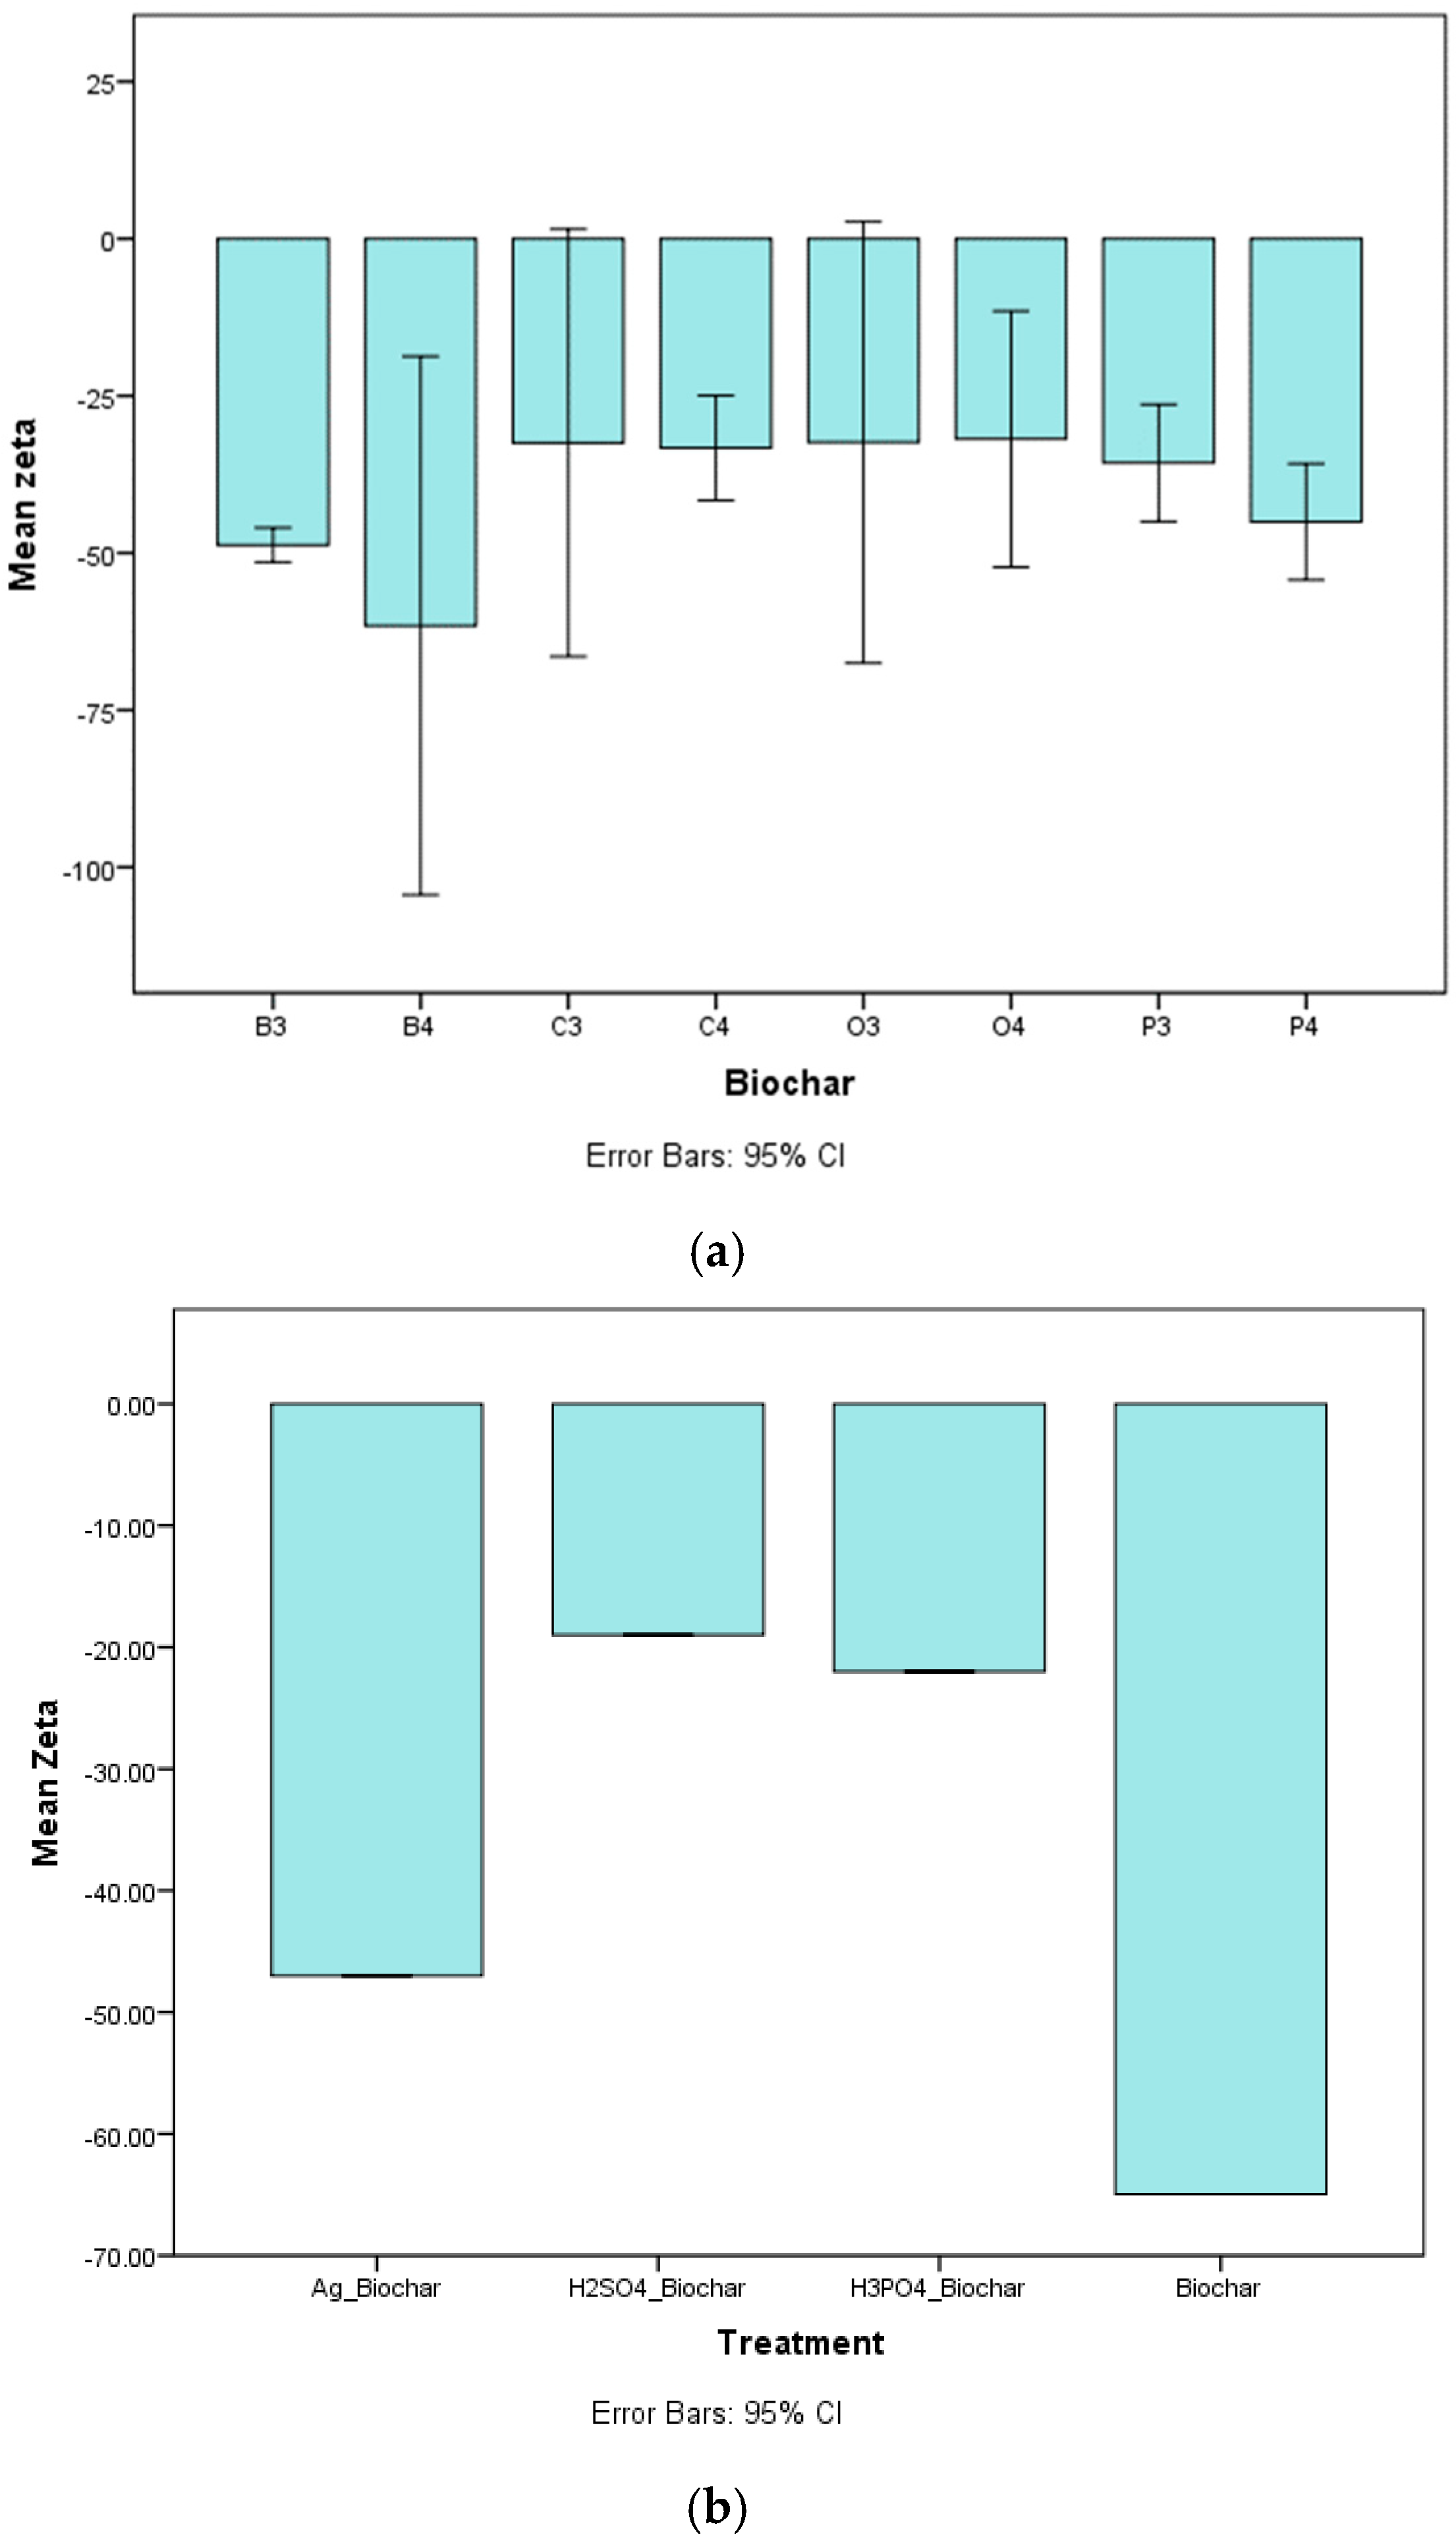
The investigation of biochar surface zeta potential assessed the influence of pyrolysis temperature and feedstock type, as presented in
Figure 2a. The zeta potential of biochar, which is related to the electrostatic charge on the surface, is significantly influenced by both parameters.
Figure 2a shows zeta potential values ranging from −58.2 to −29.6 mV. A clear trend emerged, showing that as the pyrolysis temperature increased (from 300 to 400 °C), the zeta potential decreased, suggesting enhanced electronegativity at higher temperatures. This aligns with findings by Hong et al. (2019) and Kim and Jung (2023) [
38,
39]. Additionally, biochar produced from different feedstocks (banana peel, orange peel, coffee residue, and potato peel) showed varying zeta potential values, reflecting differences in their intrinsic chemical compositions and the functional groups retained after pyrolysis. The negative charge is attributed to aromatic compounds and functional groups like O–H and –COOH, increasing pH and improving sorption capacity, particularly for pollutants and minerals such as sodium (Na) [
40].
Zeta potential is influenced by factors like electrolyte presence, dielectric constant, and pH [
41]. Higher pyrolysis temperatures enhance negative charge, which plays a crucial role in electrostatic attraction of positively charged metal ions like Cu
2+, a key mechanism in water treatment applications.
Figure 2b highlights zeta potential differences among chemically treated biochar samples under various treatments. Untreated biochar exhibited the most negative zeta potential (−64 mV), favoring electrostatic attraction of Cu
2+ ions, which enhances its adsorption efficiency. Sulfuric acid (−19 mV) and phosphoric acid (−22 mV) treatments introduced functional groups (sulfate and phosphate), altering surface charge and shifting the adsorption mechanism from electrostatic attraction to chemical binding. Silver nitrate-treated biochar (−47 mV) showed intermediate zeta potential values, indicating modified surface chemistry that improves Cu
2+ sorption through a combination of charge attraction and complexation.
While untreated biochar primarily relies on electrostatic attraction for Cu
2+ removal [
42], acid- and silver-treated biochars demonstrated superior metal uptake due to chemically enhanced interactions. This suggests that, although a highly negative zeta potential enhances electrostatic adsorption, surface modifications through acid or silver treatments can further improve Cu
2+ adsorption by introducing additional binding mechanisms.
3.1.5. Raman Spectroscopy
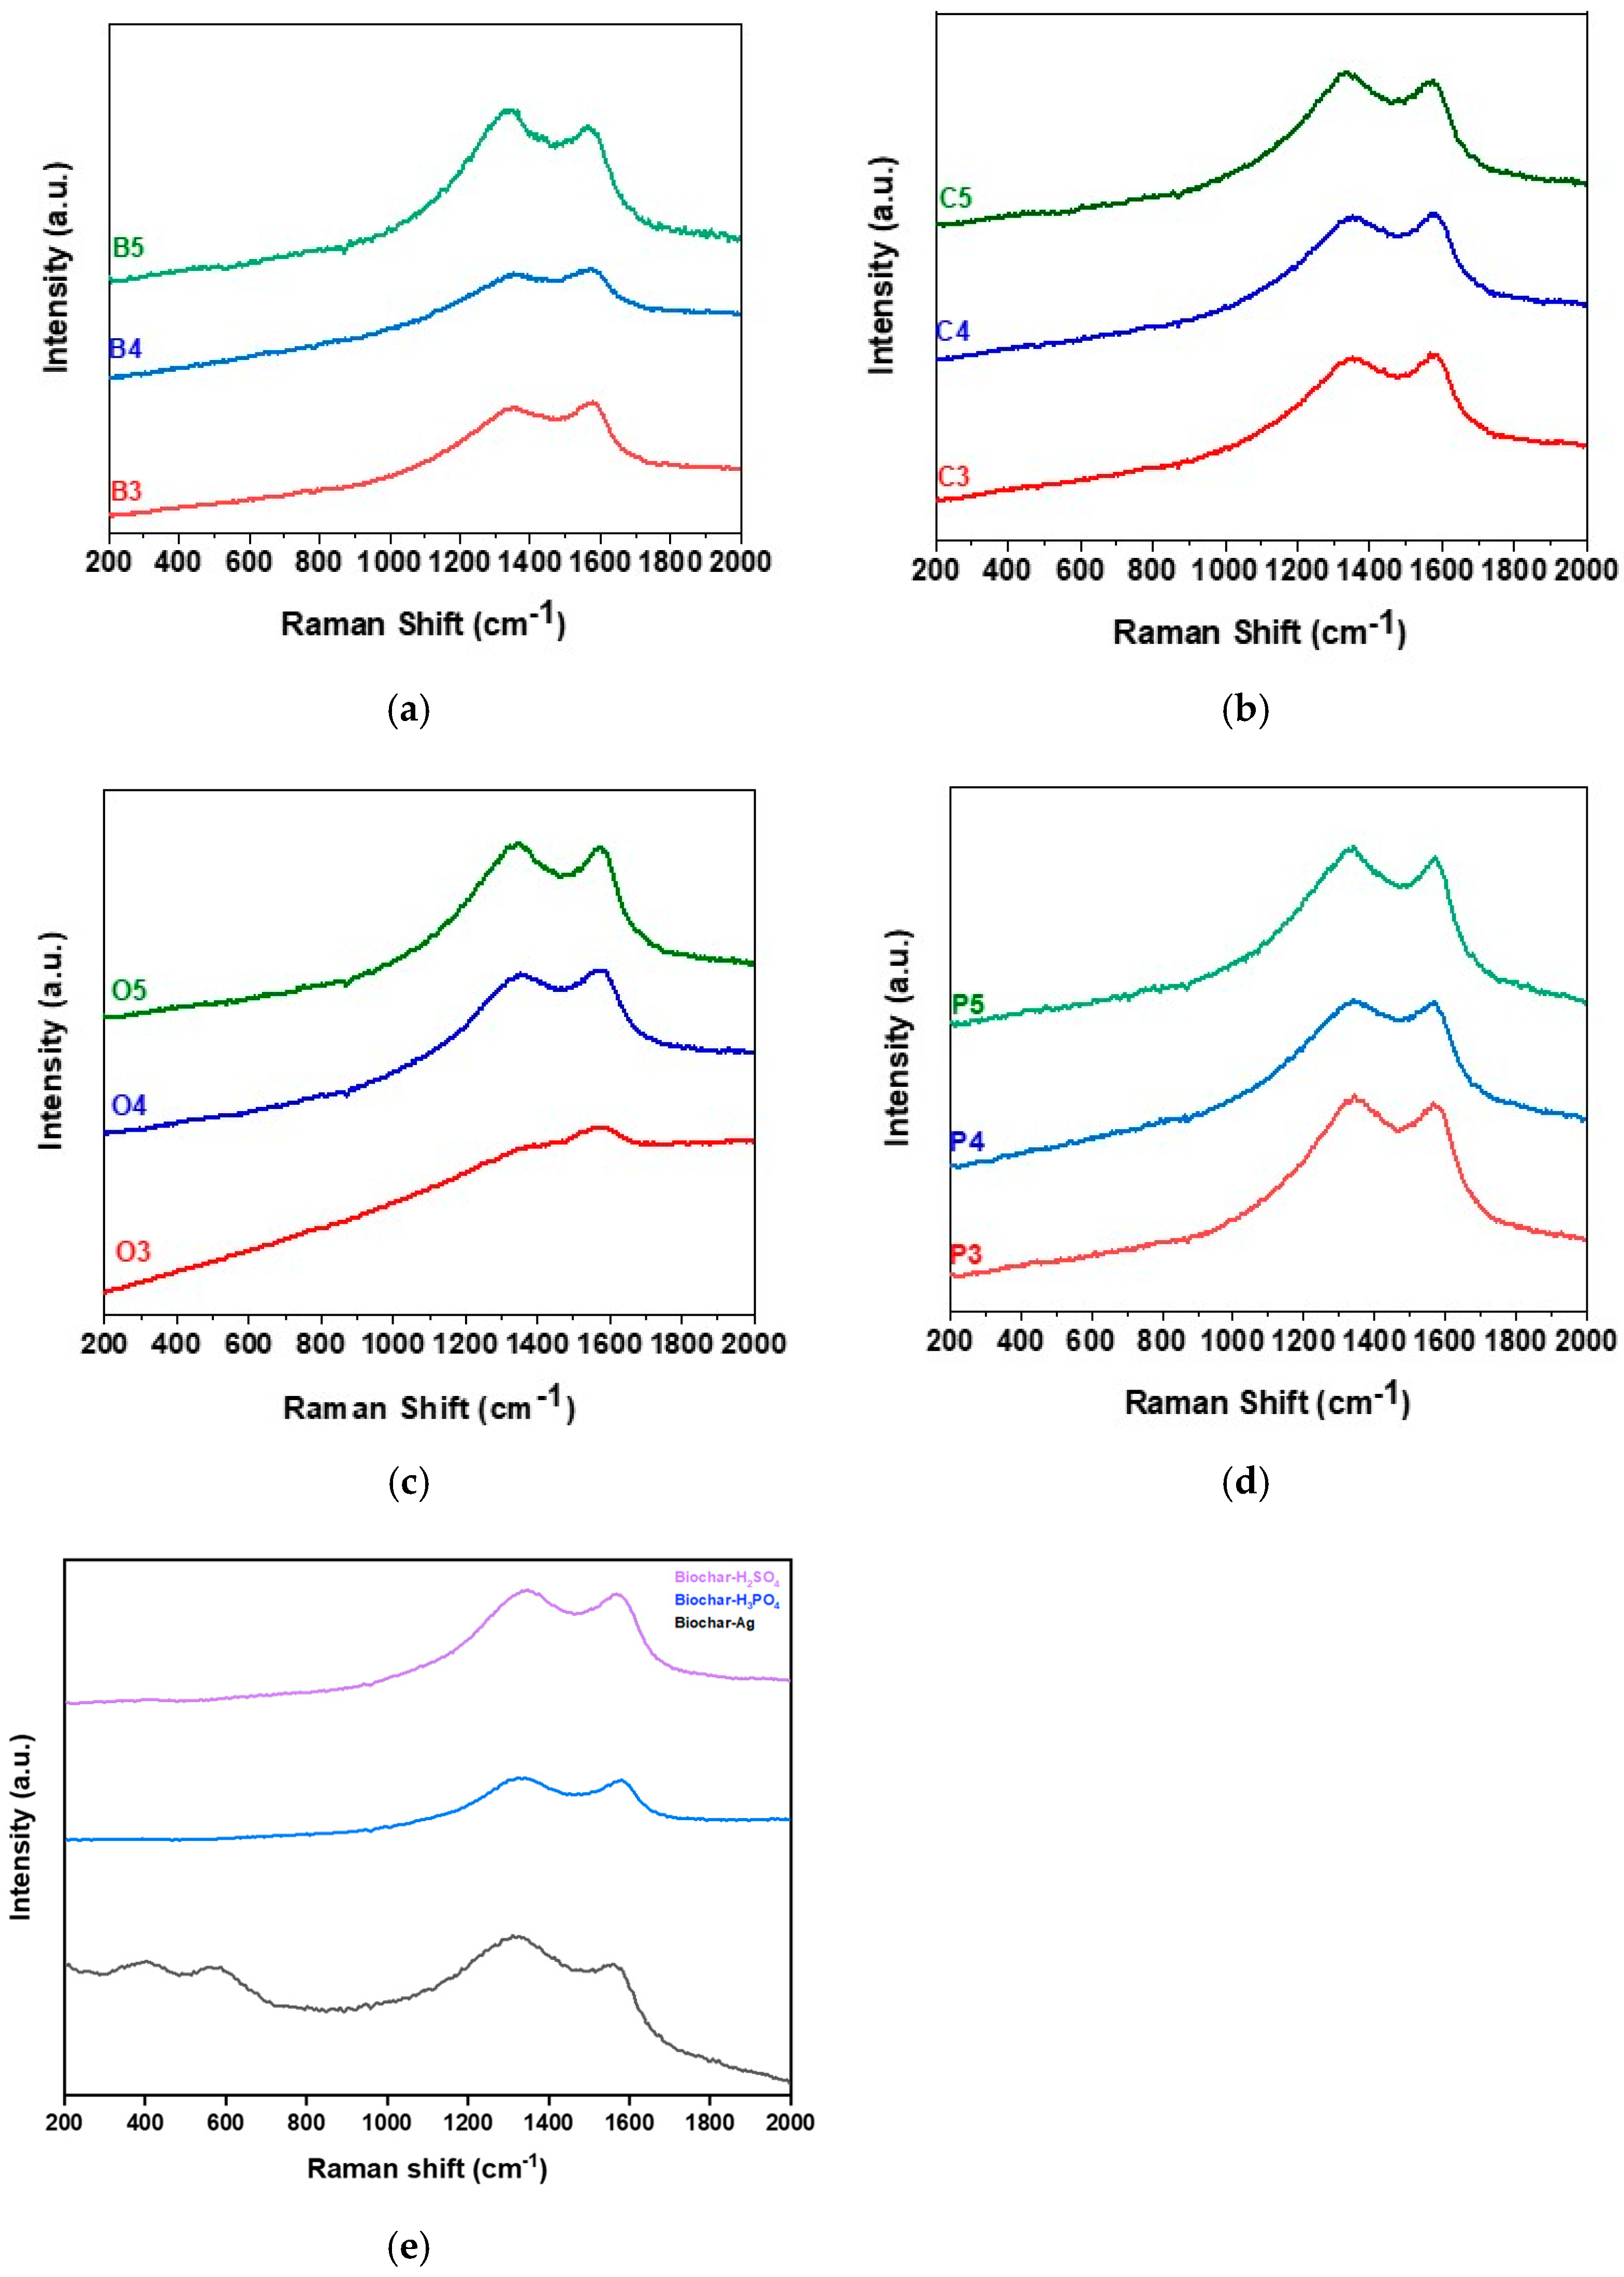
Raman spectroscopy analyzed the structure of each feedstock used in biochar production. Raw feedstock spectra showed distinct features compared to biochar, with biochar samples lacking significant peaks.
Figure 3a–d illustrates two consistent peaks in all biochar types except OP biochar (orange peel biochar) at 300 °C. Peak intensity increased with pyrolysis temperature, with D and G bands appearing at ~1300–1380 cm
−1 and ~1580–1590 cm
−1, respectively.
The G-peak signifies bond stiffness in graphene sheets, shifting to higher frequencies with stronger bonds. The D-band indicates structural defects, increasing in intensity with more disorder [
43]. The ID/IG ratio reflects graphene disorder, rising with defects, which can enhance material performance [
44].
Gonzalez-Canche et al. (2021) [
45] observed an increasing ID/IG ratio with pyrolysis temperature, indicating more condensed aromatic structures. The notable rise in the ID/IG ratio from 400 to 800 °C implies greater defects, enhancing stability. Boudraa et al. (2022) [
46] reported that defect-rich graphitic carbon improves storage and adsorption capacity. At 400 °C, OP biochar had an ID/IG ratio of 1.06, increasing to 1.09 at 500 °C. BP rose from 1.09 to 1.19, CR (coffee residue) from 1.38 to 1.46, and PP (potato peel) from 1.08 to 1.11. These findings confirm the stable structure and adsorption capacity of our biochar.
Figure 3e shows that H
2SO
4 treatment increases D and G band intensities, indicating disorder and sulfate incorporation. H
3PO
4 treatment sharpens the G-band, reflecting phosphate incorporation. AgNO
3-treated biochar exhibits spectral changes, including additional peaks, suggesting interactions between silver ions and the carbon structure. These treatments significantly alter biochar’s structural and chemical properties, enhancing functional group incorporation and disorder.
3.1.6. SEM-EDX
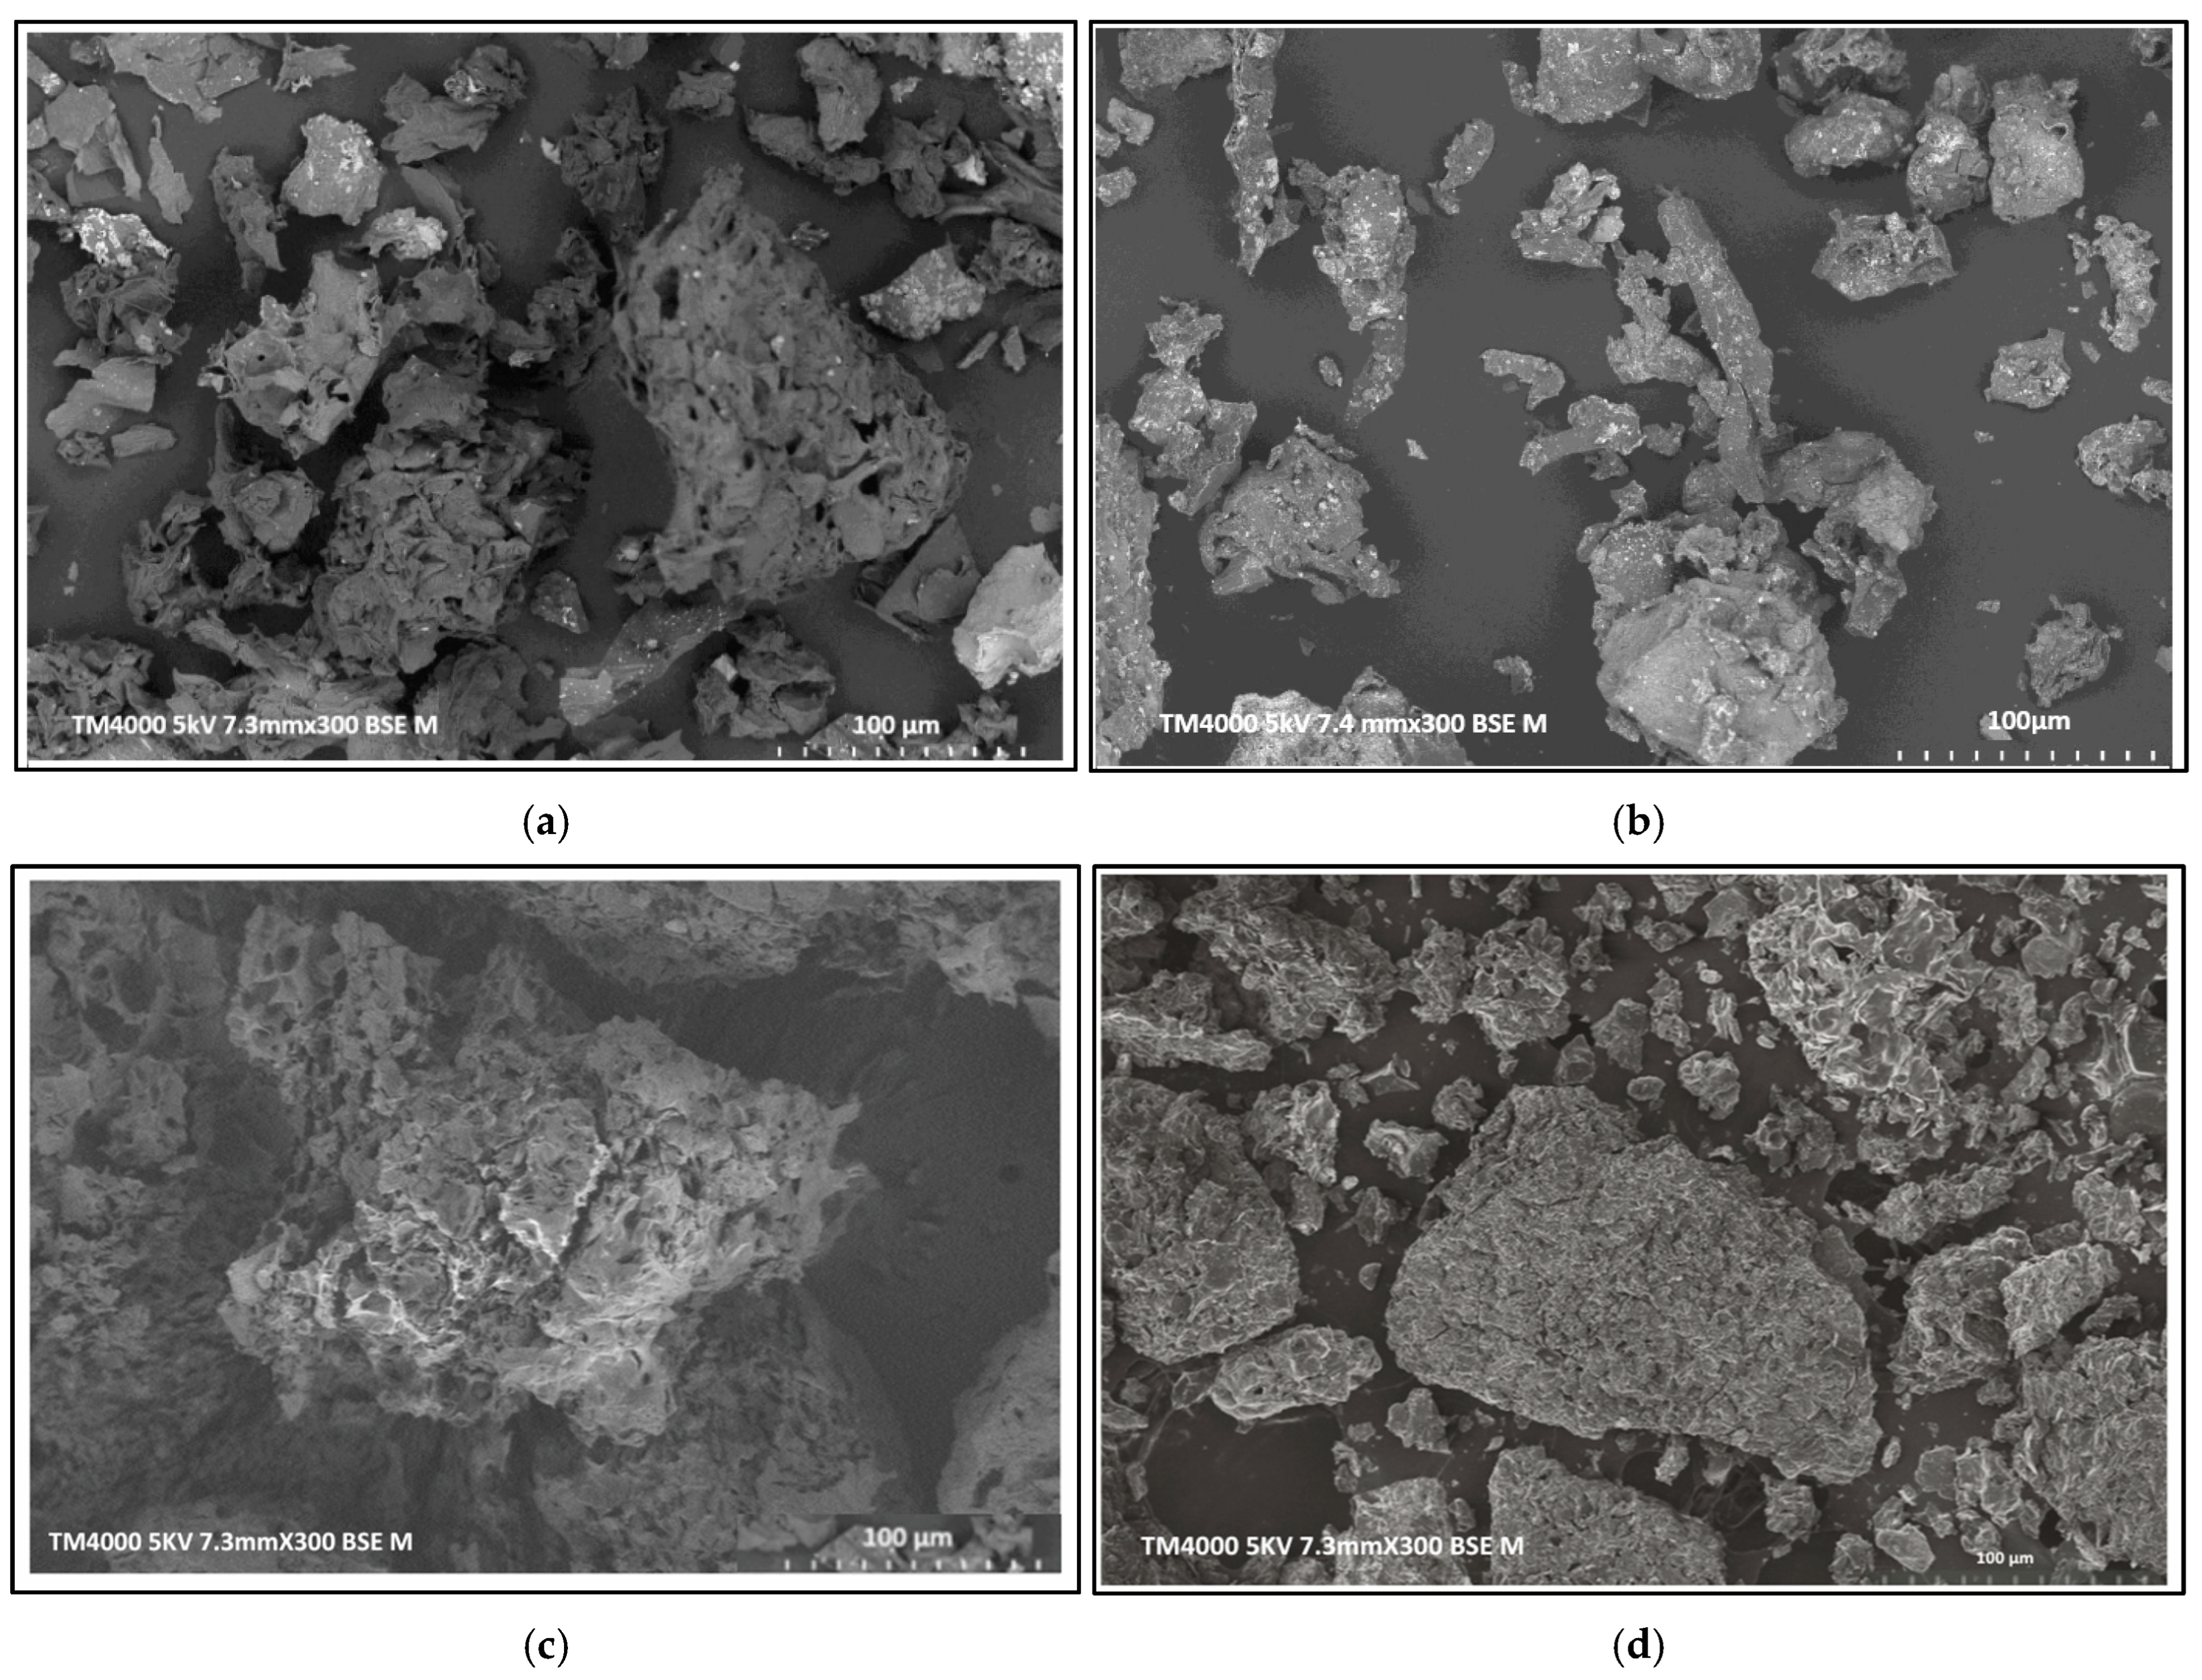
In
Figure 4a, the SEM image reveals the highly porous structure of the biochar, characterized by a well-developed mesoporous architecture. In contrast,
Figure 4b demonstrates a marked reduction in visible porosity, with fewer defined pores. Instead, numerous lighter-colored spots are observed on the surface, corresponding to silver nanoparticles (Ag-NPs). These Ag-NPs appear as small, distinct aggregates, suggesting successful deposition onto the biochar, potentially enhancing its antimicrobial properties. However,
Figure 4c reveals a relatively homogeneous surface architecture, supporting the earlier conclusion regarding the limited effectiveness of phosphoric acid activation in this case. The absence of well-developed porosity suggests that the biochar’s pore structure was compromised during treatment, which is consistent with the observed decrease in adsorption capacity. In contrast,
Figure 4d displays a distinctly aggregated morphology, indicative of structural reorganization induced by sulfonic acid treatment. The formation of these aggregates is attributed to the introduction of sulfonate functional groups and the strong acidic environment, which collectively altered the surface texture and promoted particle clustering.
The elemental composition of biochar and Ag-biochar, as determined by EDX analysis, reveals significant changes upon the incorporation of silver (
Table 3). The biochar exhibits a high carbon content (79.68%) and moderate oxygen content (15.15%), along with trace amounts of elements such as Mg, Si, P, S, Cl, K, and Ca. This composition aligns with typical biochar characteristics.
In contrast, the Ag-biochar shows a lower carbon content (62.71%) and oxygen content (19.09%). These shifts suggest notable modifications to the material’s surface chemistry, and therefore a change in its reactivity. The successful incorporation of silver, evidenced by the presence of 7.26% Ag, indicates that silver is effectively integrated into the biochar matrix; this aligns with XPS analysis as well. Thus, the incorporation of silver significantly influences the elemental composition of biochar. These changes are expected to enhance the surface chemistry, making Ag-biochar a more reactive material with potential for antimicrobial activity.
Moreover, the elemental composition of biochar modified with H3PO4 also reveals substantial changes compared to unmodified biochar. The carbon content (C) decreases (65.95%), accompanied by a marked increase in oxygen (O) to 29.58%, suggesting enhanced surface oxidation and the introduction of oxygen-rich functional groups. Most notably, phosphorus (P) is present at 2.91%, confirming successful incorporation of phosphate groups into the biochar matrix. In addition, Si, Al, K and Ca are present.
Similarly, H2SO4-modified biochar exhibits even more pronounced alterations. The carbon content drops further to 55.77%, while oxygen remains high at 30.40%, indicating intensive oxidation. The presence of sulfur (8.81%) reflects successful sulfonation, likely leading to the formation of sulfonic acid groups on the surface. In addition, Si, Al, K, Ca are present. These elemental shifts confirm that H2SO4 treatment significantly alters the biochar’s surface chemistry, potentially improving its acidic functionality and making it a strong candidate for applications related to contaminant removal.
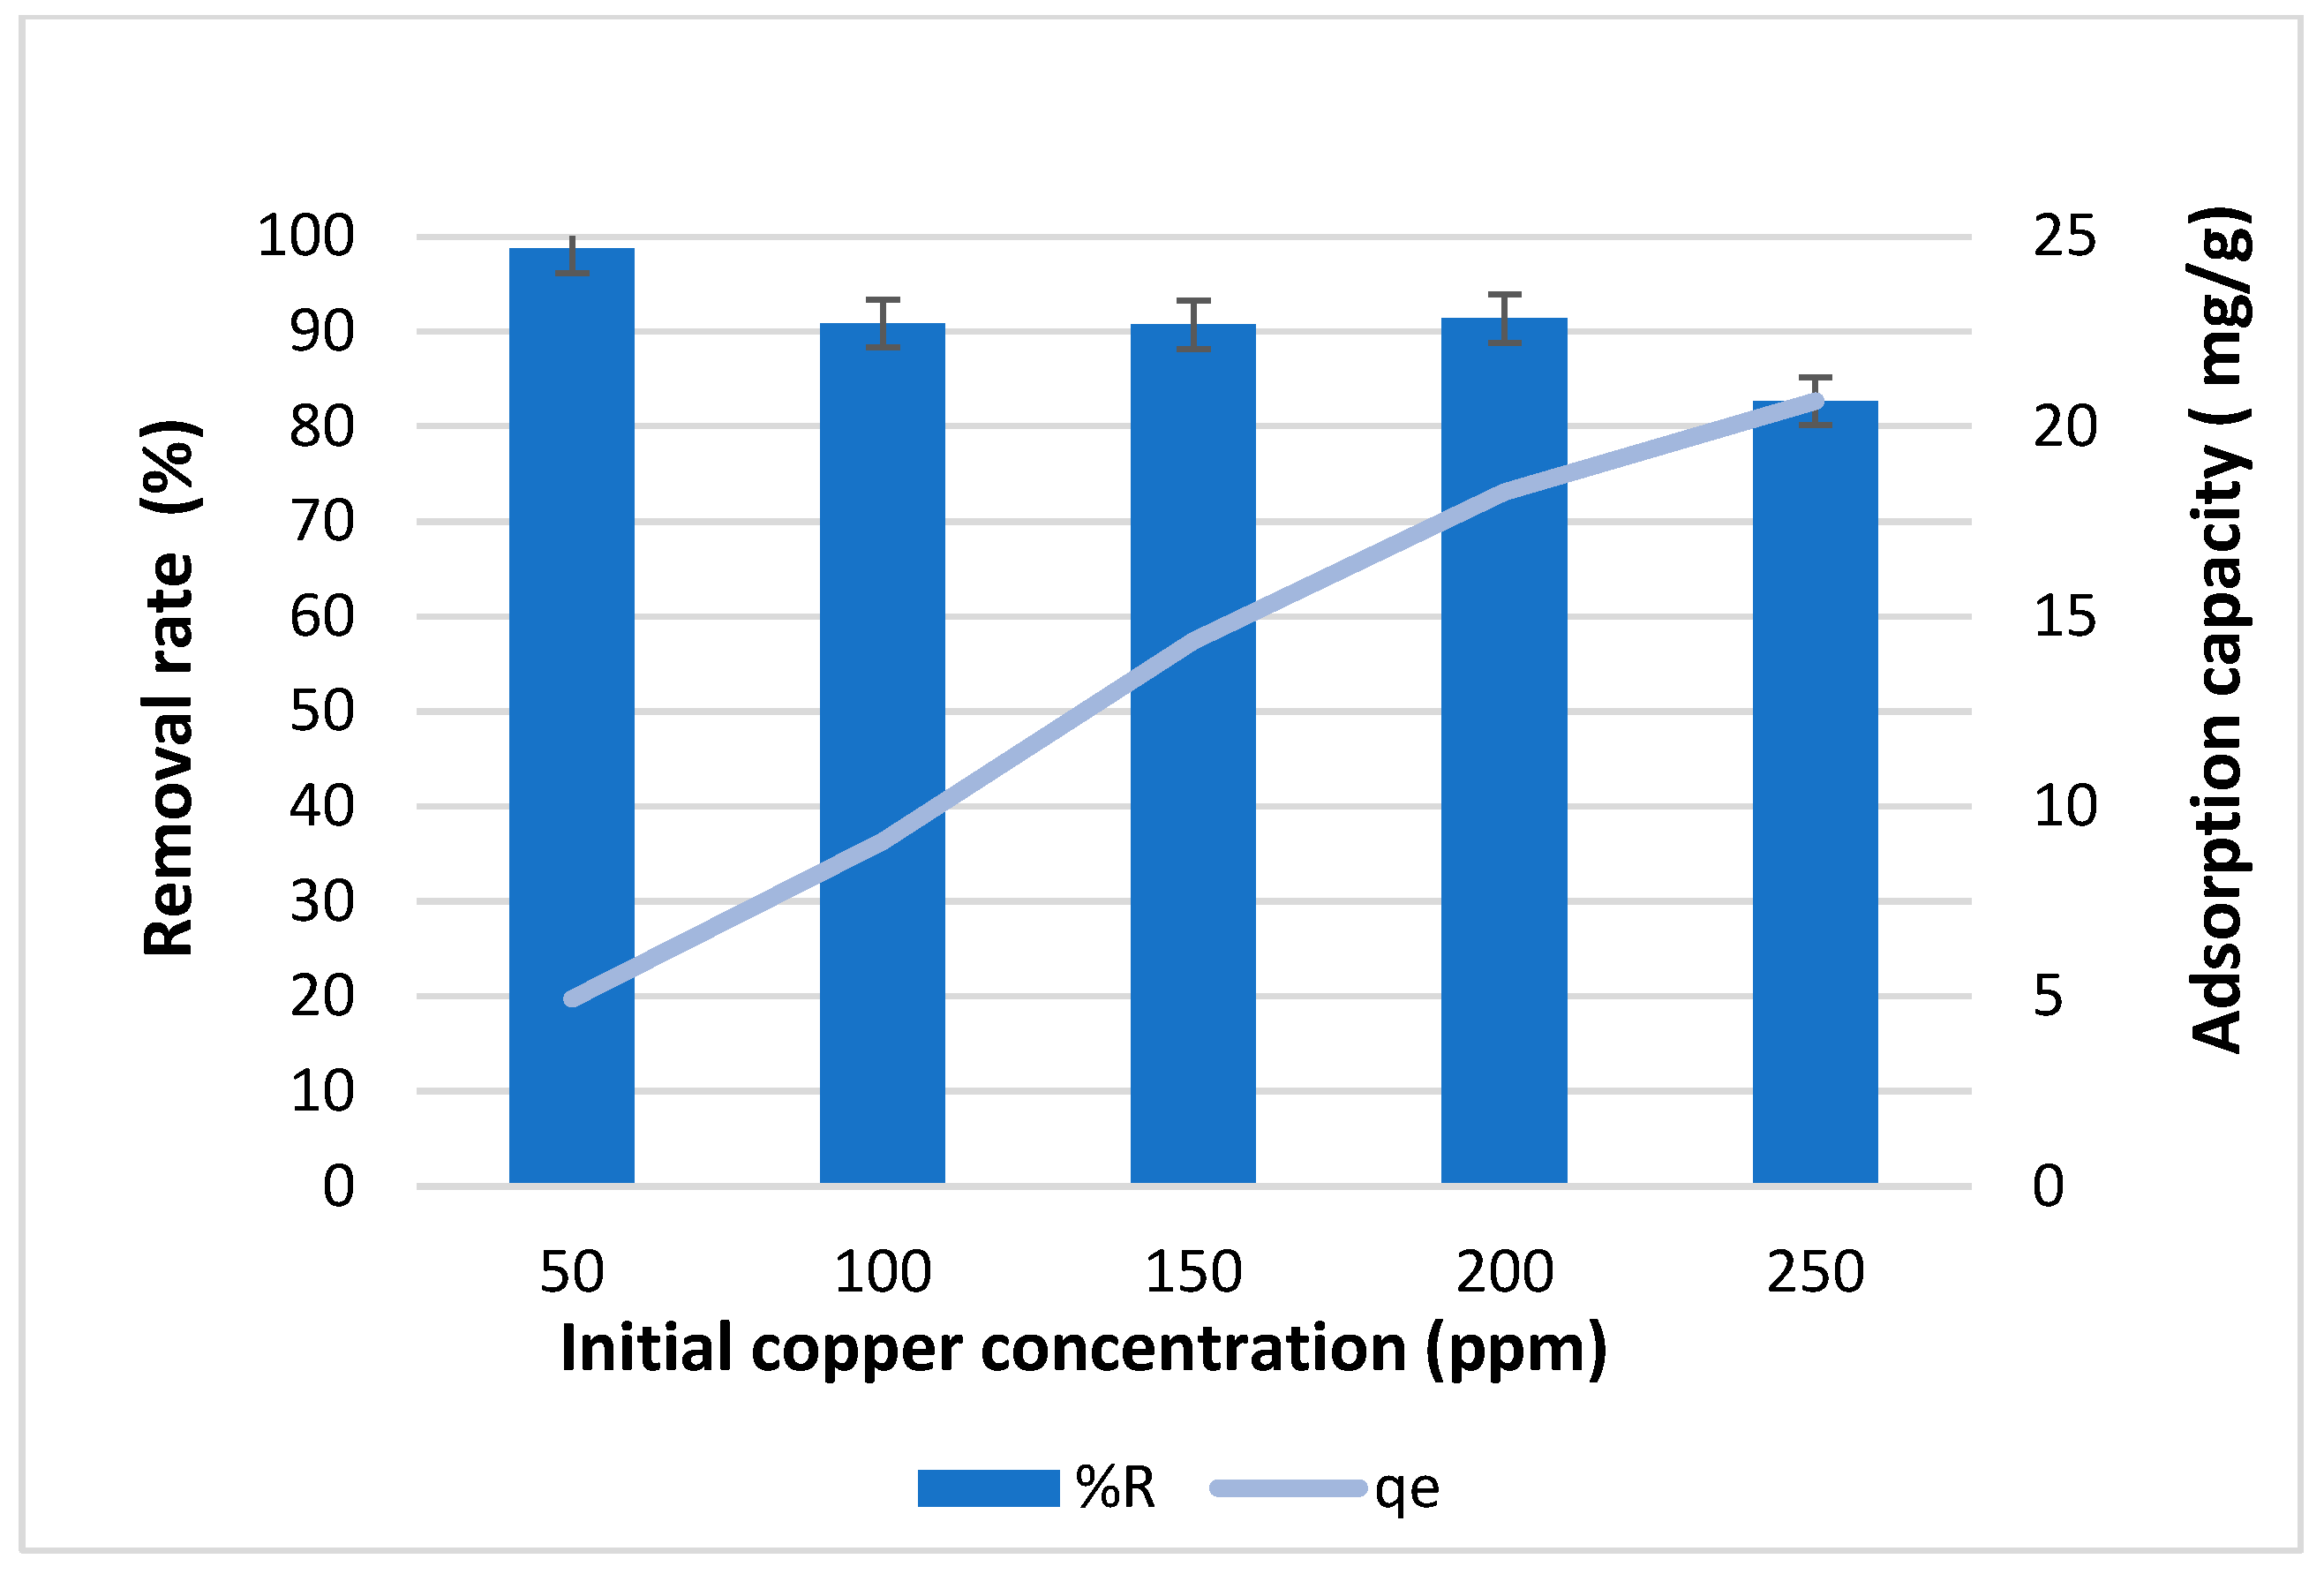
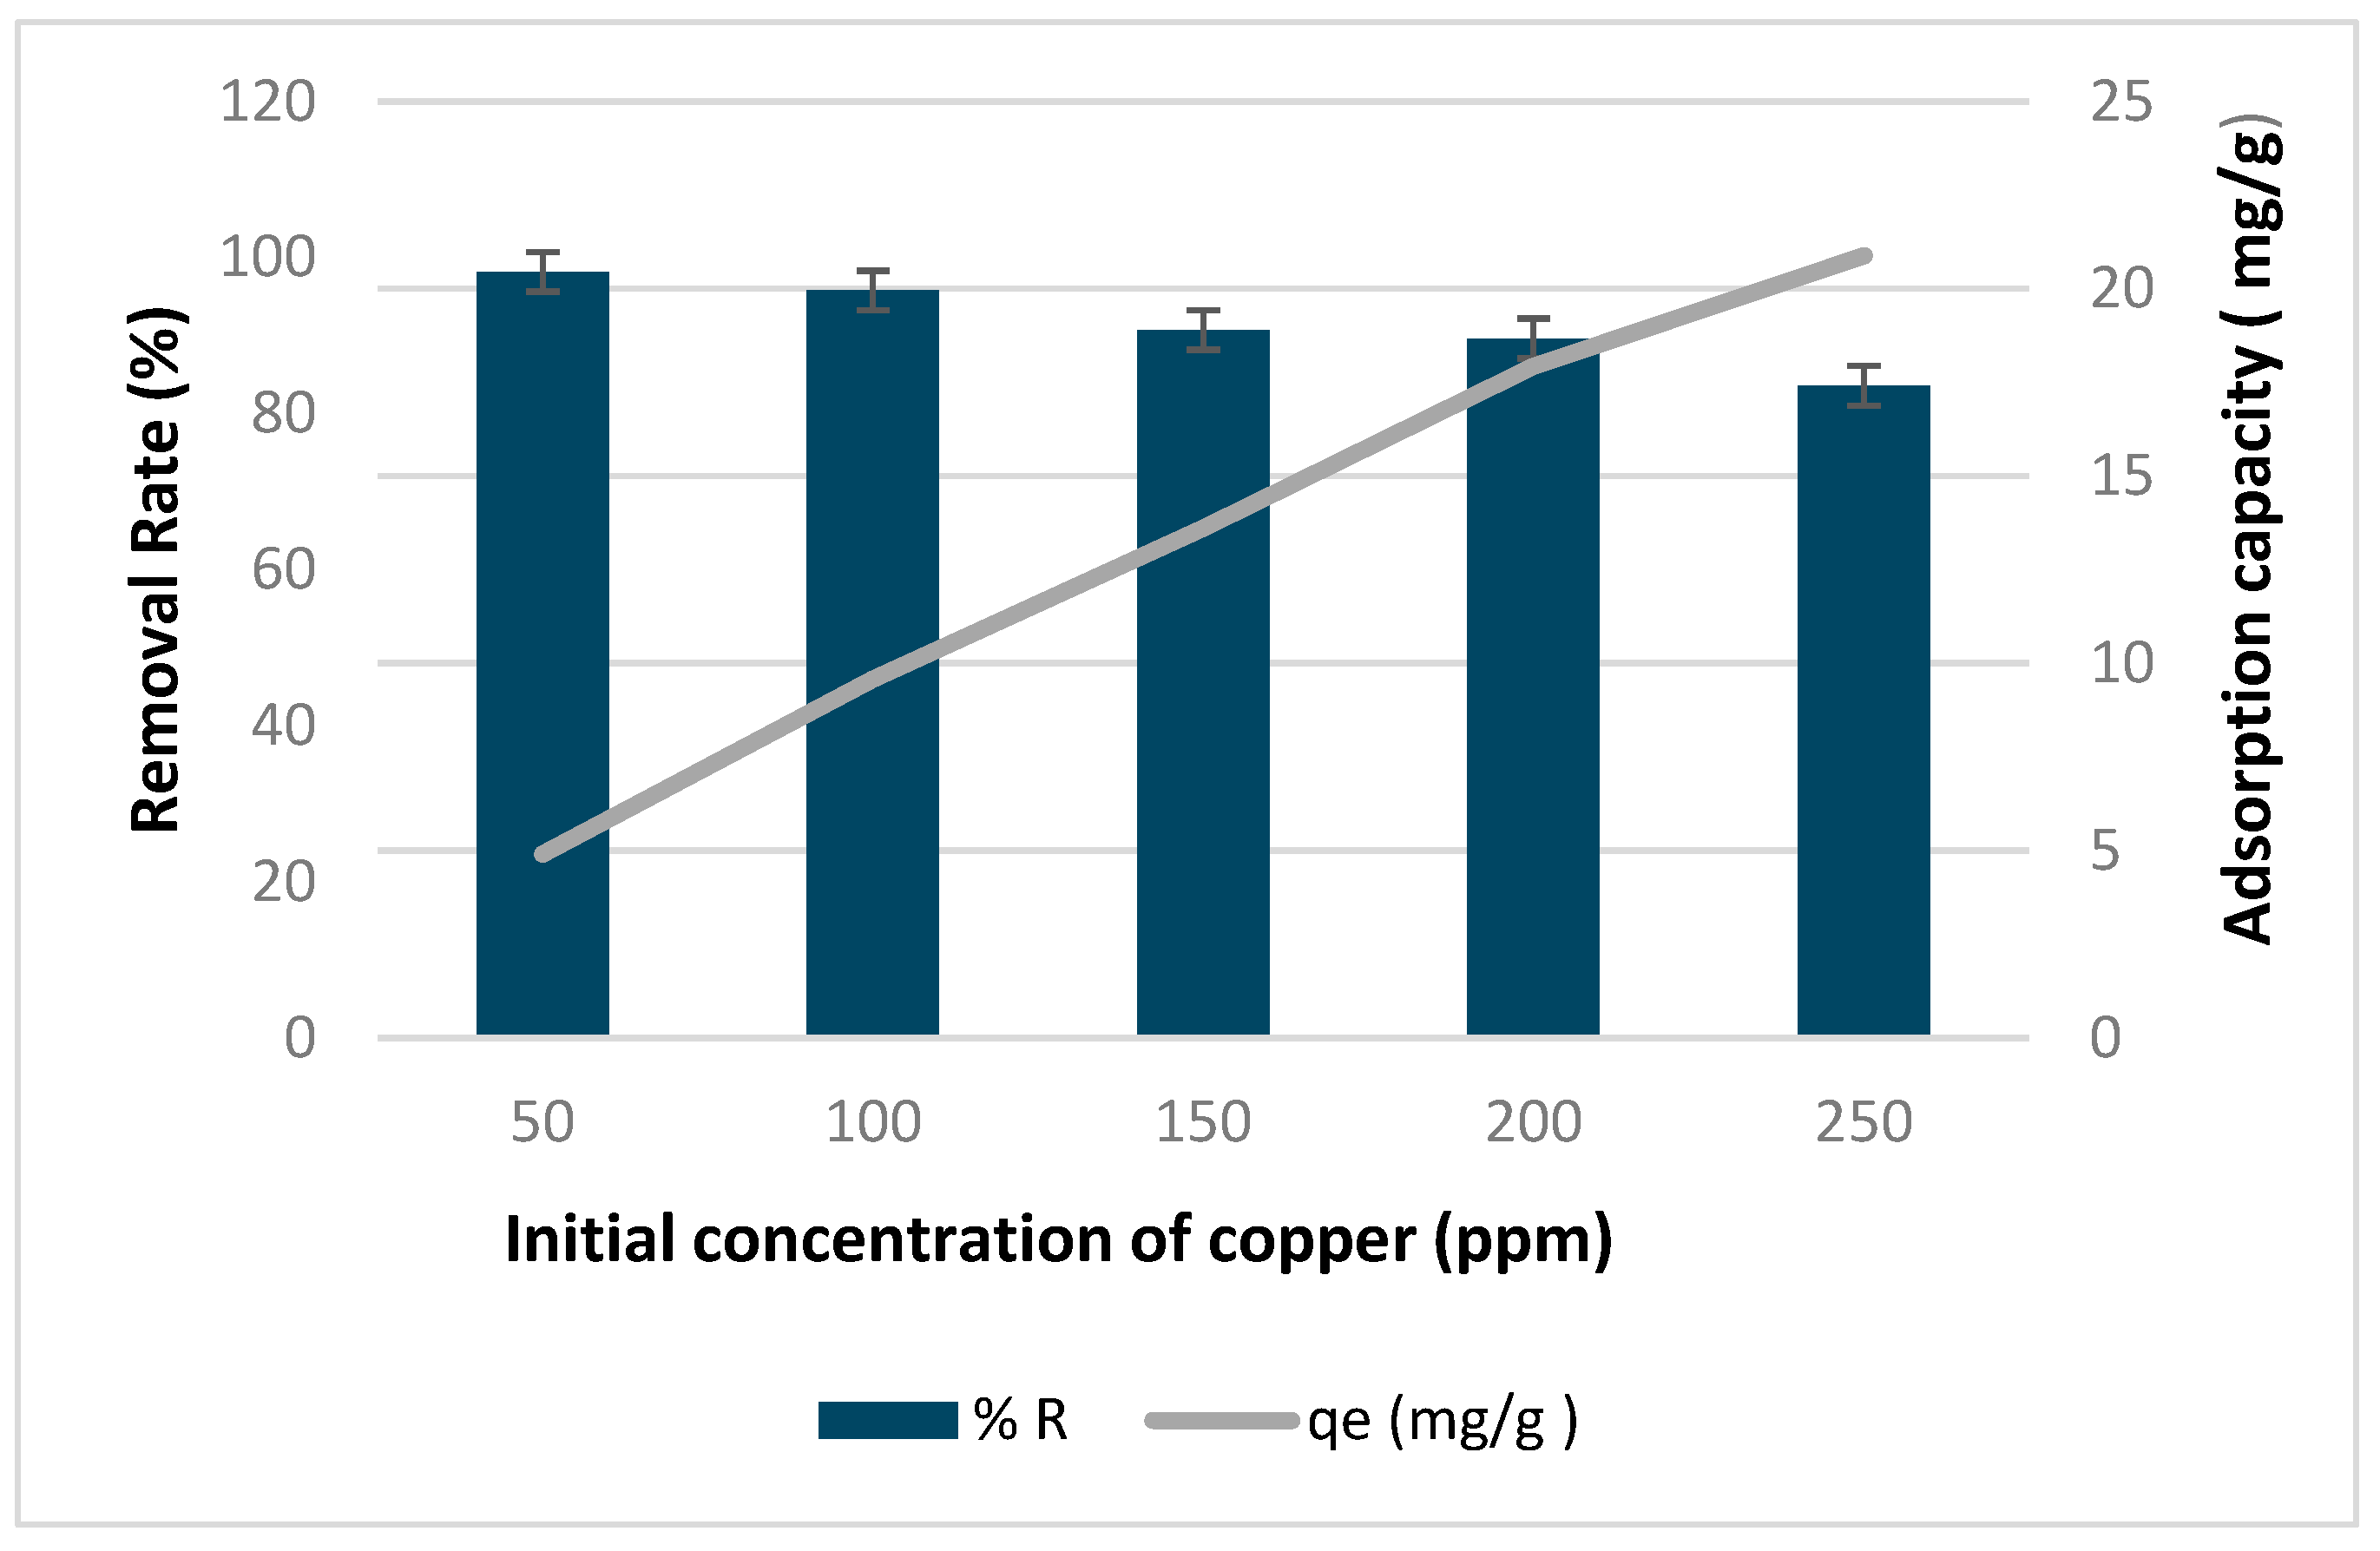
3.2. Effect of Initial Metal Concentrations
In this study, we explored how different initial metal concentrations affect biochar’s ability to adsorb and remove copper. We varied the Cu
2+ concentrations from 50 to 250 ppm, as shown in
Figure 5. Throughout the experiment, we maintained a pH of 4.95 and used 0.5 g of adsorbent and a 60 min contact time. The results demonstrated a clear rise in adsorption capacity, reaching around 21 mg/g, with increasing Cu
2+ concentrations from 50 to 250 ppm. Additionally, the removal efficiency for copper was highest at 98.7% for 50 ppm, gradually decreasing to 82% at 250 ppm.
In a study by Akkaya et al. (2020) [
8], it was found that the adsorption capacity increased with increasing concentration, while removal efficiency decreased at high initial concentration. Küçükgül and Kutlu (2006) [
9] also observed similar trends in their study on copper removal using oak wood biochar. Likewise, Ronbanchob et al. (2004) [
47] reported comparable findings in their research. These findings align well with the trend obtained in our results. The phenomenon of this adsorption trend, as explained by Gorzin and Bahri (2017) [
48], can be simply interpreted as follows: At lower concentrations, there are fewer metal ions competing for the available active sites, allowing for a more efficient removal process. However, as the concentration increases, saturation of active sites occurs more rapidly, resulting in a decrease in removal percentage despite the higher adsorption capacity. In other words, the decrease in removal efficiency at higher initial concentrations may occur due to the rapid occupation of binding sites and the subsequent saturation of sorption sites on the surface of the adsorbent. Additionally, the rise in the driving force of adsorption as the initial metal concentration increases leads to the saturation of sorption sites on the adsorbent’s surface, resulting in a reduction in adsorption capacity, as stated by previous studies [
49,
50,
51,
52,
53].
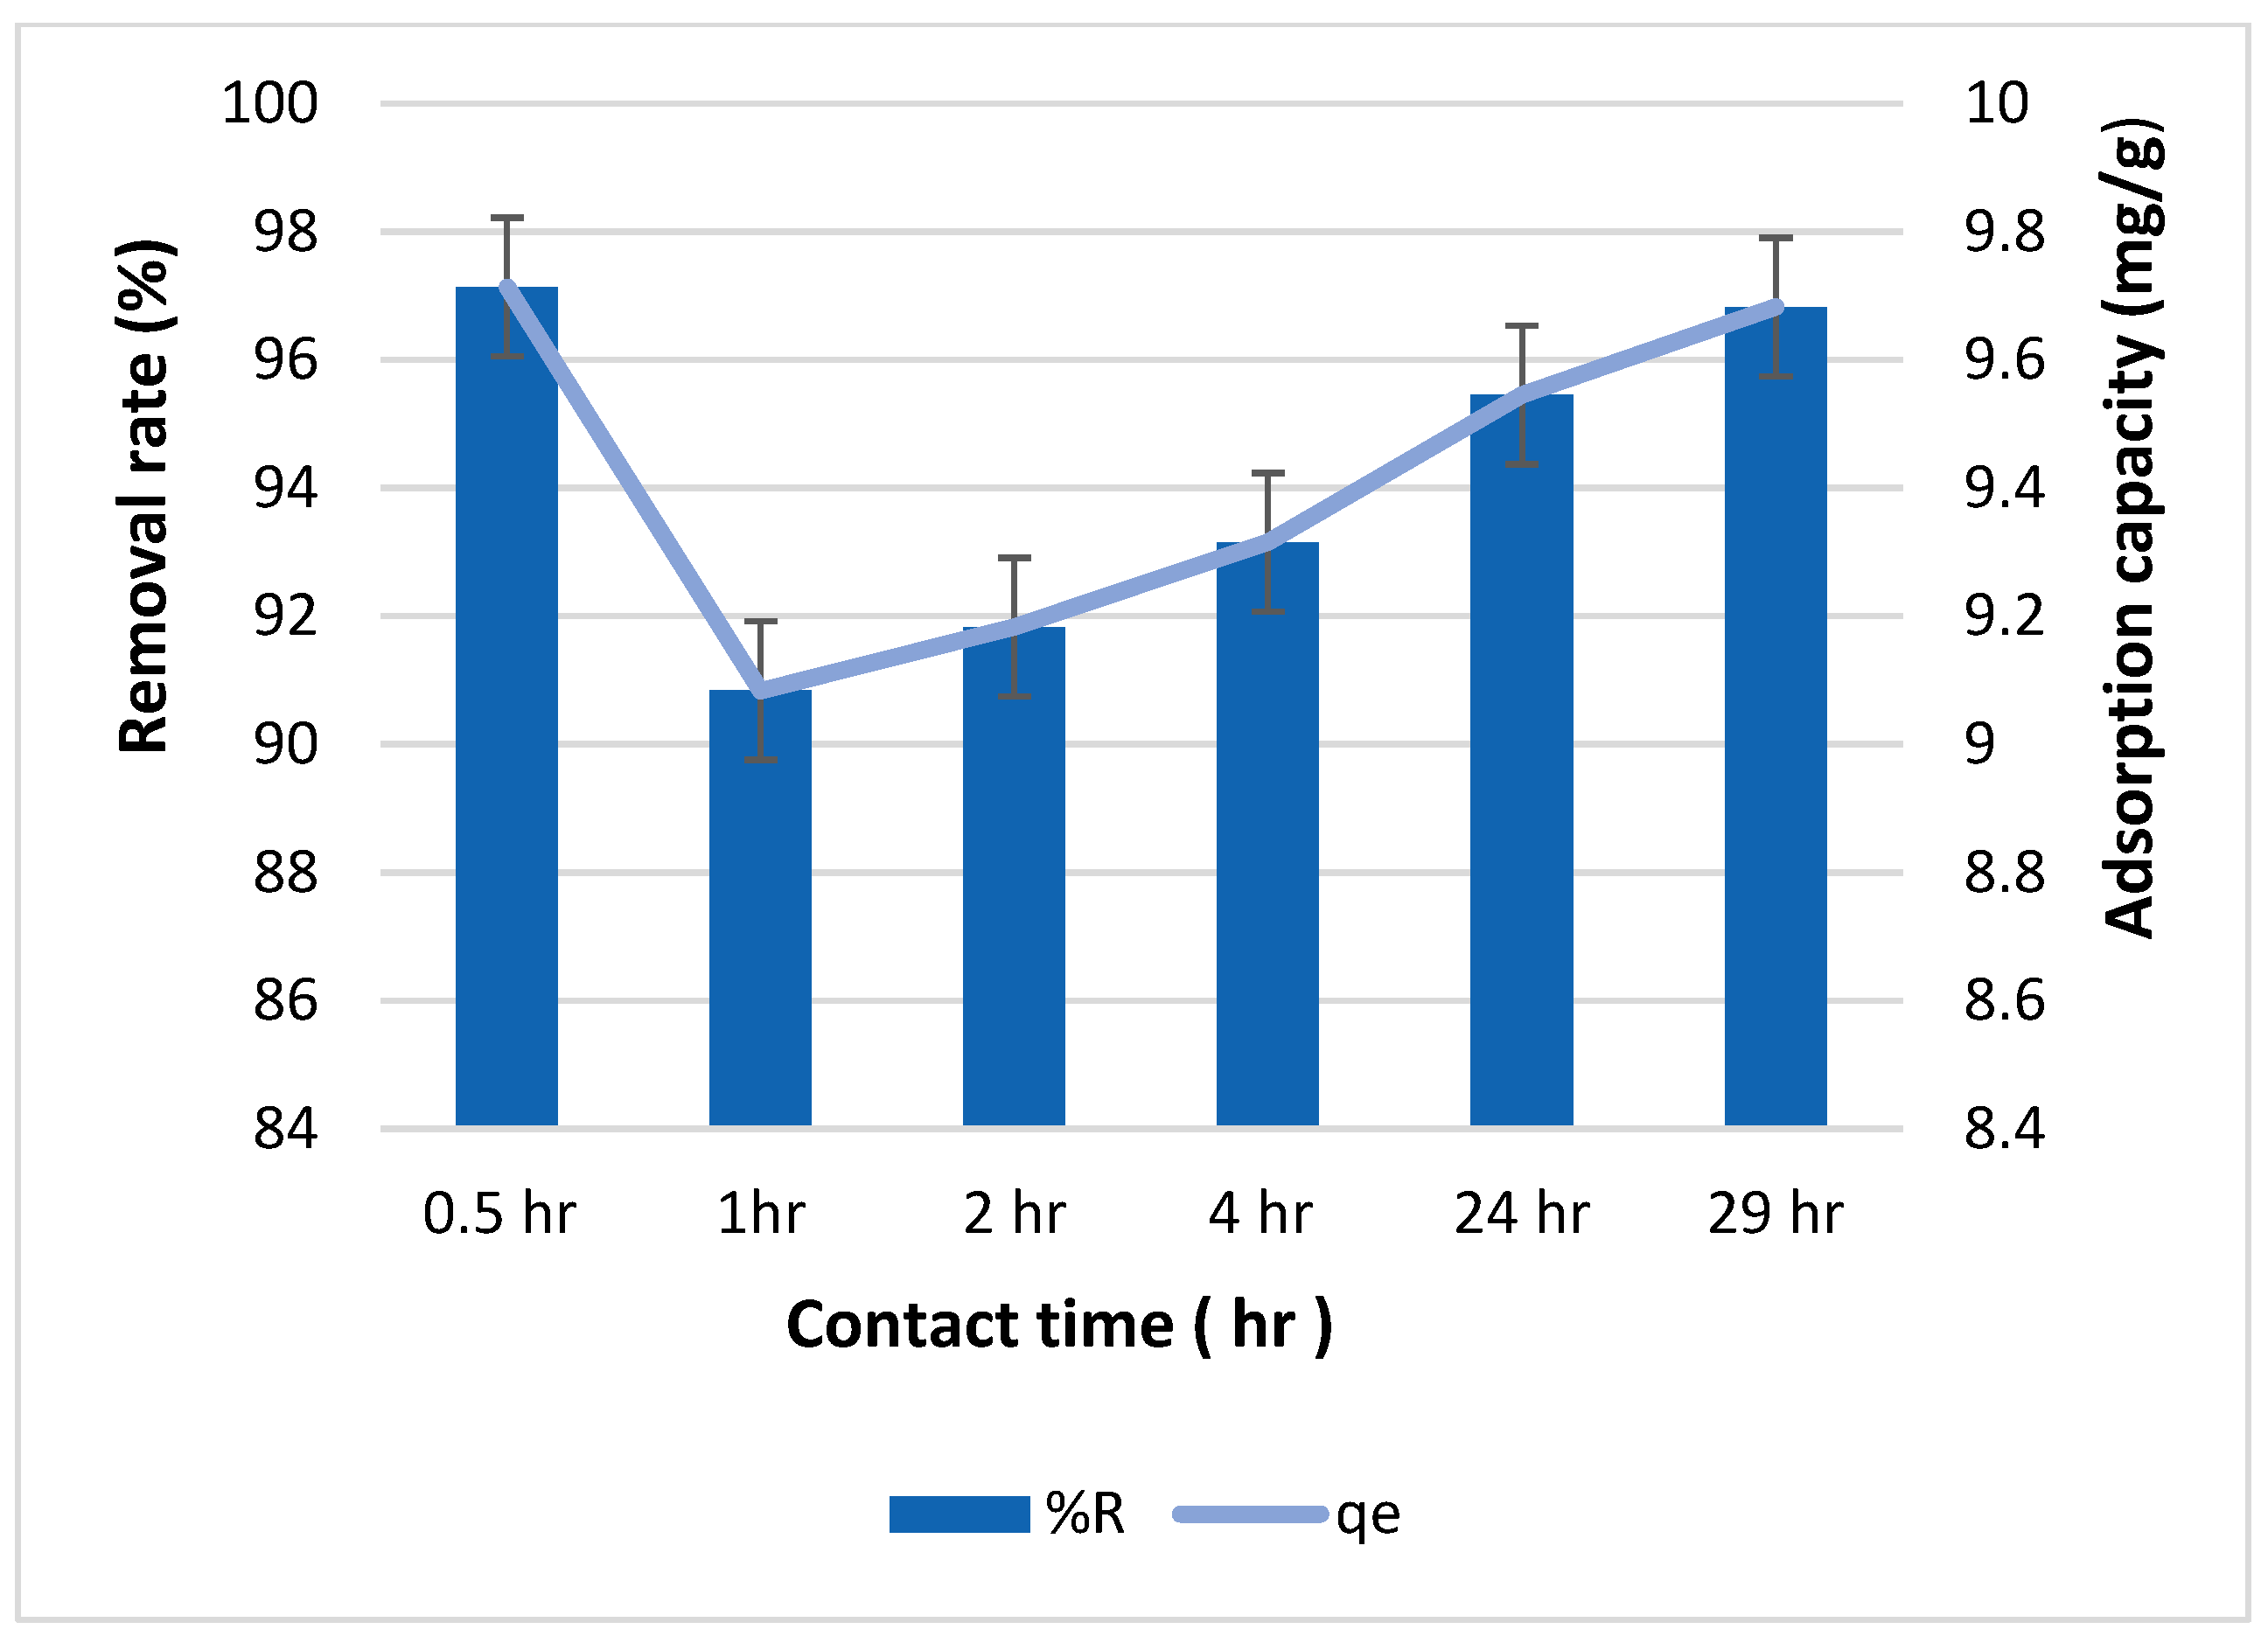
3.3. Effect of Contact Time
In
Figure 6, the impact of contact time on both the removal rate and adsorption capacity of biochar for copper is shown. The highest removal rate, reaching 97%, was observed after 30 min of contact between the copper solution and biochar. Subsequently, the removal rate notably decreased to 90% after one hour of contact time. However, as the contact time extended, the removal rate began to rise again, reaching 96.8% after 29 h of contact time. A similar trend is observed in the adsorption capacity, with the highest capacity of 9.7 mg/g observed at 30 min and the lowest capacity of approximately 9 mg/g at one hour.
This observed trend can be explained by considering the initial availability of active sites on the biochar surface for copper adsorption. Initially, the biochar surface offers abundant functional groups, facilitating rapid sorption of copper ions. However, as these surface sites become occupied, the rate of copper retention slows down. This slowdown occurs because the copper ions must then diffuse into the pores of the biochar to locate unoccupied functional groups for binding.
These findings are consistent with previous studies, such as Lucaci et al. (2019) [
54], which highlight the role of surface functional groups as the driving force behind the sorption process. The initial rapid sorption is attributed to the abundance of these functional groups, while the subsequent slower sorption is attributed to the necessity for copper ions to penetrate deeper into the biochar pores to find available binding sites.
These results underscore the importance of considering contact time in biochar-based sorption processes for heavy metal removal. Understanding the kinetics of sorption can aid in optimizing removal efficiency and designing effective treatment strategies for contaminated water systems.
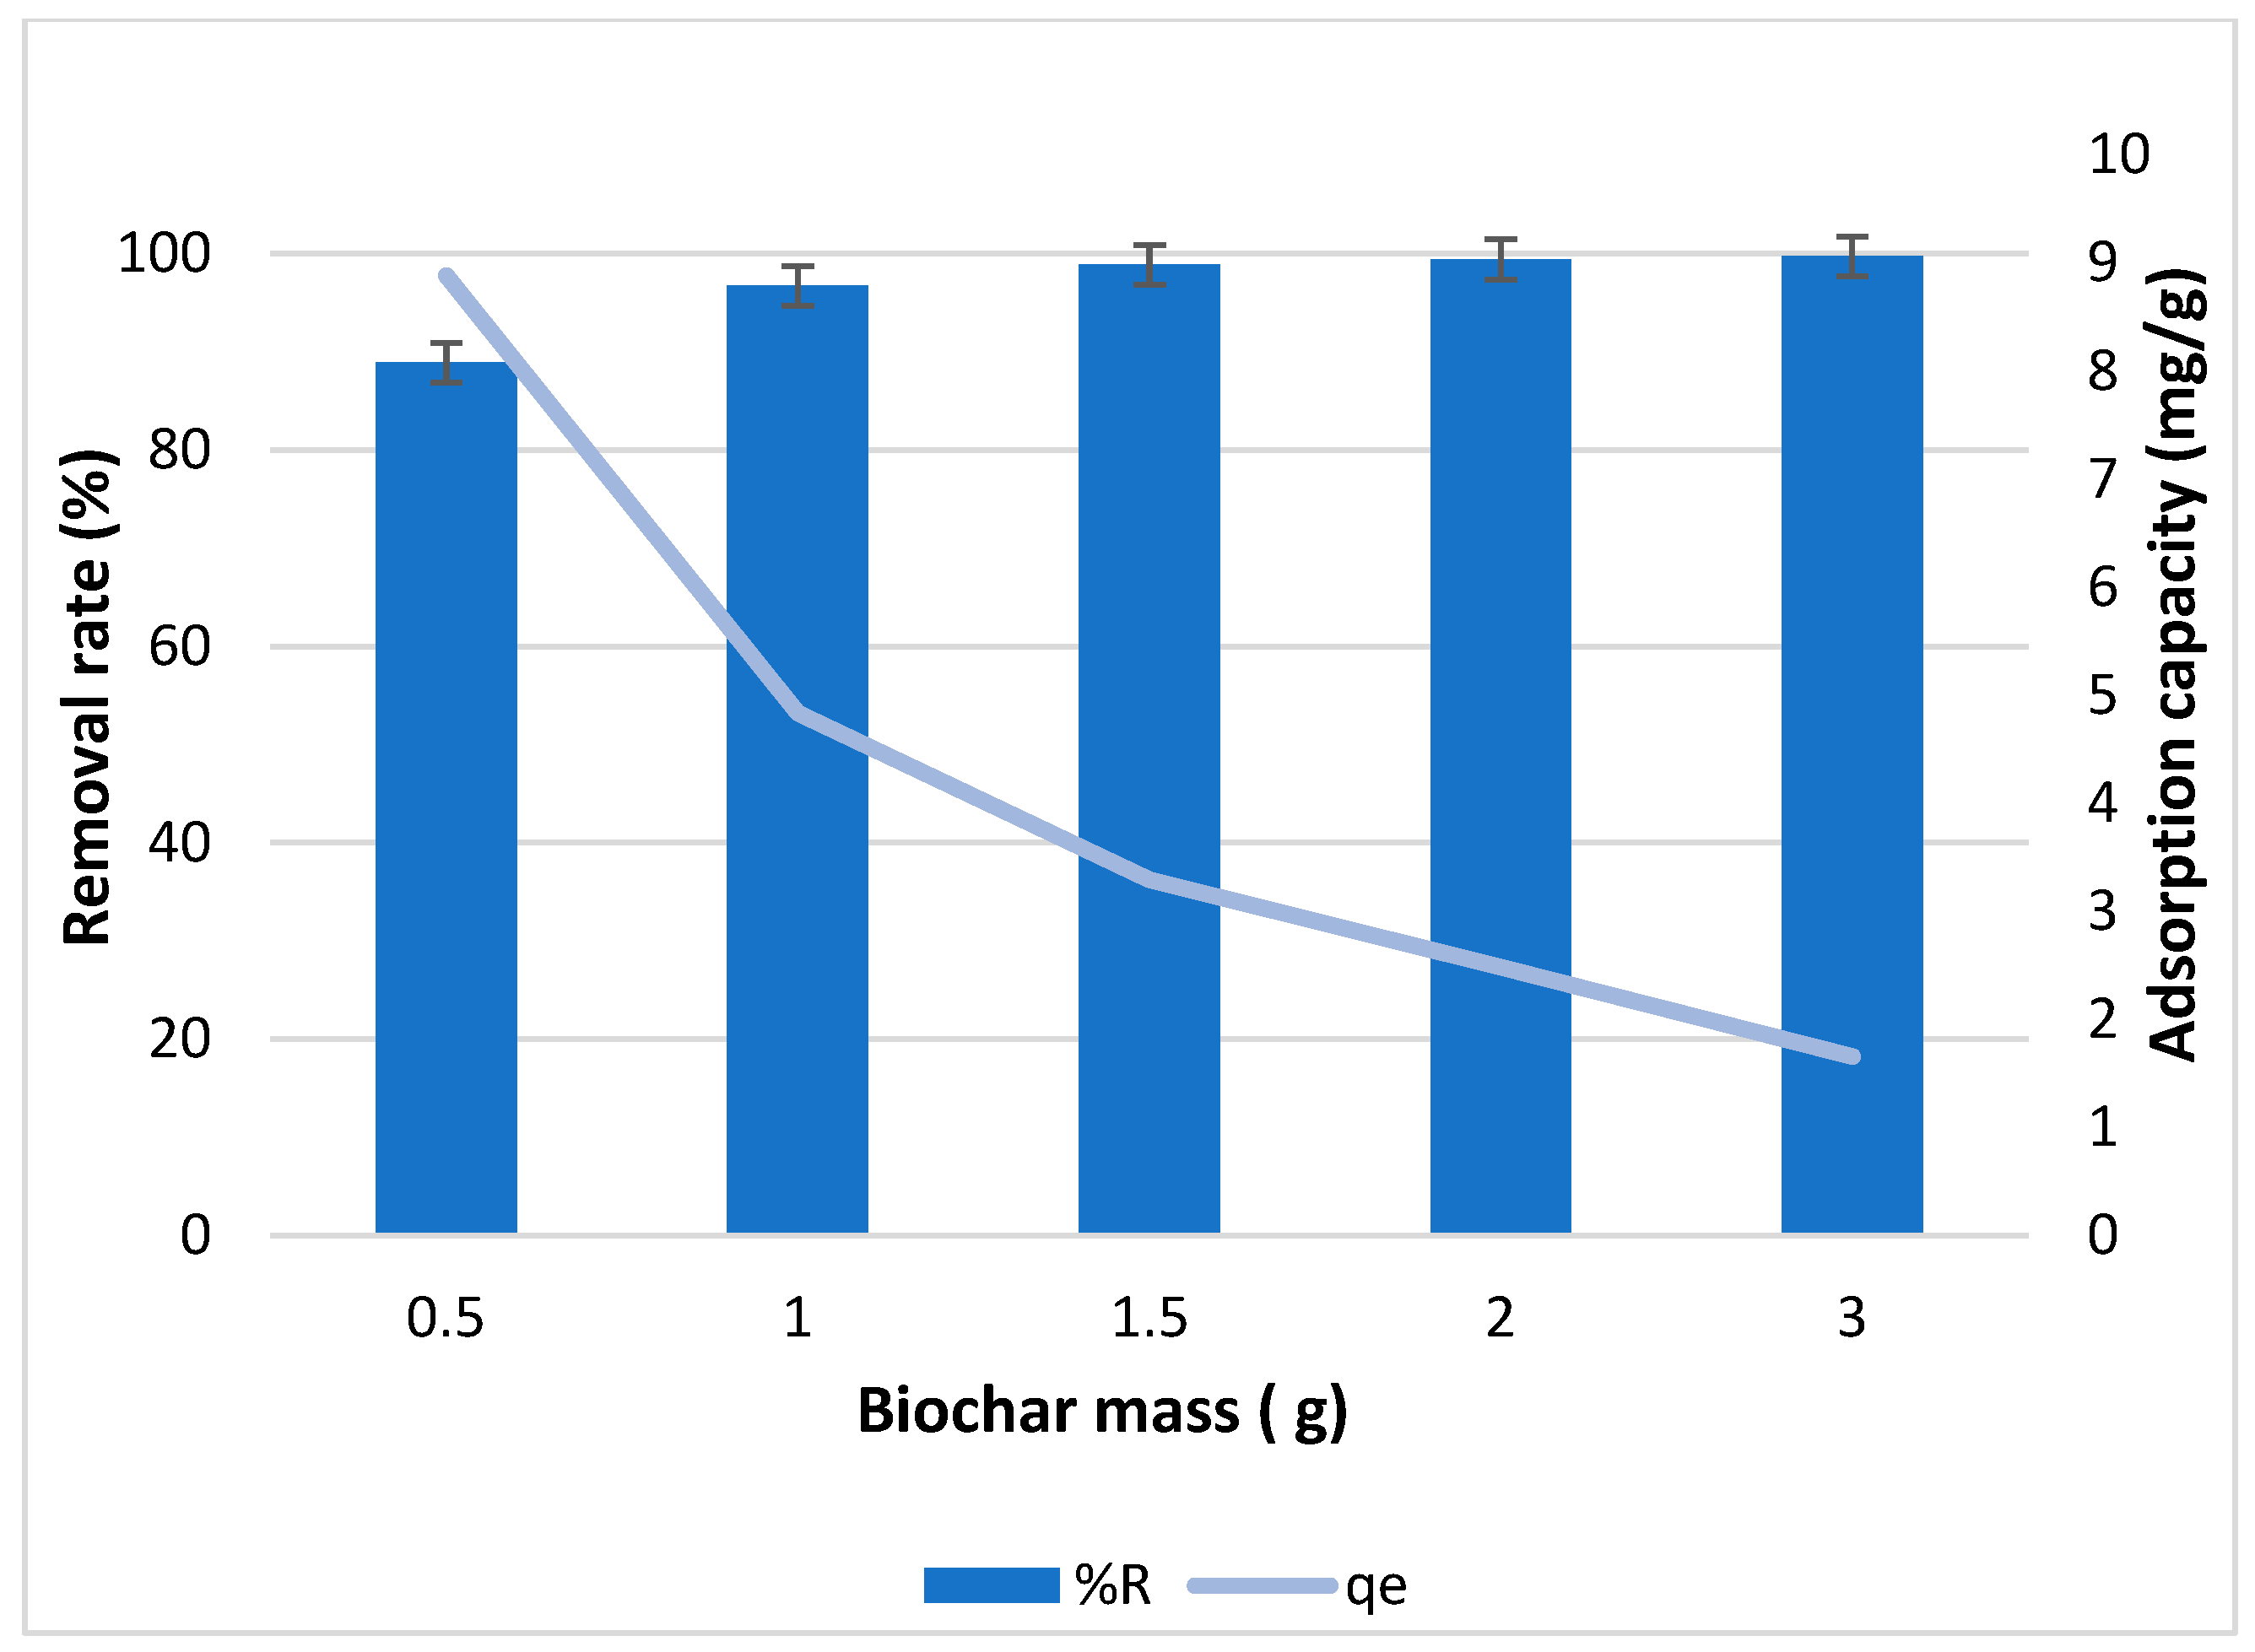
3.4. Effect of Biochar Dosage
Figure 7 represents the effect of biochar dosage on the removal rate and adsorption capacity of biochar for copper. The removal rate increased from 88 to 98% when the biochar mass increased from 0.5 to 3 g. However, the adsorption capacity decreased from 8 mg/g to 1 mg/g when biochar mass increased. A similar phenomenon of reducing capacity with increasing efficiency was found with the adding of adsorbent, which was a normal situation that had been reported frequently in the literature [
55,
56,
57].
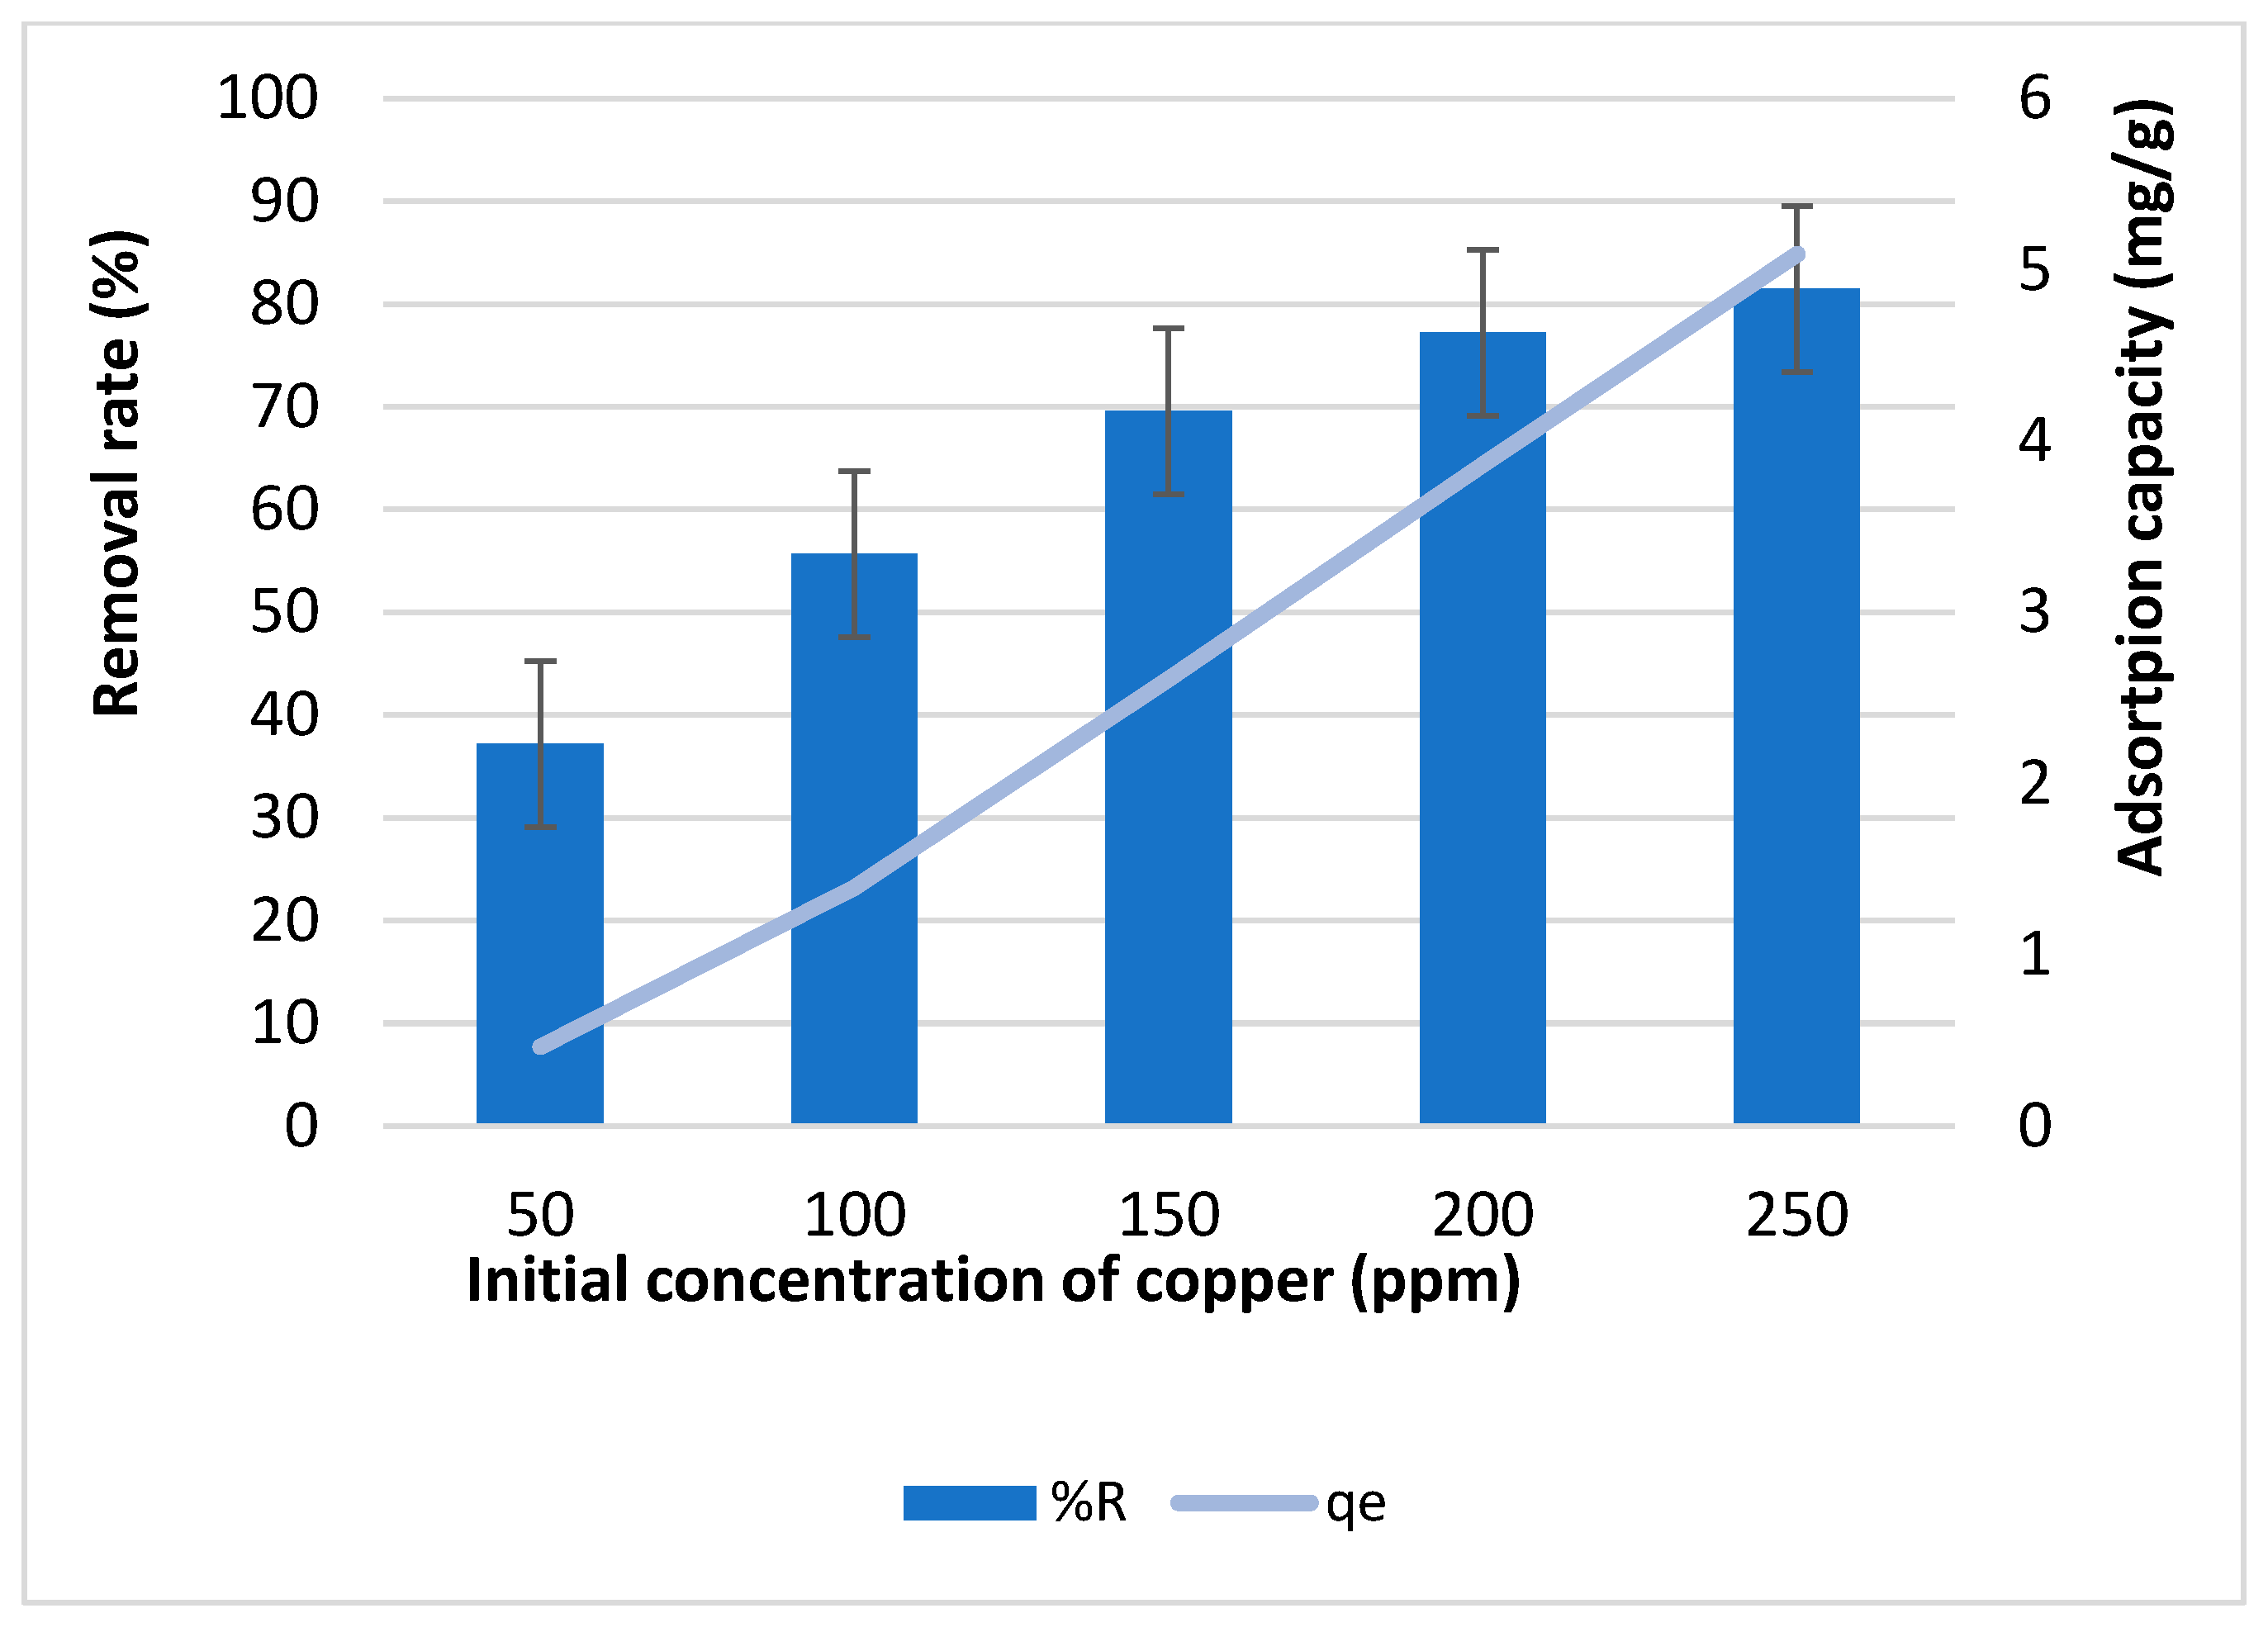
3.5. Effect of Biochar Modifications by H3PO4, H2SO4, and AgNO3
Figure 8 illustrates the impact of phosphoric acid activation on both the removal rate and adsorption capacity of biochar for copper ions for 1 h of contact time. As shown, the removal rate increases with an increase in initial copper concentration, ranging from 37.1% to 81.4% as the concentration increases from 50 to 250 ppm. Concurrently, the adsorption capacity increases from 0.4 to 5 mg/g within the same concentration range. However, unexpectedly, the removal rate and adsorption capacity of phosphoric acid-activated biochar were lower than those of non-activated biochar under identical conditions.
This unexpected result is attributed to structural changes induced by phosphoric acid activation, as evidenced by BET analysis, which showed a reduction in specific surface area. While phosphoric acid is widely used in biochar activation due to its ability to enhance mesoporosity and introduce phosphorus species that regulate textural properties [
23], excessive acid impregnation can lead to structural degradation. Studies, such as one by Iriarte-Velasco et al. (2016) [
22], have shown that high phosphoric acid concentrations can decompose lignocellulosic materials, causing morphological alterations that increase pore size but reduce overall surface area and total pore volume, as observed by Dechapanya and Khamwichit (2023) [
23].
Additionally, the amount of phosphoric acid incorporated into the biochar matrix plays a critical role in pore development. At optimized impregnation ratios, phosphoric acid effectively enhances porosity, but excessive impregnation can result in the formation of a dehydrated polyphosphoric acid layer that blocks pores, limiting access to adsorption sites [
57]. The presence of residual phosphate and polyphosphate species after washing may further contribute to pore blockage, reducing available adsorption sites, as mentioned by Nahil and Williams (2012) [
58].
The ratio of phosphoric acid (H
3PO
4) to biomass plays a critical role in determining the yield and surface characteristics of biochar. When the H
3PO
4:biomass ratio is increased up to 1, the carbon yield improves, but further increases beyond this ratio do not enhance the yield. However, higher ratios still significantly improve the specific surface area of the biochar, enhancing its adsorption potential. This trend, observed across different biomass types such as rice straw and mangrove, suggests that while phosphoric acid boosts porosity and surface area, it may reduce overall yield at higher concentrations, highlighting the need for an optimal ratio depending on the feedstock used [
59]. An appropriate H
3PO
4:biomass ratio, temperature, and activation time lead to improvement of the surface area and pore volume. However, beyond that, those properties can decrease because an increase in pore size leads to the collapse of the tiny pores [
60].
Thus, these structural modifications suggest that while phosphoric acid activation can improve mesoporosity under controlled conditions, an excessive or imbalanced activation process may negatively impact biochar’s adsorption efficiency, which may be the case in our situation.
Figure 9 illustrates the impact of initial copper concentration on the removal rate and adsorption capacity of biochar activated by H
2SO
4. At a copper concentration of 50 ppm, the removal rate peaked at 98% but declined to 83% as the copper concentration rose to 250 ppm. Concurrently, the adsorption capacity rose from 4.9 to 20.9 mg/g with an increase in initial copper concentration. The decline in removal efficiency with higher copper concentrations suggests adsorbent saturation, while the increase in adsorption capacity implies greater availability of metal ions for interaction with adsorption sites. These trends corroborate findings by Meez et al. (2021) [
61] and Orozco et al. (2023) [
62]. Interestingly, these results closely resemble those obtained using non-activated biochar under identical conditions. Despite the seven-time increase in surface area observed through BET analysis, this enhancement did not translate into improved adsorption performance. This indicates that the adsorption efficiency is primarily governed by surface chemistry and metal–biochar interactions rather than surface area alone, as the biochar used in this study was previously characterized by FTIR by Kataya et al. (2024) [
63], revealing an abundance of functional groups that play a critical role in copper adsorption [
14,
35].
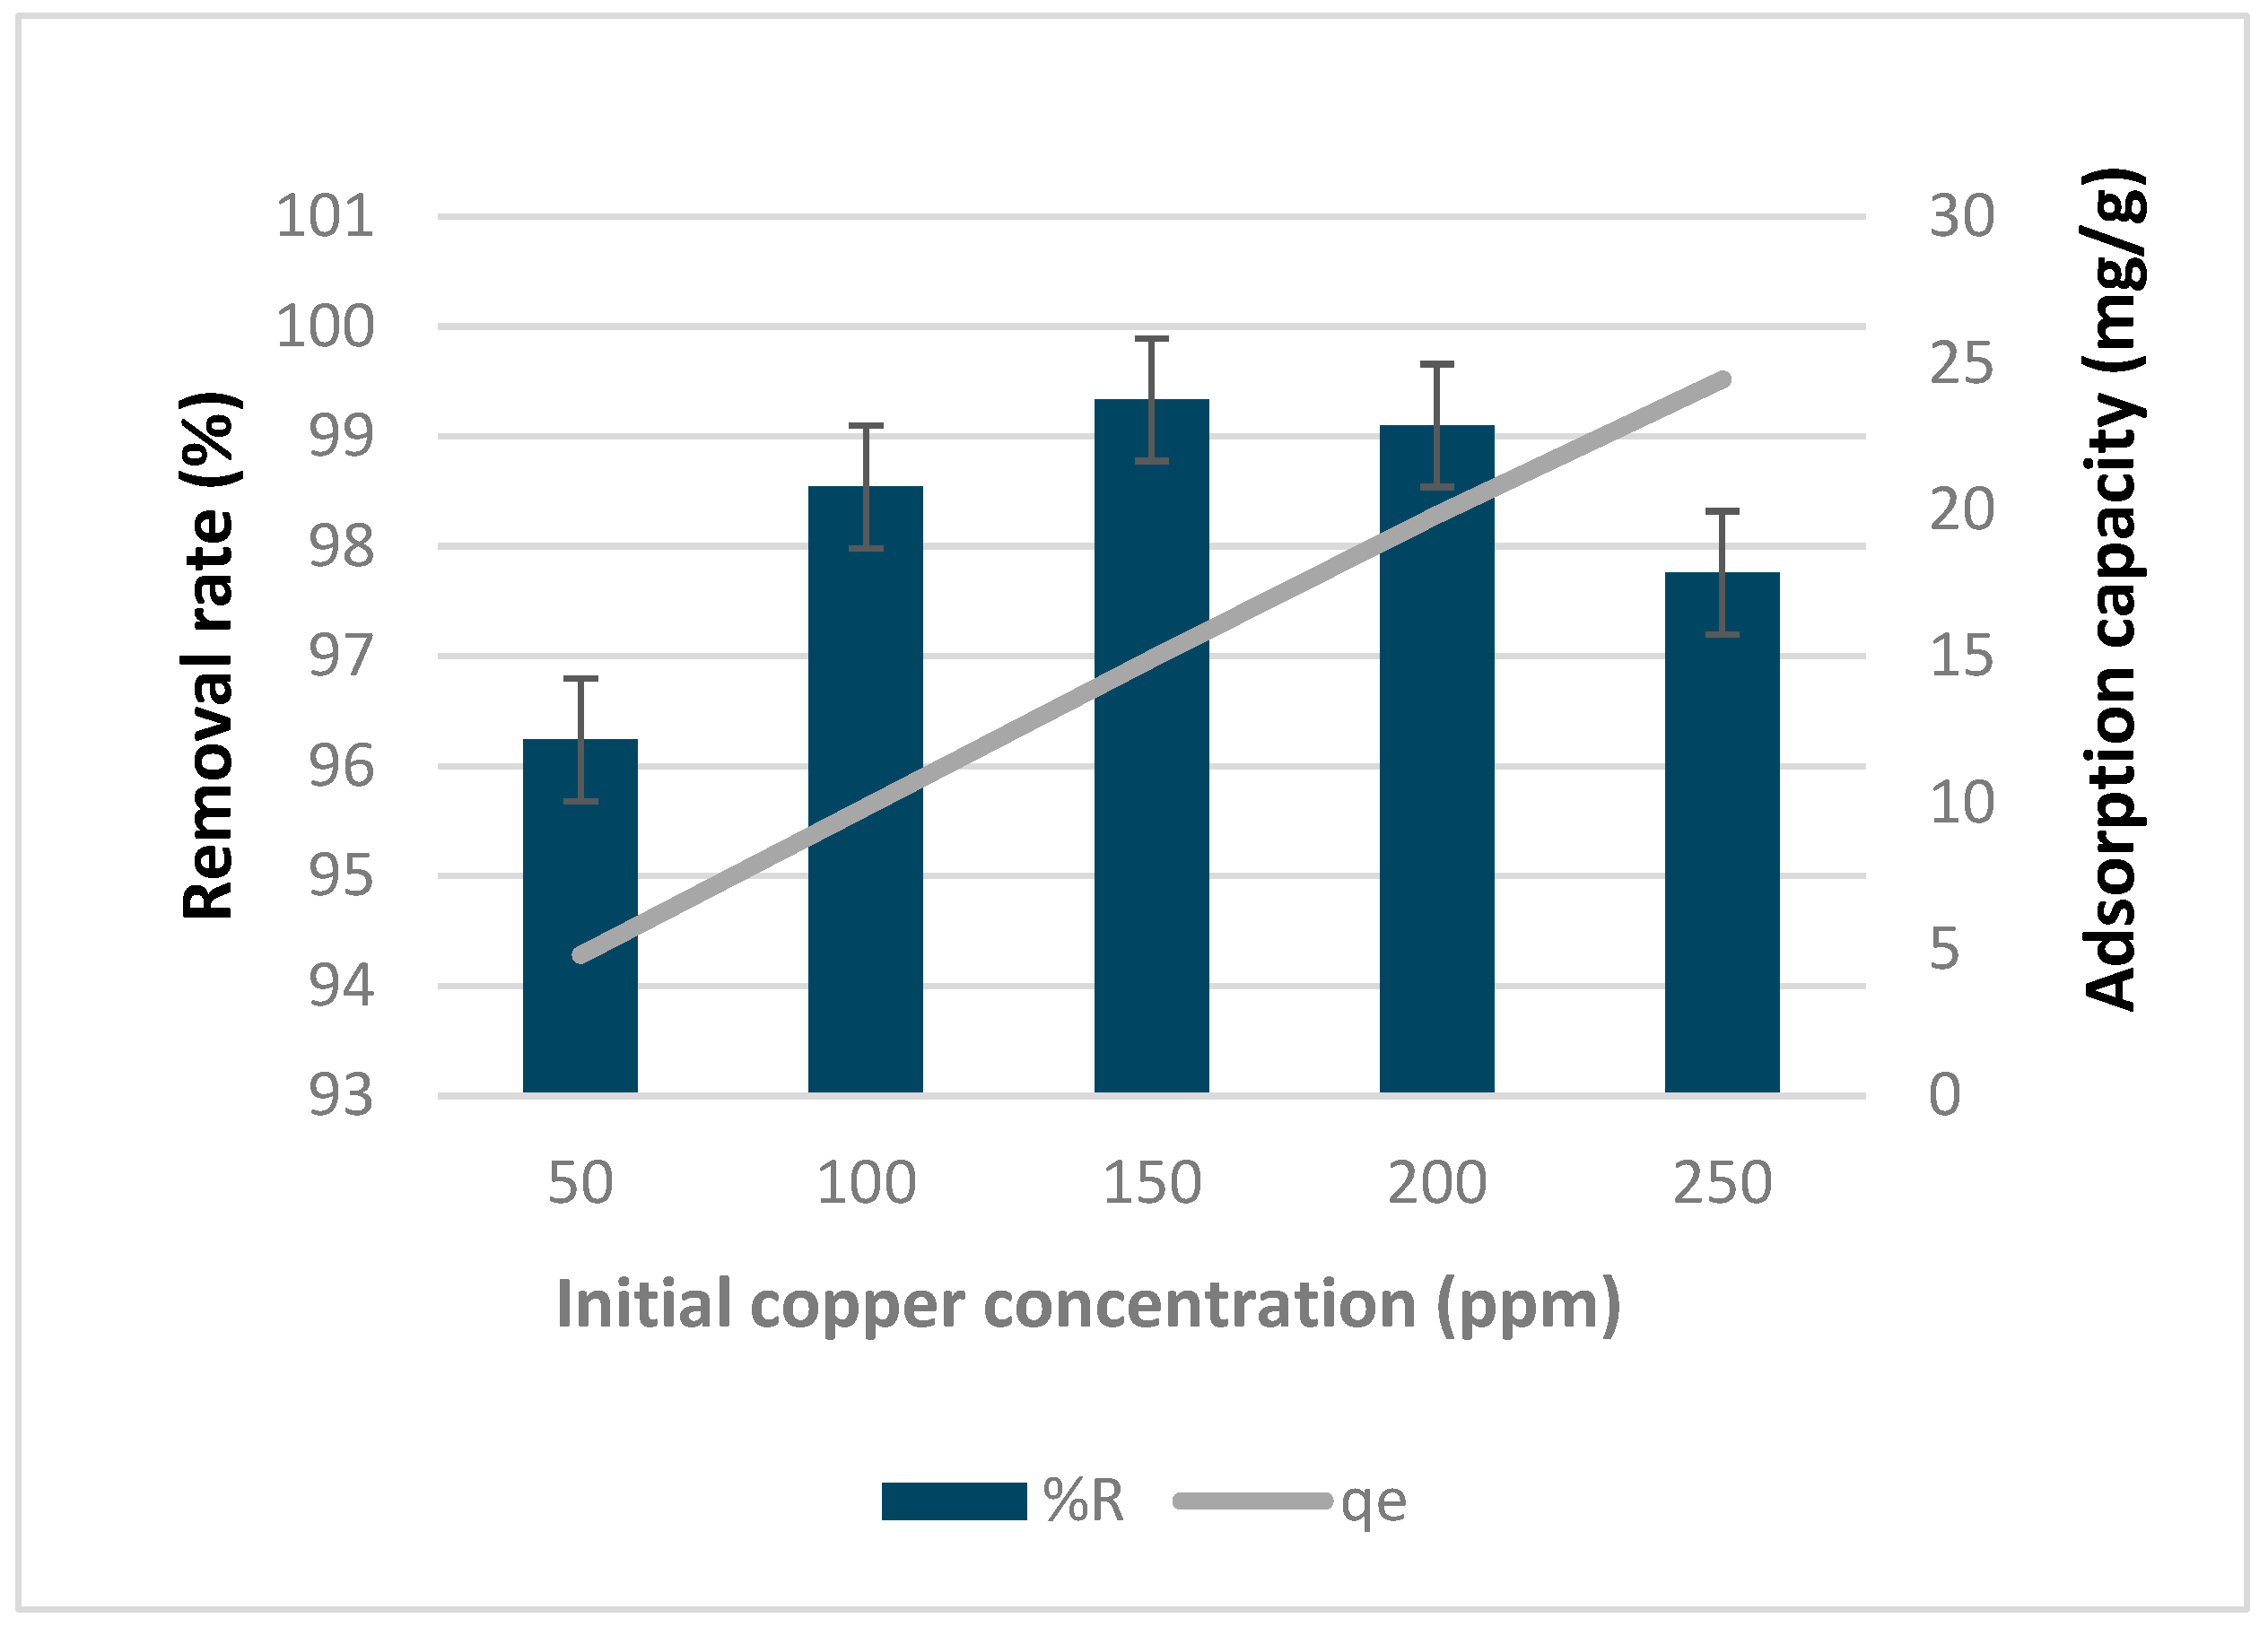
Figure 10 shows how the addition of silver nitrate to biochar affects its removal rate and adsorption capacity under various copper concentrations. The biochar treated with silver nitrate exhibited a high removal rate, ranging from 96% to 99.3%, with the highest rate observed at a copper concentration of 150 ppm. The adsorption capacity increased as the copper concentration increased, ranging from 4.8 to 24.4 mg/g.
In addition to its advantages, silver nitrate possesses potent antibacterial properties. This feature enhances the potential of biochar loaded with silver nitrate as an adsorbent for removing both metals and microbiological pollutants [
64].
Also, it must be mentioned that the conclusion of sulfuric acid leading to lower surface areas in some research was mentioned with the intention of highlighting that activation processes will not always enhance surface area; rather, the outcome greatly relies on conditions of activation such as acid concentration, impregnation ratio, temperature, and time. This behavior is not typical of the acid type concerned but is a general phenomenon with other chemical activators under non-optimal conditions. In our case, phosphoric acid activation reduced the surface area by possibly over-impregnation and pore blocking, consistent with findings in some publications, though such cases are relatively limited and poorly documented. Accordingly, this observation provides helpful insight to the literature, confirming the importance of optimizing activation parameters on a feedstock-to-feedstock and acid-to-acid basis.
Adsorption Mechanism of Copper on Biochar
Copper adsorption onto biochar occurs through a combination of physical and chemical mechanisms driven by the material’s surface chemistry and structure [
65]. For example, sulfuric acid activation introduces sulfonic acid groups (–SO
3H), enhancing the polarity and reactivity of the biochar surface [
62]. These polar functional groups facilitate electrostatic attraction between the negatively charged surface and Cu
2+ ions. Additionally, ion exchange plays a major role, where native cations (e.g., Ca
2+, K
+, Na
+) on the biochar surface are replaced by copper ions from solution, often accompanied by a drop in pH. Complexation further strengthens copper retention through the formation of stable bonds with oxygen-containing groups (–OH, –COOH). Pore filling also contributes to physical entrapment of Cu
2+ within the micro- and mesopores, especially when metal ions are small enough to diffuse efficiently. Lastly, co-precipitation with mineral components (e.g., phosphates, carbonates) present in the biochar matrix may immobilize copper as insoluble precipitates. Together, these synergistic mechanisms make biochar a multifunctional and efficient adsorbent for copper removal from aqueous media, as explained by Wood et al. (2023) [
65].
These proposed mechanisms are supported by the isotherm model analysis, which shows a better fit with the Langmuir model, indicating monolayer adsorption typically associated with chemisorption (see
Section 3.9). Additionally, the Freundlich model’s
n value > 1 suggests surface heterogeneity and supports the presence of physisorption through electrostatic interactions and pore filling [
66]. Together with the presence of reactive functional groups (–SO
3H, –OH, –COOH) and ion exchange behavior, these findings confirm the coexistence of both chemical and physical adsorption mechanisms.
3.6. Effect of Temperature
Figure 11 illustrates how the removal rate and adsorption capacity of copper by biochar are affected by temperature. The removal rate ranged from 91% to 94.5%, while the adsorption capacity varied between 9.1 and 9.4 mg/g. Both the removal rate and adsorption capacity increased as the temperature increased, reaching their peak at 60 °C, and then declined as the temperature further increased to 80 °C. Milenković et al. (2013) [
67] noted a similar trend, observing that the removal of copper(II) ion increases between 20 °C and 60 °C, but then rapidly decreases at higher temperatures. Musumba et al. (2020) [
68] also observed a comparable pattern wherein there was an increase in the percentage removal of both ions at 30 °C and 40° C. The reason behind this phenomenon might lie in the ions’ restricted movement due to their low kinetic energy, leading to fewer ions being able to access the active sites on the biochar. When the temperature increases, more sites become active, and pores form because bonds break on the edges. This means there is more surface area for the metal to adsorb onto [
69,
70]. The observed trend suggests that the adsorption process is endothermic up to an optimal point, as increased temperature facilitates the interaction between copper ions and active sites [
71]. However, when the temperature reached its optimal point, the adsorption process was attributed to the increased speed of ions spreading onto the biochar sites, since the process of diffusion tends to absorb heat. However, once the temperature surpassed 60 °C, there was a decline in the adsorption of both metal ions from the water solution, likely due to the desorption of the previously adsorbed species.
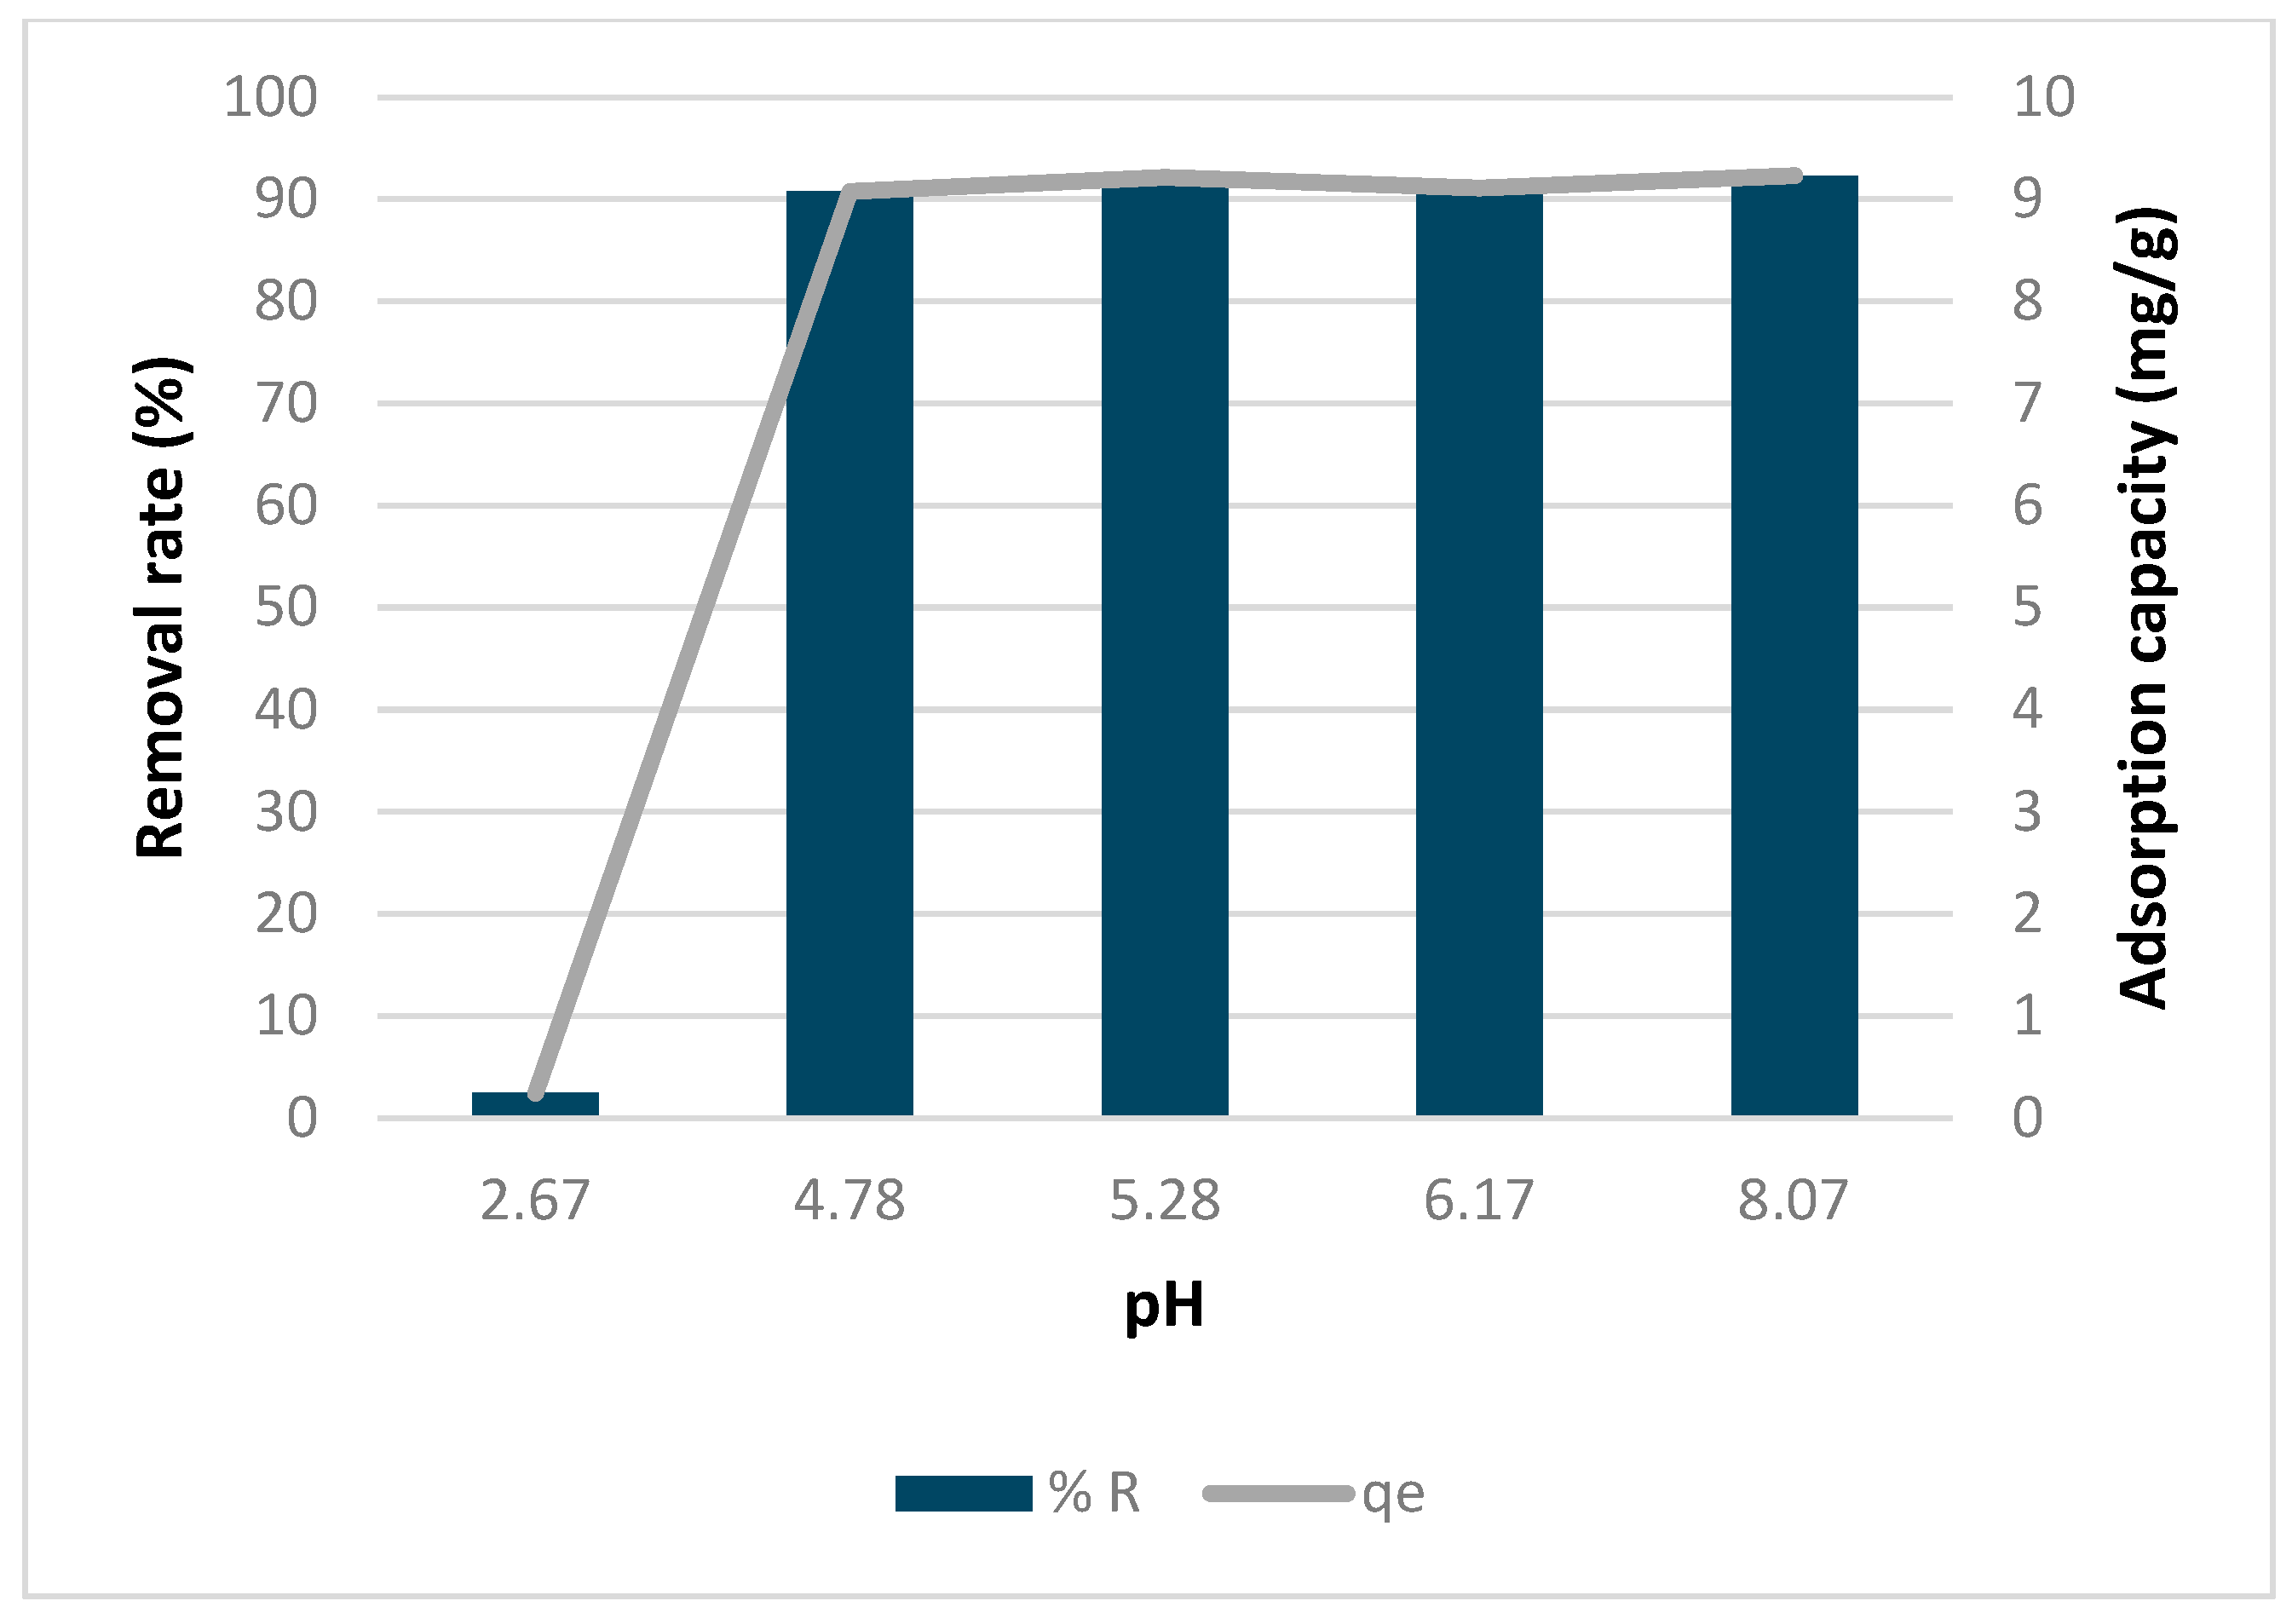
3.7. Effect of pH
Figure 12 illustrates how pH affects the rate of copper removal and its adsorption capacity by biochar. At very low pH levels, both the adsorption capacity and removal rate were low. However, they increased as pH increased to about 4.78 and remained steady up to a pH of 8.07. This pattern was observed as well by Wilson et al. (2024) [
70], where pH did not have an impact on the adsorption at the same range. The reason for the trend observed in this study is that at low pH levels, there are higher concentrations of H
+ and H
3O
+ ions, which compete with metal ions [
71]. Additionally, as pH increases, there is an increase in the Cu(OH)
+ ion, leading to higher copper adsorption, as explained by Albrecht et al. (2011) [
72]. This trend reverses around a pH of 8, when copper starts to precipitate, as noted by Oliveira et al. (2017) [
73].
3.8. FTIR After Copper Adsorption
The Fourier transform infrared (FTIR) spectroscopy analysis (
Figure 13) of the biochar samples after copper adsorption reveals significant differences in their surface functional groups and copper-binding mechanisms. These differences help explain the varying adsorption capacities and mechanisms associated with each modification method.
Raw biochar and H3PO4-modified biochar exhibited a similar FTIR profile, with only minor differences in peak intensity. This similarity suggests that both materials demonstrated comparable behavior in copper adsorption. This observation aligns with the previous findings above, which indicated that the H3PO4 activation of biochar was not as effective as anticipated.
The FTIR spectrum of H2SO4-modified biochar showed significant changes after copper adsorption, notably with a reduction in peaks within the ranges of 2700–1700 cm−1 and 1100–1300 cm−1, indicating the occupation of these functional groups by copper ions. In contrast, the Ag-modified biochar retained its irregular FTIR spectrum, showing more intense peaks.
The comparison of FTIR spectra before and after copper adsorption demonstrates that chemical modification (H2SO4) significantly enhances the biochar’s adsorption capacity by introducing functional groups capable of combining copper ions.
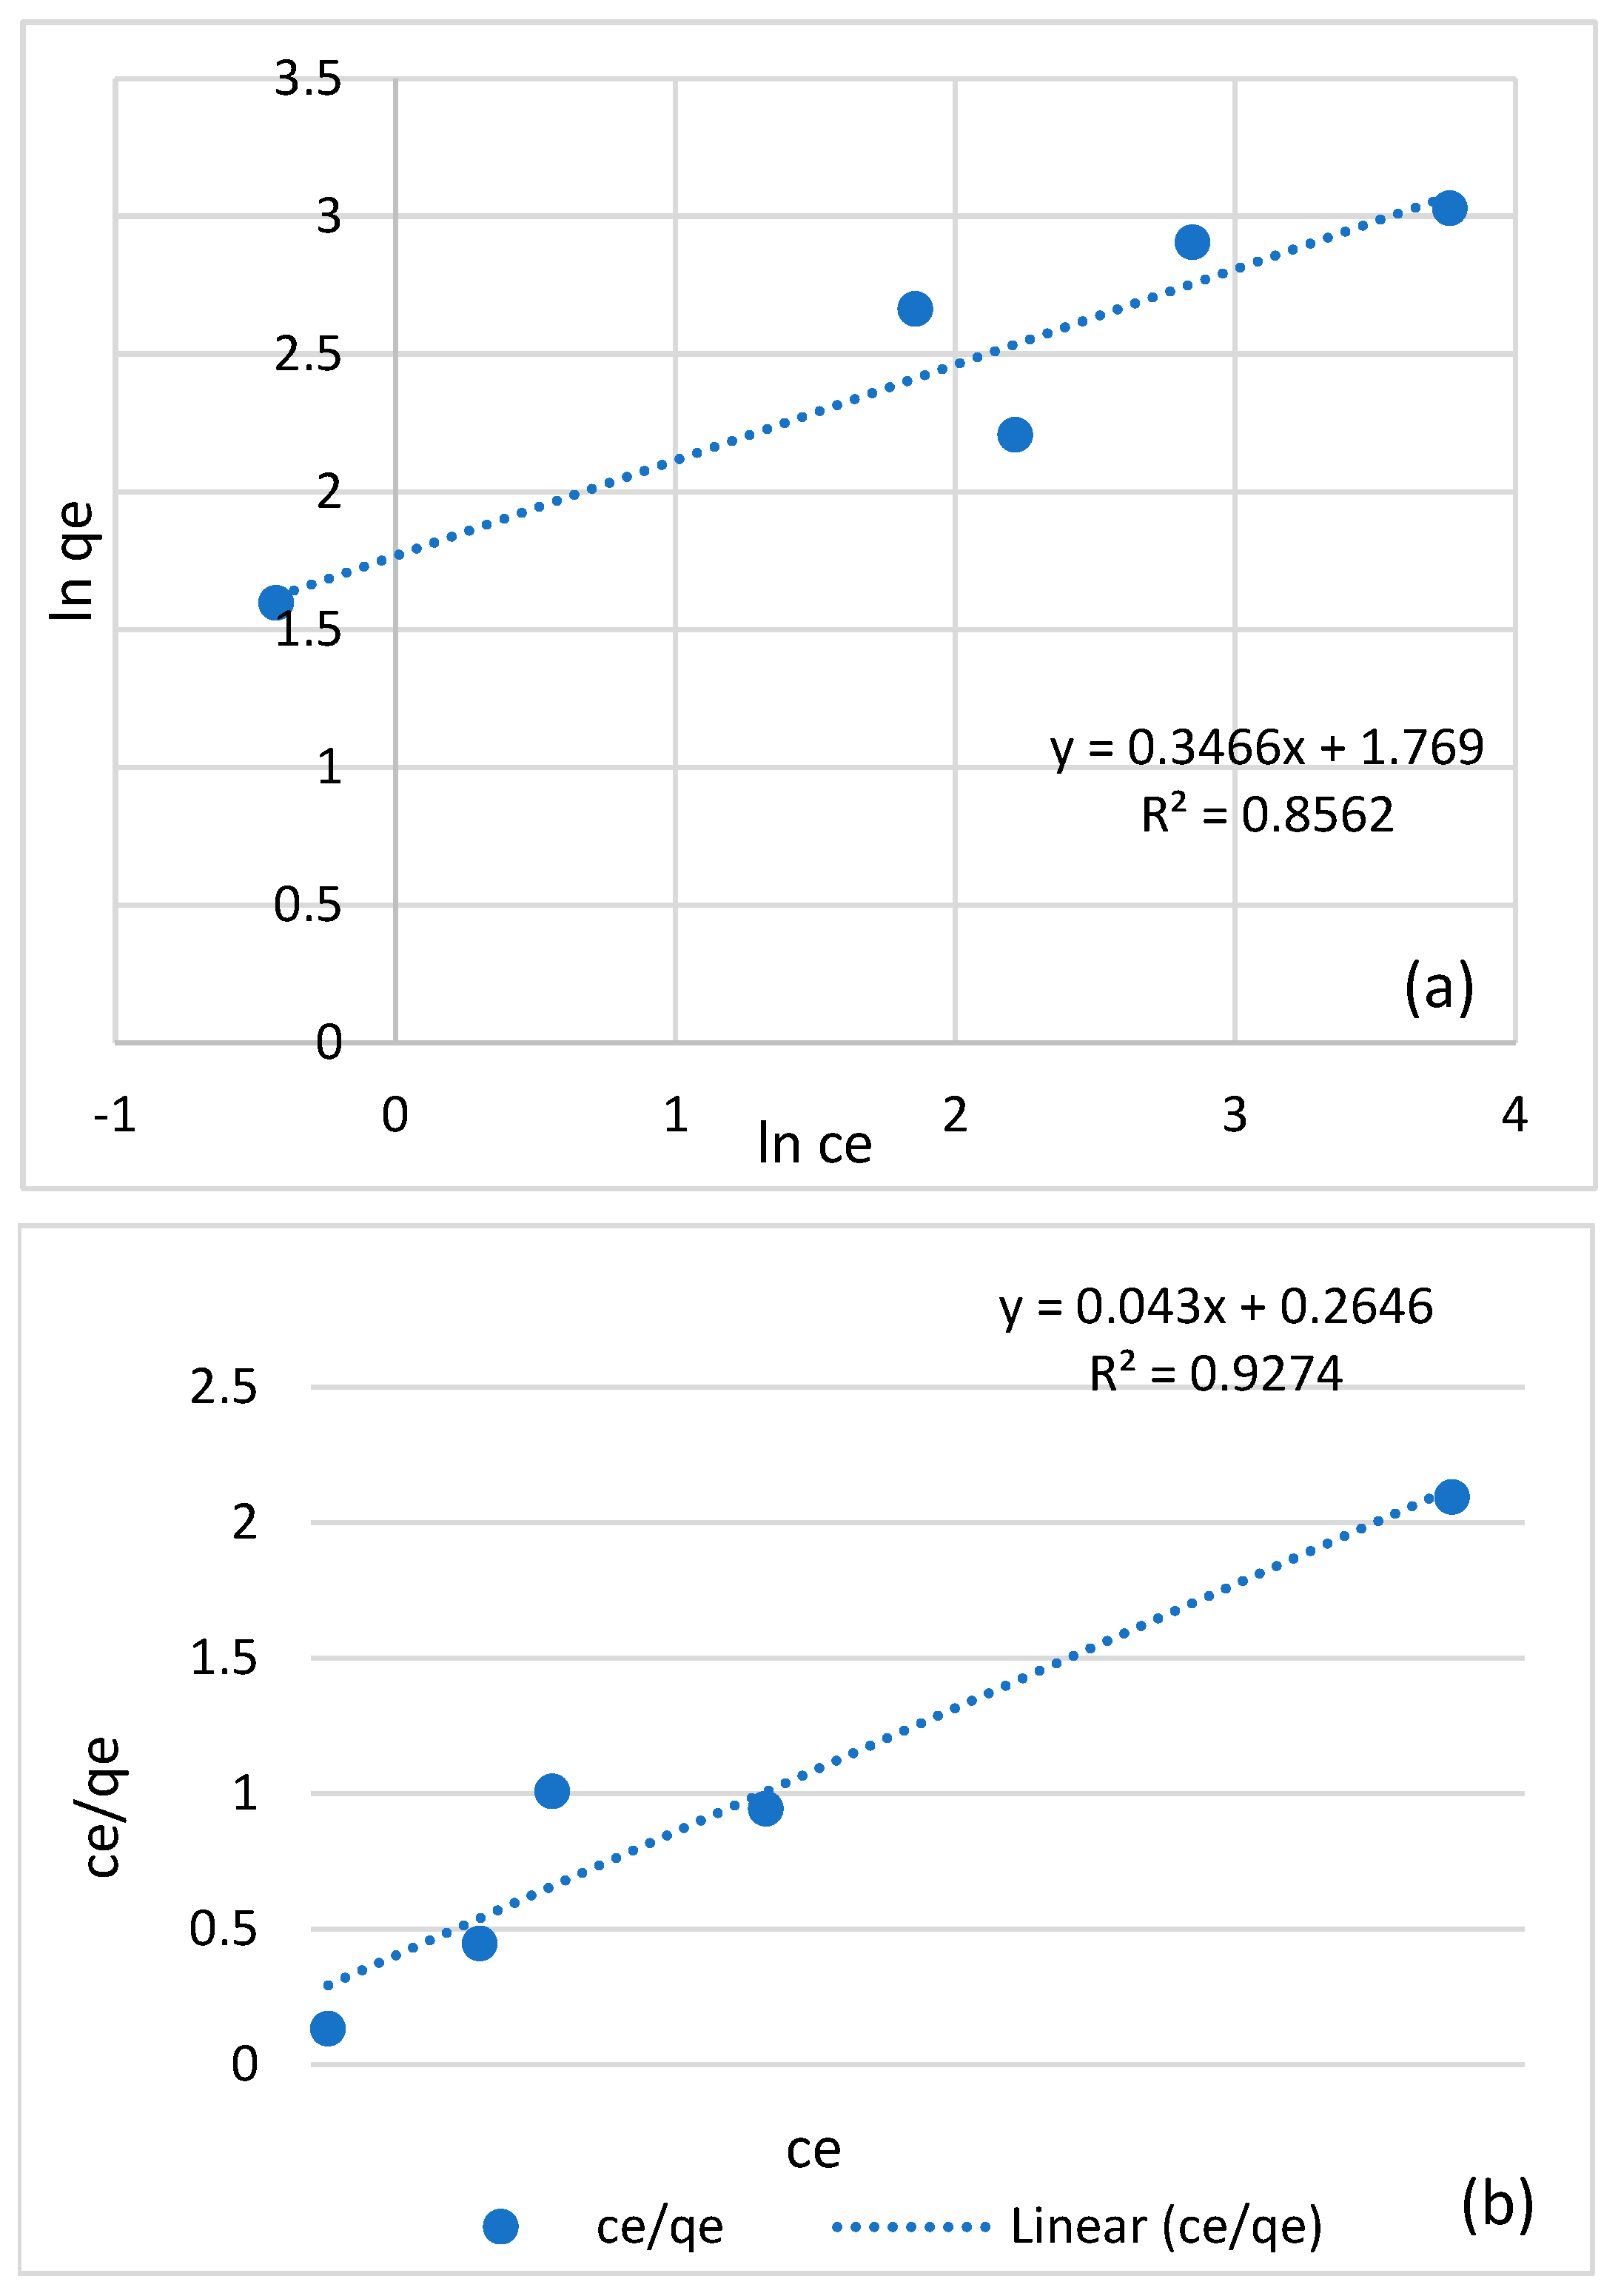
3.9. Adsorption Isotherm
Adsorption isotherm experiments at different copper concentrations using non modified biochar were conducted. Langmuir and Freundlich models were used to simulate the experimental data. The fitting parameters are listed in
Table 4 and the simulated results from the Langmuir and Freundlich models are shown in
Figure 14.
Table 4 reveals that the correlation coefficient (R
2) values for the Langmuir model consistently exceeded those for the Freundlich model. This pattern suggests that the Langmuir model provides a better fit for the actual experimental data, indicating that the adsorption process likely involves monolayers. Additionally, when comparing the linear fitting of the Langmuir model to that of the Freundlich model, the former exhibited better performance, signifying its superior ability to describe the adsorption process accurately. Furthermore, the Langmuir model also suggests a maximum adsorption capacity of approximately 23.25 mg/g. The fact that n is greater than 1 in the Freundlich model indicates that adsorption becomes increasingly favorable at higher concentrations, implying stronger adsorption affinity at elevated concentration levels.
Table 5 summarizes various biochar feedstocks, treatment methods, and their corresponding maximum adsorption capacities for copper ions. The adsorption capacities vary significantly, ranging from 0.82 to 227.27 mg/g, which can be attributed to several factors, including feedstock type, treatment methods, and experimental conditions. Notably, even biochars activated using the same chemical (e.g., NaOH) exhibited a wide range of adsorption capacities—from 3.7 mg/g to 227.27 mg/g—further underscoring the specificity of each adsorption system and the influence of even slight variations in preparation or test conditions.
Our findings are consistent with the literature, as the maximum adsorption capacity of our kitchen waste-derived biochar falls within the reported range. In fact, it shows better performance compared to some materials such as sawdust or Pinus radiata sawdust, reaffirming the unique behavior of each biochar–metal system. Additionally, the use of kitchen waste as a biochar feedstock, especially in the specific composition presented in our study, has not been extensively explored in previous literature, thus representing a new insight.
4. Conclusions
Biochar characterization revealed promising attributes for adsorption applications. Analysis of its structure demonstrated robust adsorption capacity, with higher pyrolysis temperatures enhancing this capability by reducing negative surface charge. Raman spectroscopy confirmed its stable structure conducive to effective storage and adsorption. In assessing factors affecting adsorption, the initial concentration of copper played a significant role. Biochar loaded with silver nitrate exhibited the highest adsorption capacity (24.44 mg/g) at 250 ppm of copper, whereas phosphoric acid activation led to decreased capacity (5 mg/g) due to structural damage. Sulfuric acid activation significantly improved removal rate and adsorption capacity, despite a sevenfold increase in surface area (33 m2/g). Regarding pH sensitivity, biochar demonstrated independence, simplifying operational requirements for treatment systems. At 150 ppm of copper, silver nitrate-loaded biochar exhibited the highest removal rate. Optimal conditions for maximum removal rate and adsorption capacity occurred at 100 ppm of copper, with 60 °C temperature and 30 min duration. Biochar masses of 3 g and 0.5 g yielded the highest removal rate and adsorption capacity, respectively. Adsorption isotherms indicated Langmuir as the best-fit model, suggesting a monolayer adsorption process with a maximum capacity of 23.25 mg/g. However, future work would include detailed kinetic studies to better elucidate the adsorption dynamics and rate-controlling steps of copper removal on biochar. In addition, future studies will involve desorption and regeneration tests to evaluate the reusability and long-term performance of the biochar. One of the main objectives of this study was to establish a foundational understanding of the adsorption performance of biochar derived from a novel kitchen waste blend under defined conditions; based on the promising results with single-metal systems, future research will also expand to mixed-metal and multi-pollutant scenarios, as suggested, to further evaluate the selectivity and broader applicability of this low-cost, sustainable material in real wastewater treatment.
In conclusion, kitchen waste-derived biochar proves to be a promising adsorbent for copper removal due to its structure and characteristics with potential for broader environmental remediation applications. Optimal conditions involve specific parameters like temperature, duration, and biochar mass.


 ,
, 

