Article

Effects of Enrofloxacin and Ciprofloxacin on Growth and Toxin Production of Microcystis aeruginosa

1
Fisheries College, Jimei University, Xiamen 361021, China
2
Fujian Provincial Key Laboratory of Marine Fishery Resources and Eco-Environment, Fisheries College, Jimei University, Xiamen 361021, China
3
Key Laboratory of Healthy Mariculture for the East China Sea, Ministry of Agriculture and Rural Affairs, Fisheries College, Jimei University, Xiamen 361021, China
*
Author to whom correspondence should be addressed.
Water 2023, 15(20), 3580; https://doi.org/10.3390/w15203580
Submission received: 4 September 2023 / Revised: 9 October 2023 / Accepted: 11 October 2023 / Published: 13 October 2023
(This article belongs to the Special Issue Coastal Ecology and Fisheries Management)

Abstract

:
Microcystis aeruginosa is a common cyanobacterium found in water blooms and often causes ecological harm. Antibiotics are also increasingly used for the prevention and treatment of bacterial infections in aquaculture. However, since most antibiotics cannot be fully metabolized, they enter the water environment and cause ecological impacts. In this paper, the effects of the two fluoroquinolone antibiotics (enrofloxacin and ciprofloxacin) on the population density and microcystins (MCs) production of M. aeruginosa were studied. It is of great significance for the ecological risk assessment of antibiotics in the water environment. The results showed that the 96h EC50 values of enrofloxacin and ciprofloxacin to M. aeruginosa were 56.10 mg/L and 49.80 mg/L, respectively, and the toxicity of ciprofloxacin to M. aeruginosa was slightly stronger than that of enrofloxacin. With the increase in the two antibiotic concentration, the growth inhibition rate (IR) increased, but when the concentration reached a certain level, the IR would reach its threshold. Long-term exposure to low concentrations of these two antibiotics is not only more likely to lead to the outbreak of M. aeruginosa, but also increase its toxin production capacity. The highest contents of MCs in enrofloxacin and ciprofloxacin groups were 95.539 μg/g and 93.720 μg/g, respectively. The MCs value of these three enrofloxacin treatment groups was more than above 51.8 times that of control group (CK) on the 4th day; from 8th day to 14th day, the MCs value of these three enrofloxacin treatment groups was more than above 3.2 times that of CK group. For ciprofloxacin, the MCs value of the treatment group was more than 64.98 times that of the CK group on the 4th day, and from 8th day to 14th day, the MCs value of the treatment group was more than 2.7 times that of the CK group. These findings provide crucial management rationale.

1. Introduction

The global average annual consumption of antibiotics is about 2 million tons [1]. In China, the production and consumption of antibiotics rank among the top in the world, with an annual per capita consumption of 138 g [2]. According to statistics in 2013, the annual consumption of antibiotics in China is nine times that of the United States and 150 times that of the United Kingdom, reaching as high as 162,000 tons [3,4]. Over the past ten years, with the rapid development of aquaculture in China, the output of aquatic products in China has gradually ranked first in the world [5]. The problem of frequent bacterial diseases of various aquatic animals (including fish and shrimps) that follow is also becoming more and more serious [6]. Therefore, antibiotics are also increasingly used for the prevention and treatment of bacterial infections in aquaculture. However, due to the metabolic rate of antibiotics in organisms of 20–30%, most antibiotics taken cannot be fully metabolized by humans and animals; about 20.0–97.0% are excreted in the form of active substances and enter the environment [7]. Currently, more than 50 antibiotics have been detected in various water bodies [8]. The antibiotics most frequently detected in surface and wastewater are fluoroquinolones, followed by sulfonamides, tetracyclines, and macrolides [9]. The highest concentrations (over 100 μg/L) were found in hospital wastewater [9]. The fluoroquinolones enrofloxacin (EF) and ciprofloxacin (CF) not only have a high detection rate of pollutants in water bodies but are also the two most common and easiest to detect antibiotics in aquatic products [10]. In particular, the residues of EF in some aquatic products have exceeded the 50 μg/kg stipulated by the Food and Agriculture Organization of the United Nations/World Health Organization (FAO/WHO), with a detection rate of 46.9% and a maximum residue of 67 μg/kg [11,12,13,14]. As the primary producers of aquatic ecosystems, the diversity and primary production of algae species directly affect the community structure and function of aquatic ecosystems. At the same time, microalgae generally have a high tolerance to pollutants and can grow in various types of wastewater. Therefore, they have great potential for removing pollutants from industrial and municipal wastewater [15]. Microalgae have attracted attention for their ability to thrive in different environmental conditions and their potential to convert nutrients into high-value compounds [15]. Therefore, some microalgae algae are ideal test organisms for new pollutants [16].
According to the survey of the United Nations Environment Program, 30% to 40% of the world’s lakes and reservoirs are affected by eutrophication [17]. More than 80% of lakes and reservoirs in China are in eutrophication state [18]. The outbreak of cyanobacterial blooms will destroy biodiversity and ecosystem balance [19], leading to a serious decline in water quality and threats to drinking water sources [20]. It also releases algae toxins, which are harmful to human health [21]. Microcystis aeruginosa is a common cyanobacterial species of water bloom, and in most eutrophic water bodies in China, it dominates in both quantity and occurrence frequency [22]. Therefore, studying the toxic response of M. aeruginosa to fluoroquinolone antibiotics is of great significance.
Microcystins (MCs) are the most common cyanobacterial toxin, mainly produced by M. aeruginosa and commonly found in freshwater lakes, rivers, and aquaculture environments around the world. Furthermore, the antibiotics most commonly detected in surface and aquaculture waters are fluoroquinolones. Therefore, the goal of this study was to explore the effects of two fluoroquinolone antibiotics (enrofloxacin and ciprofloxacin) on M. aeruginosa population density and microcystin (MCs) production. To evaluate the impact of antibiotics in aquatic environments, an index of semi-inhibitory effective concentration (EC50) to compare the toxicity of the two fluoroquinolone antibiotics against M. aeruginosa was used. On this basis, the effects of long-term exposure to safe concentrations of the two fluoroquinolone antibiotics on the toxin production of M. aeruginosa were measured and explored.

2. Materials and Methods

2.1. Test Material

2.1.1. Algal Species Tested

Microcystis aeruginosa (No. FACHB-930) was purchased from the Freshwater Algae Species Bank of the Institute of Hydrobiology, Chinese Academy of Sciences. M. aeruginosa was used in this experiment after multi-generation domestication and cultivation in the laboratory.

2.1.2. Test Drugs

EF injection (5% purity) was produced by the Shanghai Veterinary Medicine Factory of Shanghai Tongren Pharmaceutical Co., Ltd. (Shanghai, China) CF hydrochloride injection (5% purity) was produced by the Jiangxi Heguang Pharmaceutical Co., Ltd. (Fuzhou, China) Drugs are ready-to-use and prepared, and a certain volume is added to the culture medium according to the required concentration.

2.2. Methods

2.2.1. Preparation of BG11 Medium

(1) Stock1: 0.30 g, 0.30 g, and 0.05 g of citric acid (C6H8O7), ferric ammonium citrate (C6H8FeNO7), and disodium ethylene diamine tetra acetic acid (EDTA-Na2) were taken and dilute to 100 mL with ultrapure water; (2) Stock2: Sodium nitrate (NaNO3), dipotassium hydrogen phosphate (K2HPO4) were taken, magnesium sulfate heptahydrate (MgSO4·7H2O) 2.00 g, 30.00 g, 0.78 g were adjusted to 1000 mL with ultrapure water; (3) Stock3: calcium chloride (CaCl2·2H2O) 1.90 g were taken to 100 mL; (4) Stock4: 2.00 g of sodium carbonate (Na2CO3) were taken to 100 mL; (5) Stock5: Take boric acid (H3BO3), manganese dichloride (MnCl2 4H2O), cobalt nitrate hexahydrate (Co (NO3)2·6H2O), sodium molybdate (NaMoO4·2H2O), zinc sulfate heptahydrate (ZnSO4·7H2O), copper sulfate pentahydrate (CuSO4·5H2O) 2.86 g, 1.81 g, 0.04 g, 0.391 g, 0.222 g, 0.079 g, respectively and dilute to 1000 mL.
2 mL each of Stock1 and Stock3, 1 mL each of Stock4 and Stock 5, and 20 mL of Stock2 were taken and dilute to 1000 mL to prepare BG11 medium [23,24]. The test reagents were all analytically pure.

2.2.2. Culture of M. aeruginosa

Before culturing, the medium and containers used in the cultivating process need to be sterilized at a high temperature (121 °C) for 30 min. Then, transfer the relevant experimental supplies to the aseptic operating table, wait for the culture medium to cool down and sterilize by ultraviolet light for 30 min. Then, proceed to the follow-up operation. To ensure that under sterile conditions, the algae were cultured to the logarithmic growth phase in the BG11 culture medium, and further expanded the culture fluids.
The culture conditions are day and night temperatures of 25–34 °C, a light-dark ratio 12 h:12 h, and static culture under natural light. Manually shake three times a day at regular intervals to reduce algae cell adhesion. After the microscopic examination of the normal cells, the algae in the logarithmic growth phase were taken for the test [25].

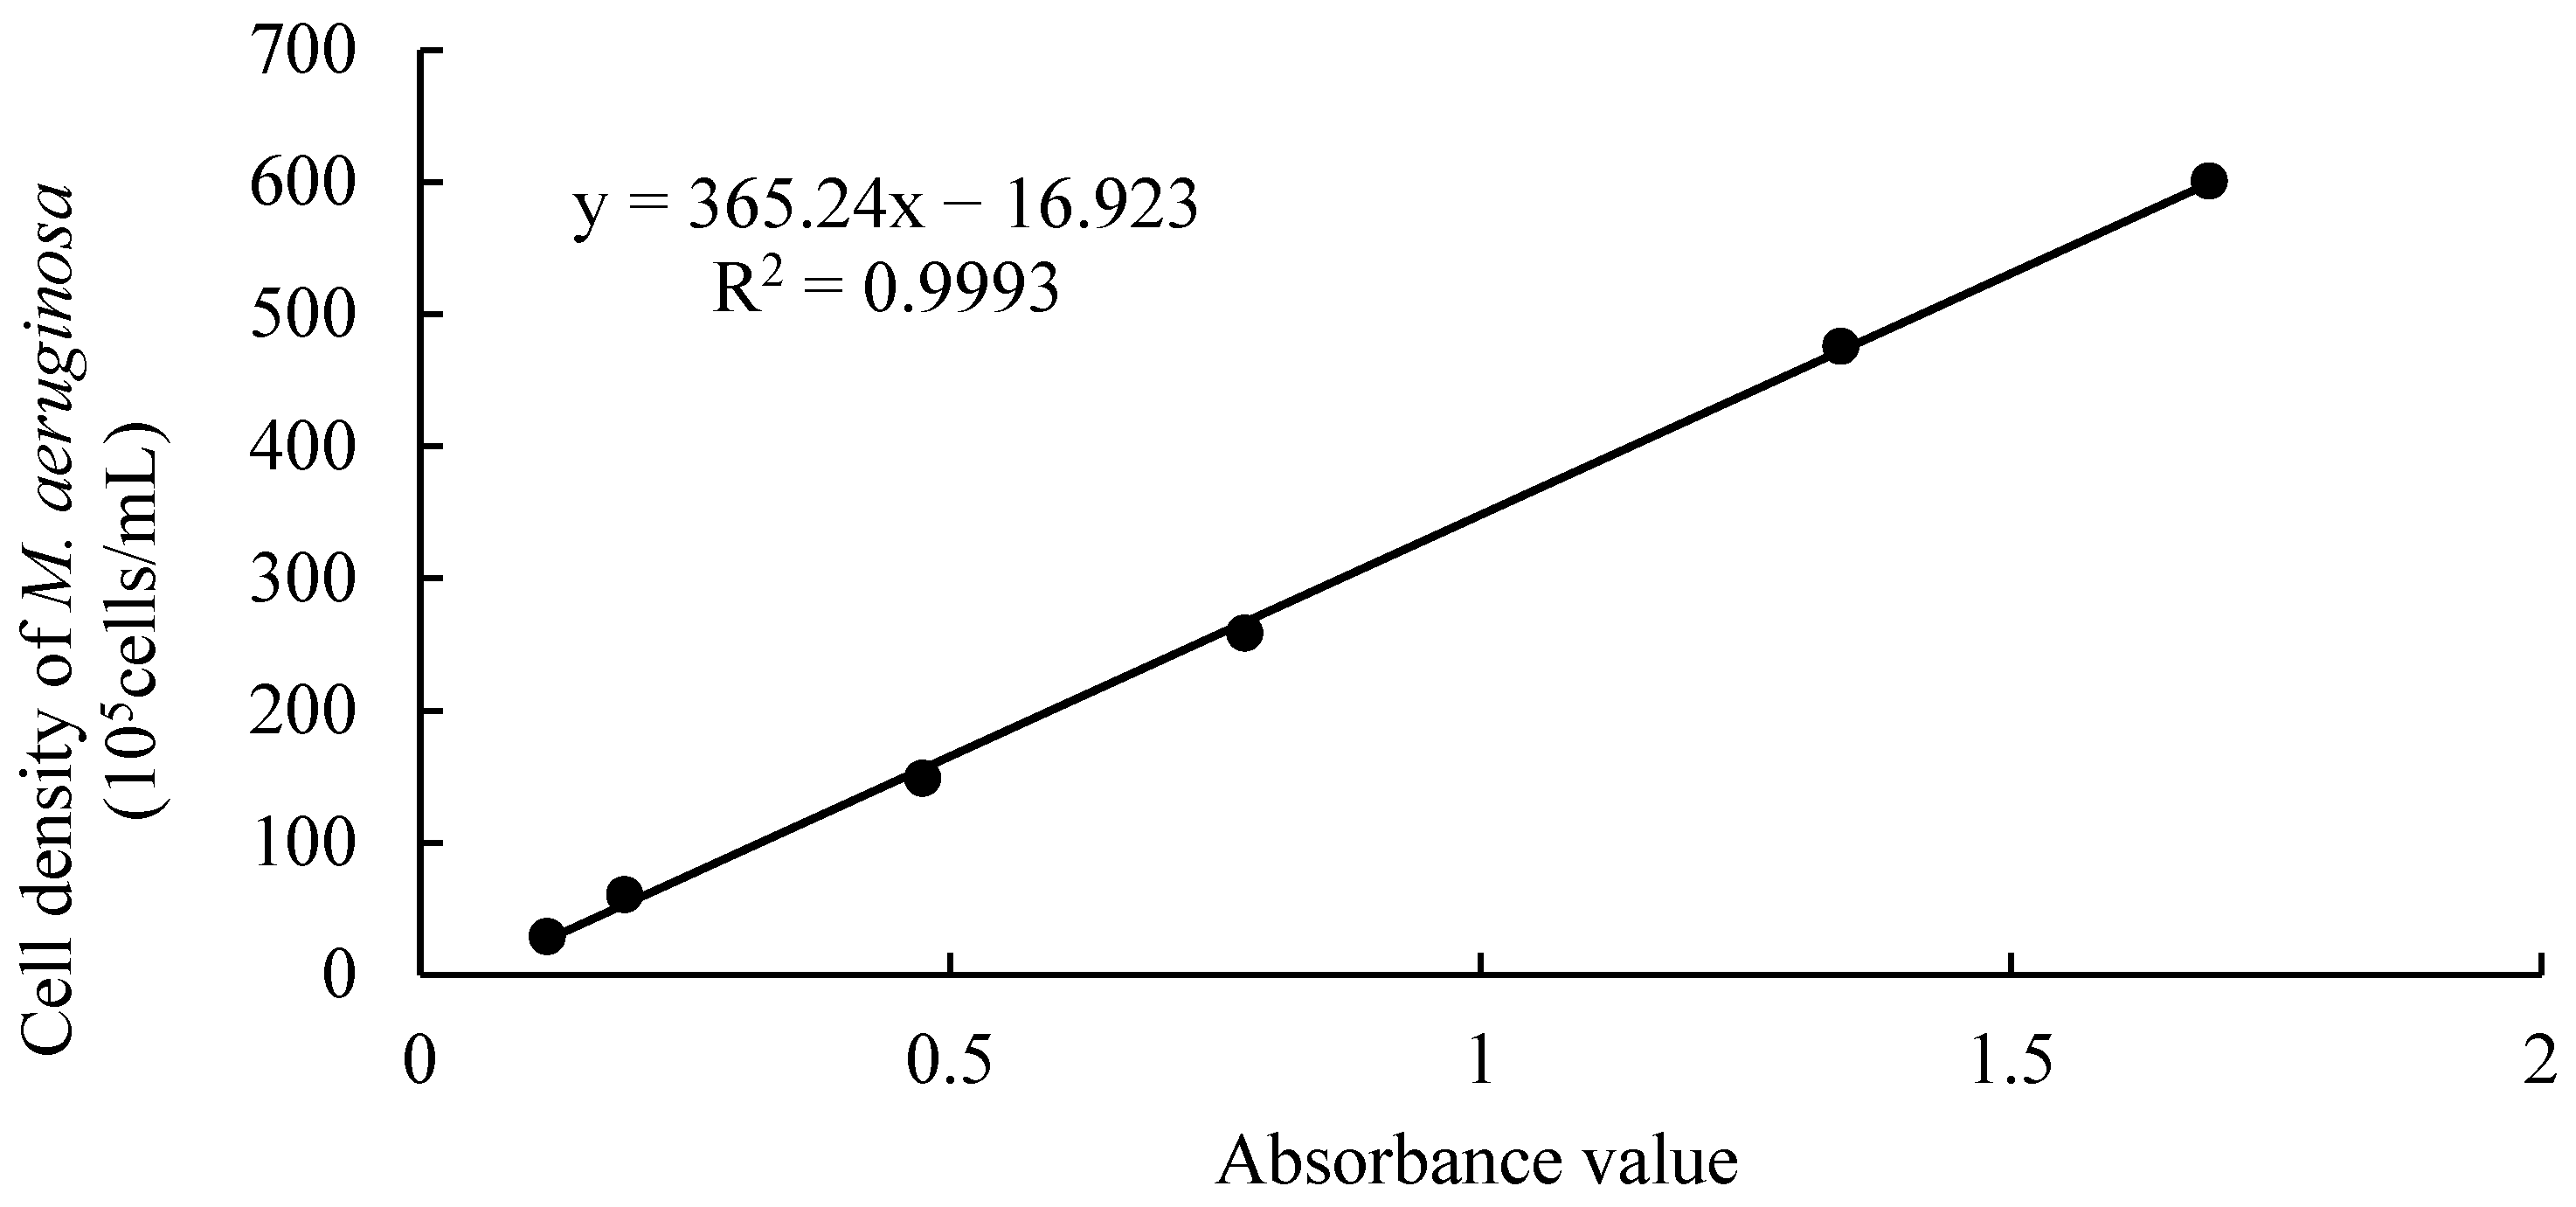
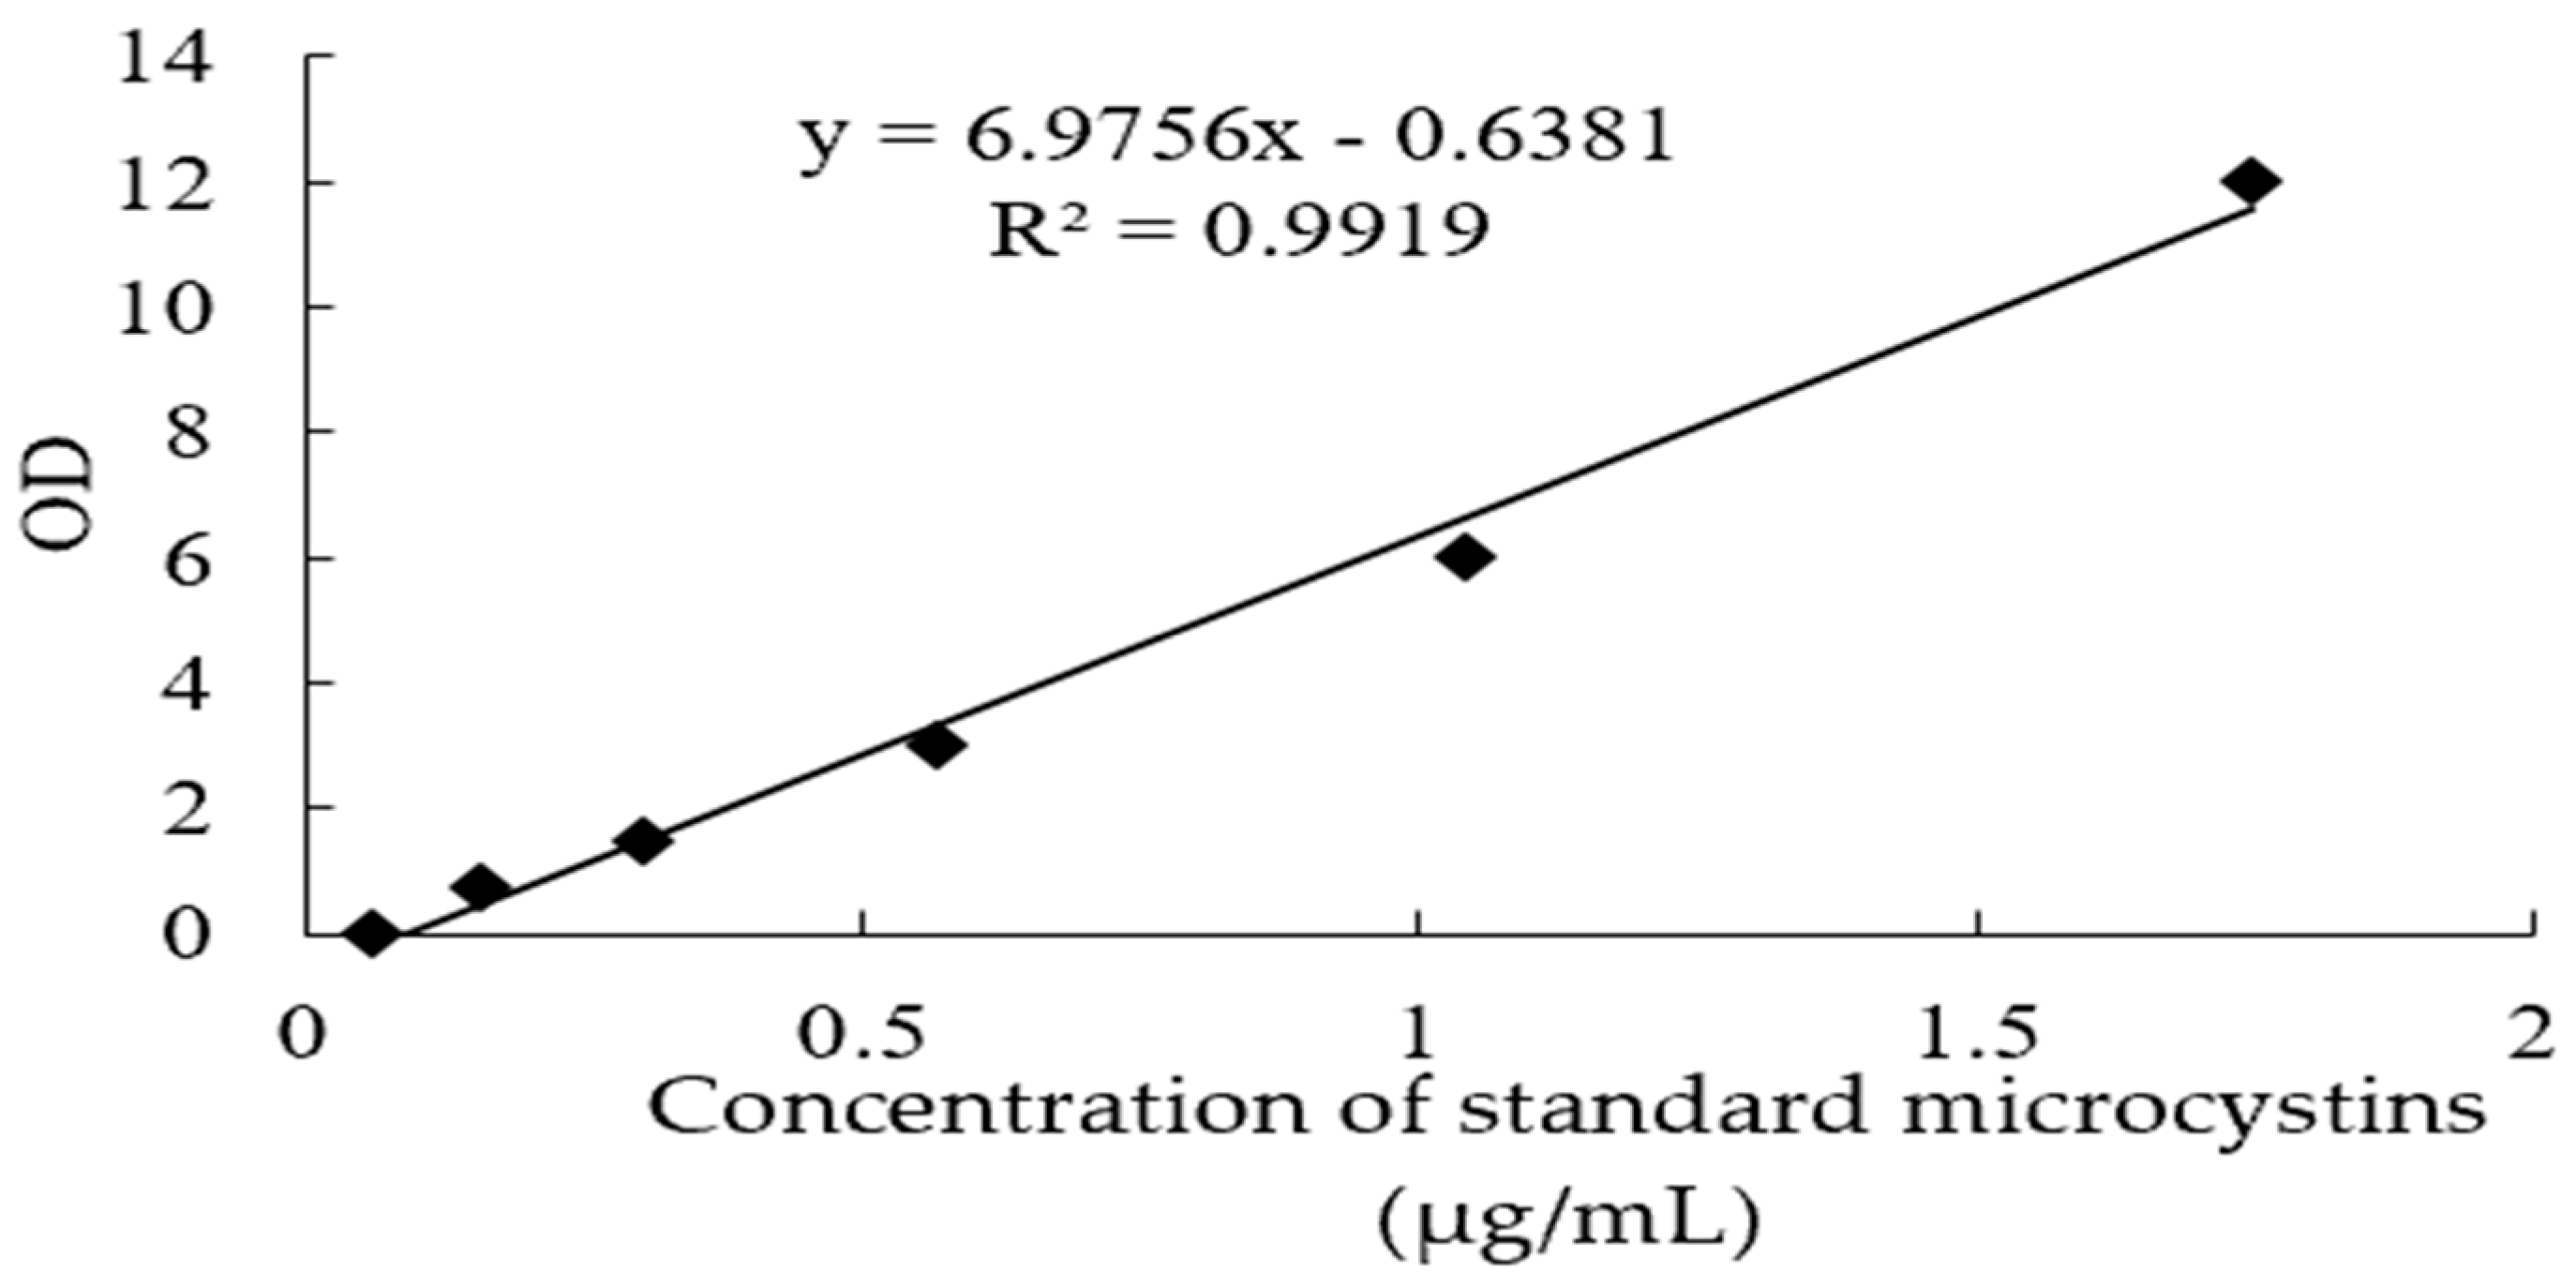
2.2.3. Establishment of Standard Curve

The absorption peak, that is, the optical density (OD) value, is related to the composition and content of microalgae pigments. Judging from the absorption peaks of different algae, they are consistent. The absorption peaks between 670 and 680 nm are generally the absorption peaks of pigments in algae cells [26]. Based on the conditions and accuracy of the experiment, the algal cell density was calculated by establishing a standard curve between the absorbance value at 680 nm wavelength and the algal cell density [27]. The specific method is as follows:
(1) 1, 3, 5, 10, 15, and 20 mL of algae liquid were measured into six beakers with a graduated cylinder, adding deionized water to make the volume 25 mL, and algae liquids with different densities were obtained. Take a small amount of algae liquid and use a 0.1 mL phytoplankton counting box to accurately count the algal cells of the sample under a microscope. Each group of samples was counted three times, and the average value was taken.
(2) Samples of different concentrations were taken for testing. Using a V-500 UV spectrophotometer was produced by the Hunan Aikerui Biological Engineering Co., Ltd. (Changsha, China) with deionized water as a reference, the absorbance values of different densities of algae liquids were measured at a wavelength of 680 nm. Each sample was measured three times, and the average value was taken.
(3) A standard curve between absorbance values and algal cell density was established in Excel based on the measured data (Figure 1).

2.2.4. Toxicity Test of EF and CF on M. aeruginosa

Before the formal test starts, a preliminary experiment is carried out to determine the mass concentration range required for the formal test. A 20 mL test tube was taken, and a certain amount of serial mass concentration injections of CF hydrochloride and EF, then 15 mL of algae liquid were added, respectively, so that the EC50 value at 96 h was included in it [28].
Four concentration values were selected within the concentration range determined in the pre-experiment as the exposure dose for the formal experiment. At the same time, a blank control group was set, and the mass concentration gradients of the two antibiotics to the four algae were set, as shown in Table 1.
The growth phase of the algae liquid was calculated as a logarithm, and the two antibiotics were mixed at the concentrations set in Table 1. Three groups of parallel groups were set up for each concentration, and the initial absorbance was measured. Afterwards, microalgae were routinely cultured. At 24 h, 48 h, 72 h, 96 h, 168 h, 240 h, 336 h, measure its absorbance. This was substituted into the standard curve to calculate the algae density and growth inhibition rate.

2.2.5. Effects of EF and CF on the Toxicity Production of M. aeruginosa

(1) Test treatment
Three treatment groups with EF and CF concentrations of 0.1%, 0.5%, and 2.5% of the 96 h EC50 value of M. aeruginosa were set, that is one times safe concentration (1 × SC), five times safe concentration (5 × SC), and 25 times safe concentration (25 × SC). At the same time, set up a control group (CK) (Table 2).
Further, explore the effects of exposure to low concentrations of EF and CF on the toxicity of M. aeruginosa. Prepare M. aeruginosa liquid containing EF or CF at the above concentration, and measure the content of M. aeruginosa on the 4th day, 8th day, and 14th day.
(2) Determination of algae toxin content
The algae toxin content was determined with an instructions of MCs ElISA kit (Shanghai Keshun Biotechnology Co., Ltd., Shanghai, China) (https://ml.mbd.baidu.com/r/17wDuAsAPgQ?f=cp&u=cb76288e42ef58ca, accessed on 9 October 2023) [29]. The steps were as follows:
1. Adding standards: Set up standard wells and sample wells, and add 50 μL of standards of different concentrations to each standard well.
2. Add samples: Set up blank wells (no samples and enzyme label reagents are added to the blank control wells, and the remaining steps are the same) and sample wells to be tested. First, add 40 μL of sample diluent to the well of the sample to be tested on the enzyme-labeled coated plate, and then add 10 μL of the sample to be tested (the final dilution of the sample is five times). Add the sample to the bottom of the well of the enzyme plate, try not to touch the wall of the well, and shake gently to mix.
3. Add enzyme: Add 100 μL of enzyme label reagent to each well, except blank wells.
4. Incubation: Seal the plate with sealing film and incubate at 37 °C for 60 min.
5. Solution preparation: Dilute the 20-fold concentrated washing solution with distilled water 20-fold and set aside.
6. Washing: Carefully remove the sealing film, discard the liquid, spin dry, fill each well with washing liquid, let it stand for 30 s and discard, repeat this five times, and pat dry.
7. Color development: First, add 50 μL of chromogen A to each well, then add 50 μL of chromogen B, shake gently to mix, and develop color for 15 min at 37 °C in the dark.
8. Termination: Add 50 μL of stop solution to each well to terminate the reaction (blue turns to yellow immediately).
9. Measurement: Zero the blank wells and measure the absorbance (OD value) of each well at 450 nm wavelength. The measurement should be performed within 15 min after adding the stop solution.
(3) Draw the standard curve:
In the Excel worksheet, the concentration of the standard substance is set as the abscissa, the corresponding OD value is the ordinate, and the linear regression curve of the standard substance is drawn (Figure 2).

2.3. Data Processing and Statistics

For passable cells, the reduction in cell number can be expressed as cell growth inhibition, while drug sensitivity is usually expressed when the cell growth inhibition rate reaches 50% compared with the control group without treatment, the drug concentration, namely EC50 (50% inhibitory concentration) [30].
(1) Growth inhibition rate
Y(%) = (NN0)/N × 100
where Y represents the inhibition rate of M. aeruginosa, N is the concentration of algae in the test group, and N0 is the density of algae in the control group.
(2) Inhibitory concentration (ECX)
The experimental data were statistically analyzed using the Boltzmann function fitting (Boltzmann constant) in the Origin 2021 software to analyze the sensitivity of green algae to different concentrations of antibiotics [31]. At the same time, the nonlinear function model was used to carry out nonlinear fitting to the growth inhibition data of algae cells at 96 h, and then the relevant parameters of each fitting model were obtained. The effect value of pollutants on the concentration gradient is obtained by fitting the nonlinear function Boltzmann, and the function formula is:
E C x = A 2 + ( A 1 A 2 ) ( 1 + e ( x x 0 ) · d x 1 )
where x represents the concentration of antibiotics, dx is the slope parameter, x0 is the center point of the curve, A1 and A2 are the upper and lower asymptotes, respectively, and the effect of each antibiotic on algae is obtained [32], quantitative analysis of the antibiotics effects on algae growth.
(3) Safe concentration (SC)
LC0 = 96 h LC50 × 0.01
(4) Algal toxin content
Find out the corresponding concentration from the standard curve according to the OD value of the sample and then multiply it by the dilution factor to get the actual concentration of algae toxin in the sample. The experimental data were processed in SPSS 22 software, expressed as mean ± S.D., and analyzed using one-way ANOVA, and the sample means were analyzed using LSD multiple comparisons; p < 0.05 is a significant difference, and p < 0.01 is an extremely significant difference.

3. Results

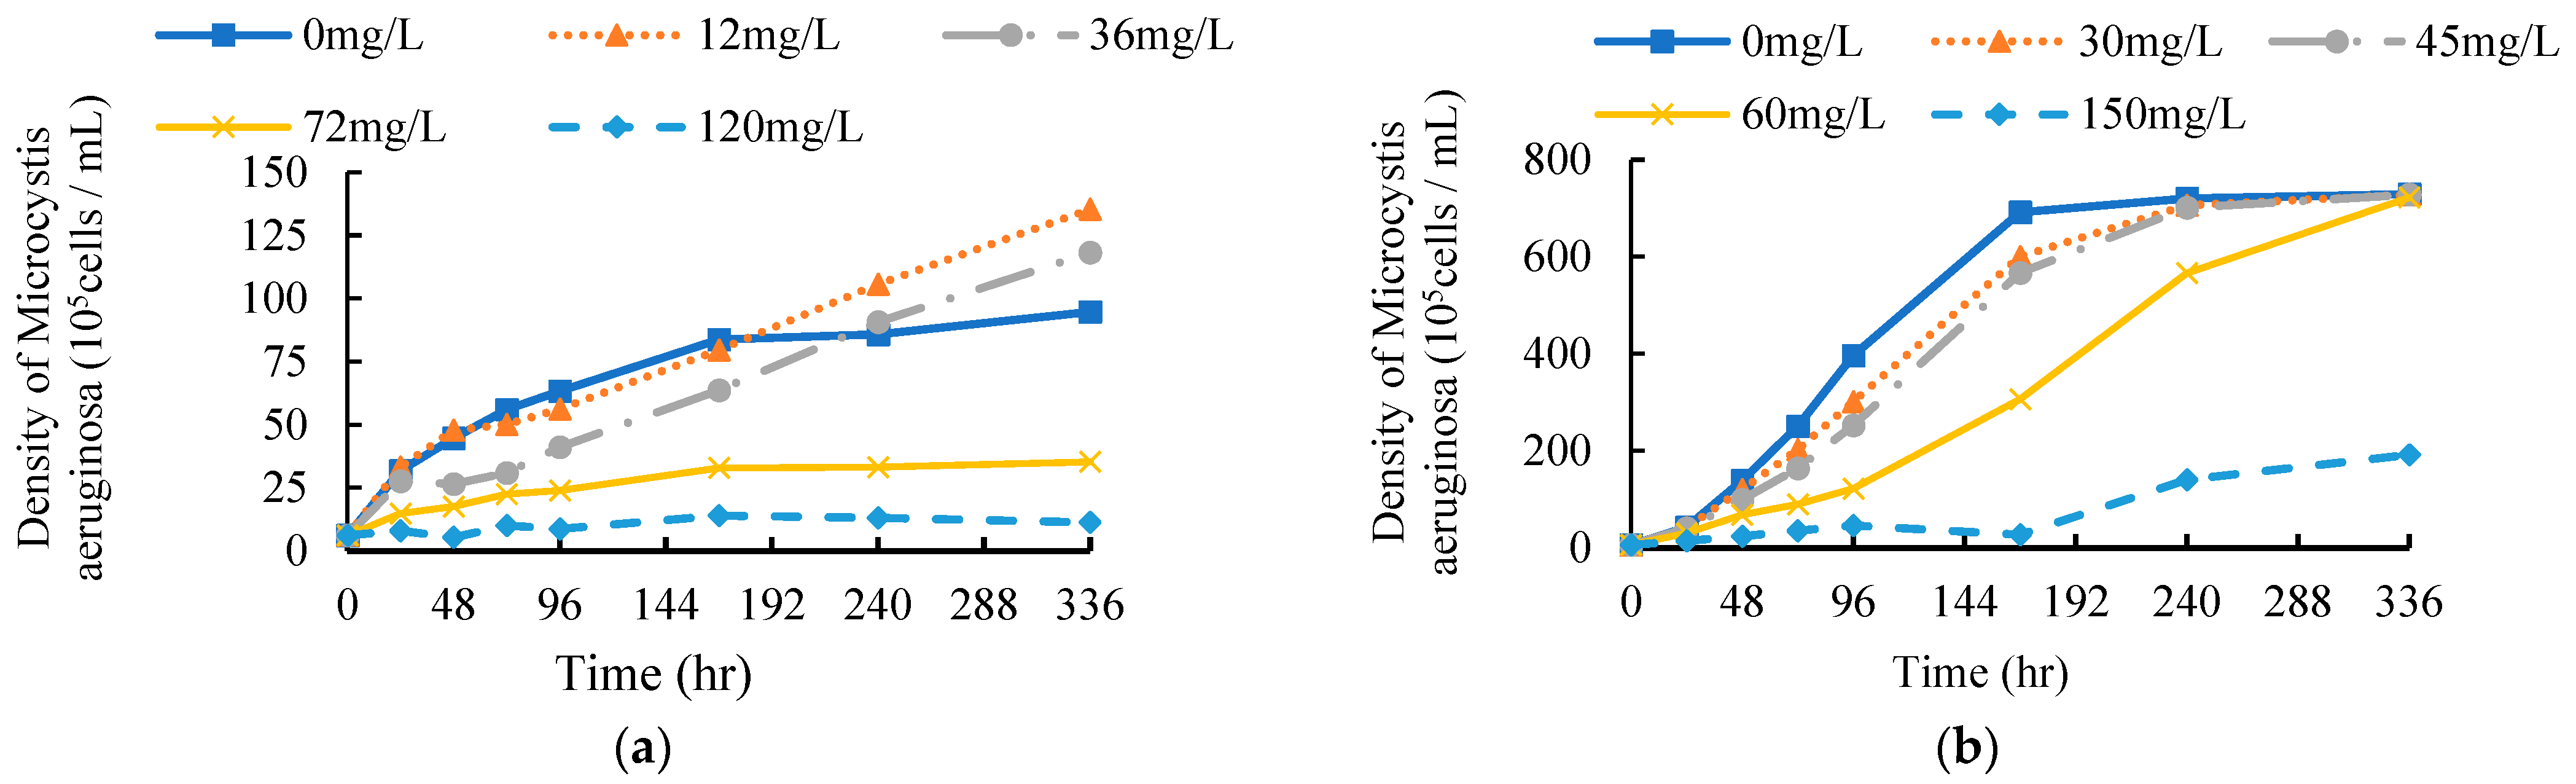
3.1. Effects of EF and CF on the Population Density of M. aeruginosa

Under the stress of EF and CF, the growth curve of M. aeruginosa within 336 h is shown in Figure 3.
Compared with the blank control group, exposure to four concentrations of EF within 168 h could inhibit the growth of M. aeruginosa (Figure 3a). When the concentration of EF exceeds 36 mg/L, the algal cell density does not increase significantly with time. The highest concentration group (120 mg/L) showed a downward trend. The population growth of M. aeruginosa was continuously inhibited within 336 h. However, when the concentration was not more than 36 mg/L, EF first inhibited and then accelerated the population growth of M. aeruginosa. After 240 h, the population density exceeded that of the blank control group, and the algae cell density reached above 107/mL. EF with different concentrations had different inhibitory effects on algae cells; that is, with the increase in EF concentration, the inhibitory effect on algae density was enhanced.
It can be seen from Figure 3b that compared with the blank control group, the algae cell density of the treatment groups was lower than that of the control group within 336 h; this shows that the CF had continued inhibition of population growth of M. aeruginosa. At 96 h and 336 h, the algal cell density in the lowest concentration (30 mg/L) group accounted for 76% and 100% of that in the control group, respectively. The algal cell density of the highest concentration (150 mg/L) group accounted for 12% and 26% of the control group, respectively. However, when the concentration was not more than 60 mg/L, the population density could return to the level of the control group at 336 h. M. aeruginosa can relieve the stress effect of ciprofloxacin over time.
In summary, the effects of EF and CF on the population growth density of M. aeruginosa showed significant concentration-effect and time-effect relationships. The higher the antibiotic concentration, the stronger the inhibitory effect on population growth of M. aeruginosa. However, when the concentration of EF was below 36 mg/L, with the increase in time, the inhibitory stress effect of antibiotics on M. aeruginosa gradually weakened, and even after 168 h (7d), lower concentration of enrofloxacin can promote population growth of M. aeruginosa (Figure 3a).

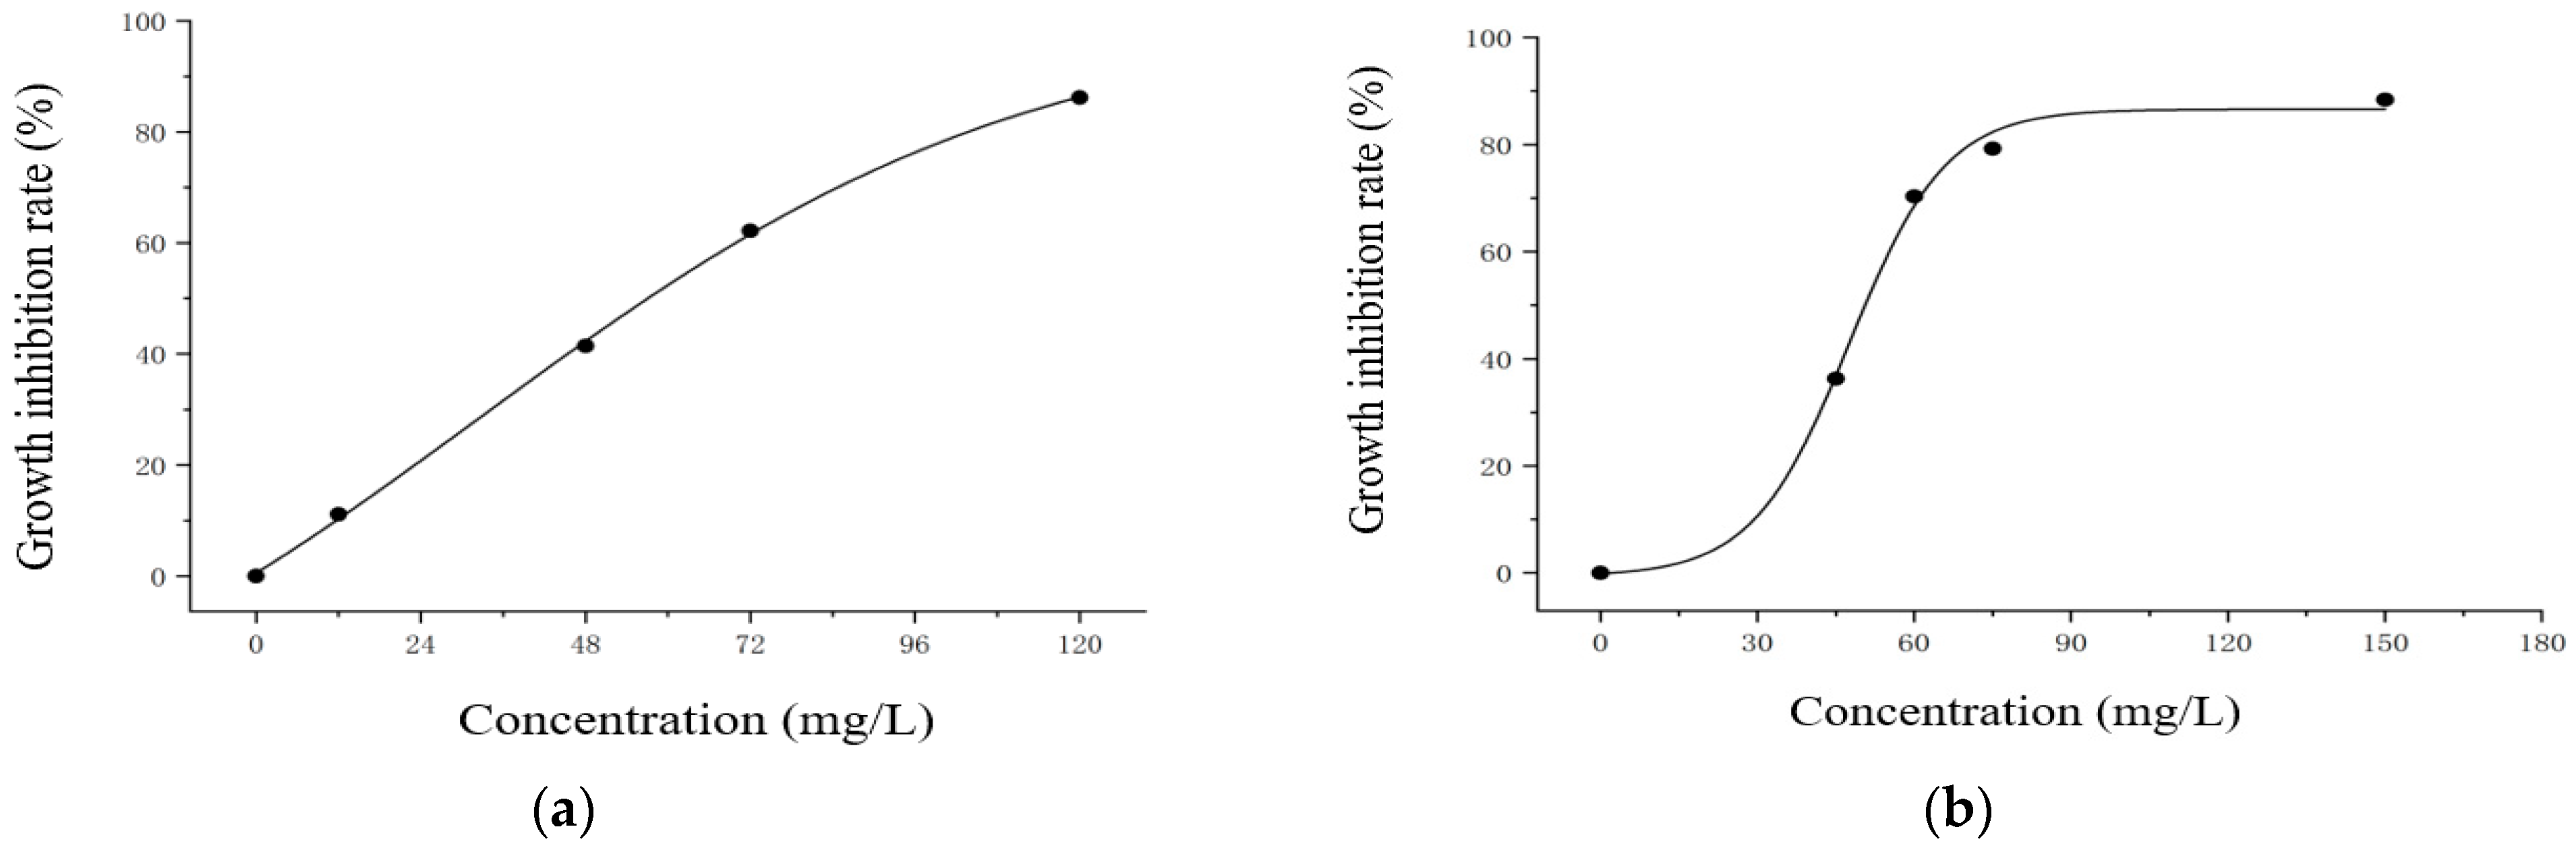
3.2. EC50 Values of EF and CF on M. aeruginosa

The 96 h inhibition rate curves of EF and CF against M. aeruginosa are shown in Figure 4. The curve equation and determination coefficient are shown in Table 3. R2 is greater than 0.9, indicating that the curve fit is good.
As the EF and CF concentrations increase, the slope of the curve gradually decreases (Figure 4). Infinitely approaching 0, which means that the inhibitory effect of the two antibiotics on M. aeruginosa will not increase infinitely with the concentration but infinitely approach a certain critical value. When this value was reached, no matter how the concentration of antibiotics increased, its inhibitory effect on M. aeruginosa would no longer increase. The growth of M. aeruginosa was almost completely inhibited when the concentration of EF was 120 mg/L. The inhibition rates were all over 85%. When the concentration of CF was 150 mg/L, the growth of M. aeruginosa was almost completely inhibited.
The 96 h EC50 values of EF and CF against M. aeruginosa were 56.10 mg/L and 49.80 mg/L, respectively, and the safe concentrations (SC) were 0.56 mg/L and 0.5 mg/L, respectively (Table 4). So, CF is slightly more toxic than EF to the population growth of M. aeruginosa.
According to “Washington State Chemical Toxicity Grading Standards (Aquatic Organisms)” [33], EF and CF belong to grade C for M. aeruginosa, that is, medium-low toxic substances.

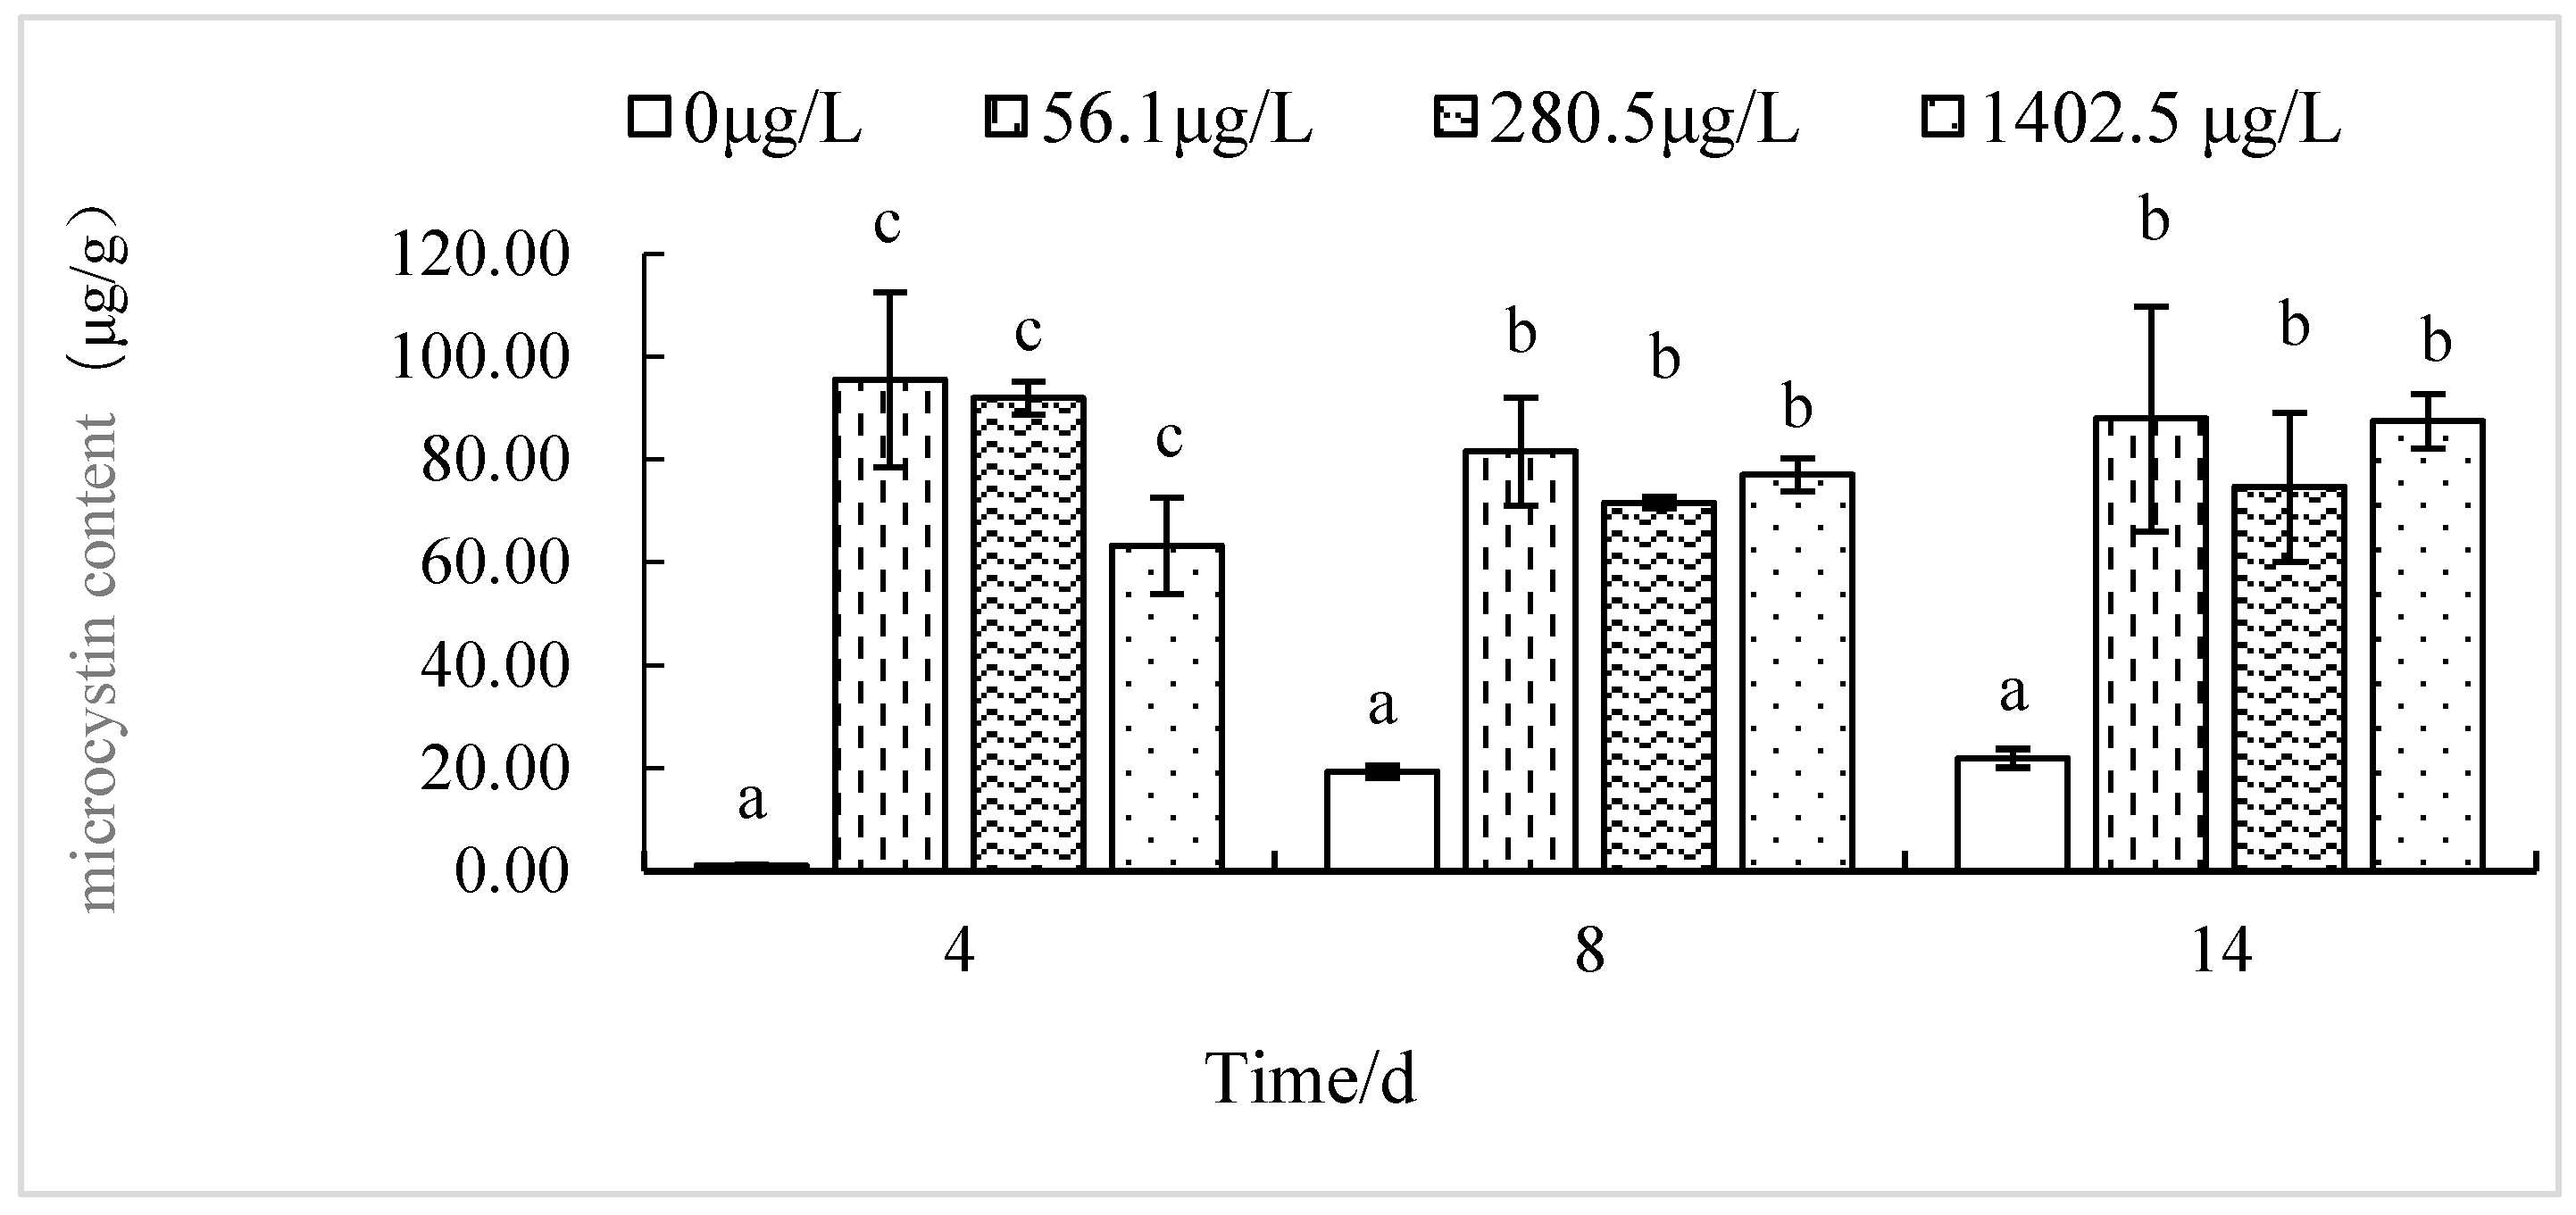
3.3. Effects of EF and CF on the Toxin Production of M. aeruginosa

(1) Effects of EF on the toxin production of M. aeruginosa
The change of algal toxin content in M. aeruginosa exposed to different concentrations of EF is shown in Figure 5.
Figure 5 shows that the MCs content of the blank control (CK) group from 1.159 μg/g (4th day) reached the maximum value of 22.766 μg/g (14th day). It shows a gradual increase with the test time. The MCs content of 56.1 μg/L EF group increased from 95.539 μg/g on the 4th day, then dropped to 83.972 μg/g on the 8th day, and rose to 86.265 μg/g on the 14th day; The MCs content of 280.5 μg/L EF group from 91. 950 μg/g on the 4th day, then drop 76.324 μg/g on the 8th day, and drop 75.026 μg/g on the 14th day; The MCs content of 1402.5 μg/L EF group from 60. 024 μg/g on the 4th day, then rise to 78.486 μg/g on the 8th day and rise up to 87.418 μg/g on the 14th day.
Figure 5 shows that on the 4th day, the MCs content of the CK group was only 1.159 μg/g, but the MCs value of 56.1 μg/L EF group, 280.5 μg/L EF group, and 1402.5 μg/L EF group were 95.539 μg/g, 91.950 μg/g and 60.024 μg/g, respectively; these three treatment groups were 82.432, 79.336 and 51.789 times of CK group on the 4th day, respectively. So, the MCs content of these three treatment groups was extremely significantly higher than that of CK group on the 4th day (p < 0.01).
On the 8th day, the MCs content of the CK group was 19.35 μg/g, but the MCs value of 56.1 μg/L EF group, 280.5 μg/L EF group, and 1402.5 μg/L EF group were 83. 972 μg/g, 76.324 μg/g and 78. 486 μg/g, respectively; these three treatment groups were 4.34, 3.94 and 4.06 times of CK group on the 8th day, respectively. So, the MCs content of these three treatment groups was extremely significantly higher than that of CK group on the 8th day (p < 0.01).
On the 14th day, the MCs content of the CK group was 22.766 μg/g, but the MCs value of 56.1 μg/L EF group, 280.5 μg/L EF group, and 1402.5 μg/L EF group were 86. 265 μg/g, 75.062 μg/g and 87. 418 μg/g, respectively; these three treatment groups were 3.789, 3.296 and 3.840 times of CK group on the 14th day, respectively. So, the MCs content of these three treatment groups was extremely significantly higher than that of CK group on the 14th day (p < 0.01).
During the test period, the MCs content of M. aeruginosa in each EF treatment group was significantly (p < 0.05) higher than that of the blank group; the MCs value of the three EF treatment groups was more than above 51.8 times that of CK group on the 4th day; from 8th day to 14th day, the MCs value of these three enrofloxacin treatment groups was more than above 3.2 times that of CK group.
(2) Effects of CF on the toxin production of M. aeruginosa
The change of algal toxin content in M. aeruginosa exposed to different concentrations of CF is shown in Figure 6.
Figure 6 shows that the MC content of the CK group from 1.159 μg/g (4th day) reached the maximum value of 22.766 μg/g (14th day), which shows a gradual increase with the test time. The MC content of the 49.8 μg/L CF group increased from 75.538 μg/g on the 4th day, then rose to 93.720 μg/g on the 8th day, and dropped to 83.562 μg/g on the 14th day. The MCs content of 249.0 μg/L CF group from 82. 911 μg/g on the 4th day, then drop 80.230 μg/g on the 8th day and drop 78.932 μg/g on the 14th day. The MC content of the 1245.0 μg/L CF group increased from 75.310 μg/g on the 4th day, then 72.368 μg/g on the 8th day, and dropped to 61.532 μg/g on the 14th day.
On the 4th day, the MCs content of CK group was only 1.159 μg/g, but the MCs value of 49.8 μg/L CF group, 249.0 μg/L CF group and 1245.0 μg/L CF group were 75.538 μg/g, 82.911 μg/g and 75.310 μg/g, respectively; the three CF treatment groups were 65.175, 71.537 and 64.978 times of CK group on the 4th day, respectively. So, the MCs content of these three treatment groups was extremely significantly higher than that of CK group on the 4th day (p < 0.01).
On the 8th day, the MCs content of the CK group was 19.35 μg/g, but the MCs value of 49.8 μg/L CF group, 249.0 μg/L CF group, and 1245.0 μg/L CF group were 93. 720 μg/g, 80.230 μg/g and 72. 368 μg/g, respectively; these three treatment groups were 4.843, 4.164 and 3.740 times of CK group on the 8th day, respectively. So, the MCs content of these three treatment groups was extremely significantly higher than that of CK group on the 8th day (p < 0.01).
On the 14th day, the MCs content of the CK group was 22.766 μg/g, but the MCs value of 49.8 μg/L CF group, 249.0 μg/L CF group, and 1245.0 μg/L CF group were 83. 562 μg/g, 78.932 μg/g and 61. 532 μg/g, respectively; these three treatment groups were 3.67, 3.47 and 2.70 times of CK group on the 14th day, respectively. So, the MCs content of these three treatment groups was extremely significantly higher than that of CK group on the 14th day (p < 0.01).
During the test period, the MCs content of M. aeruginosa in each CF treatment group was significantly (p < 0.05) higher than that of the blank group; the MCs value of these three CF treatment groups was more than above 64.98 times on the 4th day, that of CK group on the 4th day; From 8th day to 14th day, the MCs value of these three CF treatment groups was more than above 2.7 times that of CK group.
In summary, both exposure to low concentrations of EF and CF will significantly (p < 0.05) improve the toxin-producing ability of M. aeruginosa and increase the content of algal toxins. This indicated that EF and CF had very long-lasting enhancement effects on the toxin-producing ability of M. aeruginosa.

4. Discussion

4.1. Toxic Effects of Antibiotics on M. aeruginosa

Studies have found that antibiotics can interfere with the protein synthesis of algal cells, damage the two photosystem components, or block the electron transfer process between the two components, thereby reducing the photosynthetic efficiency of algal cells. For example, erythromycin can inhibit the synthesis of thylakoid membrane proteins in algal cells, and this change can directly reduce the photosynthetic efficiency of Selenastrum capricornutum [34]. Antibiotics can also inhibit photosynthesis in algal cells by interfering with the synthesis of proteins and chlorophyll a. This affects the synthesis of chlorophyll a in algal cells and produces a “low-stimulation and high-suppression” effect on the photosynthesis of algal cells. Antibiotics also increase reactive oxygen species (ROS) in algal cells and disrupt their antioxidant-reduction systems. Changes in the physiological and morphological characteristics of algae cells will inevitably change the state of population growth, but the specific effect depends on the concentration of antibiotics, which may produce a “low promotion and high suppression” effect [35]. Taking Scenedesmus tetraceras as an example, the antibiotic norfloxacin can reduce the volume of cell clusters and increase the specific surface area. Therefore, the ability and growth rate of algal cells to absorb nutrients in the environment may increase with the increase in norfloxacin [36].
Some studies have shown that the effect of ofloxacin on Tetrastrella obliquus increases with the exposure concentration increase, and its growth inhibitory effect also increases continuously, and the decomposition of algae cells increases gradually with the concentration increase in the test substance [37]. Su et al. [38] found that after EF exposure for 96 h, with the increase in EF concentration, the content of soluble protein in Chlorella gradually decreased. This shows that the cell viability decreases with the increase in drug concentration. However, there is a negative correlation between SOD, MDA, and drug concentration, indicating that with the increase in drug concentration, the active oxygen in organisms increases, the degree of damage is aggravated, and the degree of damage to the membrane system is also deepened [38]. The results of this experiment are consistent with the above reports, indicating that the effect of antibiotics on algae is significantly related to the concentration.
Wan [39] showed that the three antibiotics of levofloxacin, ofloxacin, and erythromycin all showed the phenomenon of “low promotion and high suppression” on the growth of two types of microalgae. Lei also showed that low-concentration groups of three quinolone antibiotics (pimidic acid, CF, and norfloxacin) could all promote the growth of Chlorella pyrenoidosa. Under the action of low concentrations of antibiotics, the antioxidant system of Chlorella did not change significantly. Under the action of high concentrations of antibiotics, the activity of antioxidant enzymes in green algae was induced, the content of malondialdehyde was significantly increased, and the growth of algae was inhibited [40]. This is consistent with the results of this experiment. In addition, it was found in the pre-test that low concentrations of EF and CF can both promote the growth of M. aeruginosa. In the formal experiment, M. aeruginosa also showed the situation of promoting first and then inhibiting at the concentration of 12 mg/L EF. This shows that EF and CF can promote the growth of algae cells at lower concentrations. As it grows over time, it may cause damage to algal cells due to its accumulation in algal cells reaching a certain amount. Yang et al. studied the effects of EF and erythromycin thiocyanate exposure on the growth and physiology of M. aeruginosa. The test results show that EF and erythromycin thiocyanate can hinder the photosynthesis of M. aeruginosa, and there is also a phenomenon of low promotion and high inhibition of the synthesis of soluble proteins [26]. The specific mechanism of action leading to this phenomenon is still unclear and needs further investigation.
In this experiment, it was also found that when the concentration of antibiotics reached a certain value, the inhibition rate no longer changed significantly with the increase in the concentration. For example, when the concentration of CF increased from 60 mg/L to 150 mg/L, the growth inhibition rate of M. aeruginosa only increased by 9%, and the curve showed an obvious “S” shape. It can be seen from this that no matter whether it is EF or CF, when the concentration reaches a certain value, as the concentration continues to increase, its growth inhibitory effect on algae does not change significantly. Lian et al. studied the toxicological effects of two quinolone antibiotics, EF and CF hydrochloride, on Platymonas subcordiformis. It was also found that at high concentrations, the higher the antibiotic concentration, the more obvious the inhibitory effect on the growth of P. subcordiformis, chlorophyll, and extracellular polymers. However, when the concentration reaches a certain height, the inhibition will reach its threshold [41].

4.2. Effect of Antibiotics on Toxin Production by M. aeruginosa

The maximum growth rate of cyanobacteria is not high, but its biomass can exceed other algae under certain conditions. Therefore, it is believed that MC produced by cyanobacteria can promote cyanobacteria to produce more offspring, gain a competitive advantage, and lead to the death of other algae species [42]. MCs are a class of hepatotoxic bioactive substances produced by cyanobacteria. MCs inhibit the activity of protein phosphatase 1 (pp1) and protein phosphatase 2A (pp2A). This makes the phosphorylation and dephosphorylation of proteins in the cells unbalanced, which in turn causes great harm to the human body, such as liver toxicity, nephrotoxicity, intestinal toxicity, and cancer-promoting effects. How to control the overgrowth of cyanobacteria and effectively remove microcystins has become a major water environment problem faced by countries all over the world [43].
At present, scholars have conducted research on its growth and toxin production characteristics under different conditions. However, due to the different types of algal species, medium, culture conditions, and detection conditions used, the results are not the same [44,45]. Environmental factors, including temperature, light, pH, trace elements, and nutrients, all have an impact on the growth and toxin production of M. aeruginosa. However, due to the complex interaction among various factors, no consistent conclusions have been drawn, and even contradictory views have emerged. For example, Watanabe [46] found that the suitable growth temperature for M. aeruginosa is higher than the optimum temperature for toxin production. However, Wu et al. [47] got the opposite conclusion. Wu et al. [48] believed that lower light is more suitable for the production of toxin by M. aeruginosa. It shows that the nitrogen-phosphorus ratio of 100:1 (atomic number ratio) is the most suitable for the growth and toxin production of M. aeruginosa. Additionally, Yi et al. [49] believed that when the concentration of nitrogen and phosphorus was 16:1, the growth rate of M. aeruginosa was the fastest. Other studies have found that the growth and toxin production of M. aeruginosa have obvious responses to temperature rise and nutrient salt increase, but the response of M. aeruginosa synthetic toxins to temperature is not consistent with growth. Future climate warming and eutrophication will significantly promote the growth of M. aeruginosa and the expansion of cyanobacterial blooms. However, the concentration of MCs does not necessarily increase all the time, which may be related to its ability to produce toxins [50]. There are few reports on the effects of antibiotic pollutants on the toxicity of M. aeruginosa. In this study, the content of M. aeruginosa in the blank group increased with time. However, exposure to low concentrations of EF and CF significantly enhanced the toxin-producing ability of M. aeruginosa nosa. Although this effect has changed over time, the content of algal toxins in the treatment group was always significantly higher than that in the blank group, indicating that its effect on improving the toxin production capacity of M. aeruginosa is relatively long-lasting. Some studies have found that the optimal toxin-producing conditions of some algae species are not equal to the optimal growth conditions, and when the water body is seriously polluted or the living conditions are harsh, algae produce and release toxins in greater quantities [51]. This is also consistent with the results of this experiment.
This experiment found that the long-term presence of antibiotics in the environment may be more likely to cause the outbreak of algae blooms and improve the toxin production capacity of M. aeruginosa. It revealed for the first time another potential ecological risk of antibiotic pollution-aggravating the hazards of cyanobacteria blooms.

5. Conclusions

Microcystin is the most common cyanobacterial toxin, mainly produced by M. aeruginosa, and often causes ecological harm. Antibiotics are also increasingly used in aquaculture for the prevention and treatment of bacterial infections. The effects of two fluoroquinolone antibiotics (enrofloxacin and ciprofloxacin) on M. aeruginosa and MC production were explored. It is worth noting that the 96 h EC50 values of enrofloxacin and ciprofloxacin to M. aeruginosa were 56.10 mg/L and 49.80 mg/L, respectively, and the toxicity of ciprofloxacin to M. aeruginosa was slightly stronger than that of enrofloxacin. With the increase in the two antibiotic concentration, the growth inhibition rate (IR) increased, but when the concentration reached a certain level, the IR would reach its threshold. Long-term exposure to low concentrations of these two antibiotics is not only more likely to lead to the outbreak of M. aeruginosa, but also increase its toxin production capacity. These findings provide important information for water management in aquaculture.

Author Contributions

Conceptualization, Q.-M.X., Y.X. and T.-J.C.; methodology, Q.-M.X. Furthermore, Y.X.; software, Q.-M.X., Y.X. and T.-J.C.; validation, Q.-M.X., Y.X. and T.-J.C.; formal analysis, Q.-M.X., T.-J.C. and Y.X.; investigation, Q.-M.X., Y.X. and T.-J.C.; resources, Q.-M.X. Furthermore, Y.X.; data curation, Q.-M.X. Furthermore, Y.X.; writing—original draft preparation, Q.-M.X., T.-J.C. and Y.X.; writing—review and editing, T.-J.C., Q.-M.X. and Y.X.; visualization, T.-J.C., Q.-M.X. and Y.X.; supervision, Q.-M.X. Furthermore, T.-J.C.; project administration, Q.-M.X.; funding acquisition, Q.-M.X. All authors have read and agreed to the published version of the manuscript.

Funding

This work was supported by the Fujian Spark Program (No. 2019S0039), Fujian Spark Program (No. 2019S0026), Provincial Natural Science Foundation of Fujian Province (No. 2013J01136), Fujian Provincial Key Science, Technology Guidance Project (No. 2021N0013), and Jimei University grant (No. C619061). The funders had no role in the study design, data collection and analysis, decision to publish, or preparation of the manuscript.

Data Availability Statement

Not applicable.

Acknowledgments

We thank Yu-Qing Guo and Yi-Jia Shih for their contributions and suggested comments on the manuscript. Useful suggestions from anonymous reviewers were incorporated into the manuscript.

Conflicts of Interest

The authors declare no conflict of interest.

References

  1. Yu, Z.G. Distribution and Purification of Pharmaceutical and Personal Care Products (PPCPs) in Drinking Water. Ph.D. Thesis, Tsinghua University, Beijing, China, 2011. [Google Scholar]
  2. Chen, D.J. Industrialization of antibiotics in China and global research and development of new drugs. In Proceedings of the 7th China Summit Forum on Industrial Biotechnology Development, Tianjin, China, 9–12 May 2013. [Google Scholar]
  3. Zhang, Q.Q.; Ying, G.G.; Pan, C.G.; Liu, Y.S.; Zhao, J.L. Comprehensive evaluation of antibiotics emission and fate in the river basins of China: Source analysis, multimedia modeling, and linkage to bacterial resistance. Environ. Sci. Technol. 2015, 49, 6772–6782. [Google Scholar] [CrossRef]
  4. Tang, Q.; Song, P.; Li, J.J.; Kong, F.L.; Sun, L.; Xu, L.Z. Control of antibiotic resistance in China must not be delayed: The current state of resistance and policy suggestions for the government, medical facilities, and patients. Biosci. Trends 2016, 10, 1–6. [Google Scholar] [CrossRef] [PubMed]
  5. Zhao, K.; Zhang, M.; Wang, K.; Zhu, K.; Xu, C.; Xie, J.; Xu, J. Aquaculture impacts on China’s marine wild fisheries over the past 30 years. Front. Mar. Sci. 2021, 8, 710124. [Google Scholar] [CrossRef]
  6. Zhang, M.; Wang, J.H.; Zhao, Y.; Wang, G.X. Antimicrobial susceptibility test of 20 traditional Chinese medicines against Vibrio anguillarum. Prog. Vet. Med. 2005, 26, 77–79. [Google Scholar]
  7. Polianciuc, S.I.; Gurzău, A.E.; Kiss, B.; Ştefan, M.G.; Loghin, F. Antibiotics in the environment: Causes and consequences. Med. Pharm. Rep. 2020, 93, 231–240. [Google Scholar] [CrossRef]
  8. Lalumera, G.M.; Calamari, D.; Galli, P.; Castiglioni, S.; Crosa, G.; Fanelliet, R. Preliminary investigation on the environmental occurrence and effects of antibiotics used in aquaculture in Italy. Chemosphere 2004, 54, 661–668. [Google Scholar] [CrossRef] [PubMed]
  9. Verlicchi, P.; Galletti, A.; Petrovic, M.; Barceló, D. Hospital effluents as a source of emerging pollutants: An overview of micropollutants and sustainable treatment options. J. Hydrol. 2010, 389, 416–428. [Google Scholar] [CrossRef]
  10. Zhang, S.Y.; Song, C.; Chen, C.C. Research progress on the application of quinolone antibiotics in aquaculture. Jiangsu Agric. Sci. 2019, 47, 32–36. [Google Scholar]
  11. He, X.; Wang, Z.; Nie, X.; Yang, Y.; Pan, D.; Leung, A.O.; Cheng, Z.; Yang, Y.; Li, K.; Chen, K. Residues of fluoroquinolones in marine aquaculture environment of the Pearl River Delta, South China. Environ. Geochem. Health 2012, 34, 323–335. [Google Scholar] [CrossRef]
  12. Zhang, Q.; Xin, Q.; Zhu, J.M. The antibiotic contaminations in the main water bodies in China and the associated environmental and human health impacts. Environ. Chem. 2014, 33, 1075–1083. [Google Scholar]
  13. Yuan, S.G.; Cui, Y.F.; Zhang, W.J. Residual levels of antibiotics in aquatic products in Beijing market. Asian J. Ecotoxicol. 2015, 10, 311–317. [Google Scholar]
  14. He, X.T.; Deng, M.C.; Wang, Q.; Yang, Y.T.; Yang, Y.F.; Nie, X.P. Residues and health risk assessment of quinolones and sulfonamides in cultured fish from Pearl River Delta, China. Aquaculture 2016, 458, 38–46. [Google Scholar] [CrossRef]
  15. Abdelfattah, A.; Ali, S.S.; Ramadan, H.; El-Aswar, E.I.; Eltawab, R.; Ho, S.H.; Elsamahy, T.; Li, S.; El-Sheekh, M.M.; Schagerl, M.; et al. Microalgae-based wastewater treatment: Mechanisms, challenges, recent advances, and future prospects. Environ. Sci. Ecotechnol. 2022, 8, 100205. [Google Scholar] [CrossRef] [PubMed]
  16. Cid, A.; Prado, R.; Rioboo, C.; Suarez-Bregua, P.; Herrero, C. Use of Microalgae as Biological Indicators of Pollution: Looking for New Relevant Cytotoxicity Endpoints. In Microalgae: Biotechnology, Microbiology and Energy; Johnsen, M.N., Ed.; Nova Science Publishers: New York, NY, USA, 2012; pp. 311–323. [Google Scholar]
  17. Ingrid, C.; Jamie, B. Toxic Cyanobacteria in Water; E&FN Spon Publisher: London, UK; New York, NY, USA, 1999; 416p. [Google Scholar]
  18. Su, Y.L.; Deng, Y.R. Microcystins in eutrophic lakes and their controlling and removing methods. Environ. Sci. Technol. 2013, 36, 62–66+84. [Google Scholar]
  19. Singh, D.P.; Tyagi, M.B.; Kumar, A.; Thakur, J.K.; Kumar, A. Antialgal activity of a hepatotoxin-producing cyanobacterium, Microcystis aeruginosa. World J. Microbiol. 2001, 17, 15–22. [Google Scholar] [CrossRef]
  20. Li, Y.; Zhang, M.; Wang, R.N. The temporal and spation variation of the cyanobacteria which caused the water bloom in the Dianchi Lake, Kunming‚ China. J. Yunnan Univ. 2005, 3, 272–276. (In Chinese) [Google Scholar]
  21. Sukenik, A.; Kaplan, A. Cyanobacterial harmful algal blooms in aquatic ecosystems: A comprehensive outlook on current and emerging mitigation and control approaches. Microorganisms 2021, 9, 1472. [Google Scholar] [CrossRef]
  22. Yang, W.W.; Hien, V.T.T.; Wu, Y.X.; Zhang, W.H. Toxicity of enrofloxacin and erythromycin thiocyanate on Microcystis aeruginosa. China Environ. Sci. 2013, 33, 1829–1834. [Google Scholar]
  23. Available online: https://microbiology.ucdavis.edu/meeks/BG11medium.html (accessed on 9 October 2023).
  24. Xu, X.Y.; Cheng, T.Y.; Chen, L.; Zhang, W.; Liu, T.Z. Effects of phosphorus on Haematococcus pluvialis cell propagation and differentiation in two mediums. Chin. J. Process Eng. 2016, 16, 840–848. (In Chinese) [Google Scholar] [CrossRef]
  25. Liu, D.; Zeng, H.H.; Deng, Y. Combined stress toxicity of binary heavy metal mixture to Scenedesmus obliquus. Sci. Technol. Eng. 2019, 19, 374–383. (In Chinese) [Google Scholar]
  26. Shen, P.P.; Wang, Z.H.; Qi, Y.Z.; Xie, L.C.; Wang, Y. An optical density method for determination of microalgal biomass. J. Jinan Univ. Nat. Sci. 2001, 22, 115–119. (In Chinese) [Google Scholar]
  27. Lv, X.Y.; Zhang, E.; Yang, Y. Methodological research on measuring chlorella quantity by spectrophotometry. J. Anhui Agri. Sci. 2009, 37, 11104–11105. (In Chinese) [Google Scholar]
  28. Gu, D.X.; Song, G.L.; Ge, L.Y.; Deng, H.H.; Zhang, M.H. Study on toxicology of two antibiotics on Isochrysis galbana. Zhejiang Agri. Sci. 2013, 02, 179–182. [Google Scholar]
  29. MCs ElISA Kit (Shanghai Keshun Biotechnology Co., Ltd., Shanghai, China). Available online: https://ml.mbd.baidu.com/r/17wDuAsAPgQ?f=cp&u=cb76288e42ef58ca/ (accessed on 9 October 2023).
  30. van Meerloo, J.; Kaspers, G.J.; Cloos, J. Cell sensitivity assays: The MTT assay. Methods Mol. Biol. 2011, 731, 237–245. [Google Scholar] [CrossRef] [PubMed]
  31. Plumb, J.A. Cell sensitivity assays: The MTT assay. Methods Mol. Med. 2004, 88, 165–169. [Google Scholar] [CrossRef] [PubMed]
  32. Carraschi, S.P.; Cruz, C.D.; Basile, A.G.; Pitelli, R.A. Effects of fungicides for non target fungi Alternaria cassiae. Int. J. Environ. Agric. Biotech. 2017, 2, 451–455. [Google Scholar] [CrossRef] [PubMed]
  33. Zhang, L.Y.; Huang, Q.F.; Wang, Q.; Li, X.J.; Duan, H.B. Hazardous waste classification and management. Environ. Pollut. Prev. 2006, 1, 34–36. (In Chinese) [Google Scholar]
  34. Kasai, K.; Kanno, T.; Endo, Y.; Endo, Y.; Wakasa, K.; Tozawa, Y. Guanosine tetra- and pentaphosphate synthase activity in chloroplasts of a higher plant: Association with 70S ribosomes and inhibition by tetracycline. Nucleic Acids Res. 2004, 32, 5732–5741. [Google Scholar] [CrossRef]
  35. Lopes, T.O.M.; Passos, L.S.; Vieira, L.V.; Pinto, E.; Dorr, F.; Scherer, R.; de Andrade Salustriano, N.; Carneiro, M.T.W.D.; Postay, L.F.; Gomes, L.C. Metals, arsenic, pesticides, and microcystins in tilapia (Oreochromis niloticus) from aquaculture parks in Brazil. Environ. Sci. Pollut. Res. Int. 2020, 27, 20187–20200. [Google Scholar] [CrossRef]
  36. Pan, Y.; Dong, J.; Wan, L.; Sun, S.; MacIsaac, H.J.; Drouillard, K.G.; Chang, X. Norfloxacin pollution alters species composition and stability of plankton communities. J. Hazard. Mater. 2020, 385, 121625. [Google Scholar] [CrossRef]
  37. Qin, H.W.; Chen, L.F.; Liu, N.; Qin, W.C.; Yuan, X. Toxic effect of ofloxacin on Scenedesmus obliquus. Environ. Chem. 2011, 30, 885–886. (In Chinese) [Google Scholar]
  38. Su, Z.X.; Xiao, H.; Li, C. Toxic effects of enrofloxacin hydrochloride on Chlorella pyrenoidosa. Chin. J. Prev. Vet. Med. 2017, 6, 96–99. (In Chinese) [Google Scholar]
  39. Wan, J.J. Study the Response of Freshwater Microalgae to Several Antibiotics Stress. Ph.D. Thesis, Huaqiao University, Xiamen, China, 2014. [Google Scholar]
  40. Shi, L. The Hormesis Effect of Three Quinolone Antibiotics in Chlorella pyrenoidosa. Ph.D. Thesis, Harbin University of Commerce, Harbin, China, 2018. [Google Scholar]
  41. Lian, P.; Ge, L.Y.; Deng, H.H.; Zhao, C.R.; Xu, X.X. Toxic effects of two quinolone antibiotics on Platymonas subcordiformis. Environ. Sci. Manag. 2014, 39, 46–48. [Google Scholar]
  42. Hu, Z.Q.; Liu, Y.D.; Xiao, B. Effects of microcystin on the growth and photosynthetic activity of algae in freshwater. Ecol. Environ. 2008, 3, 885–890. [Google Scholar]
  43. Zhang, H. Effects of the Ratio of Nitrogen and Phosphorus Concentration on Growth and Microcystin of Microcystis aeruginosa. Ph.D. Thesis, Hefei University of Technology, Hefei, China, 2020. [Google Scholar]
  44. Oh, H.M.; Lee, S.J.; Jang, M.H.; Yoon, B.D. Microcystin production by Microcystis aeruginosa in a phosphorus-limited chemostat. Appl. Environ. Microbiol. 2000, 66, 176–179. [Google Scholar] [CrossRef]
  45. Wiedner, C.; Visser, P.M.; Fastner, J.; Metcalf, J.S.; Codd, G.A.; Mur, L.R. Effects of light on the microcystin content of Microcystis strain PCC 7806. Appl. Environ. Microbiol. 2003, 69, 1475–1481. [Google Scholar] [CrossRef]
  46. Watanabe, M.F.; Oishi, S. Effects of environmental factors on toxicity of a cyanobacterium (Microcystis aeruginosa) under culture conditions. Appl. Environ. Microbiol. 1985, 49, 1342–1344. [Google Scholar] [CrossRef]
  47. Wu, R.; Cui, L.F.; Lu, S.; Shi, Y. Effects of temperature and light on the growth of Microcystis aeruginosa and the release of algal toxins. Environ. Sci. Technol. 2010, 6, 33–36+51. [Google Scholar]
  48. Wu, H.Y.; Su, J.; Shi, W. Study on the growth and toxicity Microcystis aeruginosa strain under different condition. J. Environ. Health 2006, 23, 304–307. [Google Scholar]
  49. Yi, W.L.; Wang, G.D.; Liu, X.W.; Ma, Z.Y. Effects of N/P ratios on the growth and some biochemical constituents of Microcystis aeruginosa. J. Northwest Sci-Tech Univ. Agric. For. Nat. Sci. Ed. 2005, 6, 151–154. [Google Scholar]
  50. Xu, D.M. Study on Distribution Characteristics and Influence Mechanism of Microcystins in Chaohu Lake. Ph.D. Thesis, Anhui Jianzhu University, Hefei, China, 2022. [Google Scholar]
  51. Long, B.M.; Jones, G.J.; Orr, P.T. Cellular microcystin content in N-Limited Microcystis aeruginosa can be predicted from growth rate. Appl. Environ. Microbiol. 2001, 67, 278–283. [Google Scholar] [CrossRef] [PubMed]
Figure 1. Standard curve of cell density and absorbance of M. aeruginosa.
Water 15 03580 g001
Figure 2. Standard curve of MCs.
Water 15 03580 g002
Figure 3. Effects of different concentrations exposure on the population density of M. aeruginosa: (a) EF; (b) CF.
Water 15 03580 g003
Figure 4. Dose response curve of EF and CF to M. aeruginosa: (a) EF; (b) CF.
Water 15 03580 g004
Figure 5. Changes of MC content in different concentrations of EF exposure. Note: Those marked with different lowercase letters represent significant differences between groups (p < 0.05), and those marked with the same letters represent significant differences between groups. No significant difference (p > 0.05).
Water 15 03580 g005
Figure 6. Changes of MC content in different concentrations of CF exposure. Note: Those marked with different lowercase letters represent significant differences between groups (p < 0.05), and those marked with the same letters represent significant differences between groups. No significant difference (p > 0.05).
Water 15 03580 g006
Table 1. Concentration setting of EF and CF (mg/L).
Types of AntibioticsConcentration (mg/L)
Enrofloxacin (EF)0123672120
Ciprofloxacin (CF)0304560150
Table 2. Test of produce toxin of M. aeruginosa concentration setting of EF and CF (mg/L).
Types of AntibioticsCKConcentration (μg/L)
Enrofloxacin0.056.1 (1 × SC)280.5 (5 × SC)1402.5 (25 × SC)
Ciprofloxacin0.049.8 (1 × SC)249.0 (5 × SC)1245.0 (25 × SC)
Table 3. Effect dose curve equation and determination coefficient of EF and CF on M. aeruginosa.
Types of AntibioticsRegression EquationR2
Enrofloxaciny = 110.35 + (−104.96 − 110.35)/(1 + exp((x − 2.88)/56.47))0.9983
Ciprofloxaciny = 110.35 + (−104.96 − 110.35)/(1 + exp((x − 2.88)/56.47))0.9984
Table 4. Washington State Chemical Toxicity Classification Standard.
Grade ToxicAquatic Organisms 96 h LC50 (mg/L)Rat Oral 96 h LC50 (mg/L)
Grade X (very high toxic)<0.1<0.5
Grade A (high toxic)0.1–1.00.5–5.0
Grade B (medium toxic)1.0–10.05.0–50.0
Grade C (medium-low toxic)10.0–100.050.0–500.0
Grade D (low toxic)>100.0>500.0
Disclaimer/Publisher’s Note: The statements, opinions and data contained in all publications are solely those of the individual author(s) and contributor(s) and not of MDPI and/or the editor(s). MDPI and/or the editor(s) disclaim responsibility for any injury to people or property resulting from any ideas, methods, instructions or products referred to in the content.

