


Investigating Seawater Intrusion in Republic of South Africa’s Heuningnes, Cape Agulhas Using Hydrogeochemistry and Seawater Fraction Techniques

 ,
,  , ,
, ,
Abstract
1. Introduction
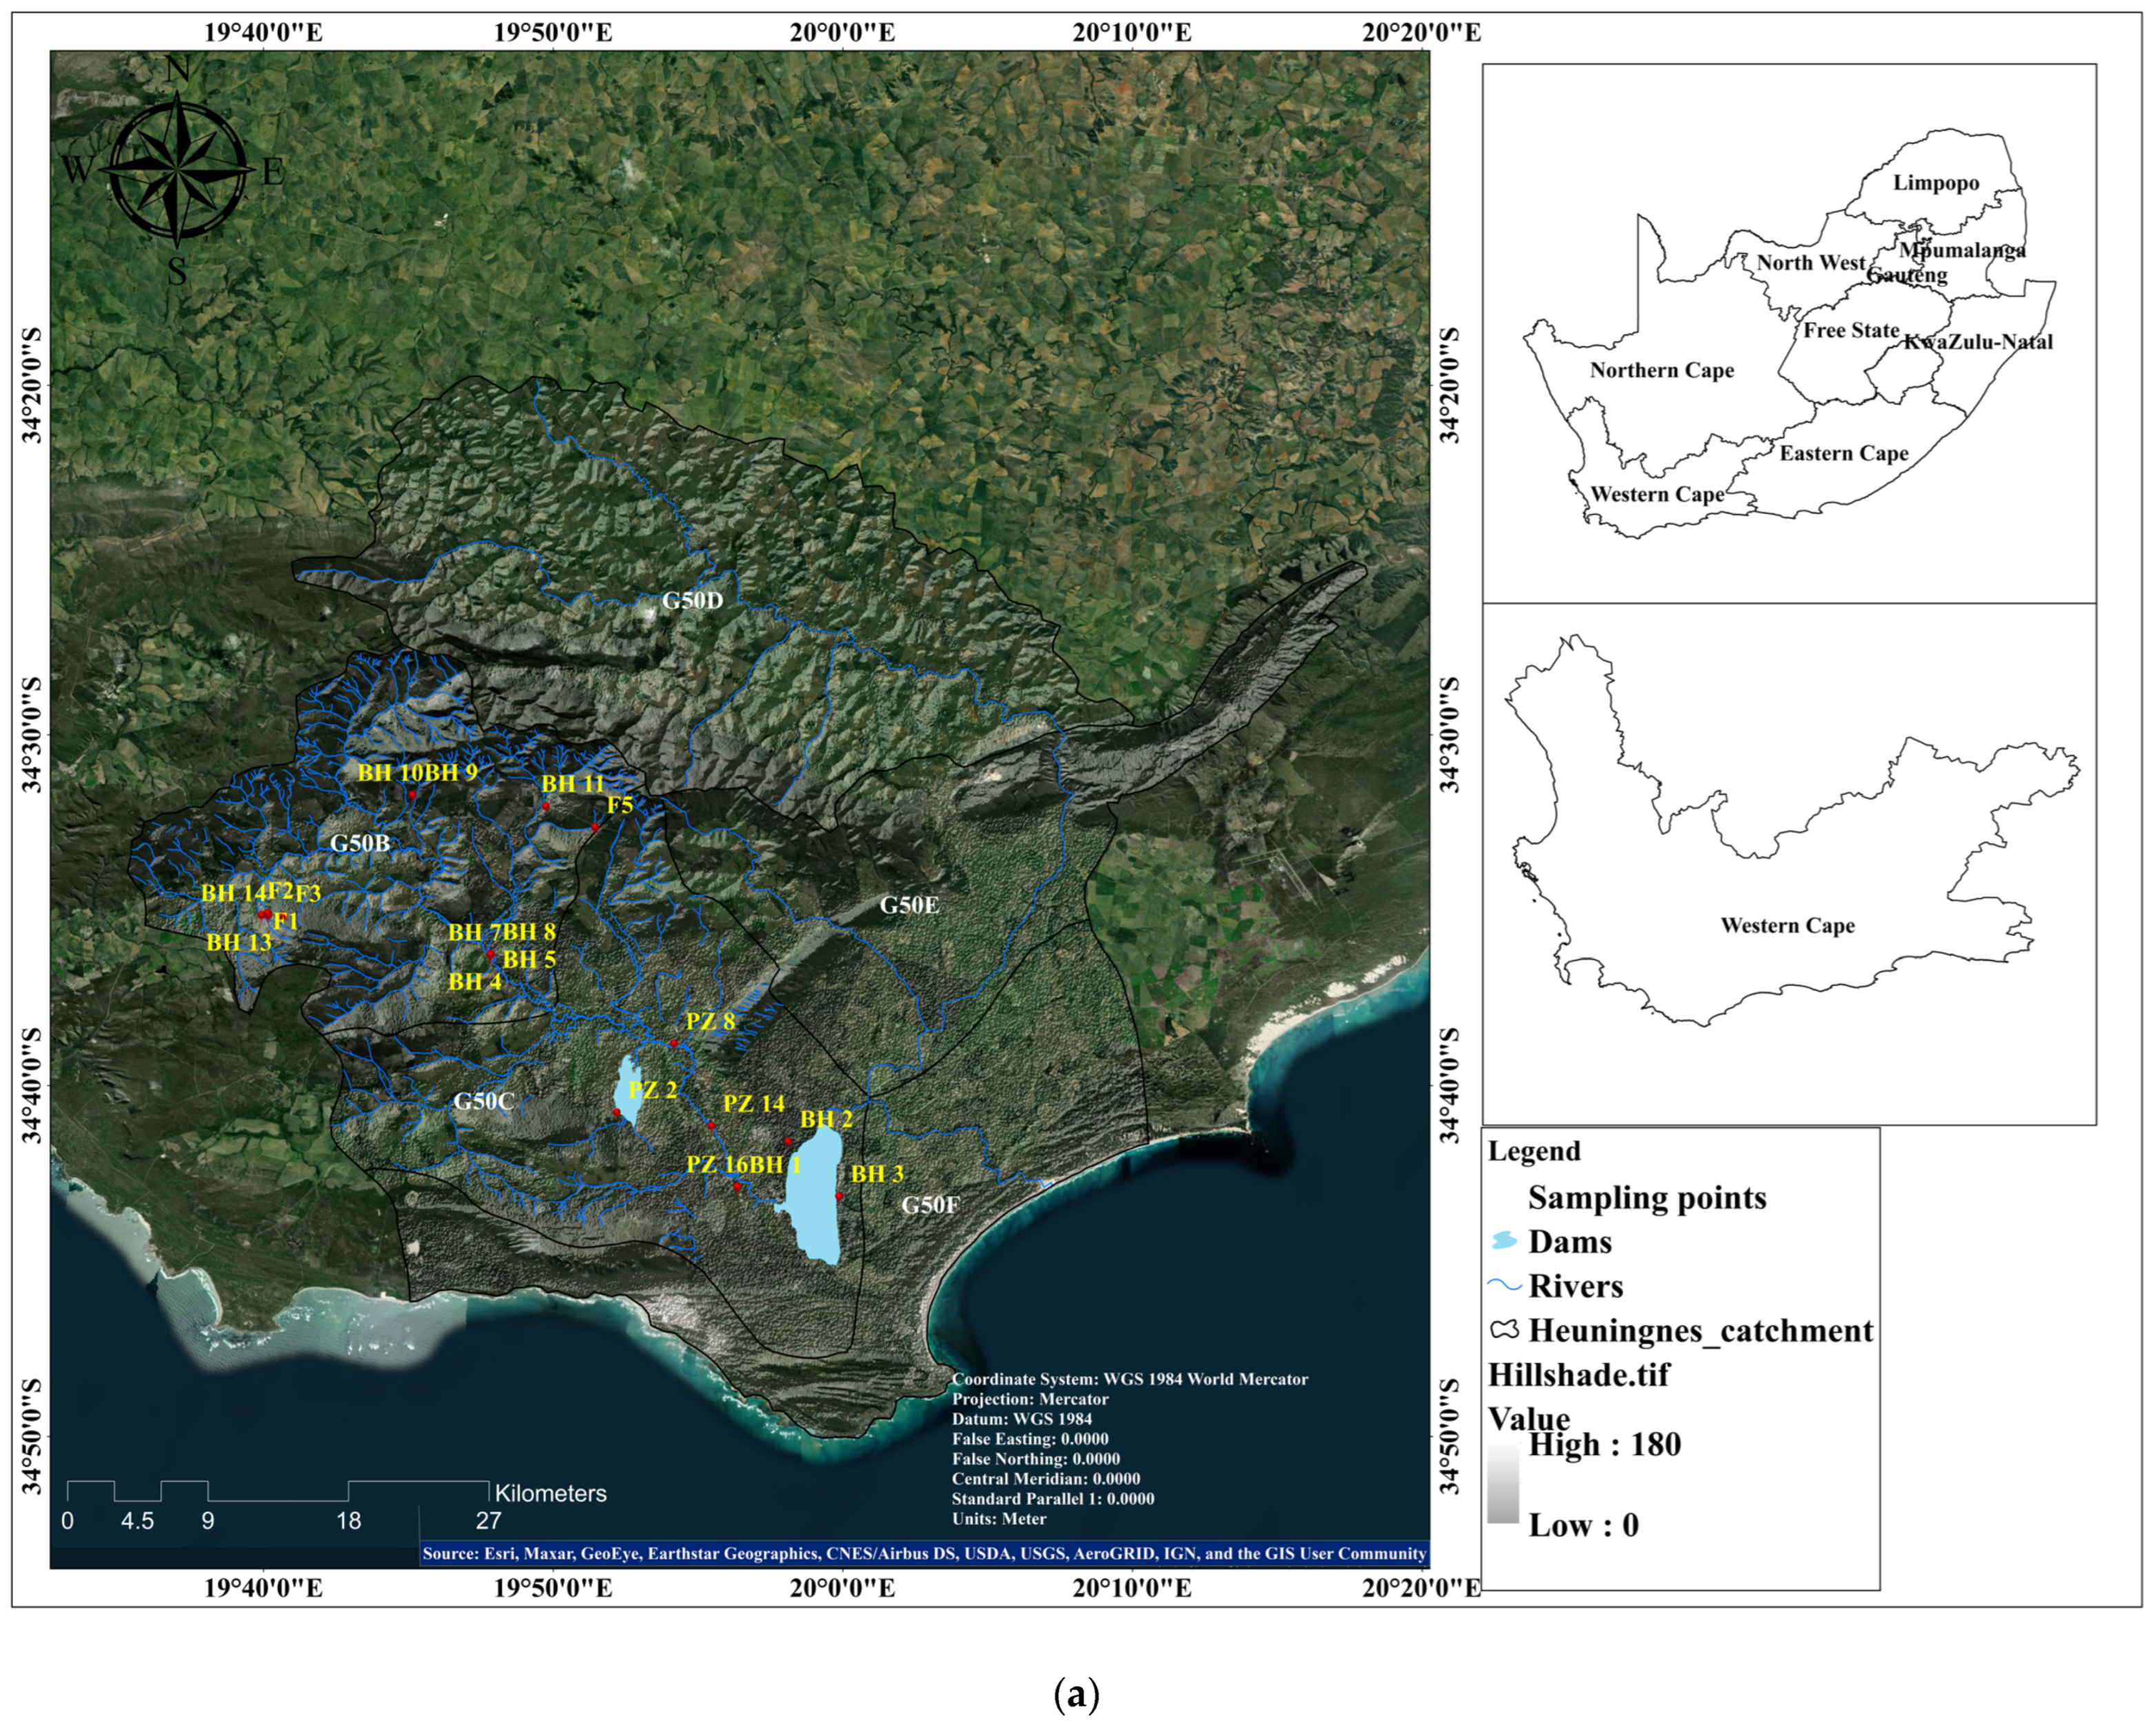
2. Study Area
3. Materials and Methods
3.1. Groundwater Sampling
3.2. Groundwater Chemical Analysis
3.3. Geochemical Modeling and Rock Geochemistry
3.4. Stable Isotope Analysis
4. Results and Discussion
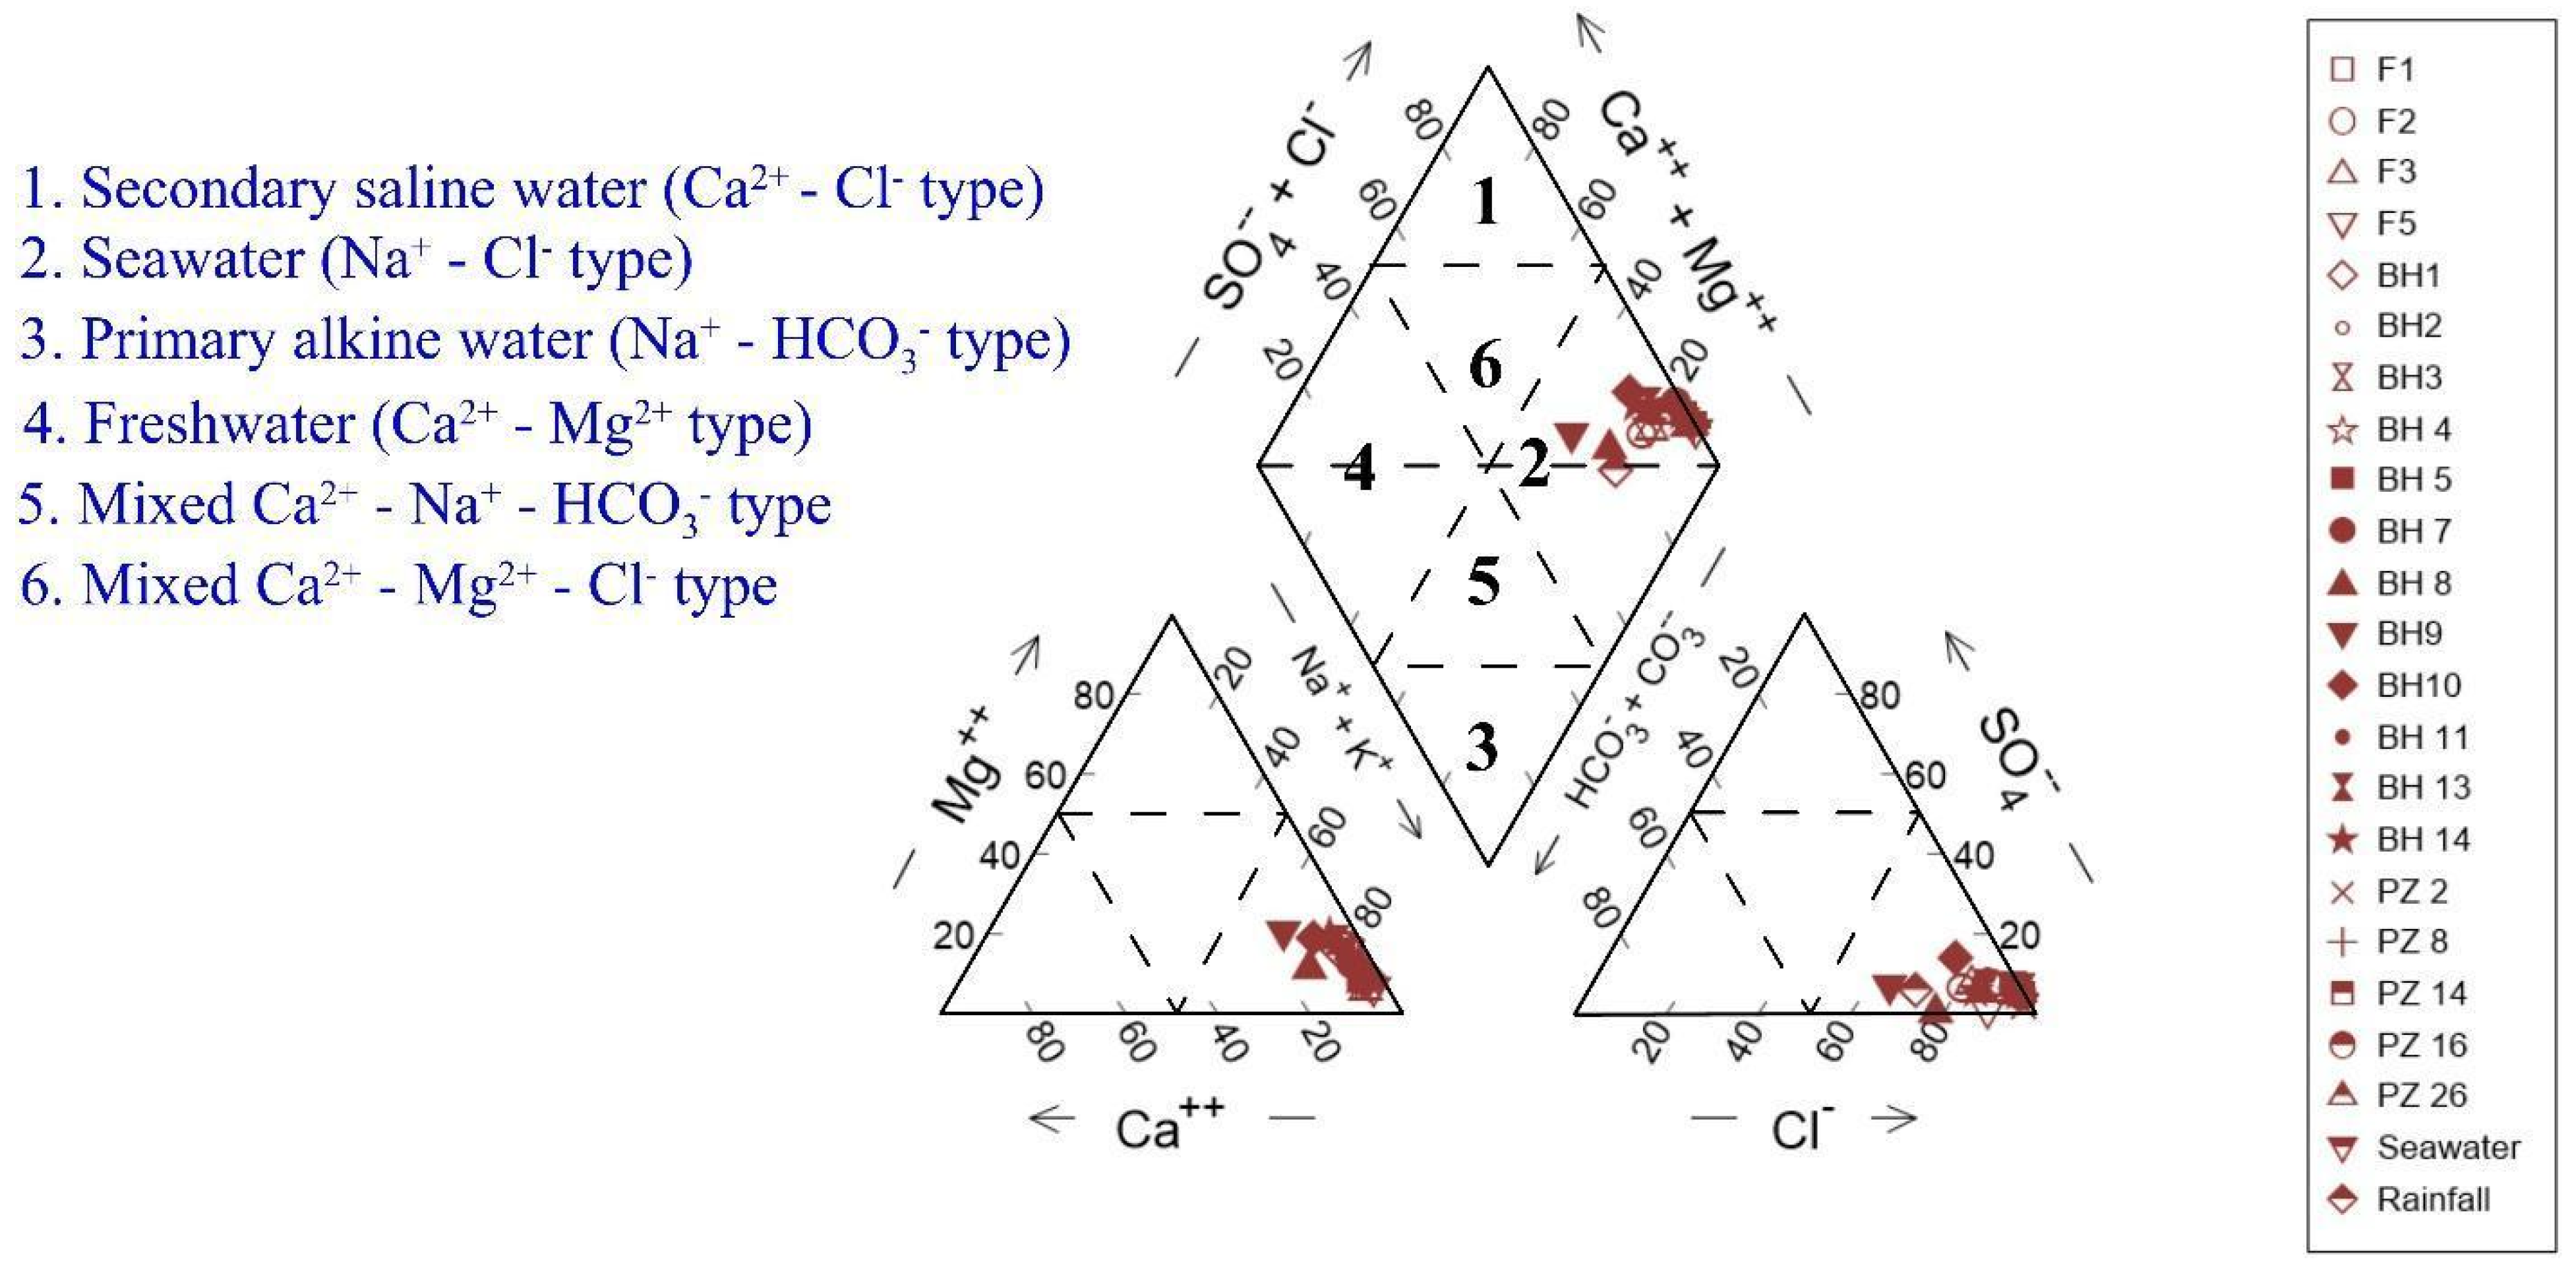
4.1. Hydrogeochemical Analysis (Groundwater Facies)
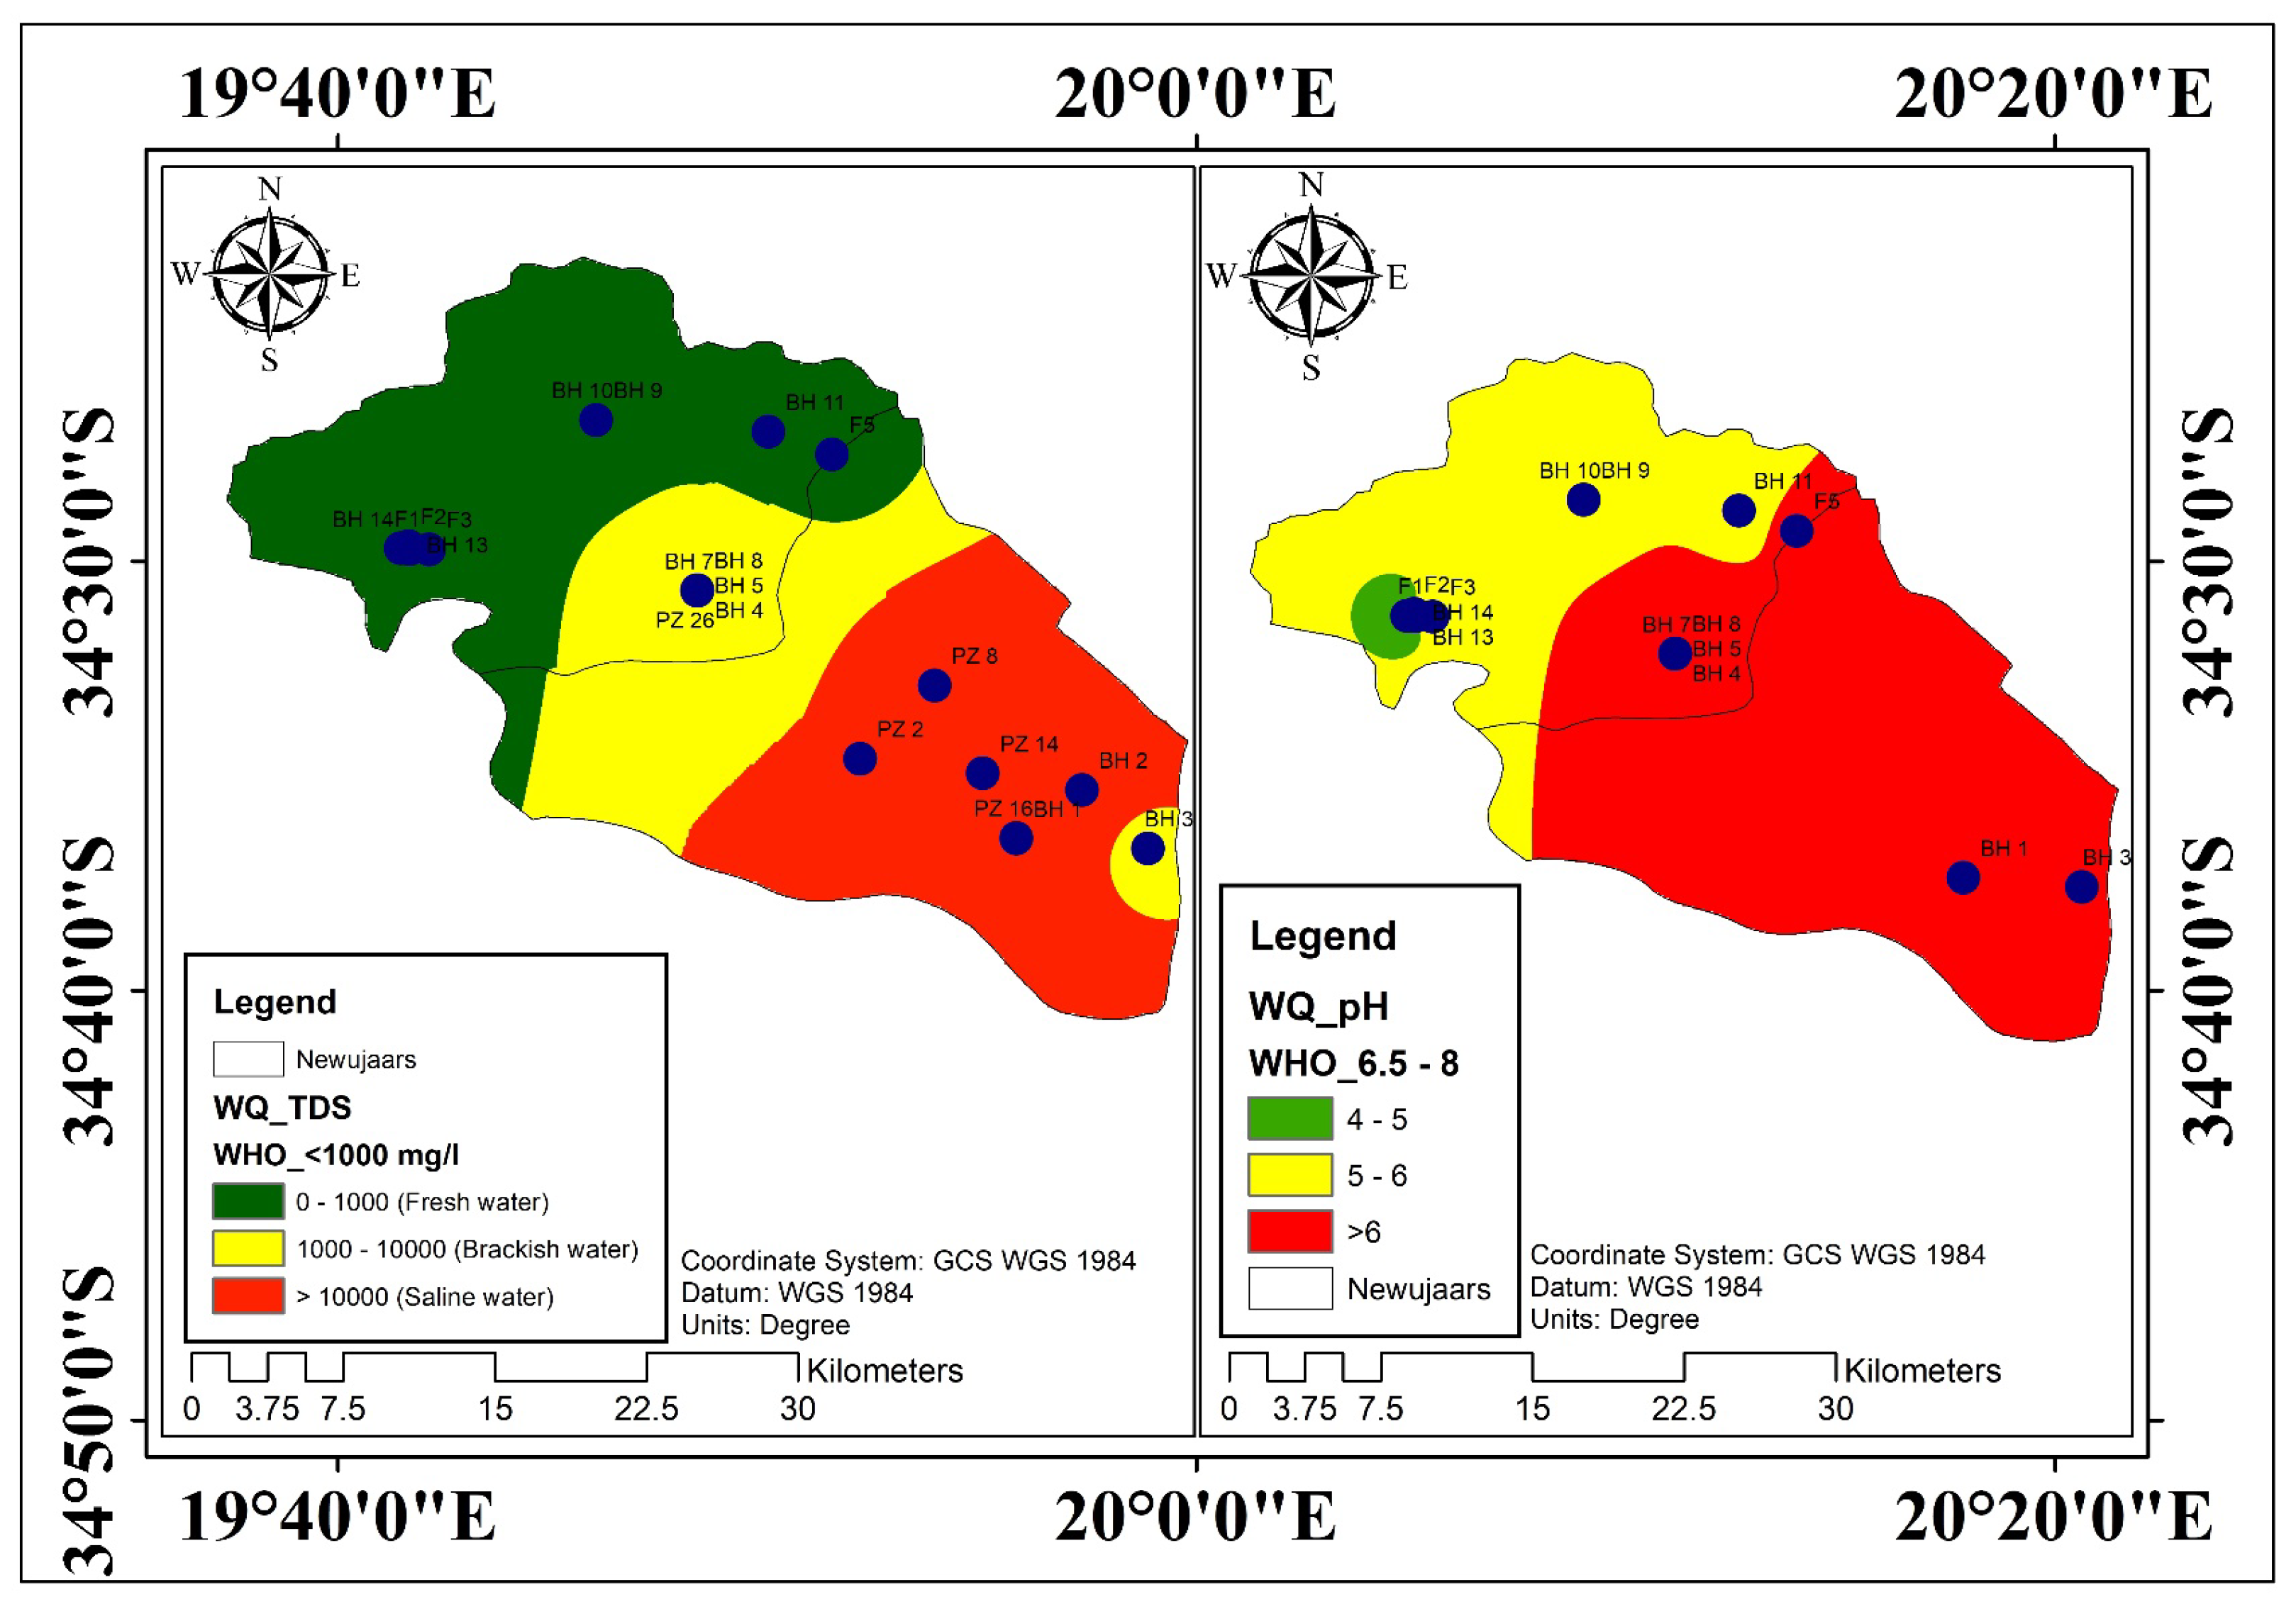
4.2. Classification of Groundwater Salinization
4.3. Suitability of Groundwater for Drinking
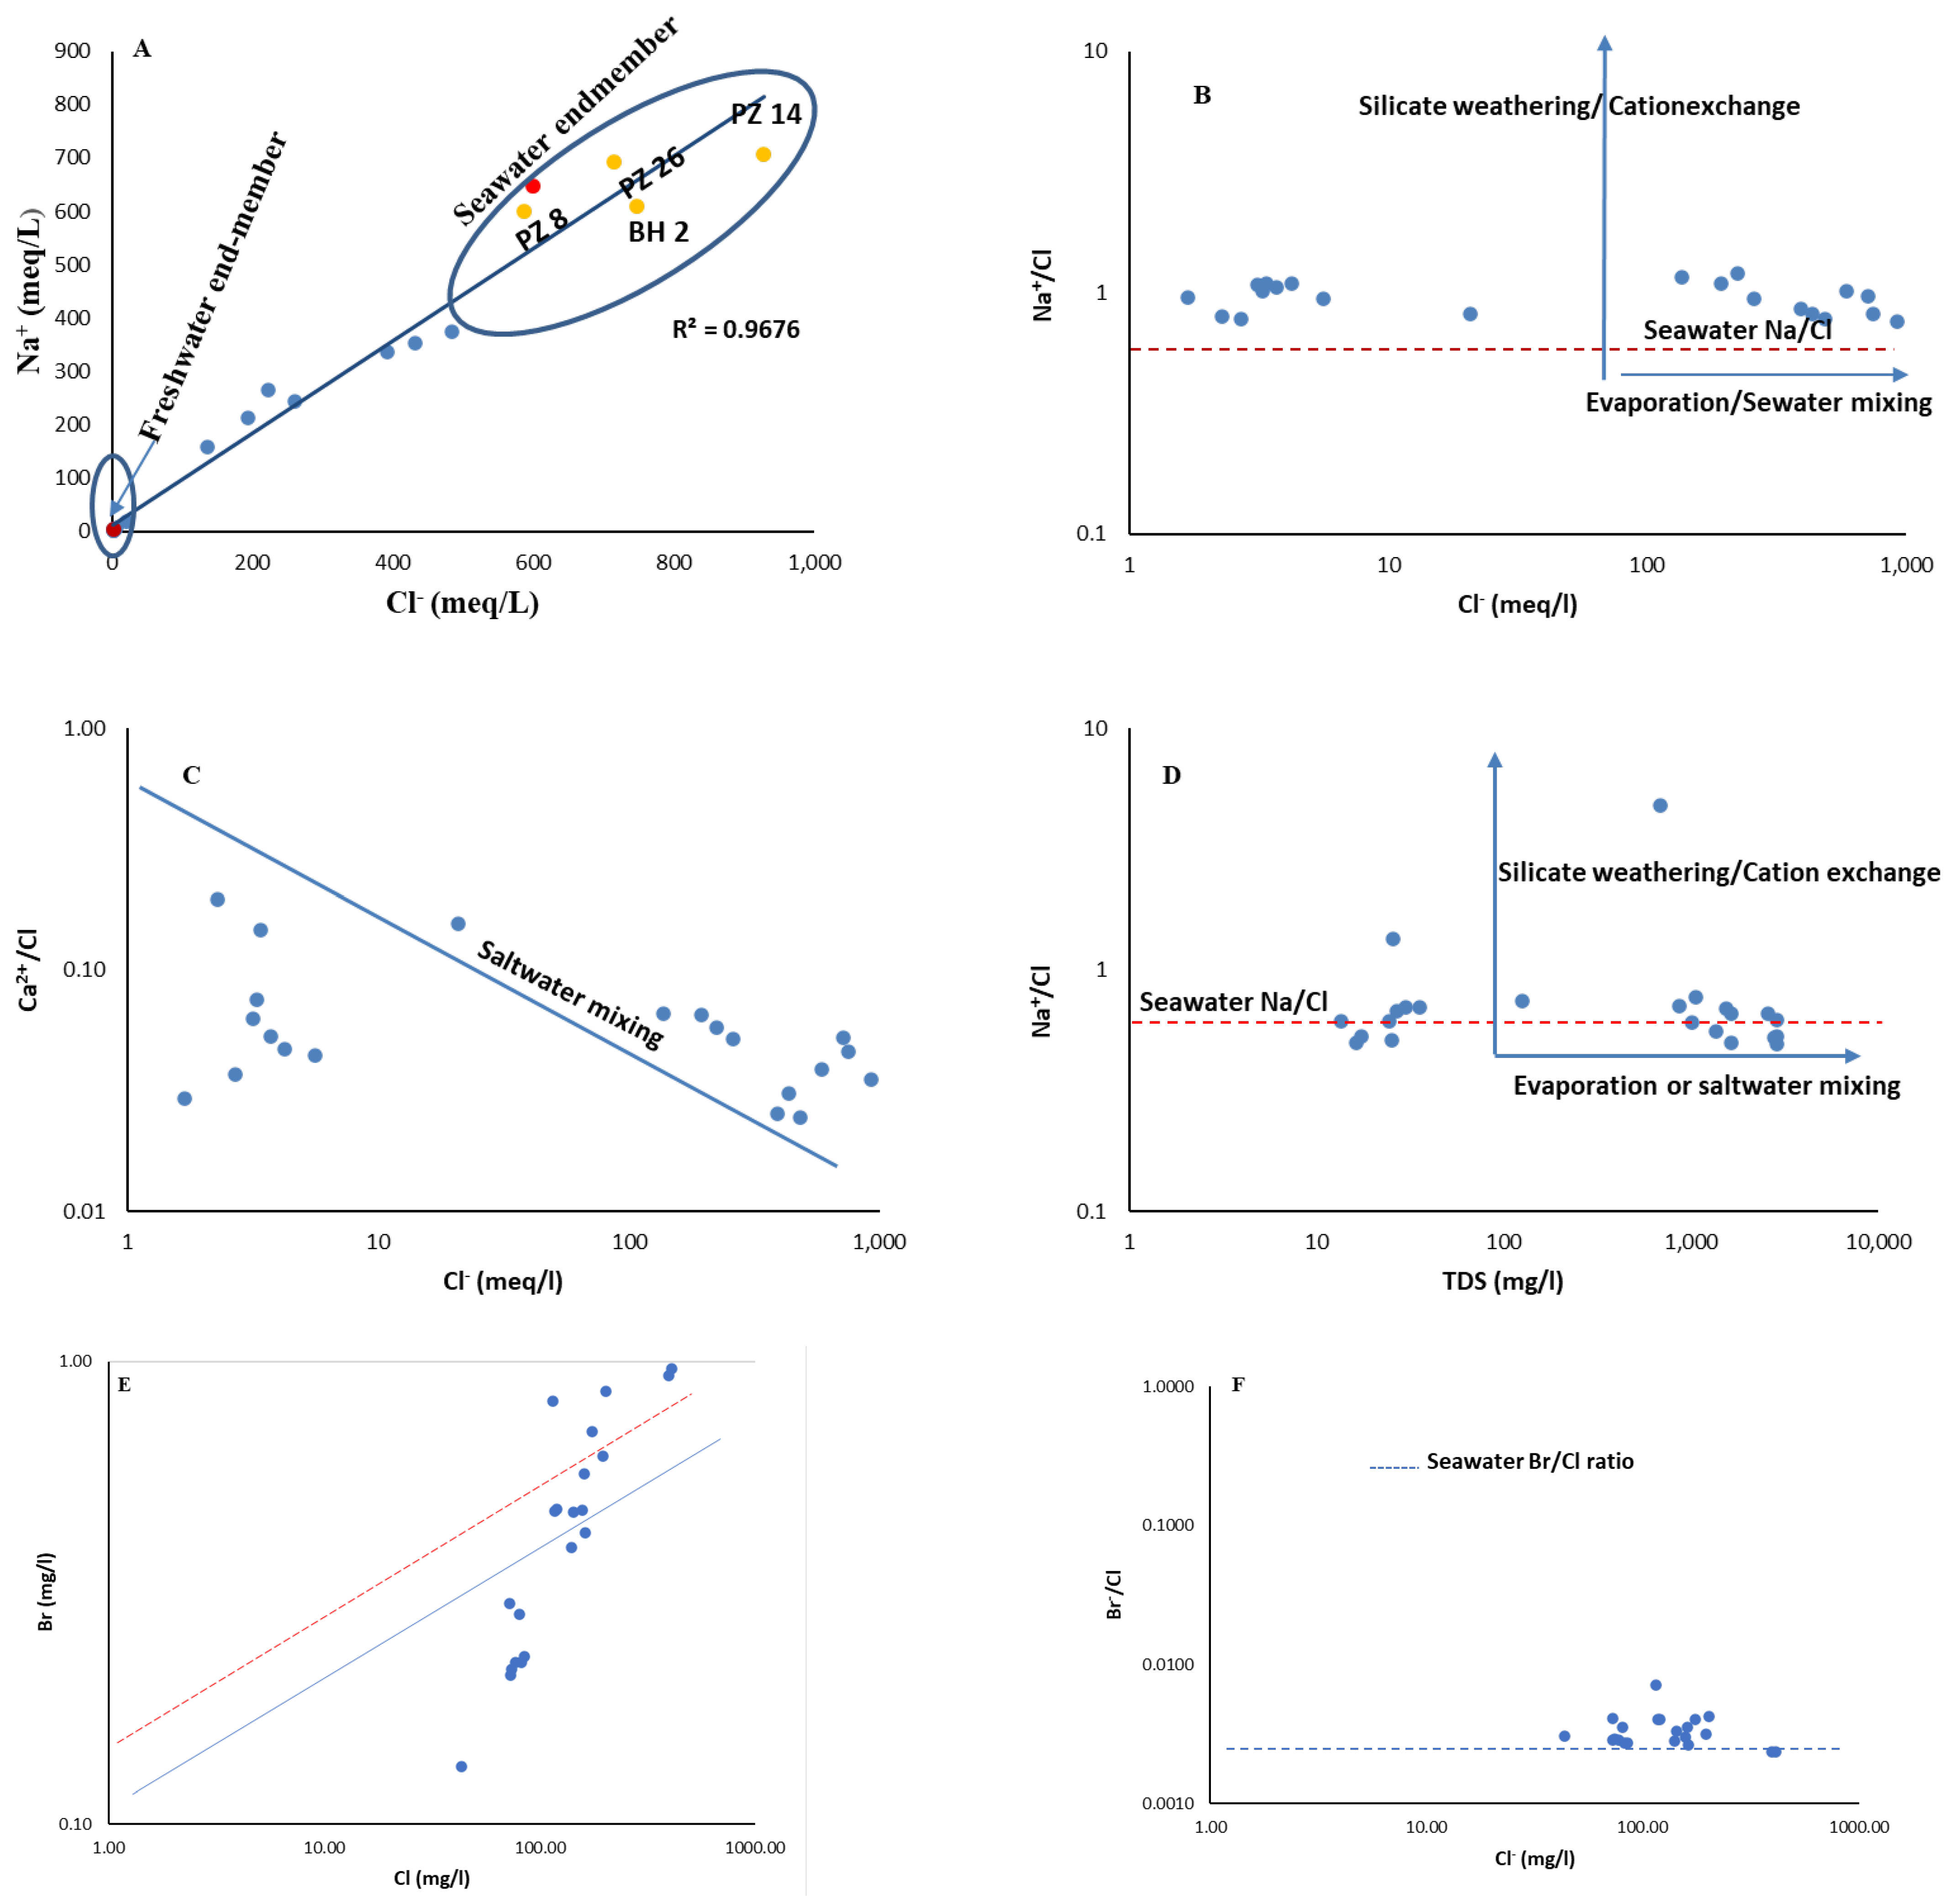
4.4. Saltwater Intrusion Analysis
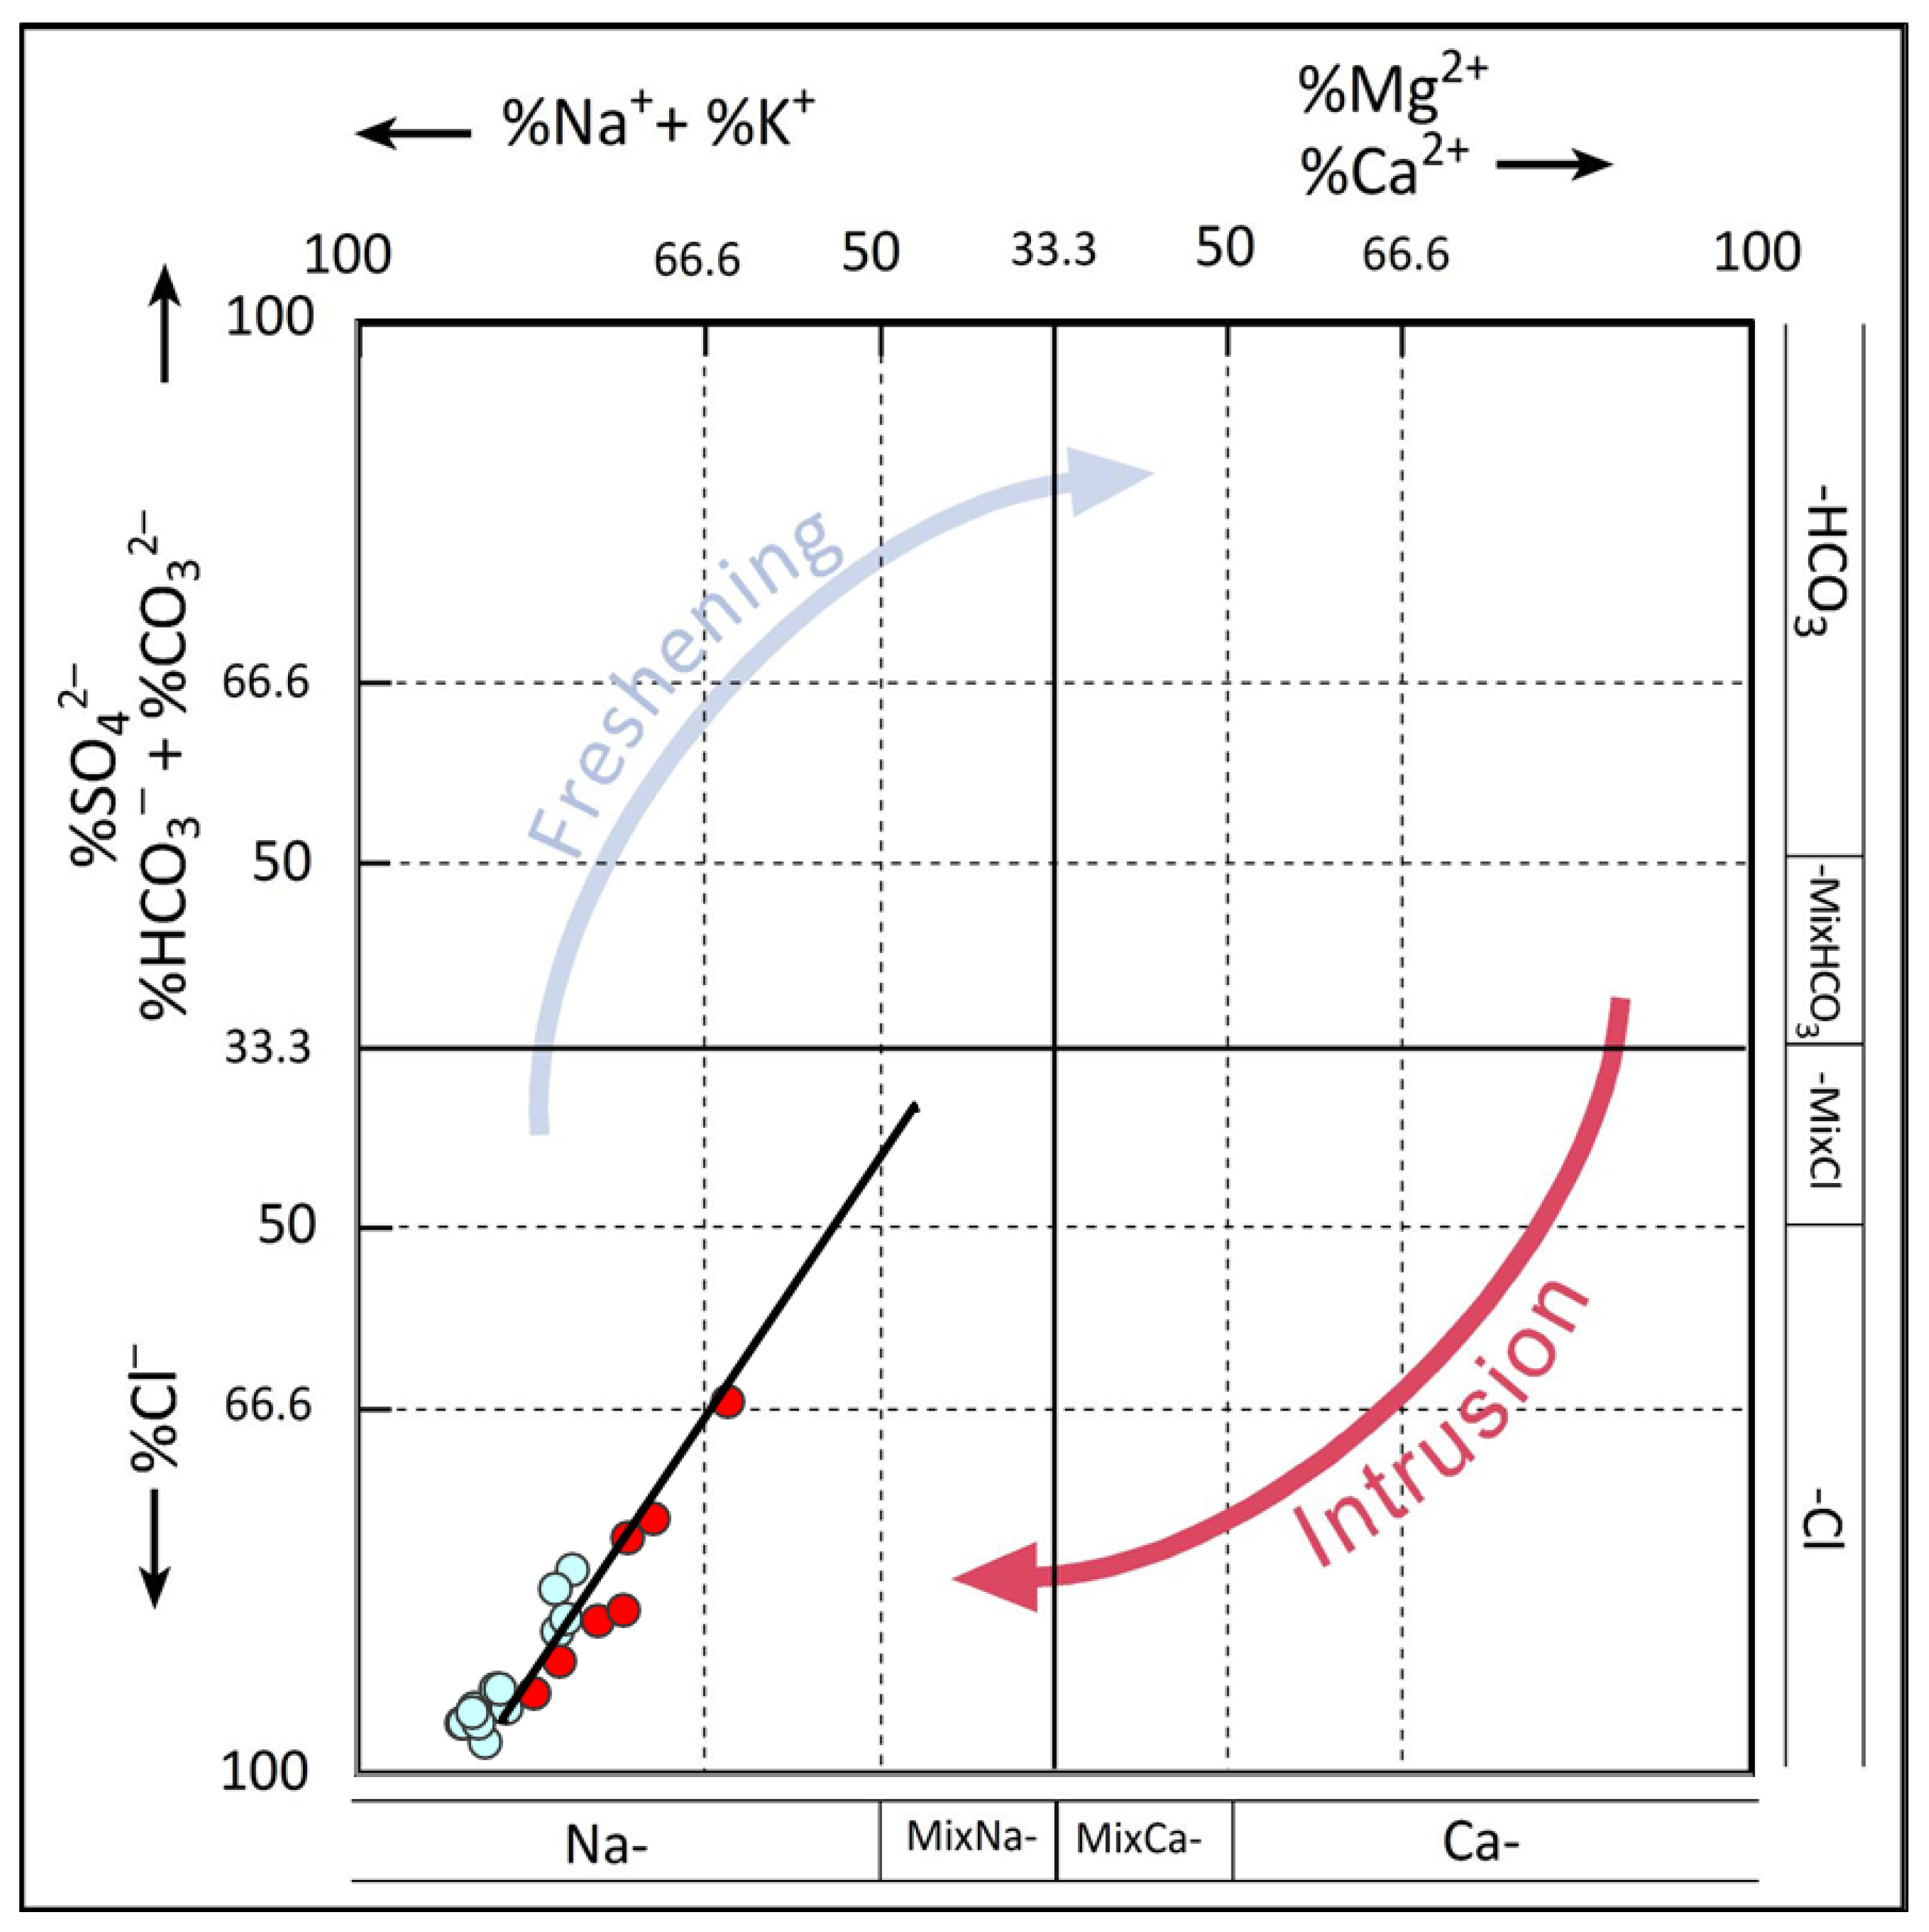
4.4.1. Major Ion Indicators
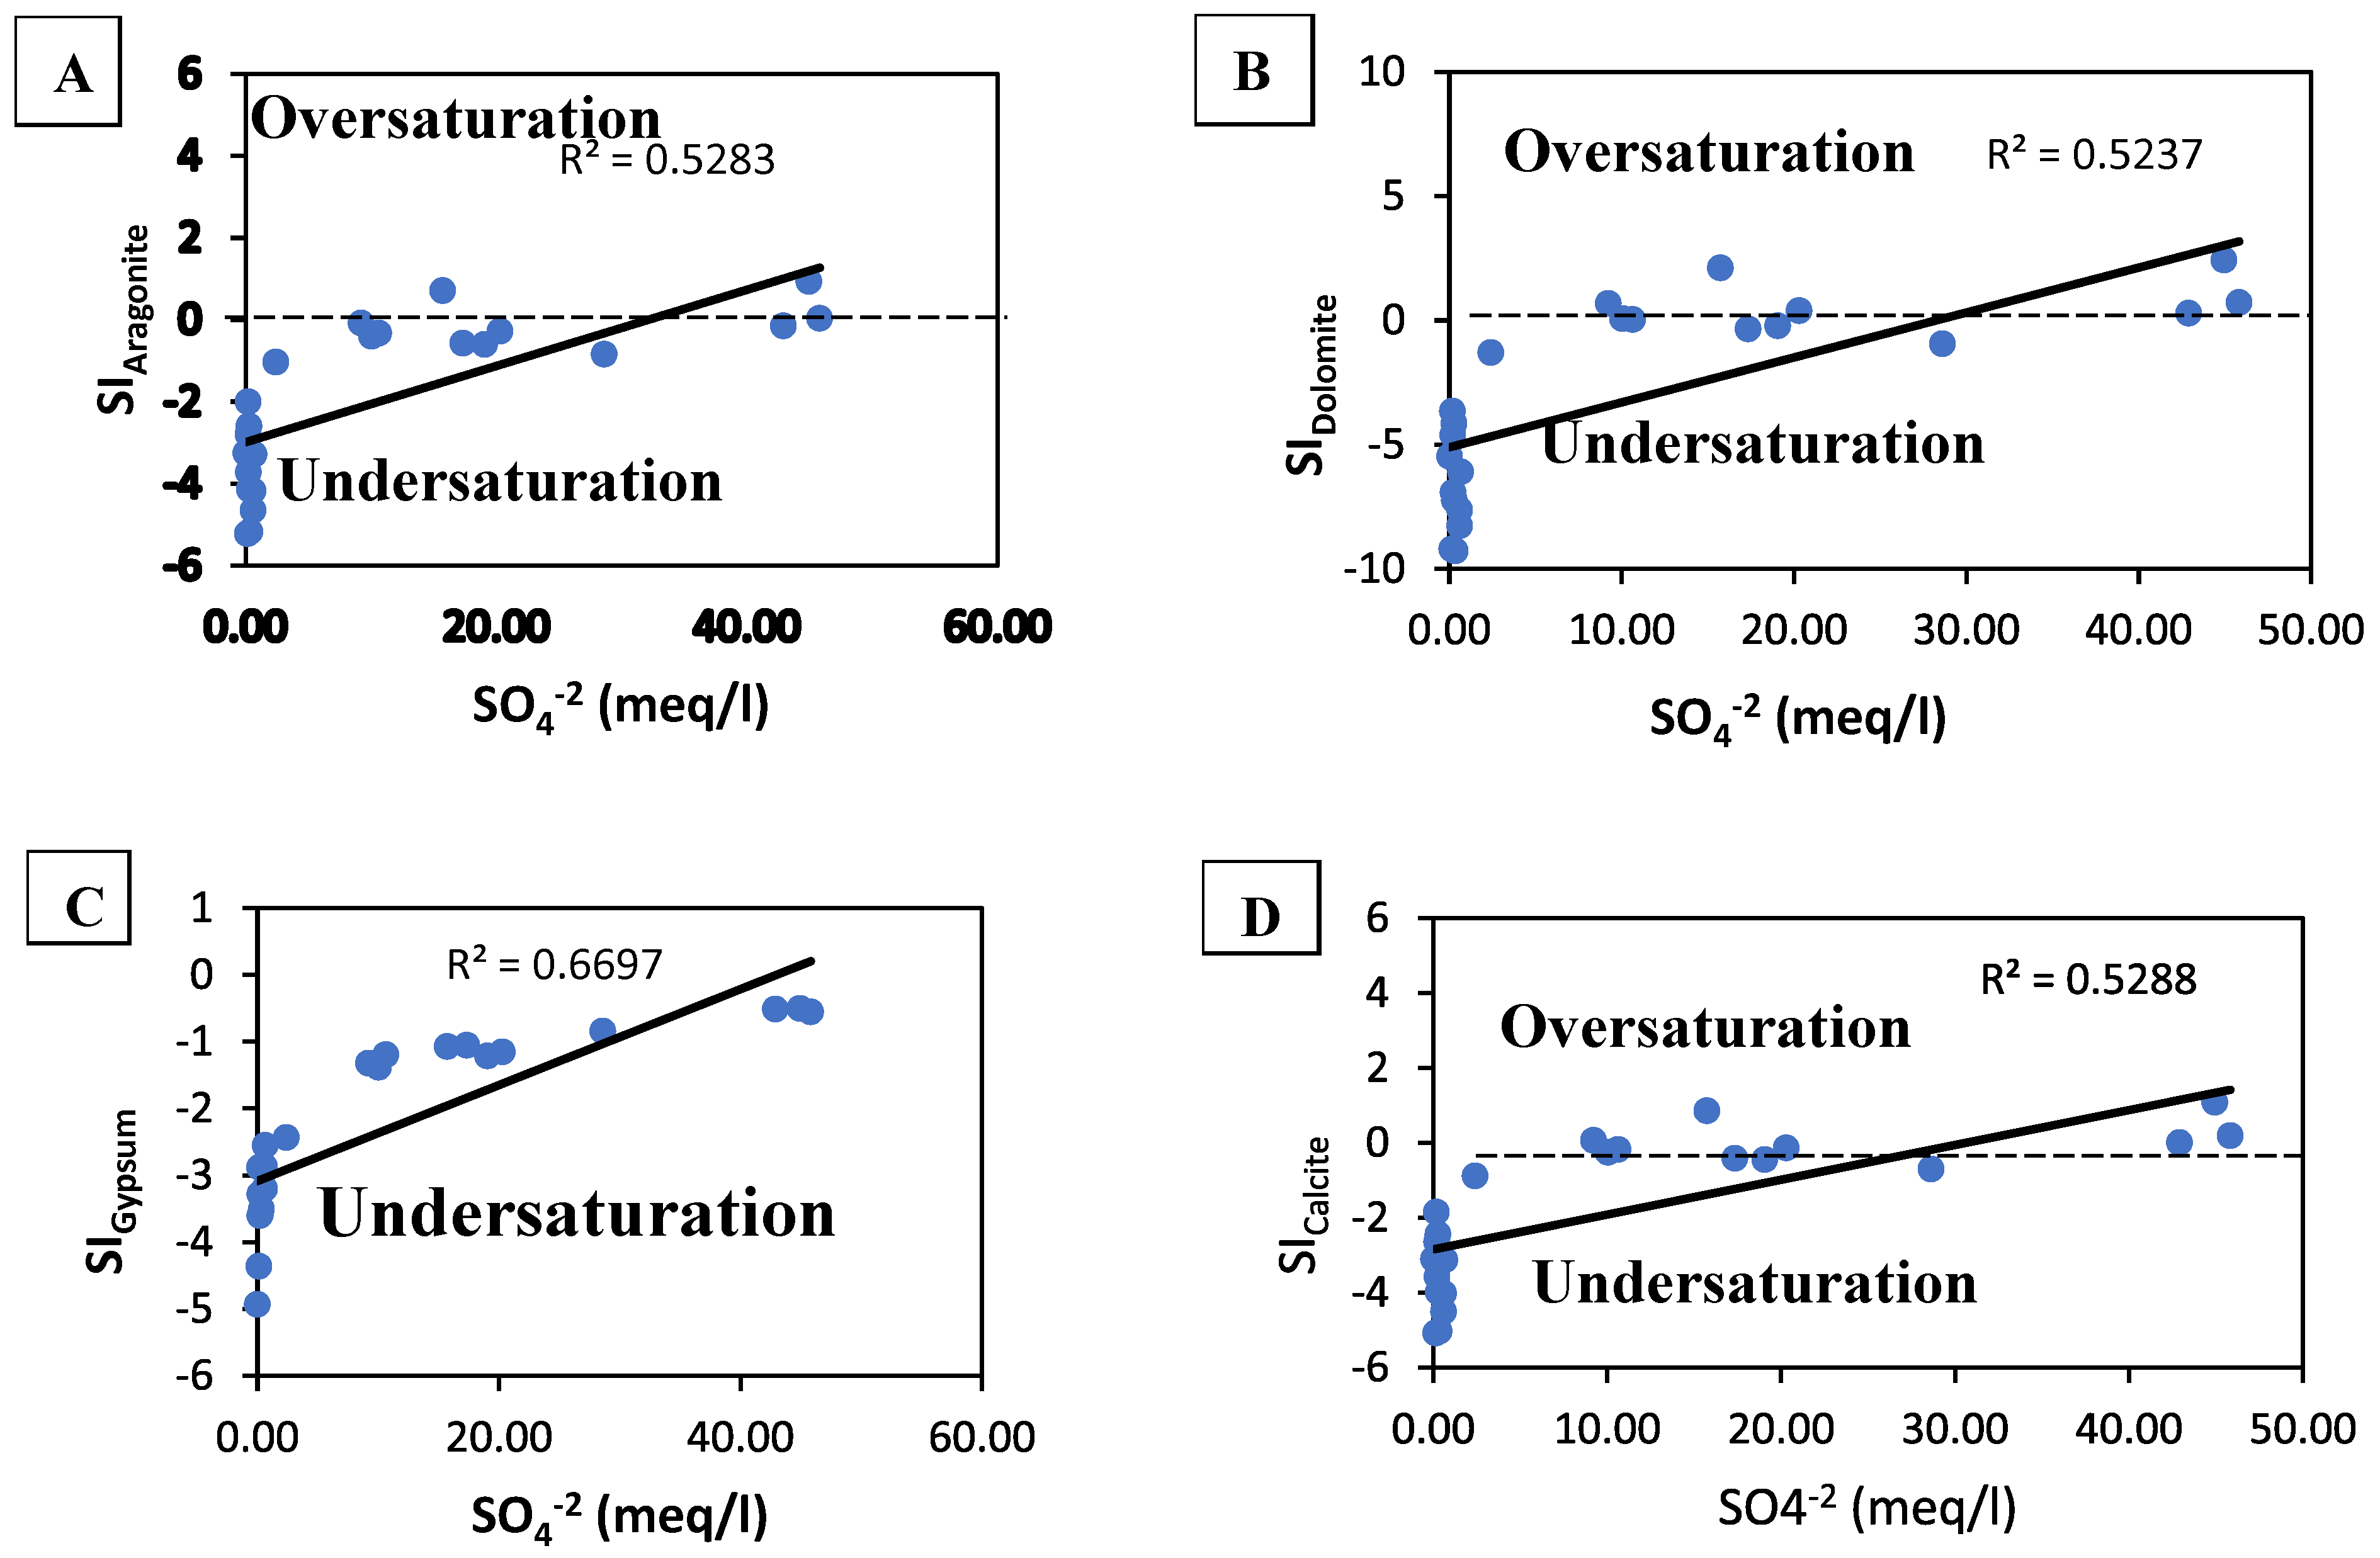
4.4.2. Seawater Intrusion Quantification
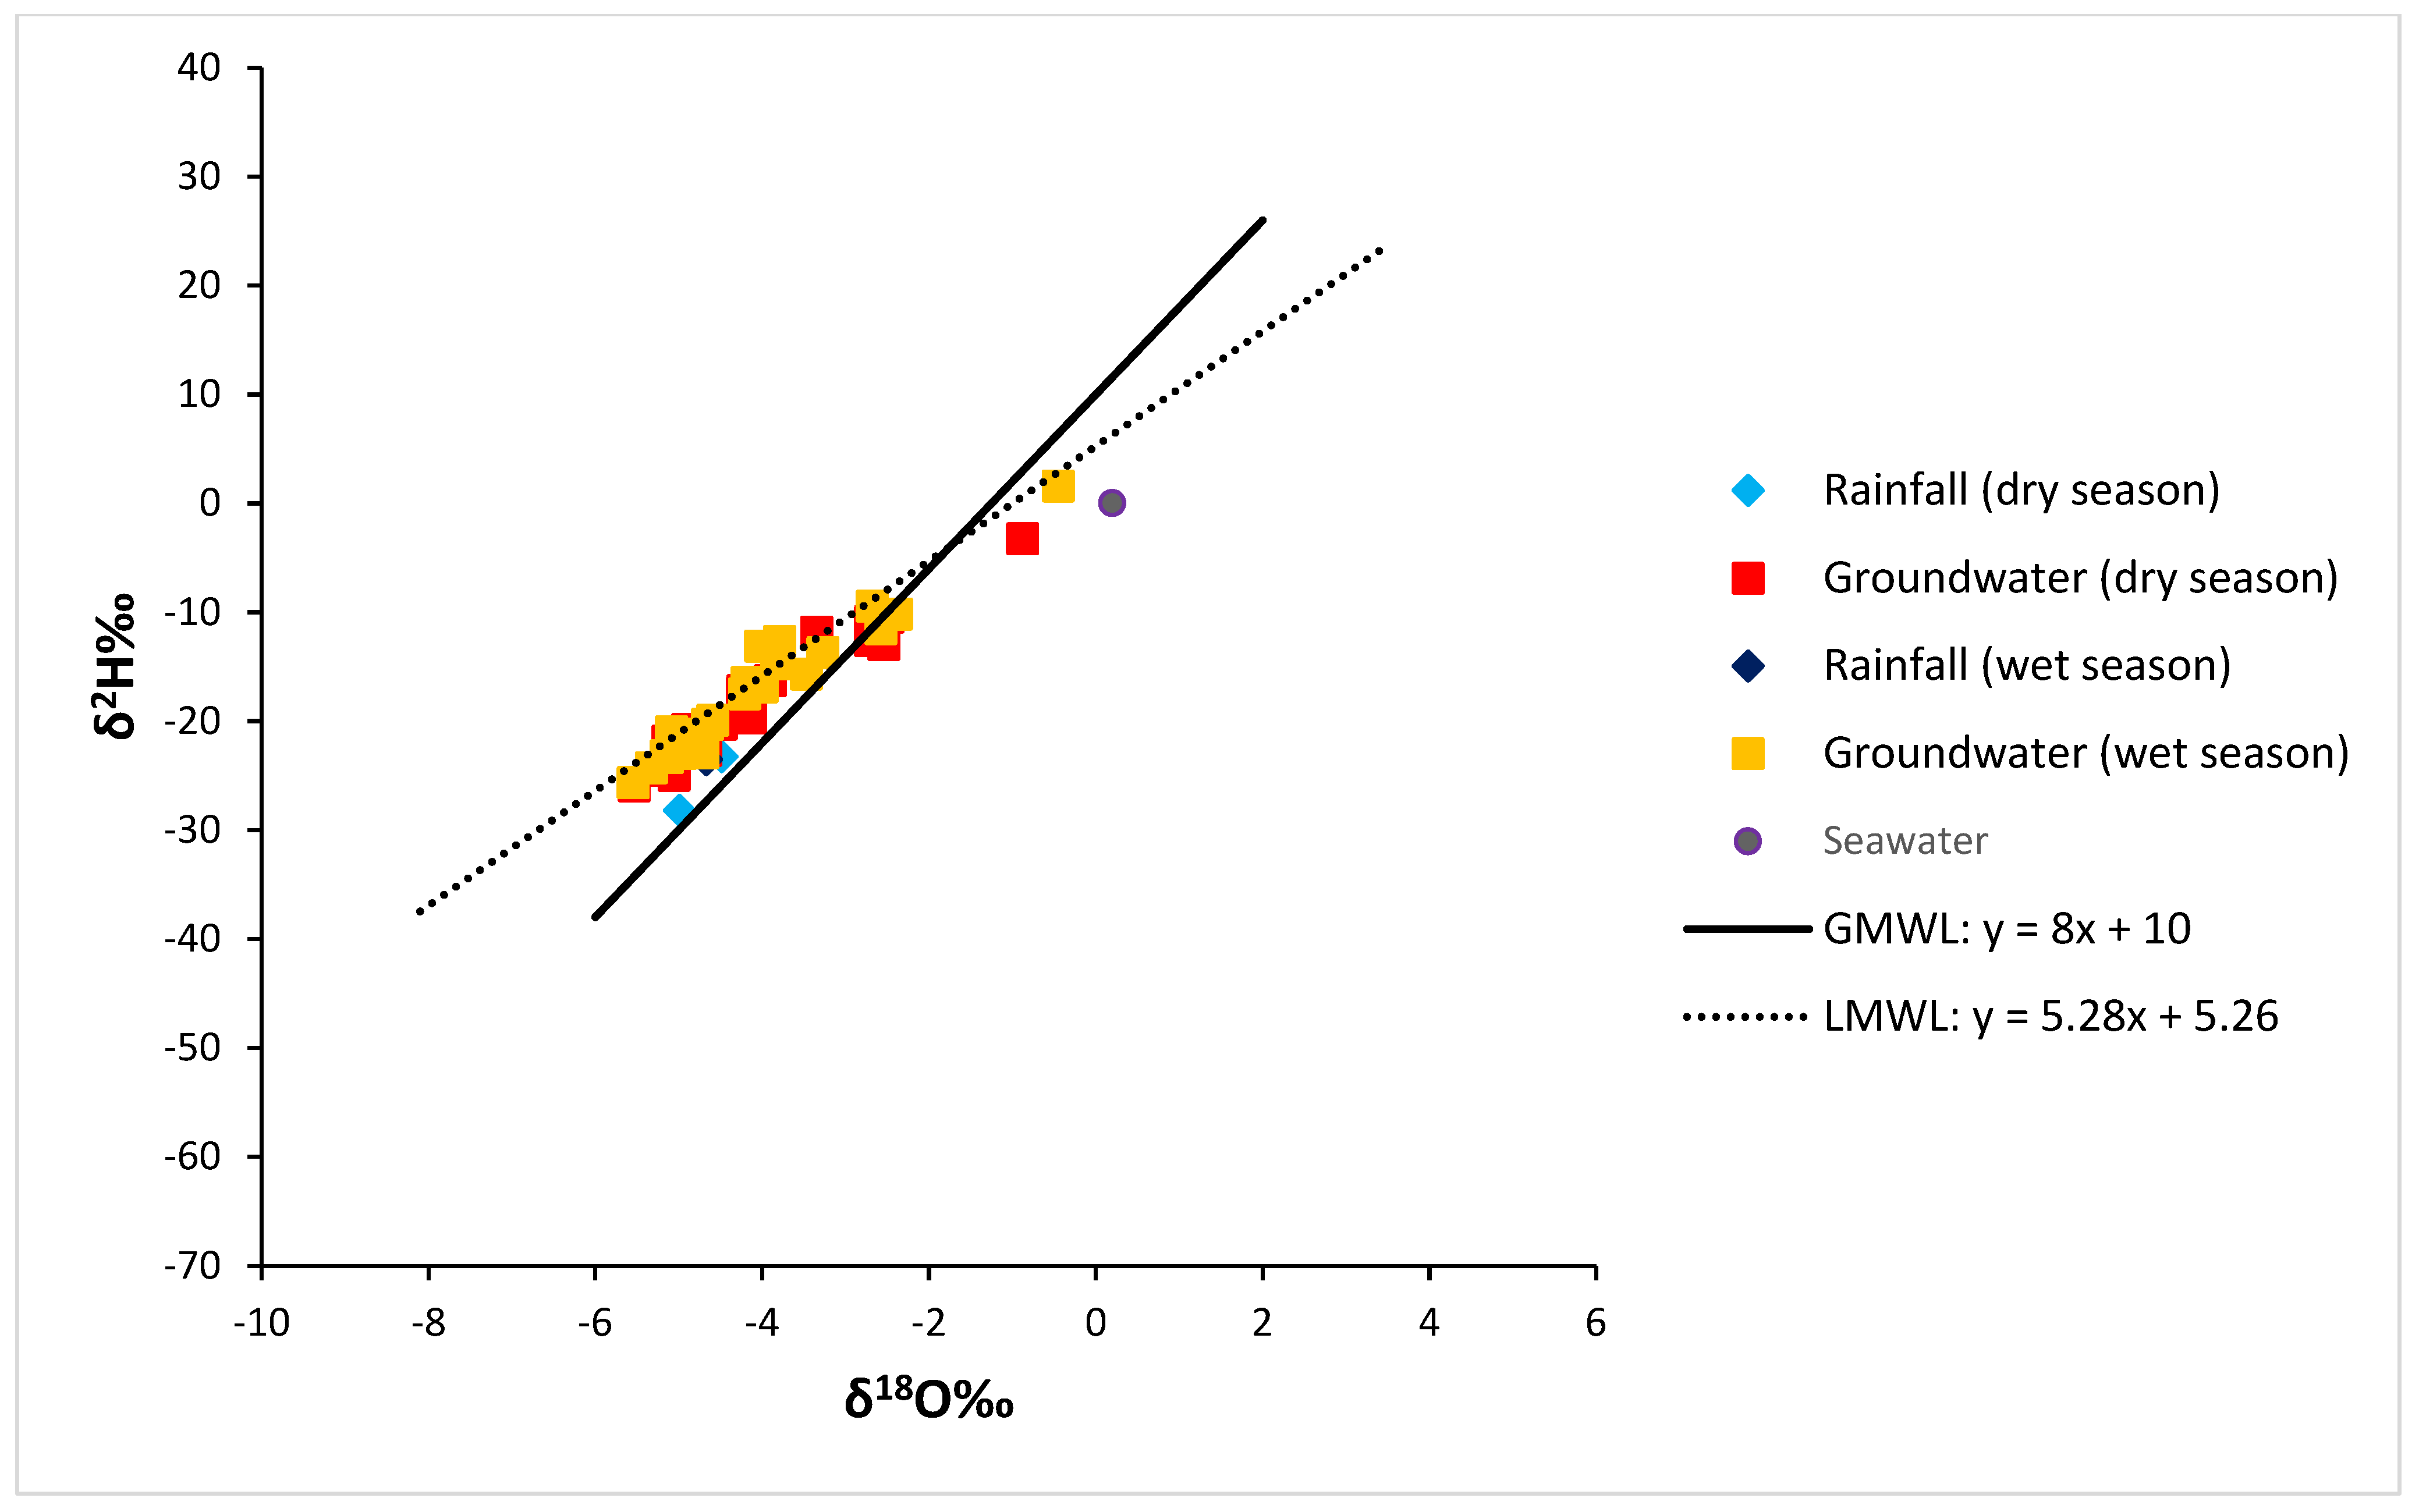
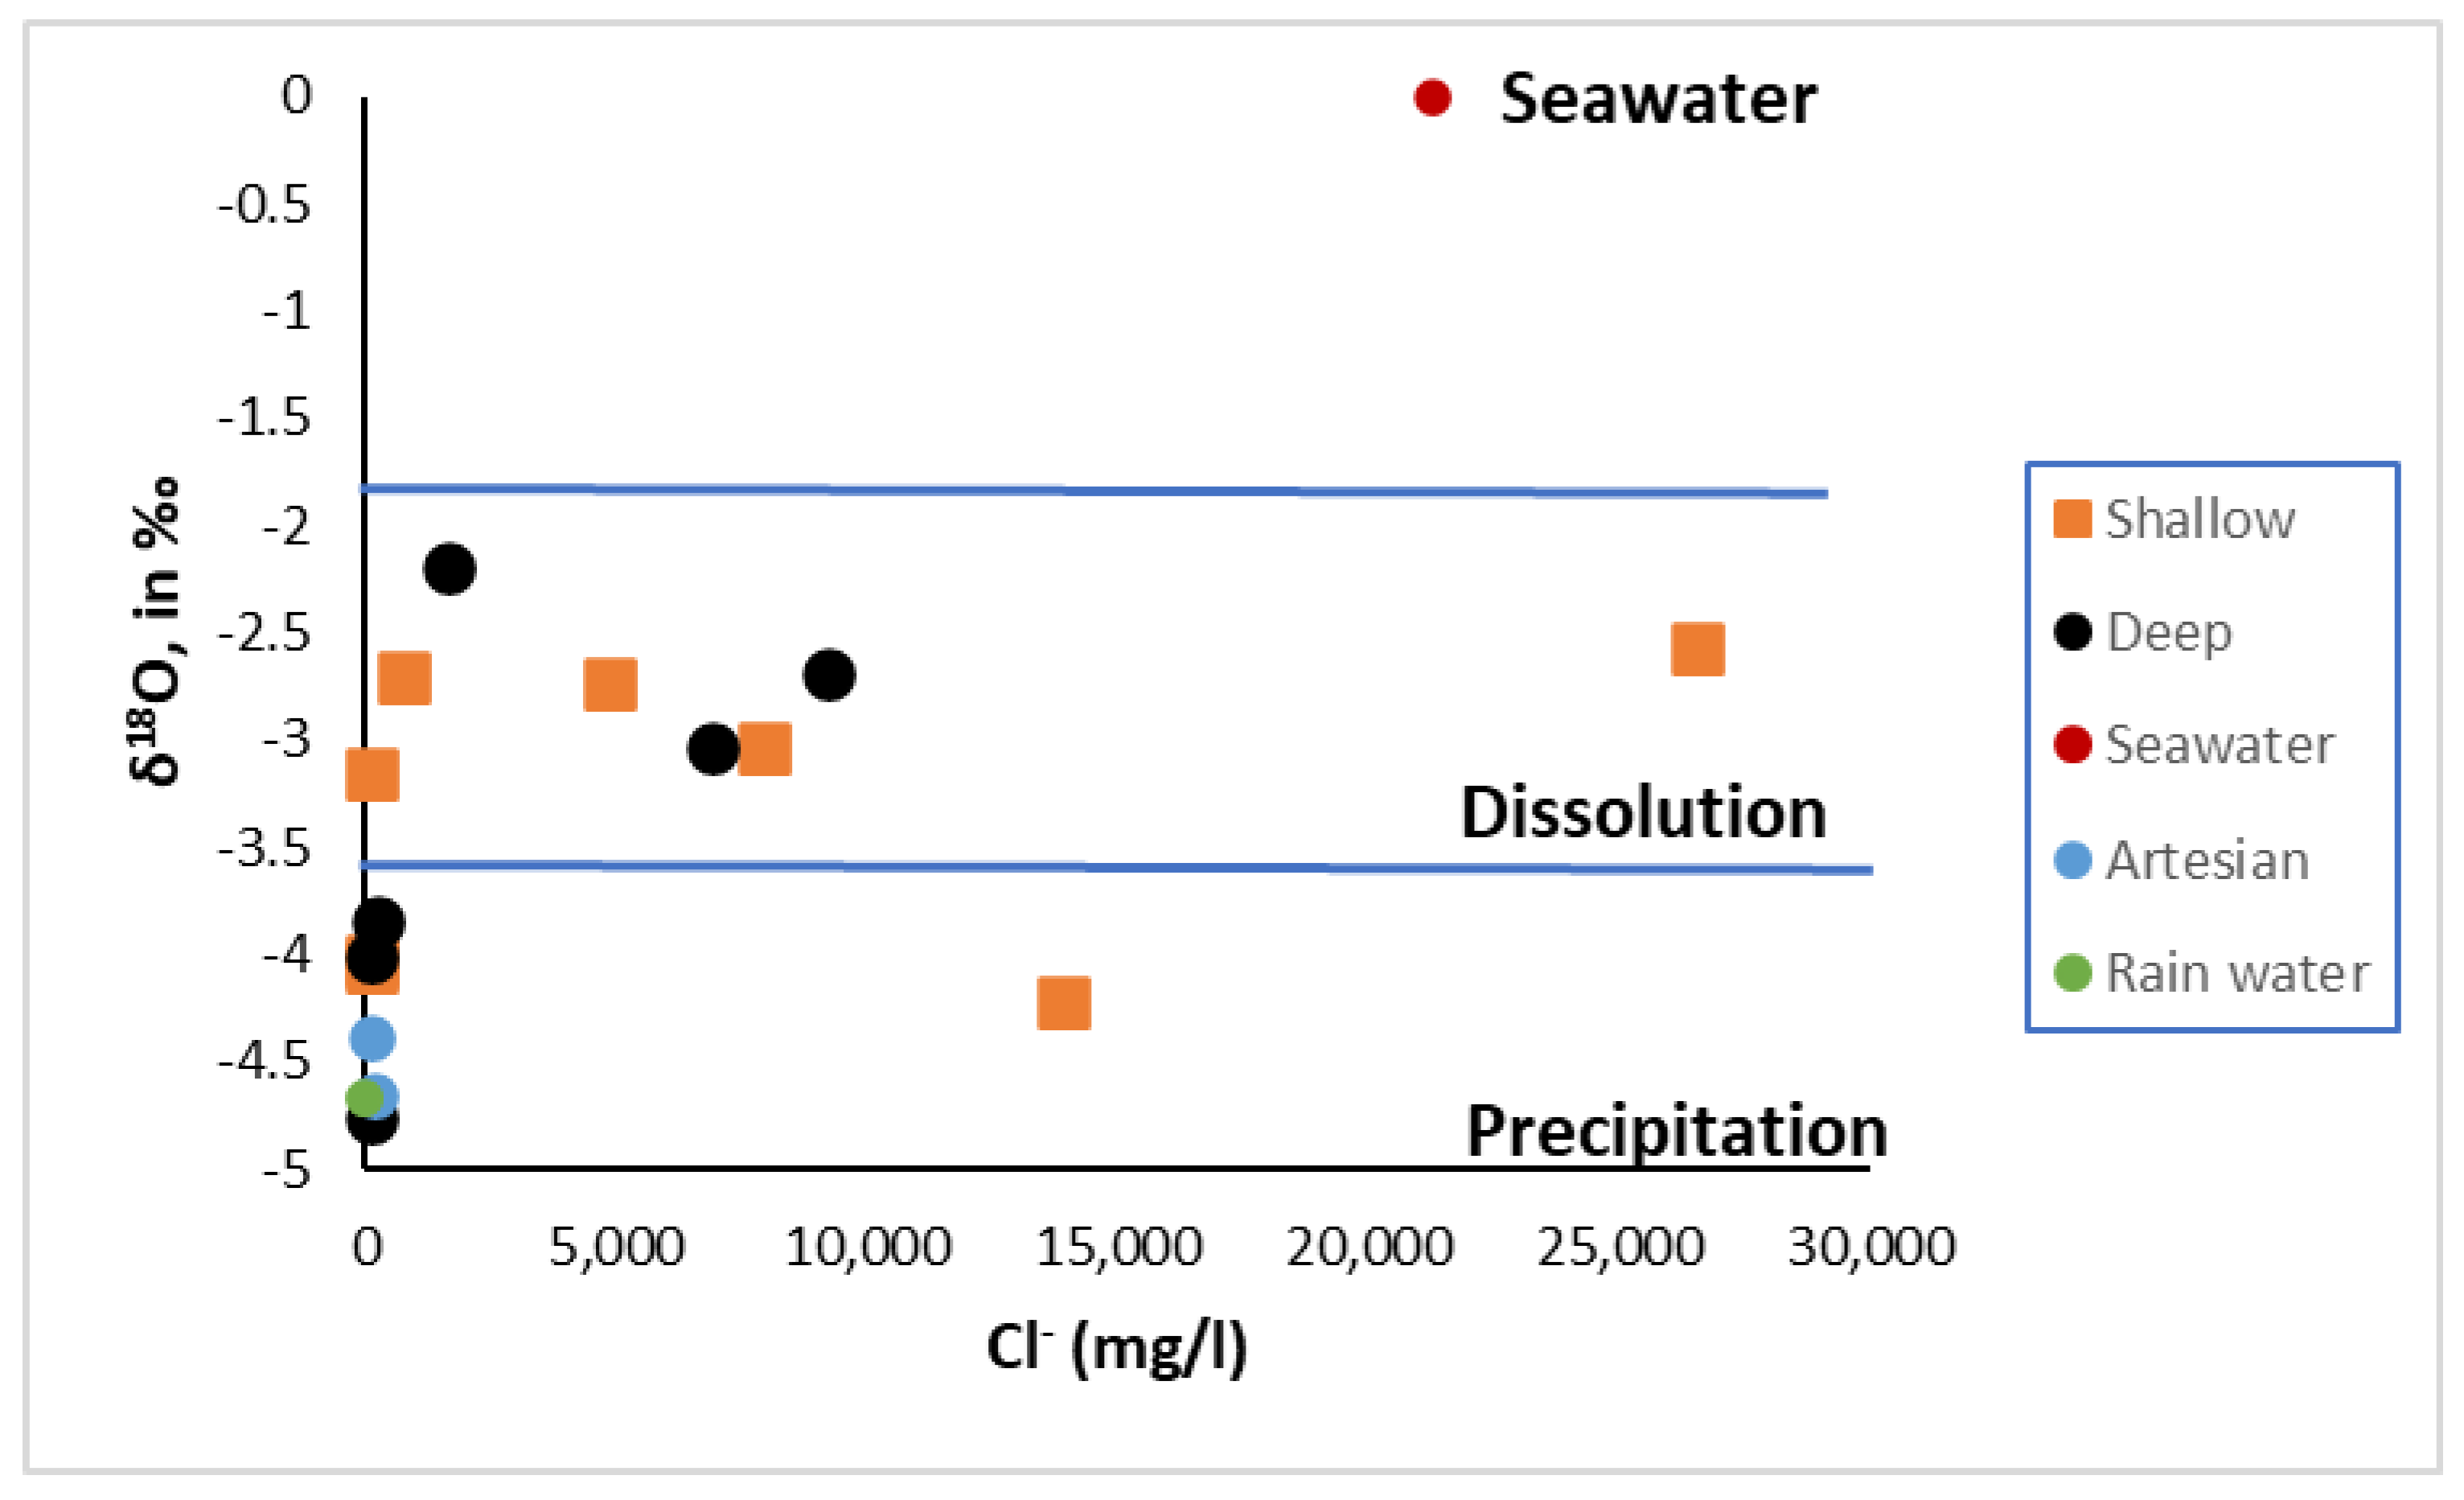
4.5. Identification of Groundwater Origin by δ18O and δ2H Analyses
5. Conclusions
Supplementary Materials
Author Contributions
Funding
Data Availability Statement
Conflicts of Interest
References
- Ktépi, B. Environmental Science. In Green Technology: An A-to-Z Guide; Sage: Newbury Park, CA, USA, 2012. [Google Scholar] [CrossRef]
- Putra, D.B.E.; Hadian, M.S.D.; Alam, B.Y.C.S.; Yuskar, Y.; Yaacob, W.Z.W.; Datta, B.; Harnum, W.P.D. Geochemistry of groundwater and saltwater intrusion in a coastal region of an island in Malacca Strait, Indonesia. Environ. Eng. Res. 2020, 26, 200006. [Google Scholar] [CrossRef]
- Argamasilla, M.; Barberá, J.; Andreo, B. Factors controlling groundwater salinization and hydrogeochemical processes in coastal aquifers from southern Spain. Sci. Total. Environ. 2017, 580, 50–68. [Google Scholar] [CrossRef] [PubMed]
- Appelo, C.A.J.; Postma, D. Geochemistry, Groundwater and Pollution, 2nd ed.; A.A Balkema Publishers: Amsterdam, The Netherlands, 2005; p. 649. ISBN 978-0415364287. [Google Scholar]
- Diédhiou, M.; Ndoye, S.; Celle, H.; Faye, S.; Wohnlich, S.; Le Coustumer, P. Hydrogeochemical Appraisal of Groundwater Quality and Its Suitability for Drinking and Irrigation Purposes in the West Central Senegal. Water 2023, 15, 1772. [Google Scholar] [CrossRef]
- Fan, X.; Min, T.; Dai, X. The Spatio-Temporal Dynamic Patterns of Shallow Groundwater Level and Salinity: The Yellow River Delta, China. Water 2023, 15, 1426. [Google Scholar] [CrossRef]
- Kumar, P.; Kumar, A.; Singh, C.K.; Saraswat, C.; Avtar, R.; Ramanathan, A.L.; Herath, S. Hydrogeochemical Evolution and Appraisal of Groundwater Quality in Panna District, Central India. Expo. Health 2016, 8, 19–30. [Google Scholar] [CrossRef]
- Ghezelsofloo, E.; Raghimi, M.; Mahmoodlu, M.G.; Rahimi-Chakdel, A.; Khademi, S.M.S. Saltwater intrusion in drinking water wells of Kordkuy, Iran: An integrated quantitative and graphical study. Environ. Earth Sci. 2021, 80, 520. [Google Scholar] [CrossRef]
- Han, D.; Kohfahl, C.; Song, X.; Xiao, G.; Yang, J. Geochemical and isotopic evidence for palaeo-seawater intrusion into the south coast aquifer of Laizhou Bay, China. Appl. Geochem. 2011, 26, 863–883. [Google Scholar] [CrossRef]
- Hoekstra, T.; Waller, L. (Eds.) De Mond Nature Reserve Complex: Protected Area Management Plan; CapeNature: Cape Town, South Africa, 2014; unpublished report. [Google Scholar]
- Kinoti, I.K. Integrated Hydrological Modeling of Surface and Groundwater Interactions in Heuningnes Catchment (South Africa). 2018. Available online: https://webapps.itc.utwente.nl/librarywww/papers_2018/msc/wrem/kinoti.pdf (accessed on 15 December 2022).
- Price, M. Introducing Groundwater; Routledge: London, UK, 1996; 296p, ISBN 9780748743711. [Google Scholar]
- Lasher, C. Application of Fluid Electrical Conductivity Logging for Fractured Rock Aquifer Characterisation at the University of the Western Cape’s Franschhoek and Rawsonville Research Sites. Ph.D. Thesis, University of the Western Cape, Cape Town, South Africa, 2011. [Google Scholar]
- Banda, S.D.V. Assessing Hydrogeological Characteristics to Establish Influence of Aquifer-River Interaction in Non-Perennial River Systems, Heuningnes Catchment. Master’s Thesis, University of the Western Cape, Cape Town, South Africa, 2019. [Google Scholar]
- Manyama, K. Hydrogeophysical Characterization of Shallow Coastal Aquifers in the Western Cape, South Africa. Master’s Thesis, University of the Western Cape, Cape Town, South Africa, November 2017. [Google Scholar]
- Custodio, E.; Bruggeman, G.A. Groundwater problems in coastal areas. In Studies and Reports in Hydrology; No. 45, International Hydrological Programme (IHP); UNESCO: Paris, France, 1987. [Google Scholar]
- Kouzana, L.; Ben Mammou, A.; Felfoul, M.S. Seawater intrusion and associated processes: Case of the Korba aquifer (Cap-Bon, Tunisia). Surface geosciences (hydrology-hydrogeology). Comptes Rendus Geosci. 2009, 341, 21–35. [Google Scholar] [CrossRef]
- Fidelibus, M.D. Environmental Tracing in Coastal Aquifers: Old Problems and New Solutions. In Coastal Aquifers Intrusion Technology: Mediterranean Countries; IGME: Madrid, Spain, 2003; Volume II, pp. 79–111. [Google Scholar]
- Pulido-Leboeuf, P. Seawater intrusion and associated processes in a small coastal complex aquifer (Castell de Ferro, Spain). Appl. Geochem. 2004, 19, 1517–1527. [Google Scholar] [CrossRef]
- Grassi, S.; Cortecci, G. Hydrogeology and geochemistry of the multilayered confined aquifer of the Pisa plain (Tuscany—Central Italy). Appl. Geochem. 2005, 20, 41–54. [Google Scholar] [CrossRef]
- Parkhurst, B.D.L.; Appelo, C.A.J. User’s Guide to PHREEQC (VERSION 2)—A Computer Program for Speciation, and Inverse Geochemical Calculations; U.S. Geological Survey Water-Resources Investigations Report; U.S. Department of the Interior: Washington, DC, USA, 1999. [Google Scholar]
- Piper, A.M. A graphic procedure in the geochemical interpretation of water-analyses. Eos Trans. Am. Geophys. Union 1944, 25, 914–928. [Google Scholar] [CrossRef]
- Giménez-Forcada, E. Use of the Hydrochemical Facies Diagram (HFE-D) for the evaluation of salinization by seawater intrusion in the coastal Oropesa Plain: Comparative analysis with the coastal Vinaroz Plain, Spain. HydroResearch 2019, 2, 76–84. [Google Scholar] [CrossRef]
- Lin, L.; Lin, H.; Xu, Y. Characterisation of fracture network and groundwater preferential flow path in the Table Mountain Group (TMG) sandstones, South Africa. Water SA 2014, 40, 263–272. [Google Scholar] [CrossRef]
- Freeze, A.R.; Cherry, J.A. Groundwater, 1st ed.; Prentice Hall: Englewood Cliffs, NJ, USA, 1979. [Google Scholar]
- Cumings, J.N. Biochemical aspects. Proc. R. Soc. Med. 1962, 55, 1023–1024. [Google Scholar] [PubMed]
- Jankowski, J.; Acworth, R.I. Impact of debris-flow deposits on hydrogeochemical processes and the development of dryland salinity in the Yass River catchment, New South Wales, Australia. Hydrogeology 1997, 5, 71–88. [Google Scholar] [CrossRef]
- Xiong, G.; An, Q.; Fu, T.; Chen, G.; Xu, X. Evolution analysis and environmental management of intruded aquifers of the Dagu River Basin of China. Sci. Total. Environ. 2020, 719, 137260. [Google Scholar] [CrossRef]
- Guangnan, A.; Hao, K.; Rongbing, F.; Damao, X.; Jia, L. Investigation on the Hydrogeochemical Characteristics and Controlling Mechanisms of Groundwater in the Coastal Aquifer. Water 2023, 15, 1710. [Google Scholar]
- Thabrez, M.; Parimalarenganayaki, S. Assessment of Hydrogeochemical Characteristics and Seawater Intrusion in Coastal Parts of Mangaluru City, Karnataka, India. Water Air Soil Pollut. 2023, 234, 251. [Google Scholar] [CrossRef]
- Xaza, A. Investigating Hydrogeochemical Processes of Groundwater, Heuningnes Catchment, South Africa. Master’s Thesis, University of the Western Cape, Cape Town, South Africa, 2020, unpublished. [Google Scholar]
- Han, D.M.; Song, X.F.; Currell, M.J.; Yang, J.L.; Xiao, G.Q. Chemical and isotopic constraints on evolution of groundwater salinization in the coastal plain aquifer of Laizhou Bay, China. J. Hydrol. 2014, 508, 12–27. [Google Scholar] [CrossRef]
- El Mountassir, O.; Bahir, M. The Assessment of the Groundwater Quality in the Coastal Aquifers of the Essaouira Basin, Southwestern Morocco, Using Hydrogeochemistry and Isotopic Signatures. Water 2023, 15, 1769. [Google Scholar] [CrossRef]
- Craig, H. Isotopic variations in meteoric waters. Science 1961, 133, 1702–1703. [Google Scholar] [CrossRef] [PubMed]
- Vengosh, A.; Spivack, A.J.; Artzi, Y.; Ayalon, A. Geochemical and boron, strontium, and oxygen isotopic constraints on the origin of the salinity in groundwater from the Mediterranean coast of Israel. Water Resour. Res. 1999, 35, 1877–1894. [Google Scholar] [CrossRef]
- Kim, Y.; Lee, K.-S.; Koh, D.-C.; Lee, D.-H.; Lee, S.-G.; Park, W.-B.; Koh, G.-W.; Woo, N.-C. Hydrogeochemical and isotopic evidence of groundwater salinization in a coastal aquifer: A case study in Jeju volcanic island, Korea. J. Hydrol. 2003, 270, 282–294. [Google Scholar] [CrossRef]


| Group/Lithology | Rock Type | Hydrostratigraphy | Yield (L/s) | Water Quality |
|---|---|---|---|---|
| Alluvials | Sand/silt | High yielding | >5 L/s | Brine |
| Bredasdorp beds | Quaternary deposits | Limited aquifer | 0.1–0.5 L/s | Brackish |
| Bokkeveld | Shales, sandy shales | Low yielding (fractured rock system) | 0–0.1 L/s | Brackish-Saline |
| Table Mountain Group (TMG) | sandstone quartzite, sandstone, conglomerate | High yielding aquifer (highly fractured rock system) | >5 L/s | Fresh |
| Cape Granite Suite | Basement granite | Aquitard/aquiclude | - | Fresh |
| Site Name | TDS | Salinization | |
|---|---|---|---|
| F1 | 380.00 | Fresh water | Upstream |
| F2 | 299.00 | Fresh water | Upstream |
| F3 | 218.00 | Fresh water | Upstream |
| F5 | 265.00 | Fresh water | Upstream |
| BH1 | 19,435.00 | Saline water | Downstream |
| BH2 | 39,520.00 | Saline water | Downstream |
| BH3 | 13,449.00 | Saline water | Downstream |
| BH 4 | 11,096.00 | Saline water | Downstream |
| BH 5 | 14,755.00 | Saline water | Downstream |
| BH 7 | 8346.00 | Brackish water | Downstream |
| BH 8 | 1976.00 | Brackish water | Downstream |
| BH9 | 235.00 | Fresh water | Upstream |
| BH10 | 259.00 | Fresh water | Upstream |
| BH 11 | 463.00 | Fresh water | Upstream |
| BH 13 | 291.00 | Fresh water | Upstream |
| BH 14 | 303.00 | Fresh water | Upstream |
| PZ 2 | 20,150.00 | Saline water | Downstream |
| PZ 8 | 35,165.00 | Saline water | Downstream |
| PZ 14 | 43,030.00 | Saline water | Downstream |
| PZ 16 | 21,450.00 | Saline water | Downstream |
| PZ 26 | 41,795.00 | Saline water | Downstream |
| Sample ID | Seawater Fraction | Ca2+ (Mix) | Ca (React) | Na+ (Mix) | Na (React) | K+ (Mix) | K (React) | Mg2+ (Mix) | Mg (React) | Cl− (Mix) | Cl (React) | SO42− (Mix) | SO4 (React) | HCO3− (Mix) | HCO3 (React) |
|---|---|---|---|---|---|---|---|---|---|---|---|---|---|---|---|
| F1 | 0.00 | 0.15 | 0.05 | 1.92 | 2.69 | 0.13 | −0.08 | 0.41 | 0.49 | 1.95 | 2.30 | 0.15 | 0.20 | 0.62 | −0.32 |
| F2 | 0.00 | 0.00 | 0.20 | 0.01 | 3.90 | 0.00 | 0.05 | 0.00 | 0.82 | 0.01 | 3.72 | 0.00 | 0.29 | 0.00 | 0.59 |
| F3 | 0.00 | 0.00 | 0.05 | 0.00 | 1.61 | 0.00 | 0.03 | 0.00 | 0.33 | 0.00 | 1.68 | 0.00 | 0.15 | 0.93 | −0.73 |
| F5 | 0.00 | 0.00 | 0.10 | 0.00 | 2.09 | 0.00 | 0.05 | 0.00 | 0.41 | 0.00 | 2.70 | 0.00 | 0.02 | 0.00 | 0.30 |
| BH1 | 0.65 | 6.49 | 3.49 | 219.05 | 117.95 | 0.99 | 0.54 | 21.92 | 11.81 | 254.28 | 136.92 | 12.40 | 6.67 | 2.88 | 1.55 |
| BH2 | 1.25 | 43.09 | −8.51 | 758.42 | −149.72 | 2.90 | −0.57 | 52.28 | −10.32 | 932.11 | −184.01 | 56.01 | −11.06 | 6.94 | −1.37 |
| BH3 | 0.43 | 5.81 | 7.66 | 105.44 | 139.16 | 0.59 | 0.79 | 10.29 | 13.57 | 112.13 | 147.97 | 6.79 | 8.95 | 3.11 | 4.10 |
| BH 4 | 0.32 | 4.06 | 8.61 | 67.92 | 144.08 | 0.06 | 0.14 | 7.12 | 15.09 | 62.09 | 131.71 | 3.41 | 7.23 | 0.83 | 1.76 |
| BH 5 | 0.37 | 4.72 | 8.10 | 98.12 | 168.18 | 0.10 | 0.18 | 10.61 | 18.18 | 82.02 | 140.58 | 6.39 | 10.95 | 0.83 | 1.43 |
| BH 7 | 0.22 | 2.03 | 7.00 | 35.44 | 122.16 | 0.05 | 0.18 | 5.18 | 17.86 | 30.72 | 105.88 | 2.07 | 7.15 | 0.47 | 1.60 |
| BH 8 | 0.03 | 0.10 | 3.14 | 0.54 | 16.50 | 0.00 | 0.10 | 0.09 | 2.62 | 0.66 | 20.14 | 0.01 | 0.18 | 0.18 | 5.46 |
| BH9 | 0.00 | 0.00 | 0.45 | 0.00 | 1.83 | 0.00 | 0.05 | 0.00 | 0.58 | 0.00 | 2.30 | 0.00 | 0.23 | 0.00 | 0.98 |
| BH10 | 0.00 | 0.00 | 0.50 | 0.01 | 3.69 | 0.00 | 0.10 | 0.00 | 0.99 | 0.01 | 3.39 | 0.00 | 0.60 | 0.00 | 0.46 |
| BH 11 | 0.01 | 0.00 | 0.25 | 0.03 | 5.27 | 0.00 | 0.03 | 0.01 | 1.06 | 0.03 | 5.59 | 0.00 | 0.60 | 0.00 | 0.36 |
| BH 13 | 0.00 | 0.00 | 0.20 | 0.01 | 3.38 | 0.00 | 0.05 | 0.00 | 0.82 | 0.01 | 3.14 | 0.00 | 0.27 | 0.00 | 0.26 |
| BH 14 | 0.00 | 0.00 | 0.25 | 0.01 | 3.34 | 0.00 | 0.05 | 0.00 | 0.90 | 0.01 | 3.29 | 0.00 | 0.21 | 0.00 | 0.39 |
| PZ 2 | 0.72 | 9.57 | 3.75 | 253.95 | 99.35 | 0.88 | 0.35 | 25.43 | 9.95 | 310.81 | 121.59 | 7.23 | 2.83 | 3.35 | 1.31 |
| PZ 8 | 0.98 | 22.25 | 0.50 | 584.62 | 13.18 | 0.48 | 0.01 | 42.64 | 0.96 | 574.65 | 12.95 | 27.99 | 0.63 | 1.93 | 0.04 |
| PZ 14 | 1.55 | 50.87 | −17.99 | 1093.10 | −386.60 | 0.94 | −0.33 | 72.55 | −25.66 | 1436.58 | −508.08 | 70.89 | −25.07 | 4.77 | −1.69 |
| PZ 16 | 0.81 | 9.61 | 2.32 | 302.17 | 72.83 | 0.86 | 0.21 | 29.83 | 7.19 | 390.41 | 94.09 | 16.36 | 3.94 | 3.83 | 0.92 |
| PZ 26 | 1.19 | 44.65 | −7.13 | 821.36 | −131.16 | 0.15 | −0.02 | 56.79 | −9.07 | 850.39 | −135.79 | 51.06 | −8.15 | 2.89 | −0.46 |
| Calcite | Gypsum | Halite | Dolomite | Aragonite | |
|---|---|---|---|---|---|
| (CaCO3) | (CaSO4·2H2O) | (NaCl) | CaMg(CO3)2 | (CaSO4) | |
| Minimum | −5.08 | −4.93 | −7.18 | −9.27 | −5.22 |
| Maximum | 1.08 | −0.50 | −2.06 | 2.43 | 0.94 |
| Mean | −1.75 | −2.24 | −4.55 | −2.98 | −1.89 |
| Median | −0.89 | −2.43 | −3.63 | −1.29 | −1.03 |
| Std. Dev | 1.97 | 1.35 | 1.96 | 3.85 | 1.97 |
Disclaimer/Publisher’s Note: The statements, opinions and data contained in all publications are solely those of the individual author(s) and contributor(s) and not of MDPI and/or the editor(s). MDPI and/or the editor(s) disclaim responsibility for any injury to people or property resulting from any ideas, methods, instructions or products referred to in the content. |
© 2023 by the authors. Licensee MDPI, Basel, Switzerland. This article is an open access article distributed under the terms and conditions of the Creative Commons Attribution (CC BY) license (https://creativecommons.org/licenses/by/4.0/).
Share and Cite
Xaza, A.; Mapoma, H.W.T.; Abiye, T.A.; Clarke, S.; Kanyerere, T. Investigating Seawater Intrusion in Republic of South Africa’s Heuningnes, Cape Agulhas Using Hydrogeochemistry and Seawater Fraction Techniques. Water 2023, 15, 2141. https://doi.org/10.3390/w15112141
Xaza A, Mapoma HWT, Abiye TA, Clarke S, Kanyerere T. Investigating Seawater Intrusion in Republic of South Africa’s Heuningnes, Cape Agulhas Using Hydrogeochemistry and Seawater Fraction Techniques. Water. 2023; 15(11):2141. https://doi.org/10.3390/w15112141
Chicago/Turabian StyleXaza, Abongile, Harold Wilson Tumwitike Mapoma, Tamiru A. Abiye, Sumaya Clarke, and Thokozani Kanyerere. 2023. "Investigating Seawater Intrusion in Republic of South Africa’s Heuningnes, Cape Agulhas Using Hydrogeochemistry and Seawater Fraction Techniques" Water 15, no. 11: 2141. https://doi.org/10.3390/w15112141
APA StyleXaza, A., Mapoma, H. W. T., Abiye, T. A., Clarke, S., & Kanyerere, T. (2023). Investigating Seawater Intrusion in Republic of South Africa’s Heuningnes, Cape Agulhas Using Hydrogeochemistry and Seawater Fraction Techniques. Water, 15(11), 2141. https://doi.org/10.3390/w15112141