Article

Estimating Changes in Peak Flow and Associated Reductions in Flooding Resulting from Implementing Natural Infrastructure in the Neuse River Basin, North Carolina, USA

1
Department of Biological and Agricultural Engineering, North Carolina State University, 3100 Faucette Dr., Raleigh, NC 27695, USA
2
North Carolina Sea Grant, North Carolina State University, 850 Main Campus Dr., Raleigh, NC 27695, USA
3
College of Design, North Carolina State University, 50 Pullen Rd, Raleigh, NC 27695, USA
*
Author to whom correspondence should be addressed.
Water 2022, 14(9), 1479; https://doi.org/10.3390/w14091479
Submission received: 22 March 2022 / Revised: 19 April 2022 / Accepted: 27 April 2022 / Published: 5 May 2022
(This article belongs to the Special Issue Flood Risk Management and Resilience)

Abstract

:
As the frequency of more intense storms increases and concerns grow regarding the use of dams and levees, the focus has shifted to natural infrastructure (NI) for flood mitigation. NI has shown some success at small scales; however, little work has been carried out at the large watershed scale during extreme events. Three NI measures (afforestation, water farming, and flood control wetlands) were evaluated in the Neuse River Basin of eastern North Carolina. Detailed geospatial opportunity and hydrologic modeling of the measures were conducted in three subwatersheds of the basin and results were extrapolated to other subwatersheds. NI opportunity was greater and associated modeled peak flow reductions were larger for two subwatersheds located in the lower portion of the basin, where there is less development and flatter land slopes. Peak flow reductions varied spatially depending on the type and placement of NI combined with the hydraulic and morphologic characteristics of the stream network. Extrapolation of reductions to other subwatersheds produced a 4.4% reduction in peak flow for the 100 year storm at the outlet of the river basin in Kinston as a result of water farming on 1.1%, wetlands controlling runoff from 5.7%, and afforestation of 8.4% of the river basin.

1. Introduction

Flooding is the most frequent natural disaster, and globally the number of flood events reported has significantly increased in recent decades, costing billions of dollars each year [1]. Freshwater flooding in particular affects more people than any other natural disaster, causing injury, homelessness and the need for assistance with food, water, shelter and sanitation [2]. The frequency and magnitude of riverine flooding and associated damages are expected to substantially increase in the future due to a warming climate [3,4].
Traditionally, flood mitigation has focused on building large impoundments or flood walls/levees on rivers to store and/or contain flood waters [5]; however, more recently, these large structures have become less appealing due to the cost and negative effects on aquatic ecosystems. As the frequency of more intense storms increases, there may be a greater risk of catastrophic failures for these structures that seek to barricade water. More than 1600 dams have been identified as posing a potential risk in the US alone [6]. Hence, the focus of flood mitigation has shifted to a more nature-based system of runoff or flood control measures that are distributed throughout a watershed in an effort to restore catchment processes that were modified by humans [7]. These approaches seek to restore and/or enhance a watershed’s natural ability to retain storm runoff and release it slowly, leading to attenuation of downstream flood peaks, while retaining or enhancing ecosystem services [8,9,10]. When implemented as a series of measures distributed across a landscape or watershed, natural infrastructure (NI) can be designed, approved, and built more rapidly. It should be noted that the NI flood mitigation measures are natural to varying degrees [11]. Human-made additions or modifications to the measures are often required to enhance their flood mitigation effectiveness.
NI flood mitigation can include a wide range of measures that reduce runoff from the landscape such as no-till cropping, cover crops, wetlands, and stream restoration. While these measures can help reduce downstream flooding for many storm events, the amount and intensity of rainfall during extreme events often overwhelm these types of measures, generally rendering them ineffective at flood mitigation [11]. Consequently, NI measures that substantially reduce or retain runoff are best for mitigating flooding from extreme events. Modeling and monitoring efforts have shown that converting open land to forests, afforestation, can reduce runoff volume [12,13] and peak flows [14,15,16,17,18]. Delaying or desynchronizing subcatchment peaks is frequently the driver of peak flow reductions [16,17]. However, these studies cover a range of catchment scales, levels of afforestation implementation and storm sizes evaluated. Cooper et al. [19] concluded that despite some evidence that woodland areas can mitigate flooding, published data to support this conclusion was sparse.
Recently, berms with managed outlets have been constructed around the edge of relatively flat (slope < 1%) fields in Florida to retain rainfall-runoff. This practice, referred to as ‘water farming’, has significantly reduced downstream discharge and nutrient load from agricultural land [20]. Water farming could also be adapted to more steeply sloping land by constructing terraces with earthen berms combined with water storage and control similar to many tile and terrace systems. These types of systems have been shown to reduce runoff on cropland during typical rainfall events [21,22,23]. However, they were not evaluated during extreme events.
Runoff from forested and agricultural land often flows into low-lying naturally wet areas. These areas are characterized by water pooling atop or near the soil surface for much of the year. Typically, these natural wetland areas have some capacity to retain storm runoff and thereby reduce downstream flooding, but this capacity is usually limited. The retention capacity of these areas can be expanded by adding berms and outlet structures to facilitate peak runoff and flow control during larger storm events. The enhancements can be designed to provide flood control during extreme events, while not altering moderate and low flows, thereby maintaining the ecological benefits that wetlands typically provide. Watershed-scale modeling studies have shown substantial flood reduction benefits can be achieved through widespread wetland restoration/creation [24,25,26]. In addition, berms combined with excavation to increase storage can be used to construct wetlands along low-order drainage channels where topography and hydrologic conditions are suitable [27].
While several studies have attempted to quantify the flood-mitigating effects of NI measures on a small scale [28], evidence for the effectiveness at larger, watershed scales is inconclusive, especially for extreme tropical storm events [29]. The goal of this study was to evaluate the extent to which three NI measures (afforestation, water farming, and flood control wetlands) can mitigate flooding in the Neuse River Basin of eastern North Carolina. In addition, temporary detention of runoff on existing low-lying areas was also evaluated in one subwatershed located in the upper river basin due to steeper slopes limiting the opportunity for the three NI measures.

2. Materials and Methods

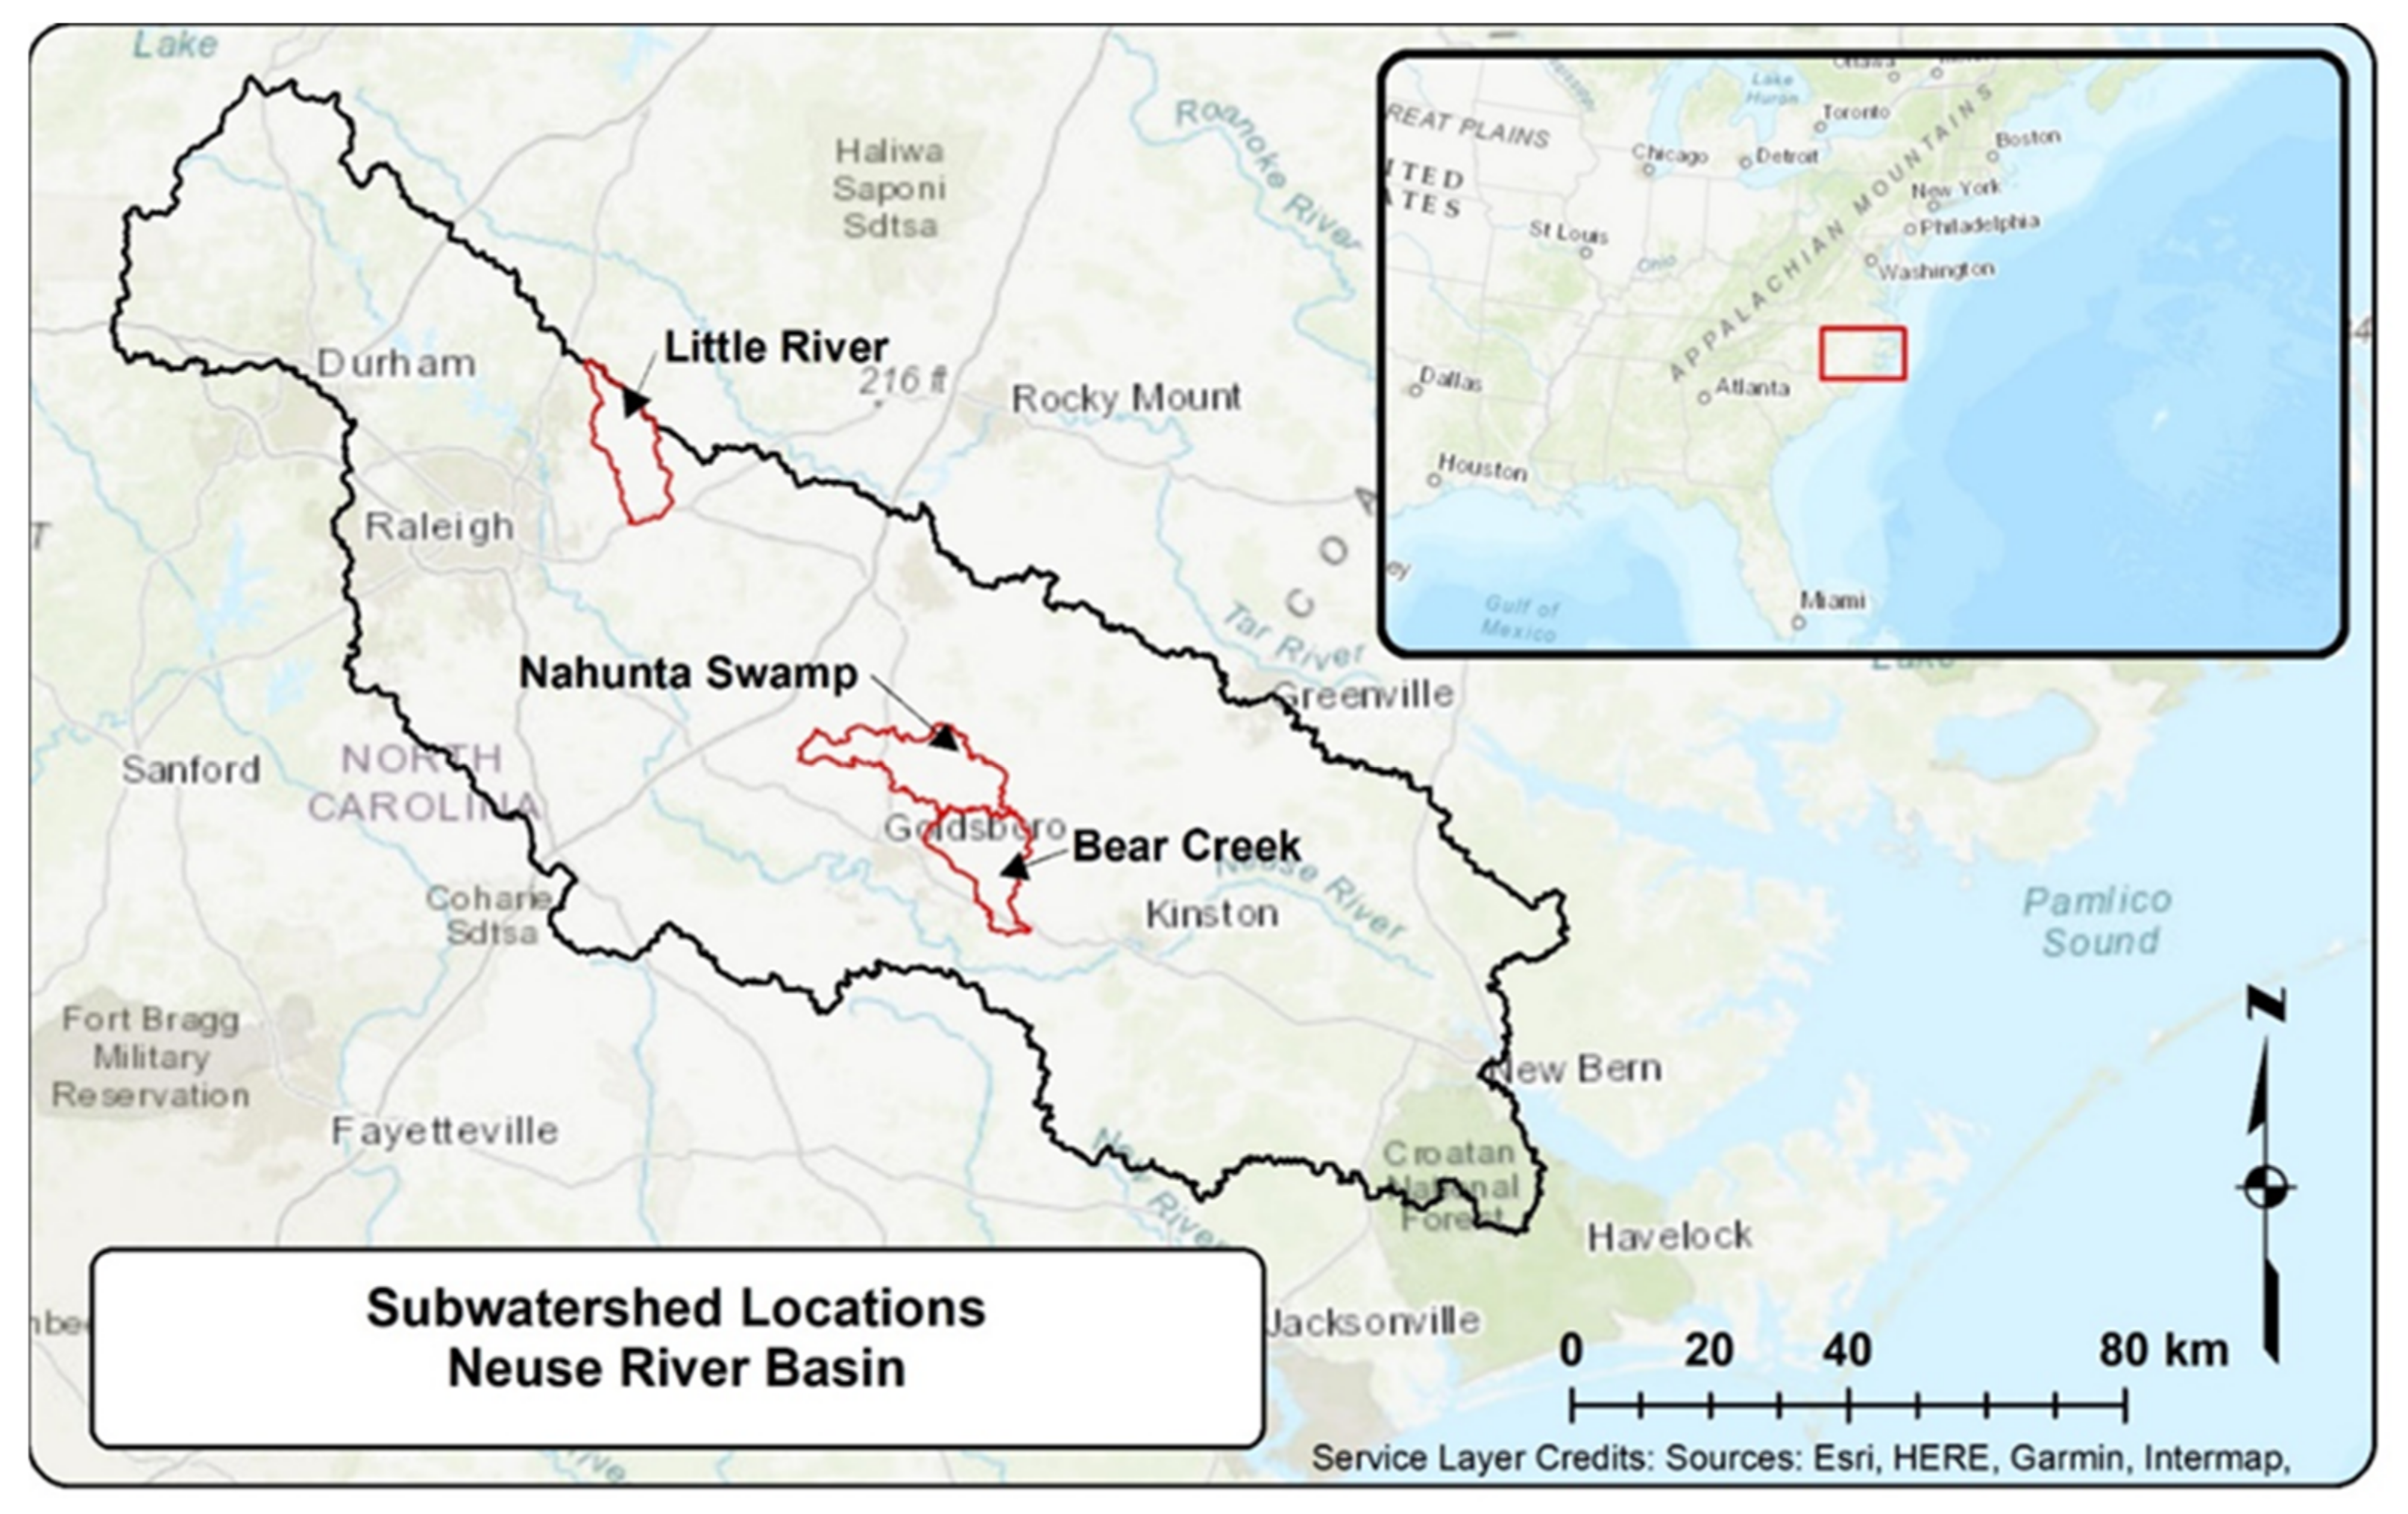
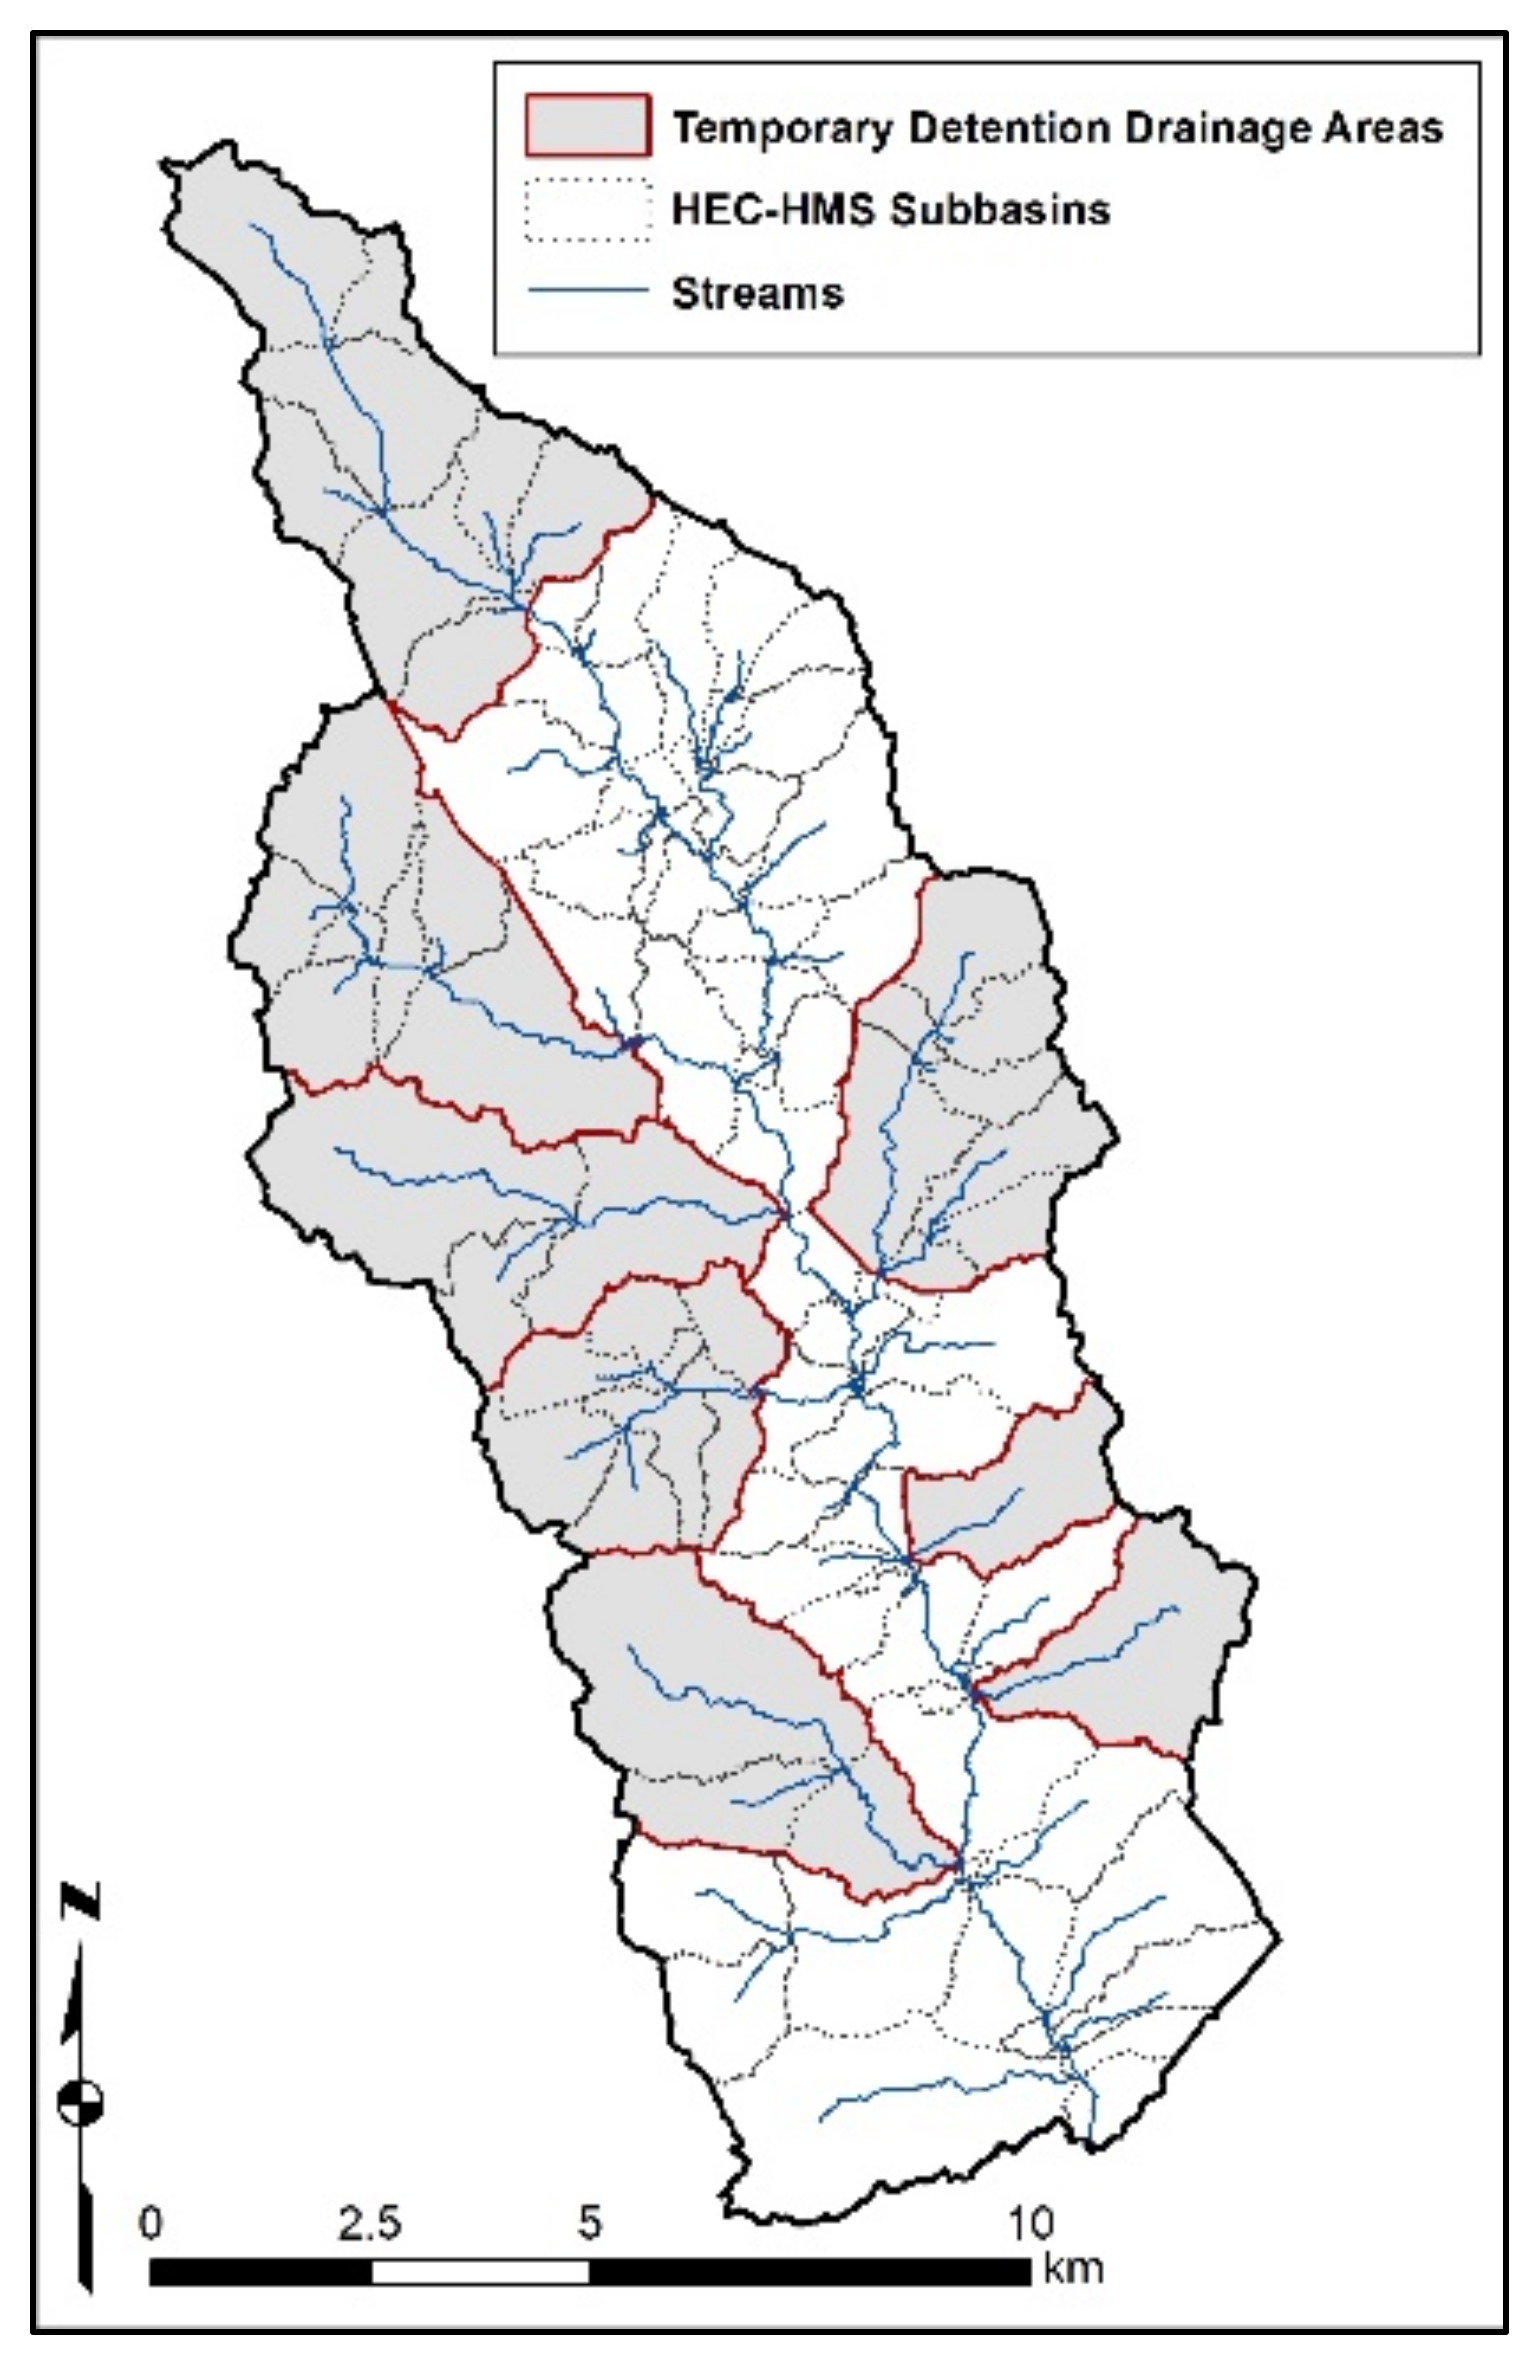
2.1. Setting and Watershed Descriptions

The Neuse River Basin is located in eastern North Carolina beginning in the Piedmont and ending in the Coastal Plain physiographic region (Figure 1). Since 1999, flooding from three major hurricanes has resulted in loss of life and billions of dollars of damage to property along with millions of dollars in emergency response costs [30]. Thus, flood mitigation is a high priority for the entire basin, but especially for the middle and lower thirds, which have experienced the worst flooding.
Because the whole Neuse Basin (701,887 ha to Kinston, NC, USA) was too large for a detailed modeling study, three subwatersheds (i.e., Little River, Nahunta Swamp, and Bear Creek), approximately the size of a HUC-10 catchment, were chosen for detailed analyses and modeling. Results from the detailed subwatershed models were extrapolated to an existing model for the middle Neuse Basin. The Little River watershed is located in the upper or Piedmont physiographic part of the basin while the Nahunta Swamp and Bear Creek watersheds are located in the lower or Coastal Plain physiographic region (Figure 1). The physiography and land use (>50% agriculture and forestry) of the three subwatersheds represent the range of conditions found in much of the middle Neuse Basin. All three subwatersheds have U.S. Geological Survey stream-gauging stations at the outlets.
The Little River watershed encompasses 14,556 ha of land, with an average slope of 4.4%, steeper slopes in upland areas and flatter in swampy riparian areas. The river channel gradient ranges from 0. 03 to 1.8%, with an average slope of 0.17%. Soils are mostly of the Appling association, which are typically gently sloping and well drained with a surface layer of sandy loam soil and subsoil of firm clay loam to clay. Land use in the watershed was cultivated crops and hay (39%) and forest (42%) land; however, the area of developed land (~10% in 2016) is rapidly increasing.
The Nahunta Swamp watershed (19,943 ha) is gently sloping to flat (mean slope of 2.2%) and encompasses many swamp-like areas, where there is often little discernable flow/discharge. The gradient of the Nahunta Swamp channel ranges from 0.02 to 0.39% over its 40 km length, with an average channel slope of 0.079%. Soils are typically acidic and leached with uplands containing moderately to well-drained soils of the Norfolk–Goldsboro–Aycock association, while lowlands typically contain poorly drained soils of the Johnston–Chewacla–Kinston association. Both of these soil associations have a sandy to clay loam subsoil underlain by unconsolidated layers of sand, silt and clay. The soils fall mostly into hydrologic groups A and B. Land use is predominantly agricultural (55%), with some moderate-sized residential areas along the southern boundary of the eastern third of the watershed. Wetlands (20%) and forests (15%) also make up a substantial portion of watershed.
The Bear Creek watershed (15,022 ha) is gently sloping to flat (mean slope of 1.7%) over much of its extent with an average channel slope of 0.086%. Soils are typically acidic, consisting of the Norfolk–Lynchburg association in the northern portion of the watershed, and the Lakeland–Norfolk–Wagram association in the south. Both of these soil associations have a sandy to clay loam subsoil underlain by unconsolidated layers of sand, silt and clay. The channel gradient is relatively uniform and gently sloping throughout its length. Some sections of the stream have been straightened and deepened. Land use in the watershed is predominantly agricultural (57%) and forested (15%), with some residential areas along the western edge of the watershed. Wetlands cover approximately 12% of the watershed. There are eight human-made lakes in the Bear Creek watershed that provide approximately 419 ha-m of flood storage.

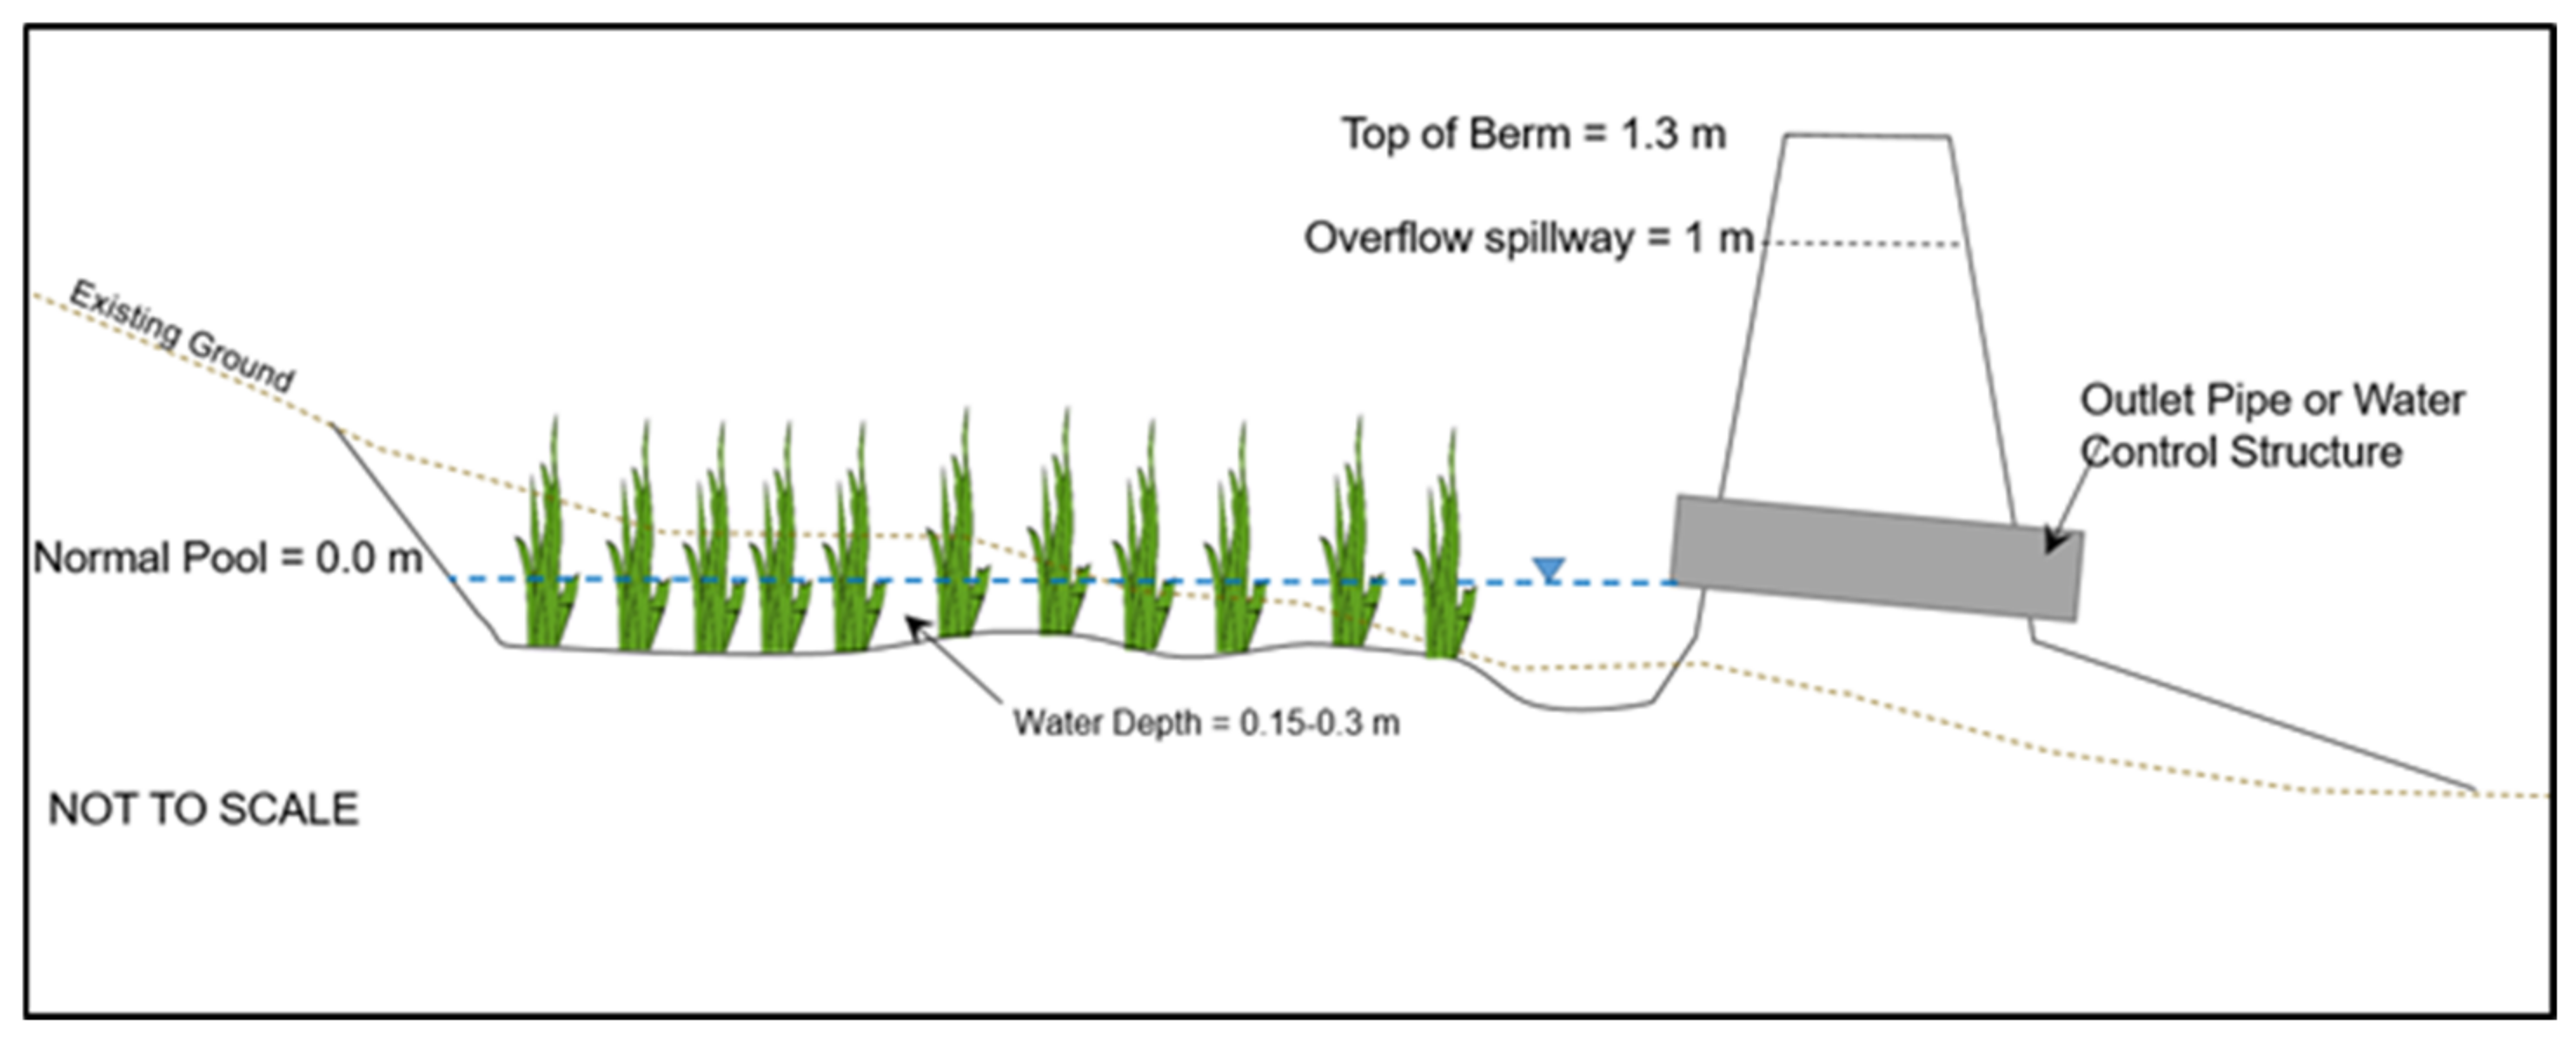
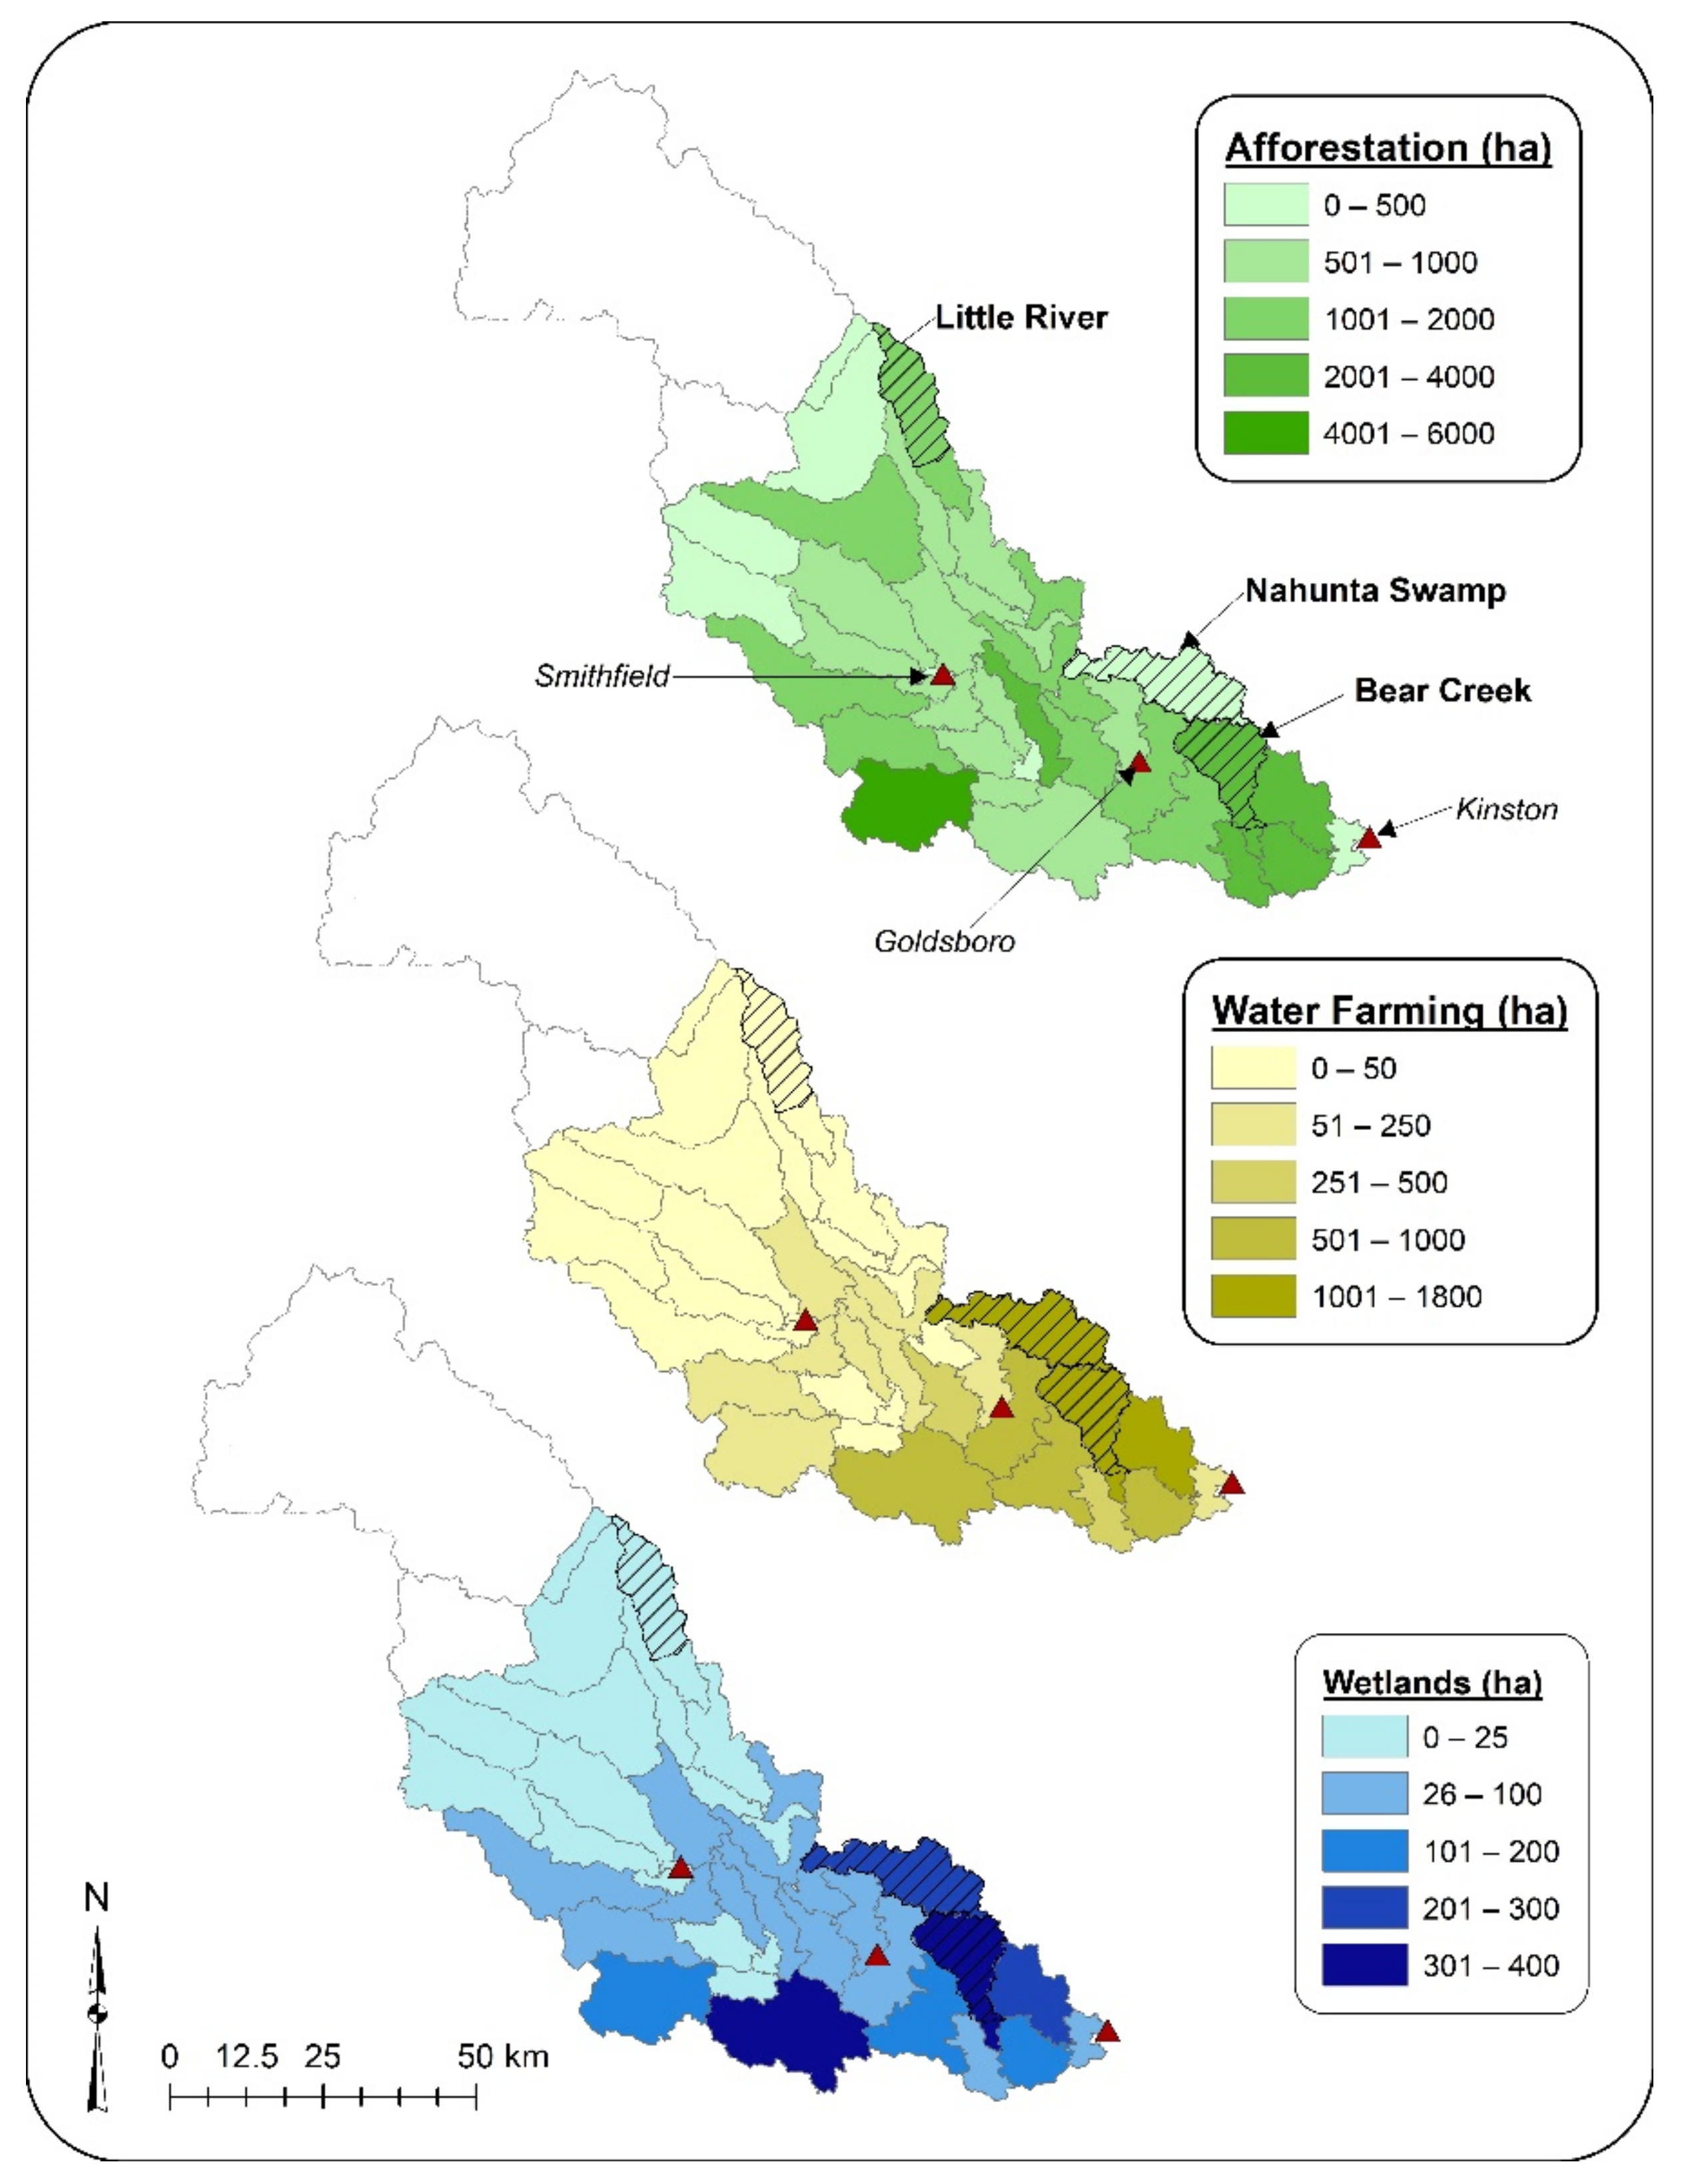
2.2. Locations and Design for Natural Infrastructure

The three focus NI measures could only be implemented where land use, topographic, and hydrologic conditions were suitable. Hence, geospatial data layers for each watershed were analyzed to identify areas suitable for each measure. For afforestation (AFF), the two suitability criteria were low-productivity soils and open lands. The National Commodity Crop Productivity Index (NCCPI), which is an attribute of the Gridded Soil Survey Geographic Database (NRCS, 2020), was used as a proxy for low soil productivity (NCCPI < 0.33 on scale from 0 to 1). The 2016 National Land Cover Dataset (NLCD) was used to determine open land by combining the Shrub/Scrub, Herbaceous, Hay/Pasture, or Cultivated Crops cover classes [31]. The criteria were further refined by removing unsuitable areas including 6 m buffers on all roads, 30 m buffers on all structures, parcels less than 1.6 ha and 30 m buffers on hog waste lagoons.
Geographic information system (GIS) site identification algorithms were further refined to exclude roads and buildings and very small isolated areas on small parcels. For the identification of areas for WET implementation, the approach followed a simplified version of the methodology outlined by Kalcic et al. [27]. The following criteria were used: (1) land cover of Cropland or Hay/Pasture from the 2016 NLCD [31]; (2) located in 1st- or 2nd-order drainage channels defined using a 15 ha threshold for channel formation; and (3) adequate area to provide a wetland area of 10% of the contributing drainage area based on an analysis of peak discharge reduction for the 100 year storm. This ratio provides a peak flow reduction of approximately 70–80% for the 100 year storm and approximately 40% for the 500 year event. Finally, for locations deemed suitable using the above criteria, any with drainage areas smaller than 18.2 ha were eliminated due to economy of scale.
A concept design was developed for all the WETs, which included an excavated area immediately upstream from an earthen berm/dam. The berm included an outlet with corrugated metal pipe(s) or water control structure set at the normal pool elevation (Figure 2). The invert of the outlet pipes was set at 0.15–0.3 m above the wetland soil surface (normal pool) with the pipes sized to dewater the wetland from the overflow elevation to its normal pool in 3 to 4 days. An emergency spillway was included at an elevation 1 m higher than the invert of the pipe(s). The configuration of the proposed WET was generally established to minimize earth moving, while maintaining adequate storage volume. However, a substantial volume of excavation would be required in order to provide adequate storage to reduce the peak discharge during extreme events (e.g., 100 year).
Criteria for water farming (WF) locations included the NLCD’s Cultivated Crops, Hay/Pasture, and Herbaceous classes. Areas that already experience flooding during extreme (within the 500 year floodplain) events were not considered suitable. Further, to maximize cost-effectiveness, WF was limited to cropland of at least 8 contiguous hectares and where the height of the berm/terrace could be <1.8 m and still be constructed along the edge of the crop field. Steeper slopes that would require a series of berms located within the interior of the property were not considered as this would remove larger portion of land from crop production.
In the more steeply sloping land of the Little River watershed, WF and WET opportunities were severely limited; therefore, enhancing naturally wet and/or wetland areas with berms and outlets to create temporary detention (TD) was modeled to estimate its effectiveness at reducing peak discharges. The TD measure involved building a dam/berm across a natural drainage channel to temporarily impound water upstream during high discharge while not significantly affecting moderate to low discharge; thus, there is no permanent storage. TD was selected as an alternative to traditional reservoir impoundments, as it preserves the ecological function and services of the existing upstream wetlands and riparian buffers.
Potential TD sites in the Little River subwatershed were identified by assessing the topography along streams to identify feasible locations combined with where the site was not inundated by backwater from downstream during the 100 year storm.

2.3. Model Development

The Hydrologic Modeling System (HEC-HMS version 4.3) [32] was used to simulate peak flows/discharges associated with the potential flood mitigation scenarios. HEC-geoHMS [33] (version 10.5) ArcMAP extension program was used to delineate the watersheds and stream networks and calculate model parameters (e.g., curve number, slopes, and lag times). The watershed delineations and slope calculations were based on 10 m digital elevation models derived from LiDAR [34]. The 2016 National Land Cover Dataset [31] and the SSURGO soils database [35] were used to calculate curve numbers
The SCS Curve Number (SCS-CN) unit hydrograph transformation was used to generate runoff hydrographs for the subbasins in HEC-HMS. The SCS-CN method was also used for precipitation losses. The recession method was applied for baseflow and the Muskingum–Cunge method was used for channel routing [36].
Hurricane Matthew hourly rainfall totals were obtained from the NC State Climate Office (NC SCO) radar precipitation estimates, which were calibrated to nearby rain gages for Little River and Nahunta Swamp. For the Bear Creek model calibration, Hurricane Floyd rainfall was obtained from the NC SCO station in Clinton, NC. For the 25, 50, 100, and 500 year design storms, total rainfall accumulation data were obtained from the U.S. National Oceanic and Atmospheric Administration’s Atlas 14 website using the midpoint of the watershed for the location of the point estimate (Table 1). The same total was used for every HEC-HMS subbasin in the model, thereby assuming a uniform spatial distribution. The SCS type II storm rainfall distribution was used for each watershed and each storm to maintain consistency and because most of the Neuse River Basin is located in the type II region.

Model Calibration

The HEC-HMS model was calibrated for each watershed by ‘adjusting’ input parameters such as curve number (CN), lag time (LT), peak rate factor (PRF), and channel roughness (n) in a systematic way so that peak and total discharge for the storm closely matched monitored/observed discharge for either hurricane Matthew (Nahunta and Little River) or Floyd (Bear Creek). The fit between the model output and the flow recorded at the USGS gauging station at watershed outlets was assessed using the Nash-Sutcliffe model efficiency coefficient (NSE).

2.4. Model Evaluation of NI Measures

HEC-HMS does not have specific routines for modeling water farming, wetlands, or afforestation. Therefore, existing model components were used to simulate the conditions and functions of NI. While these approaches do not include all the components that occur in NI practices over the longer term (e.g., evapotranspiration and infiltration), simulation of a single, large event was deemed appropriate as these other processes would be negligible compared to dominant rainfall and runoff components of the water budget during an extreme rainfall event.

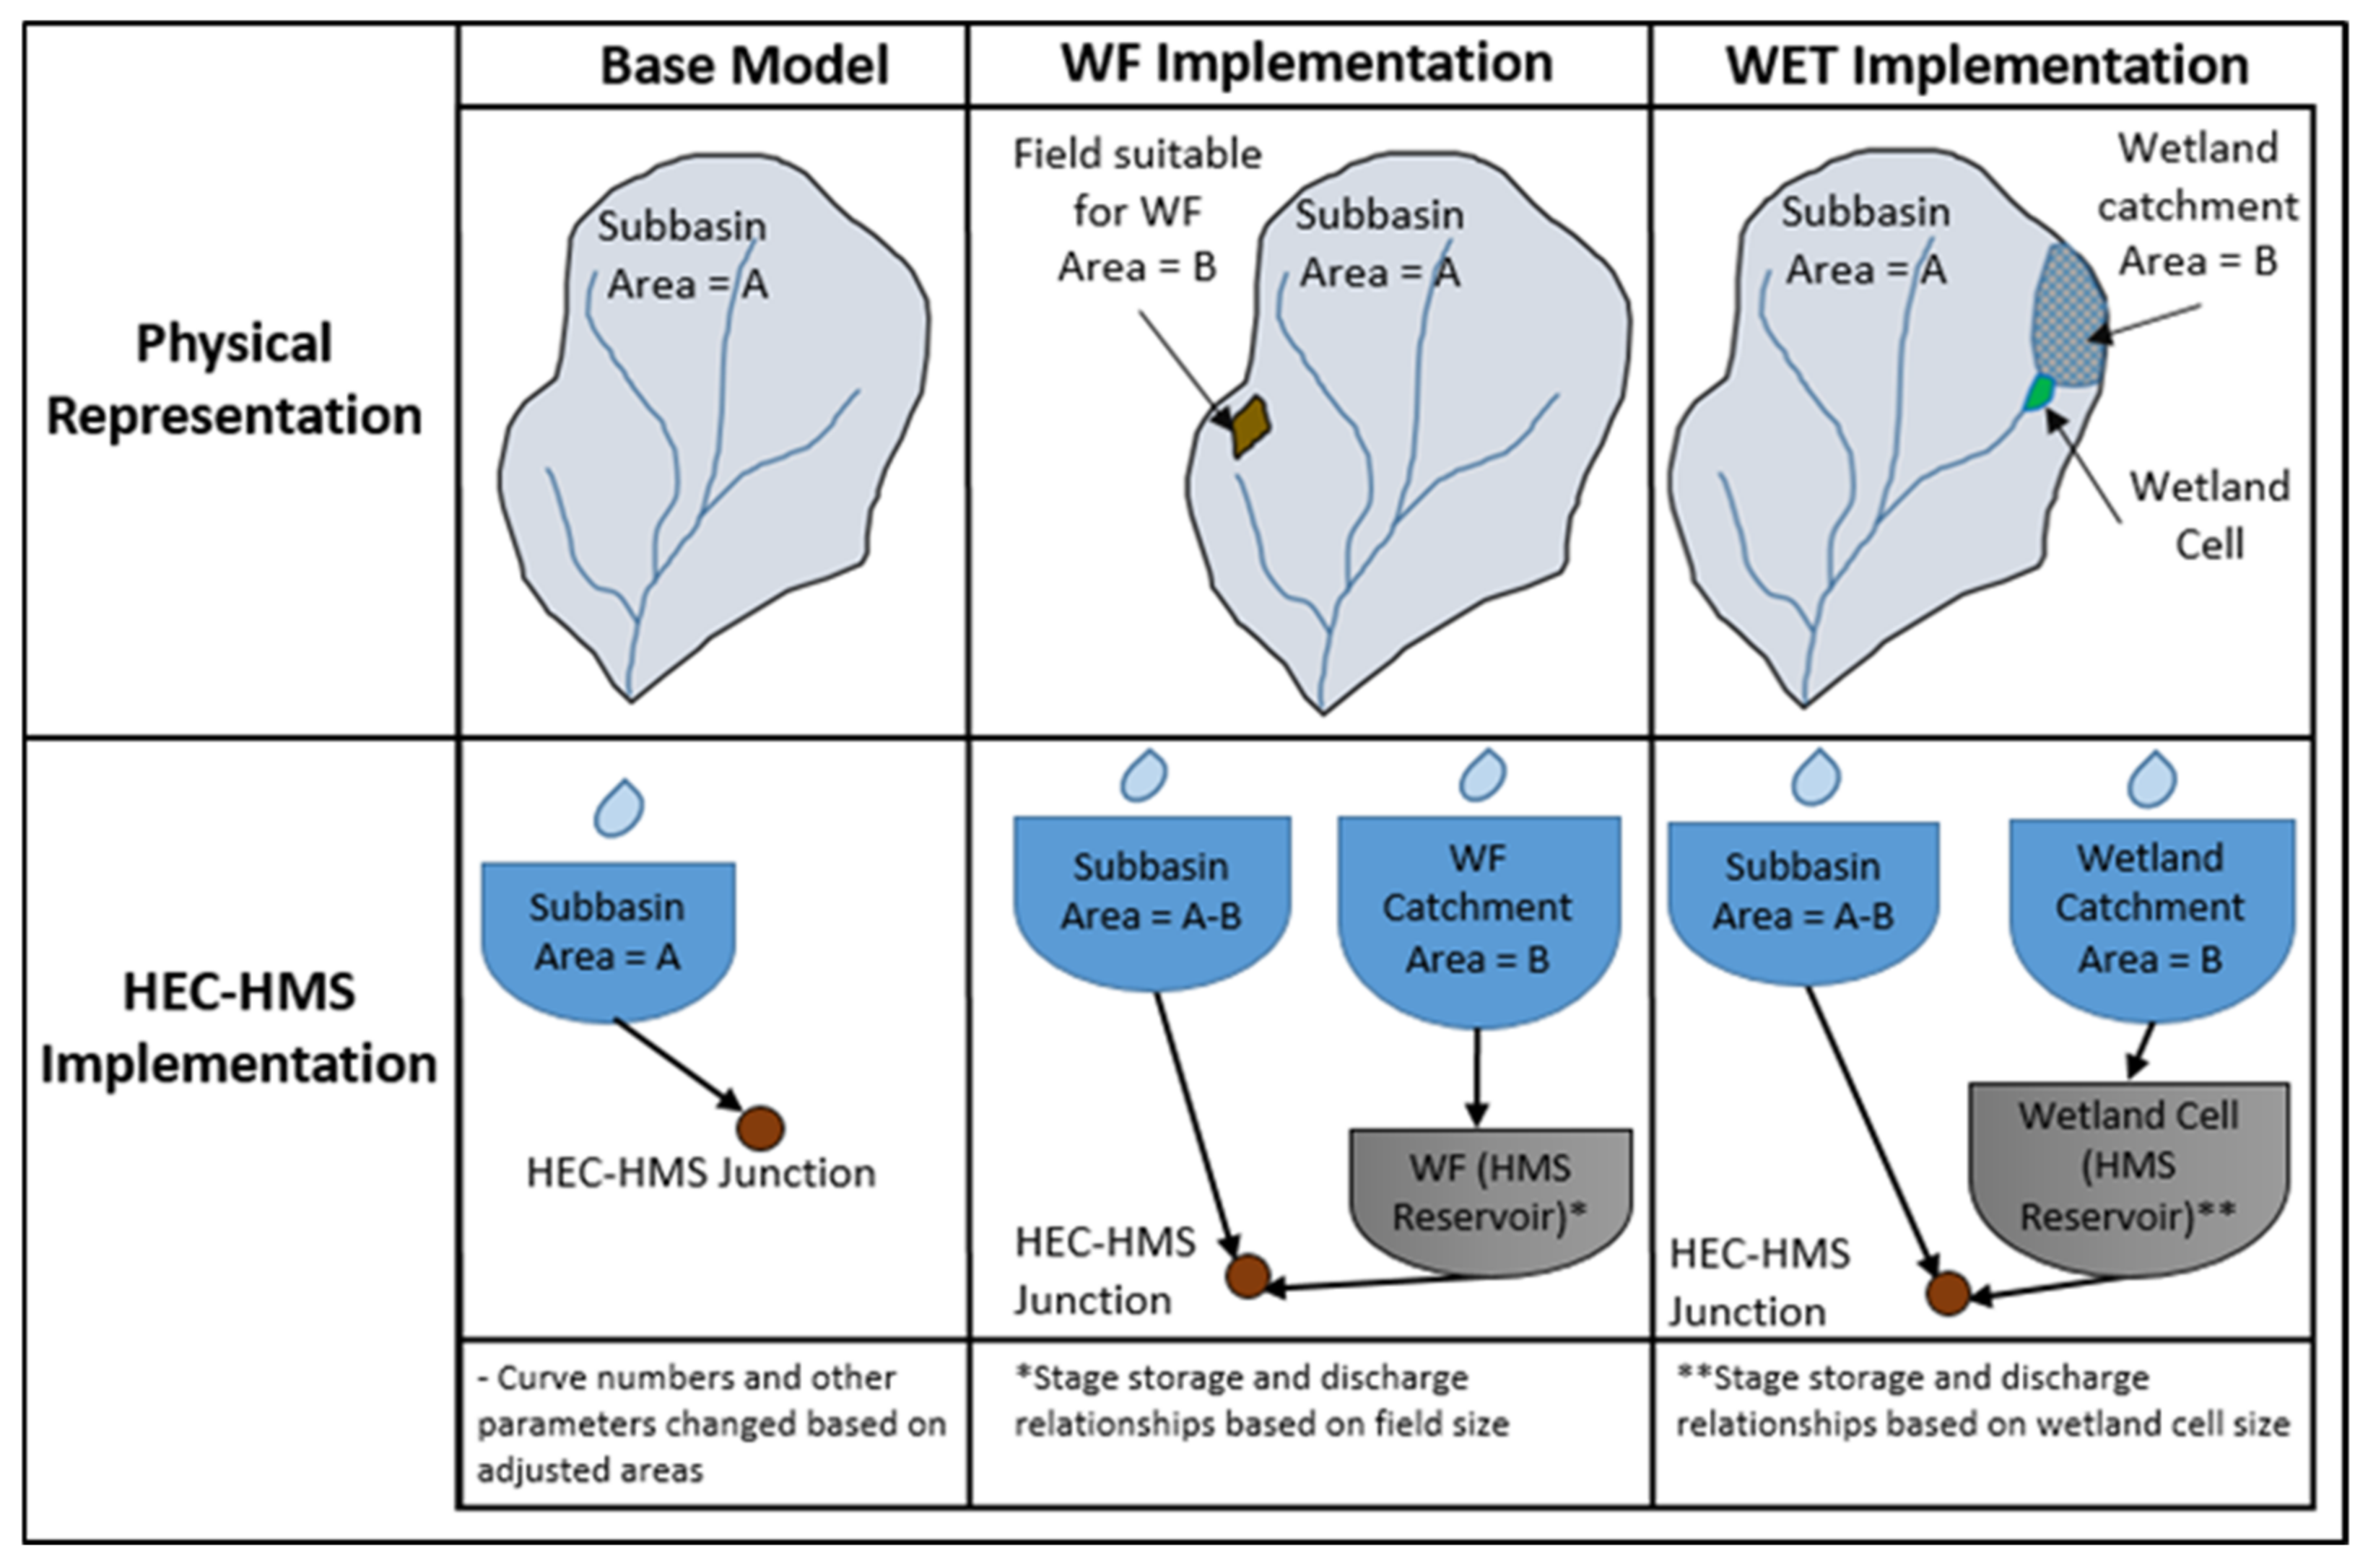
2.4.1. Implementing NI in HEC-HMS

Small reservoirs were inserted in the HEC-HMS model at the outlets of subbasins containing suitable locations for WF(s) to simulate the ponding area upslope from the terrace/berm. A rectangular overflow weir with the weir crest set 0.6 to 1.2 m above the lowest elevation of the field was added to the outlet of the reservoir. This configuration resulted in approximately 304 ha-mm per ha of extended storage capacity. For ease of data entry, all of the cropland fields suitable for WF in an HEC-HMS subbasin were modeled as one field with one reservoir. For the subbasins with a suitable field(s), a new subbasin (field subbasin) was created by copying the original HEC-HMS subbasin and changing the area to the area of the cropland field. The area of the original subbasin was then decreased by the area of the ‘field subbasin’ so there was no net increase in subbasin area. New CNs were then computed for the two subbasins and input into the HEC-HMS model. A ‘reservoir’ was input at the outlet of the ‘field subbasin’ to retain and slowly release runoff from the WF cropland area (see Figure 3).
Modeling AFF in HEC-HMS involved changing the CNs for the suitable areas to correspond to “mixed forest” land cover and recalculating the area-weighted CN for subbasins in which open land was converted to forest.
Modeling WETs in HEC-HMS involved adding small reservoirs with outlet structures to retain and release runoff from the wetland catchments. Like WF, the HEC-HMS subbasin was copied to create a new subbasin (WET) with the drainage area of the new subbasin being the area draining to the WET. The area of the original subbasin was then decreased by the ‘WET subbasin’ area and a new CN was computed. A reservoir was input at the outlet of the ‘WET subbasin’ to retain and release the runoff from the corresponding drainage area (see Figure 3).
Implementing WF, WET, and AFF combined in Nahunta Swamp and Bear Creek required some prioritization in cases of overlapping suitability. When both WF and WET were suitable for a field/area, the WF was preferred due to its greater cost-effectiveness. Although rare, whenever AFF and WF suitability overlapped for a field/area the WF was preferred in order to retain crop production while adding water storage capacity.
To model the eight TDs in the Little River watershed, storage–discharge relationships were determined for each location and input into the HEC-HMS model as a reservoir/detention pond. A new ‘detention subbasin’ with the same inputs as the original subbasin except for the area was changed to the area draining to the detention pond. The area of the original subbasin was then reduced by the same amount.

2.4.2. Spatial Location Effects on Peak Flow Reduction

Peak flows for the 100 year storm obtained from hydrologic modeling for existing condition and with NI practices were compared at catchments located throughout the Bear Creek watershed. The percent reduction in peak flow was determined and evaluated relative to the percent of NI practices implemented within each specific catchment. The water surface elevations for both the existing condition and with NI practices were also compared to determine the reduction in water surface elevation at the outlet of each catchment. Results were graphically displayed using GIS. To further evaluate how landscape position of the NI measures affect peak flow reductions, the location of the WETs in the Bear Creek HEC-HMS model was varied. Specifically, only 50% of the WETs were modeled using three scenarios: (1) spatially distributed through the watershed, (2) upper half of the watershed only and (3) lower half of the watershed only. The peak flow reductions from the three scenarios were compared to full implementation of all WETs.

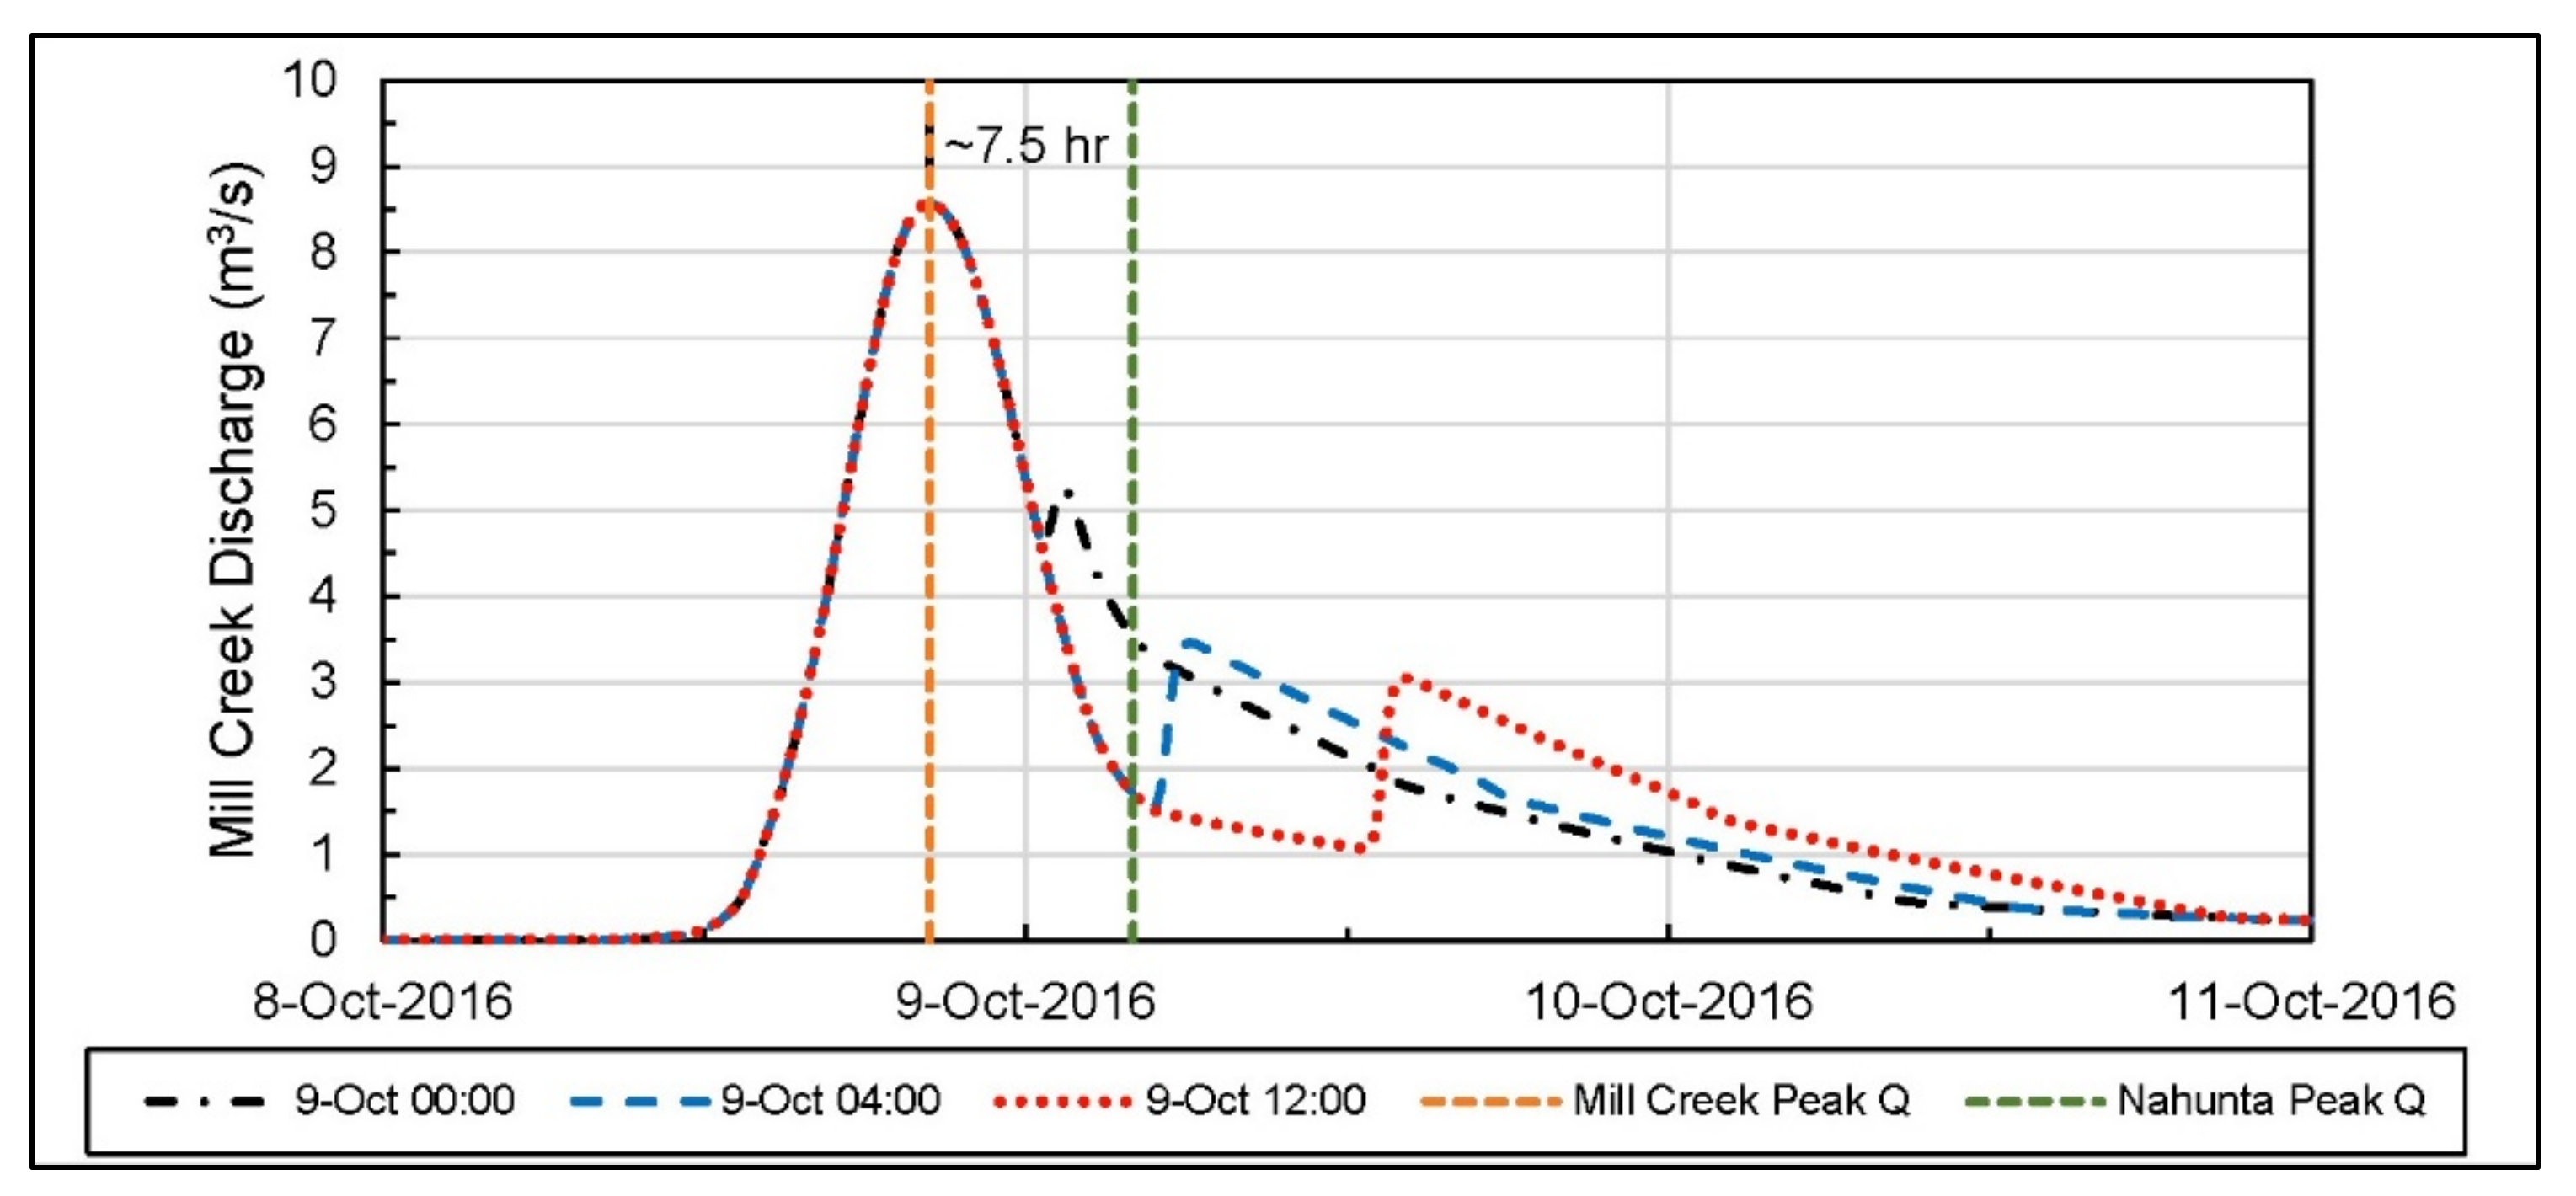
2.4.3. Timing of Runoff Release

For WF and, to a lesser extent, other NI measures, releasing retained runoff as soon as possible after an extreme event to facilitate field operations is an important issue. So, the effect of the timing of release from WF measures in Nahunta Swamp was investigated using the HEC-HMS model. Releasing retained runoff from WF measures was simulated by a low flow orifice or pipe outlet and a managed gate that could be opened at any time. To determine how long runoff would need to be stored on fields for WF to achieve maximum peak flow reductions, the timing of release from WF sites in four subbasins of Nahunta Swamp (hatched areas on Figure 4) was evaluated. Both unmanaged pipe outlets and managed gated/weir outlets were modeled. Release discharge rates were based on pipe and weir flow hydraulics. The four subbasins were chosen because they were at the extreme ends of Nahunta Swamp; thus, they should represent all of the other subbasins where WF was implemented. A discharge time series was estimated by assuming the crest of a rectangular outlet weir was dropped to ground level at the time of release for maximum outflow. This series was entered into HEC-HMS for each WF reservoir. The timing of the start of the release was varied to determine the earliest release time that did not increase the peak discharge at the Nahunta Swamp outlet.

2.4.4. Changes in Water Surface Elevation

To assess changes in stream or flood stage, a hydraulic model, the River Analysis System (HEC-RAS) [36], was used. Existing HEC-RAS models developed for the purpose of floodplain mapping were obtained for each study subwatershed stream and for the Neuse River from the North Carolina Floodplain Mapping Program [37]. The peak discharge computed for each NI scenario was entered into the HEC-RAS model for that stream to estimate flood stage. Water surface elevation changes were evaluated within the three subwatersheds and at three communities located along the Neuse River.

2.4.5. Extrapolation of Peak Flow Reductions

The same methods of identifying appropriate sites for AFF, WF, and WET as was used in the subwatersheds were applied to the larger middle Neuse Basin. A recently developed HEC-HMS model of the middle Neuse River Basin [38] was then used for modeling peak flows for the existing condition and proposed NI strategies. To simulate AFF in the model, new composite curve numbers were calculated using HEC-geoHMS after changing the land use/cover for the areas identified for AFF from agriculture to ‘mixed forest’ land cover, which assumes a mature forest.
Because modeling individual WF and WET sites in HEC-HMS across the entire Neuse Basin would be too time-consuming, peak discharge reductions were determined by modeling various levels of NI implementation (WET and WF) for Nahunta Swamp and Bear Creek watersheds. The scenarios included:
  • WF: 100%, 50% and 25% implementation;
  • WET: 100%, 50% and 25% implementation;
  • WF+WET: 100%, 50% and 25% implementation.
The reduction in NI implementation (i.e., 50% and 25%) for the scenarios was equally distributed throughout Nahunta Swamp and Bear Creek. Regression relationships of peak flow reduction relative to the percent of the subwatershed affected by NI implementation were developed to facilitate extrapolation to other subbasins in the middle Neuse River Basin.
First, the refined geospatial analysis procedures were used to identify afforestation, water farming, and wetland potential across the middle Neuse Basin study area. The regression relationships were then used to estimate a peak discharge reduction for each subwatershed within the Neuse Basin based on the WF and WET potential identified for each specific subwatershed. To simulate reductions in discharge that would occur prior to and following the peak discharge, the HEC-HMS time series of discharges for the existing condition were exported and discharges within 12 h before and after the peak were reduced by the corresponding percent reduction in peak discharge. The reduction was then diminished at a constant rate until there was no reduction in discharges from 60 h after the peak to the end of the simulation. Discharges were also shifted by 15 min to simulate a delay in the peak resulting from the WF and WET measures. The 15 min delay was selected based on the delay in the peak discharge that occurred near the midpoint of Nahunta Swamp for the WF+WET scenario for Hurricane Matthew.
The reduced discharges were applied to all subwatersheds with an NI implementation of >1% of the total subwatershed area, implementation of <1% was considered to have a negligible impact on peak discharge. The time series of discharges for each storm modeled were then entered into the HEC-HMS model of the Neuse Basin as an input gage in place of the corresponding subwatershed. The same rainfall input used during the calibration runs was applied so that the subbasins with no WF or WET (n = 16) would produce the same existing condition discharges as during calibration. For the combination of all three NI measures (WF+WET+AFF), the time series of discharges from the AFF scenario were decreased by the reductions computed for the WF+WET scenario using the same procedure as described above.

3. Results

3.1. NI Opportunities Identified

The total area identified for AFF ranged from 1.8% to 10.6% for the three study watersheds (Table 2). The number and cumulative area of the WETs identified for the three subwatersheds as well as their drainage areas are shown in Table 2. For Nahunta Swamp and Bear Creek, 53 and 43 sites distributed throughout the watersheds were identified as suitable for WF. In contrast, no sites were identified for Little River due to steepness of the land slope (Table 2).
While there were many potential sites identified for TD in the Little River Watershed, only the locations on major tributaries with relatively large drainage areas and relatively close to the River were considered in order to simplify the modeling process. These locations were mostly in low-lying wet areas, where TD could be used to enhance the storage capacity of existing wetlands and floodplains while avoiding effects to cropland, structures, and roads. In addition, excavation of the detention area to increase storage volume was not considered even though some excavation would be required to obtain soil material for the dam/berm. Eight potential TD locations were identified in the Little River watershed (Figure 5). Cumulative detention pond areas and drainage areas for the watershed are provided in Table 2.
Opportunities identified for AFF, WET and WF potential were heavily concentrated in the lower part of the middle Neuse River basin, where there is more agricultural land cover (Figure 6). The total area and percentage of the basin for each NI measure are provided Table 3.

3.2. Model Calibrations

Overall, model fit produced excellent agreement with the observed discharge hydrograph, with NSE > 0.96 and differences in peak discharge of <1% for all three models (Figure 7). The two greatest adjustments from the HEC-geoHMS input file were that the Manning’s roughness coefficients for main channel reaches and tributaries had to be increased considerably from 0.035; the lag times for each subbasin were also changed substantially.

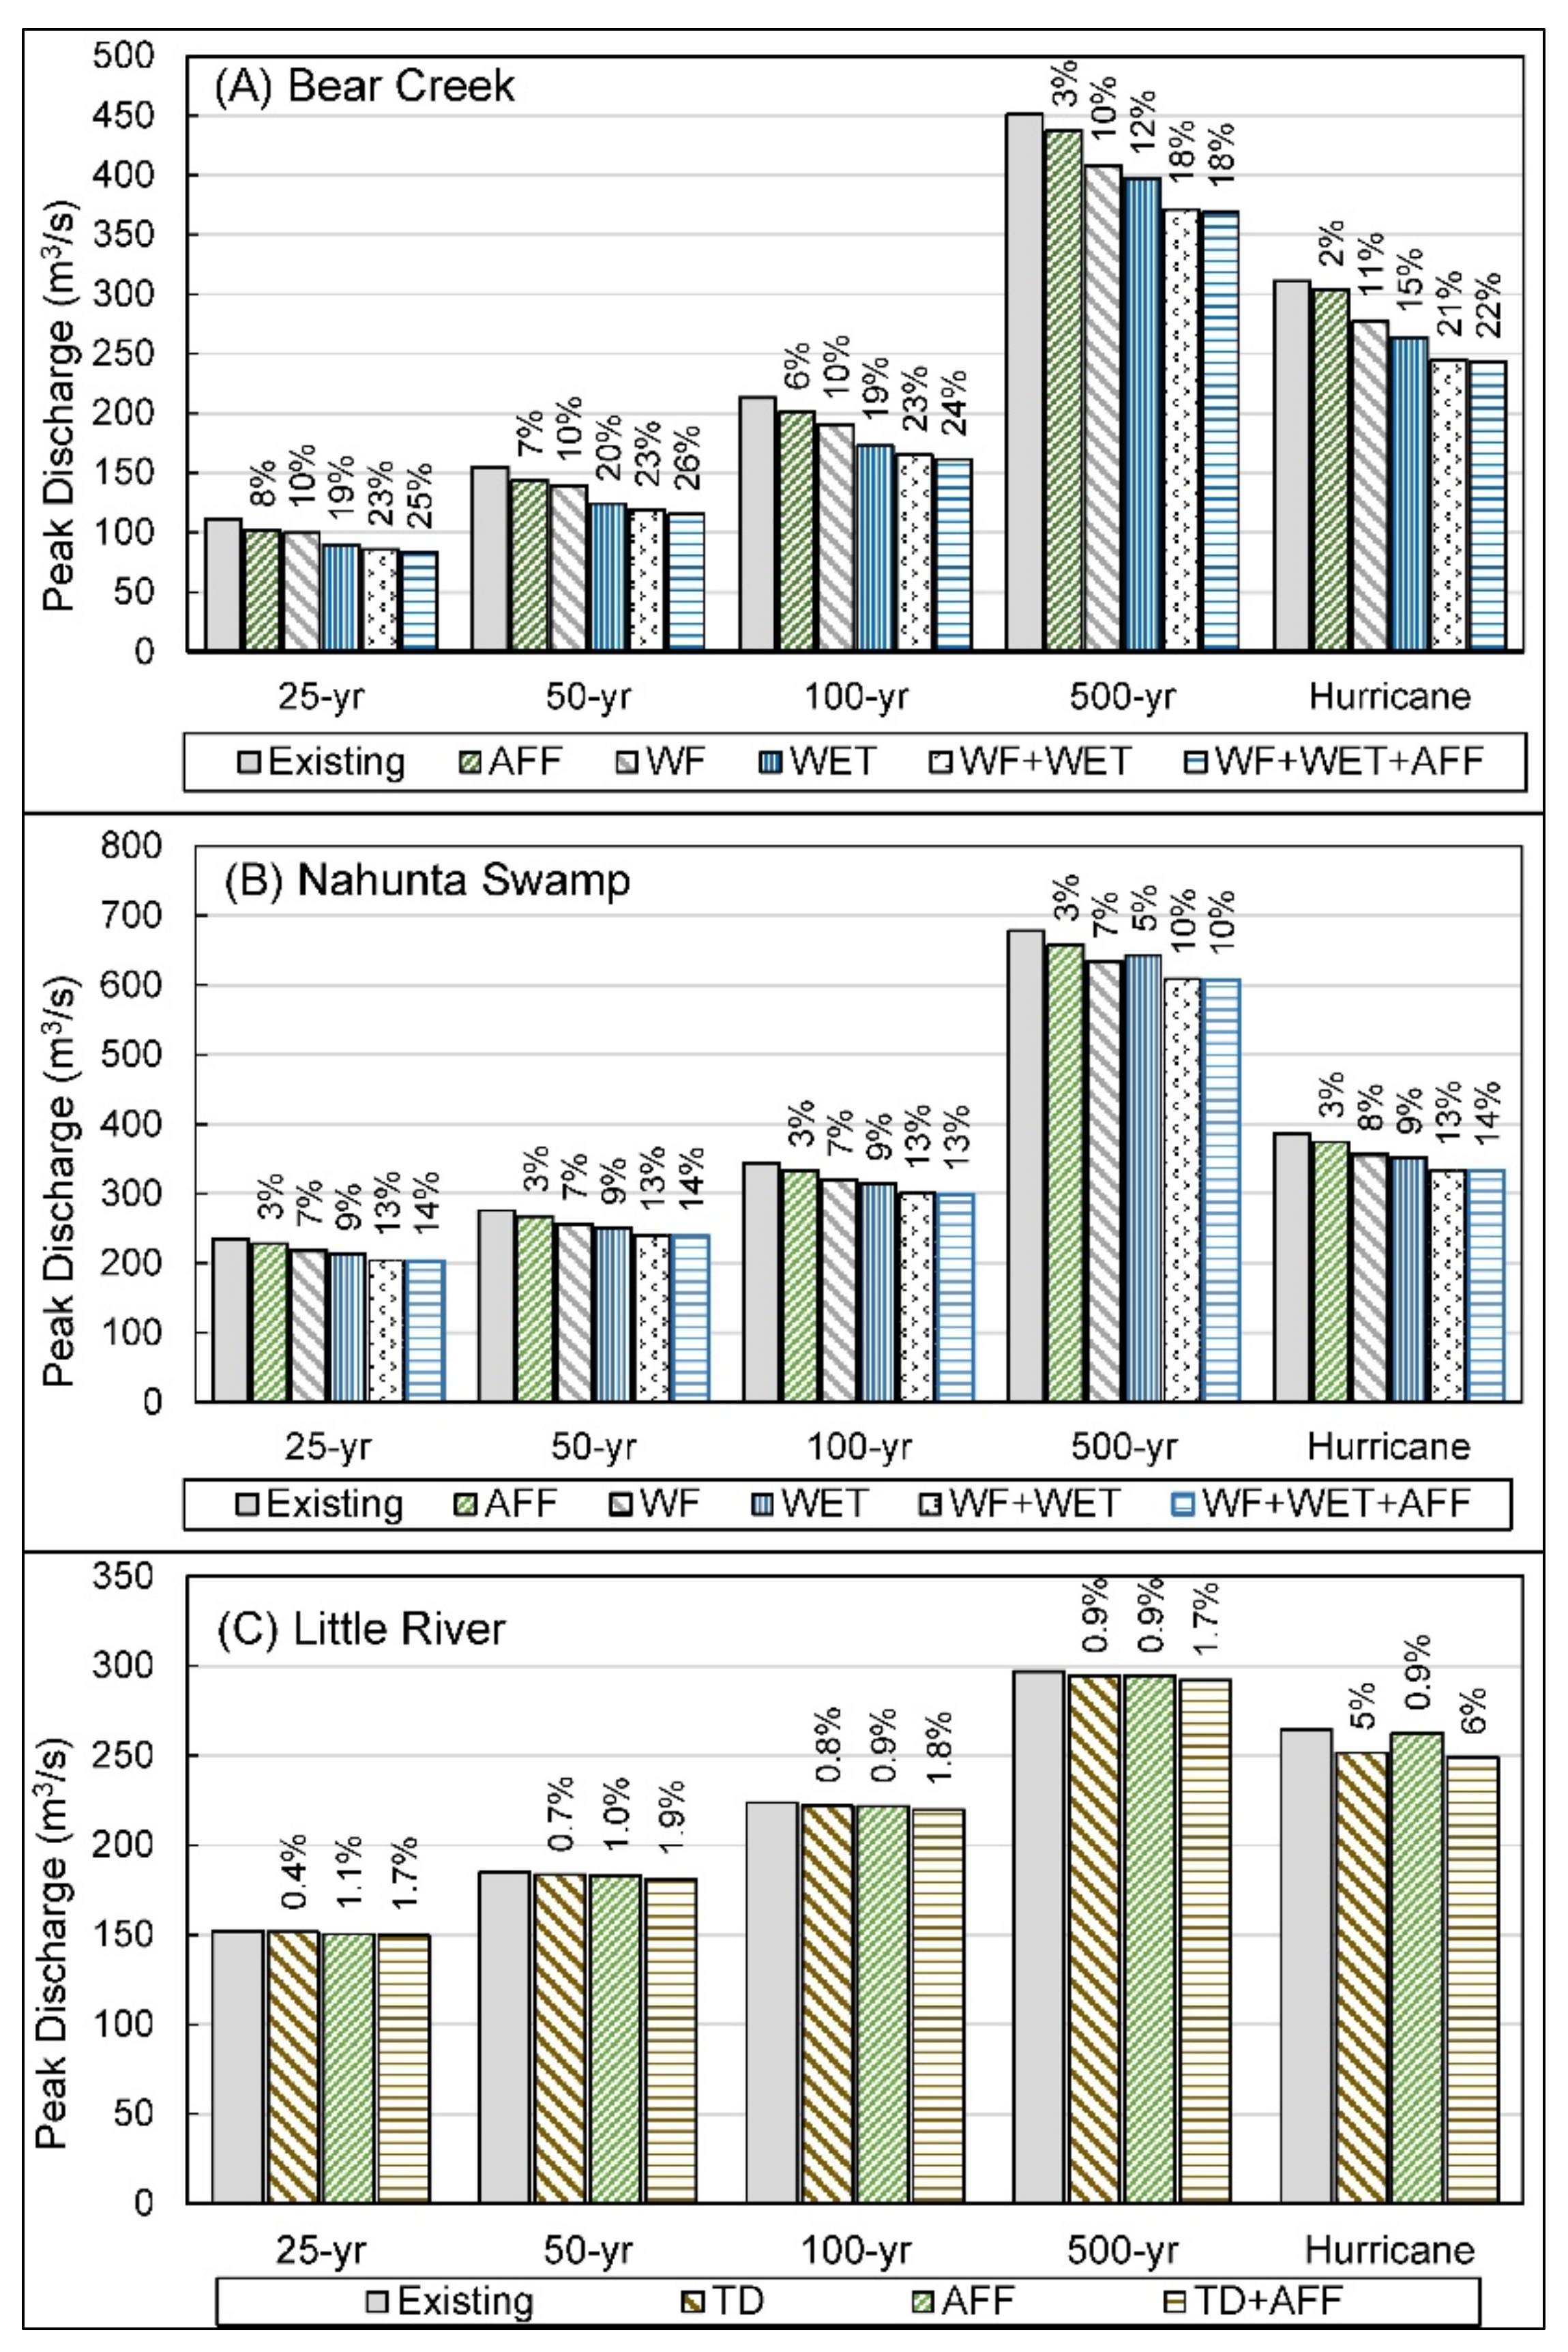
3.3. Peak Flow Reductions

HEC-HMS predicted peak discharges and the percent decrease from the existing condition as a result of implementing the various NI measures within each of the three study subwatersheds are presented in Figure 8. Peak flow reduction estimates include four design storms and one hurricane (Hurricane Matthew for Nahunta and Little River and Hurricane Floyd for Bear Creek). For AFF, the peak discharge reduction for each of the 5 storms was approximately 3% for Nahunta Swamp. For Bear Creek, the reduction for AFF ranged from 3.1% for the 500 year event to 8.5% for the 25 year event. This range was greater than for the Nahunta Swamp watershed due to more land identified as low productivity cropland (10.6% vs. 1.8%) making it suitable for AFF. In general, the peak flow reductions in Little River due to AFF were small (~1%) despite the relatively large area of AFF implementation (6% of the overall watershed). The reduction was greatest for the SCS type II 25 year storm (1.1%), which was expected as this storm had the least rainfall accumulation. However, peak discharge dropped little for the larger storms.
The WF measures in Nahunta Swamp implemented at 53 sites to control runoff from 5.1% of the watershed reduced the peak discharge by 6.6 to 7.7% (Figure 8), with the largest reduction occurring for Hurricane Matthew. Similarly, the implementation of WF on 43 sites in Bear Creek to control runoff from 5.6% of the watershed reduced peak flow from 9.5 to 10.9%, with the greatest reduction occurring for Hurricane Floyd.
HEC-HMS predicted peak discharge reductions resulting from the implementation of 64 WET measures in Nahunta Swamp ranging from 5.2 to 9.3%, with the reduction for Hurricane Matthew being 8.9% (Figure 8). The implementation of 66 WETs in Bear Creek controlling runoff from just over 3238 ha reduced peak flows from 12.1% to 20.0% for all storms, with the greatest reduction occurring for the 50 year design storm. The smallest reduction occurred for the 500 year storm in both watersheds (12.1% Bear Creek and 5.2% for Nahunta Swamp). This was due to the normal storage capacity of many of the WETs being exceeded for the 500 year storm event resulting in uncontrolled discharge over the emergency spillways of the WETs. Compared to WF, the WETs were more effective at peak discharge reduction for every storm except the 500 year storm in Nahunta Swamp. Like WF, the peak discharge in Nahunta Swamp for Matthew was reduced by more than for the 100 year (8.9% compared to 8.6%) even though the total rainfall accumulation was greater than the 100 year storm. However, this was not the case for the WETs in Bear Creek.
For the WF and WET combined scenario (WF+WET) in Nahunta Swamp, the peak discharge reductions ranged from 10.1% to 13.4% (Figure 8), which was considerably less than the sum of the reductions for WF and WET. This was partially due to 22 of the 64 WETs being deleted in favor of WF when they both were suitable for the same land; therefore, WF+WET treated 12.6% of the watershed, which was only slightly more than the 12.2% of the watershed treated by the WET measure alone. WETs were deleted in favor of WFs because if runoff is retained on the field, the downstream WET is not needed. Trends in peak discharge reductions for different storms were similar to those for WF, with the greatest reduction (13.4%) occurring for Matthew.
For Bear Creek, the WET and WF combination produced peak flow reductions ranging from 17.7% to 23.4% (Figure 8). As with WET, peak flow reductions in Bear Creek for the WET and WF combination were highest for the 50 year storm. In contrast to Nahunta, reductions were substantially greater than the WET scenario for Bear Creek since there were fewer instances of overlap between WF and WET locations identified.
When AFF, WF and WET were implemented in combination, peak discharge reductions in Nahunta were increased by 0.5% for the 25 and 50 year storms and by 0.4 to 0.3% for the larger storms. For Bear Creek, adding AFF to the WF+WET scenario resulted in peak discharge reductions ranging from 18.2% for the 500 year storm to 25.7% for the 50 year storm (Figure 8). As in Nahunta Swamp the contribution of AFF to peak discharge reductions generally decreased with increasing storm size (return period) decreasing from approximately 2% for the 25 and 50 year storms to approximately 0.5% for the 500 year and hurricane Floyd. The decrease in effectiveness for larger storms was expected as the ground is completely saturated for a greater portion of the event thereby diminishing the effect of improved infiltration associated with converting cropland and pasture to forest.
Peak discharge reductions for TD in the Little River ranged from 0.4% to 5% for the 5 storm events simulated, with the greatest reduction being for Matthew (Figure 8). This was somewhat surprising as Matthew had nearly the greatest rainfall; however, it should be noted that the outlets for the eight TDs in the HEC-HMS model were optimized for discharge from Matthew. It is likely that this is also the reason the reduction in peak discharge (0.7%) was greater for the SCS type II 500 year storm than for the other three SCS storms. Despite receiving discharge from 52% of the watershed area (Table 2), the peak discharge reduction resulting from the 8 TDs for all storms was relatively small. This is likely because cumulative storage for all the TDs for Matthew was only 0.021 ha-m per ha of land draining to them. When TD was combined with AFF in Little River, peak flow reductions ranged from 1.7% to 6% for the 5 storm events simulated, with the greatest reduction being for Matthew.

3.4. Change in Water Surface Elevation

Peak discharge reductions at the outlet of Nahunta Swamp resulting from implementing all three measures (WF+WET+AFF) ranged from 10.4% to 13.6% (Figure 8). When input into the HEC-RAS model, these discharge reductions corresponded to a decrease in the water surface elevation (WSE) of less than 0.12 m across the four return period storms. The relatively small drop in WSE was the result of floodwater extending out onto the stream’s floodplain, which had a very low slope; therefore, a considerable decrease in discharge would be required for a significant decrease in WSE or flood stage. Decreases in WSE for Bear Creek at the outlet ranged from 0.2 to 0.5 m, with the reduction for the 25 year event being approximately twice as great as any of the other three storms, even though the 25% decrease in peak discharge was similar to the other three (Figure 8). The disproportionately large decrease in WSE was due to the reduced discharge from the 25 year storm no longer backing up behind a bridge at the watershed outlet.

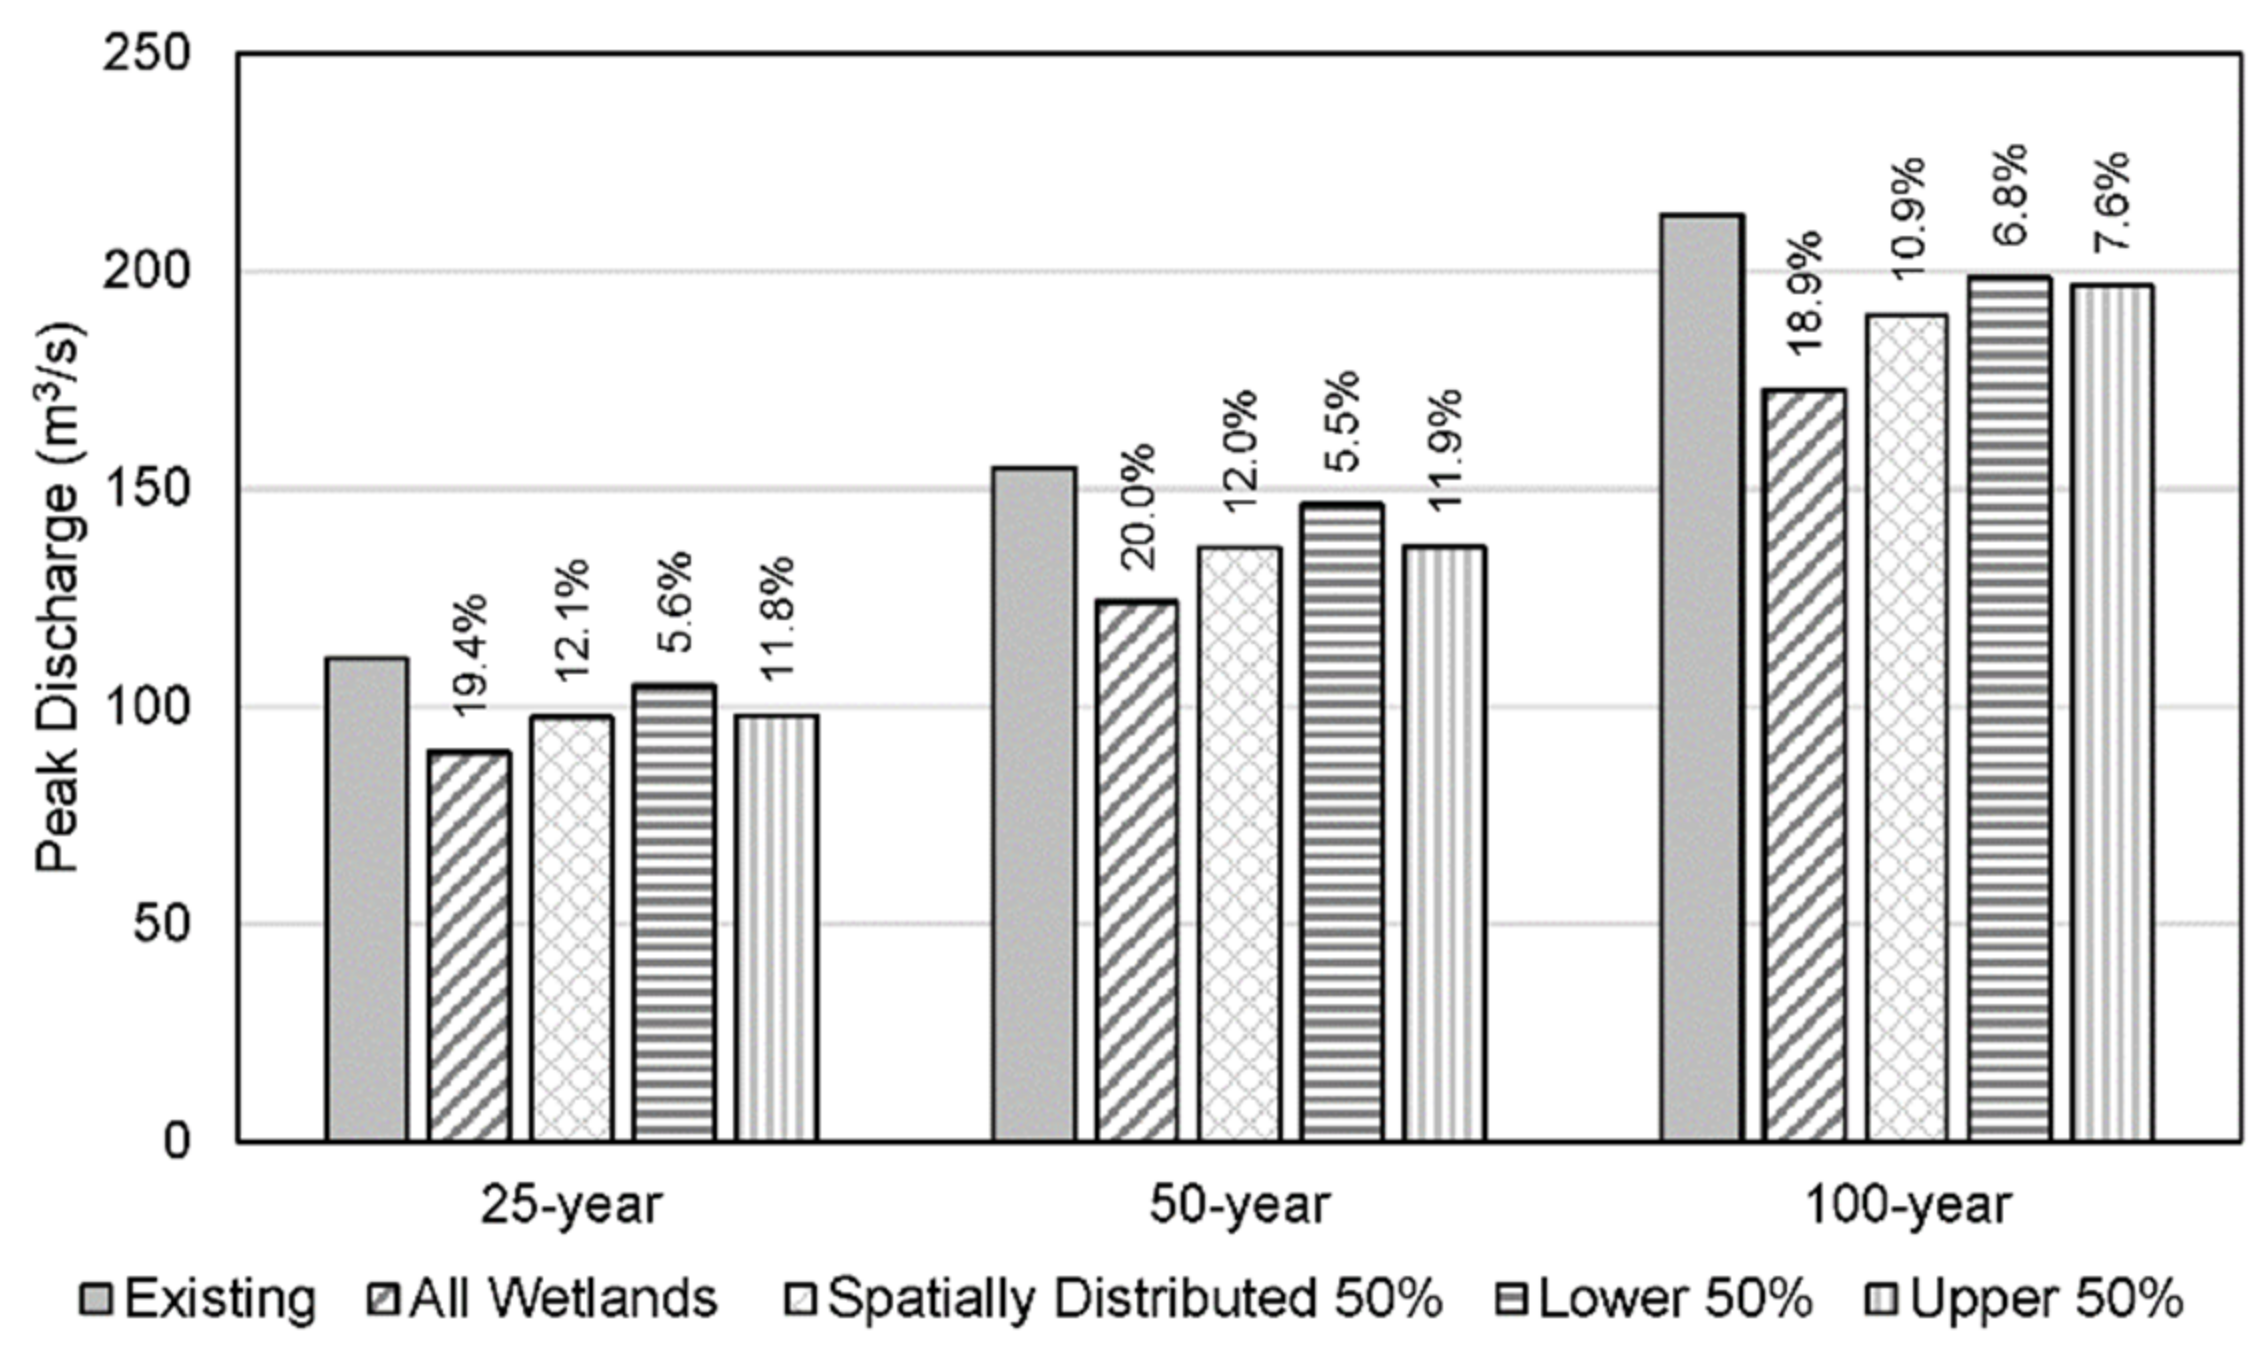
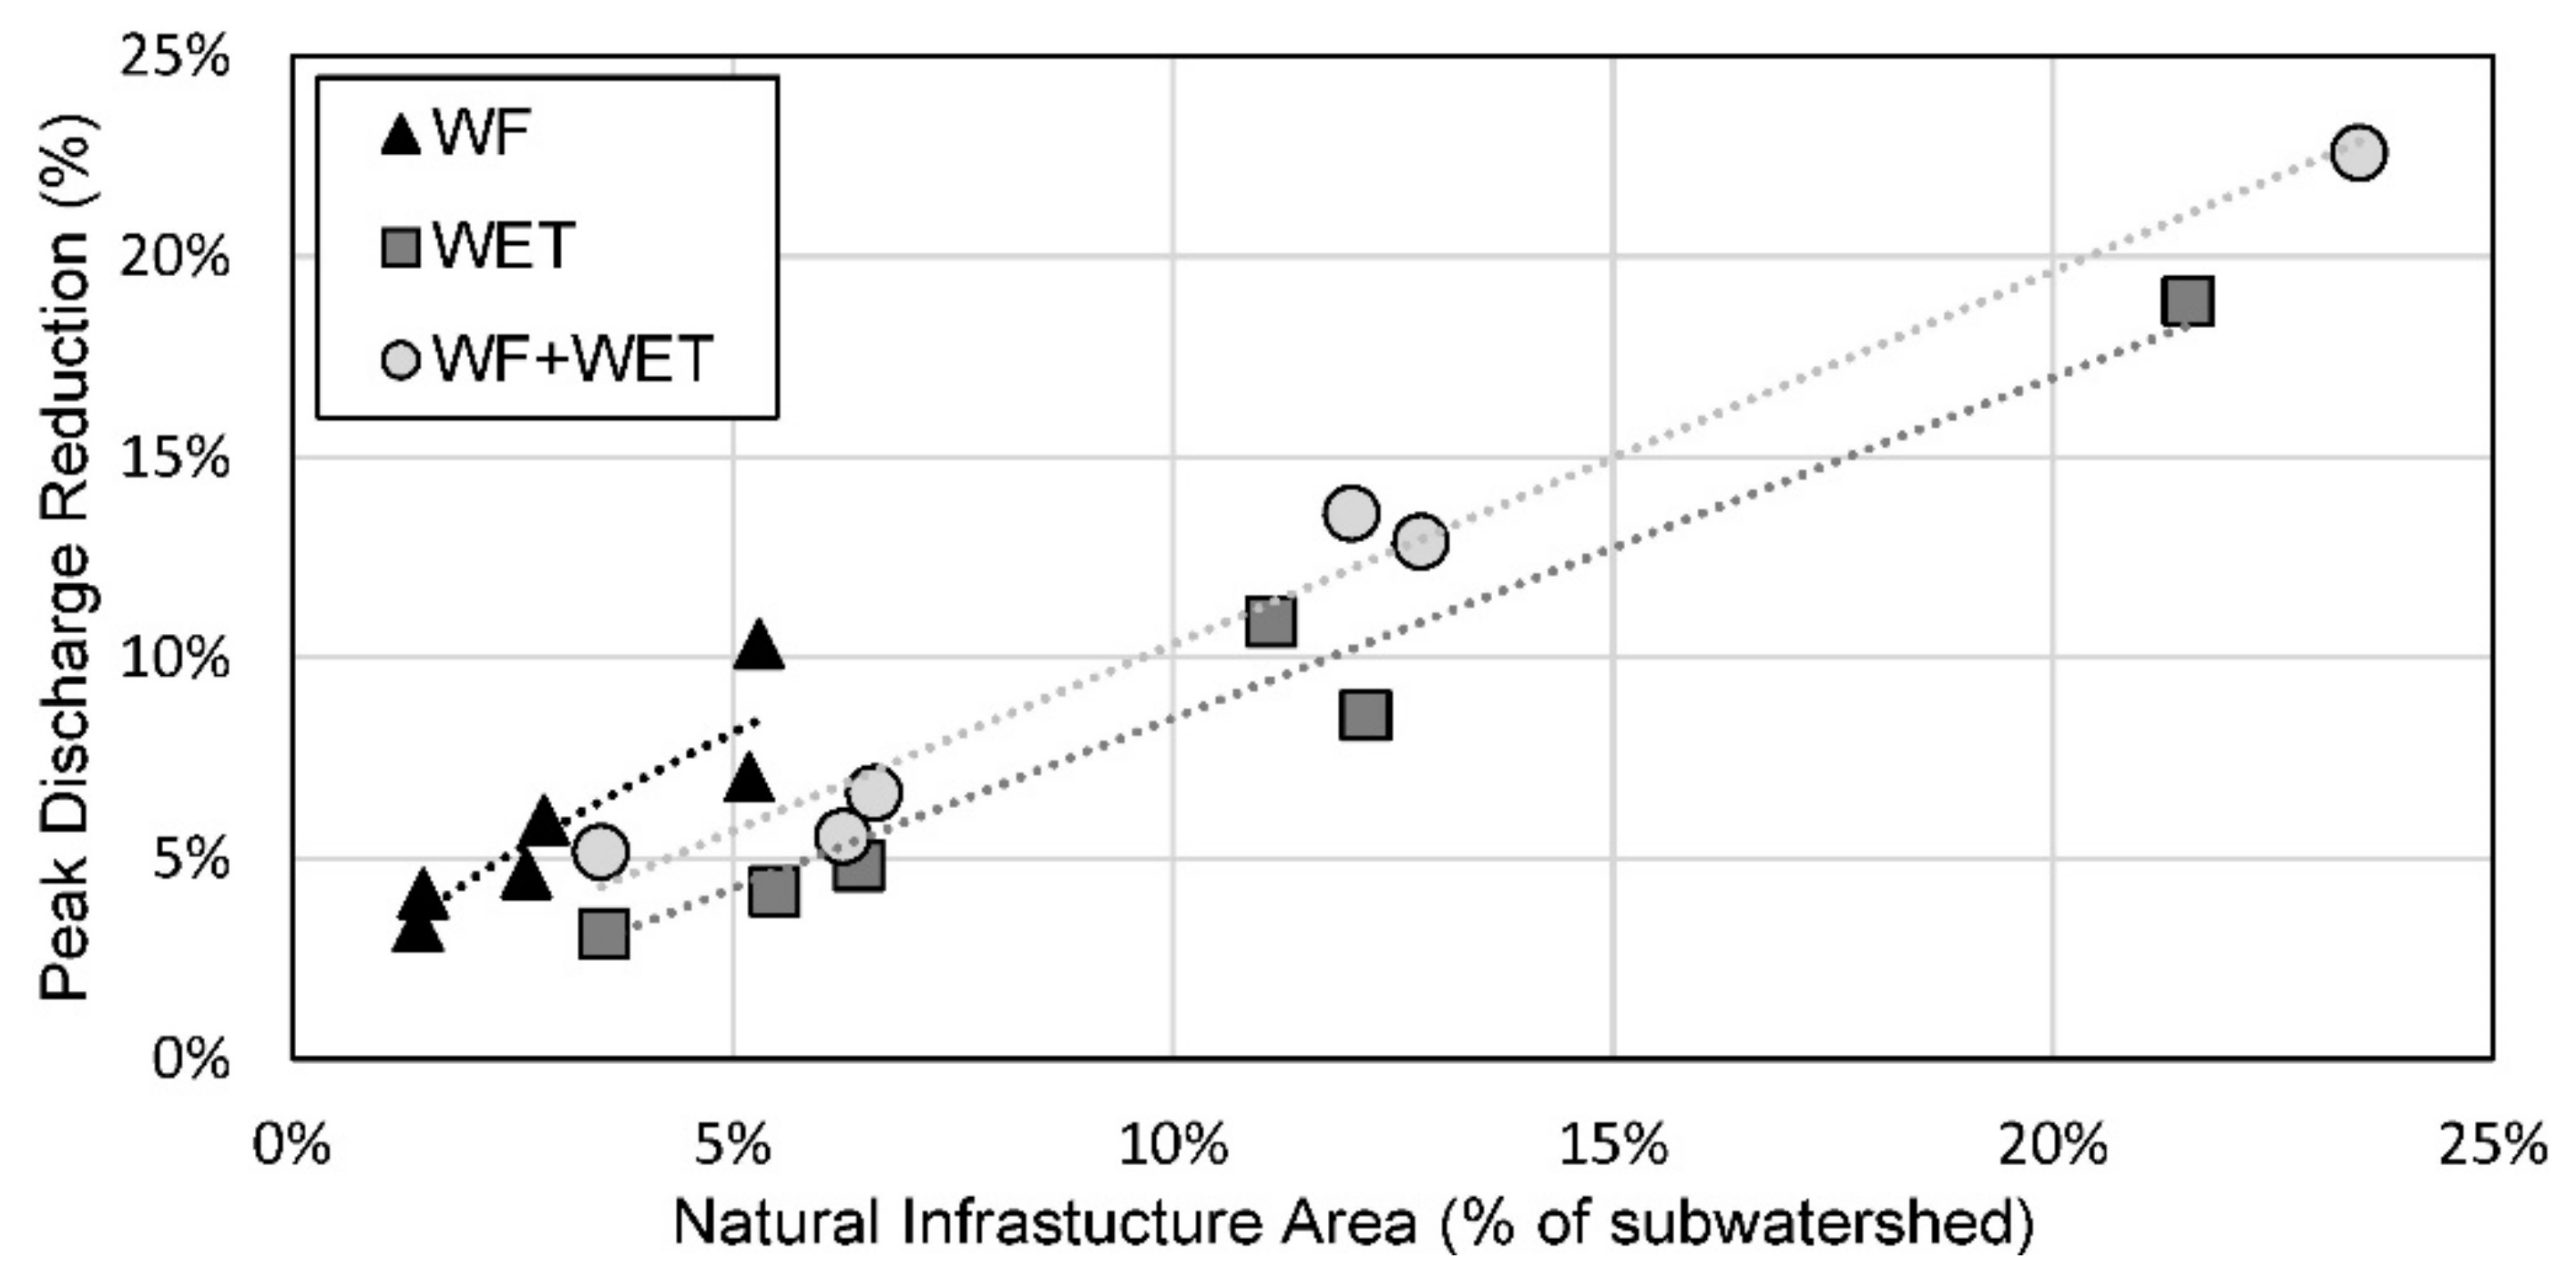
3.5. Spatial Variability in Peak Discharge Reductions and Changes in Peak WSE

In the Bear Creek watershed, peak discharge reductions for the 100 year storm ranged from 28% to 46% for catchments located in the headwaters and decreased to 24% at the overall watershed outlet (Figure 9). These results illustrate the spatial variability in peak discharge reductions throughout the watershed resulting mainly from changes in the proportion of land treated by NI measures. Further, the results show that substantial localized reductions (40–50%) in peak discharges are possible in areas with a high density of NI measure implementation.
To evaluate how landscape position of the NI measures affect peak flow reductions, half of the Bear Creek WETs were varied in the HEC-HMS model using three scenarios: (1) spatially distributed through the watershed, (2) upper half of the watershed only and (3) lower half of the watershed only. The peak flow reductions from the three scenarios were compared to full implementation of all WETs. Results are shown in Figure 10. The spatially distributed wetlands produced the highest peak flow reductions. At the 25 and 50 year storm events, WETs concentrated in the upper basin provide more reduction than when concentrated in the lower basin. However, the difference is diminished for the 100 year storm event.
Reductions in peak WSEs did not always directly correspond to changes in discharge due to different cross sectional geometry and the presence of backwater hydraulic conditions. For Bear Creek the peak WSEs declined by 0.15 to 0.46 m across the watershed for WET. Implementation of WF and AFF resulted in a much smaller change in peak WSE.

3.6. Timing of Runoff Release from Water Farming Measures

To determine how long runoff would need to be stored on fields for WF to achieve maximum peak flow reductions, the timing of release from WF sites in four subbasins of Nahunta Swamp (hatched areas on Figure 4) was evaluated. The low flow orifice and pipe releases drained the WF measure over 24–48 h and reduced the peak discharge at the Nahunta Swamp outlet considerably. However, retaining all of the runoff during the storm via a managed gate/weir outlet produced a more substantial reduction in peak flows at the outlet. Therefore, all release scenarios were based on the managed gate outlet. To illustrate the release scenarios, the outflow hydrographs from the Mill Creek subbasin (identified in Figure 4) for the various WF release times are shown as dashed or dotted lines in Figure 11. Outflow from the Mill Creek subbasin peaks approximately 7.5 h before the peak at the outlet of Nahunta Swamp and then decreases until releases from the WF measures begin. Releases of retained runoff from the WF measures as early as 9 October 4:00 resulted in no increase in the peak discharge at the outlet. This was expected as the releases occurred after the peak discharge at the Nahunta Swamp outlet. When the releases occurred at 9 October 00:00, then peak discharge at the outlet increased. Similarly, releases from WF measures in the other three subbasins (Figure 4) at 9 October 4:00 also resulted in no increase in the peak discharge at the outlet. Thus, for Nahunta Swamp, retaining runoff by WF measures until the peak of the flood has passed downstream (~28 h from the start of rainfall on 8 October 00:00) resulted in the maximum reduction in the peak discharge at the outlet.

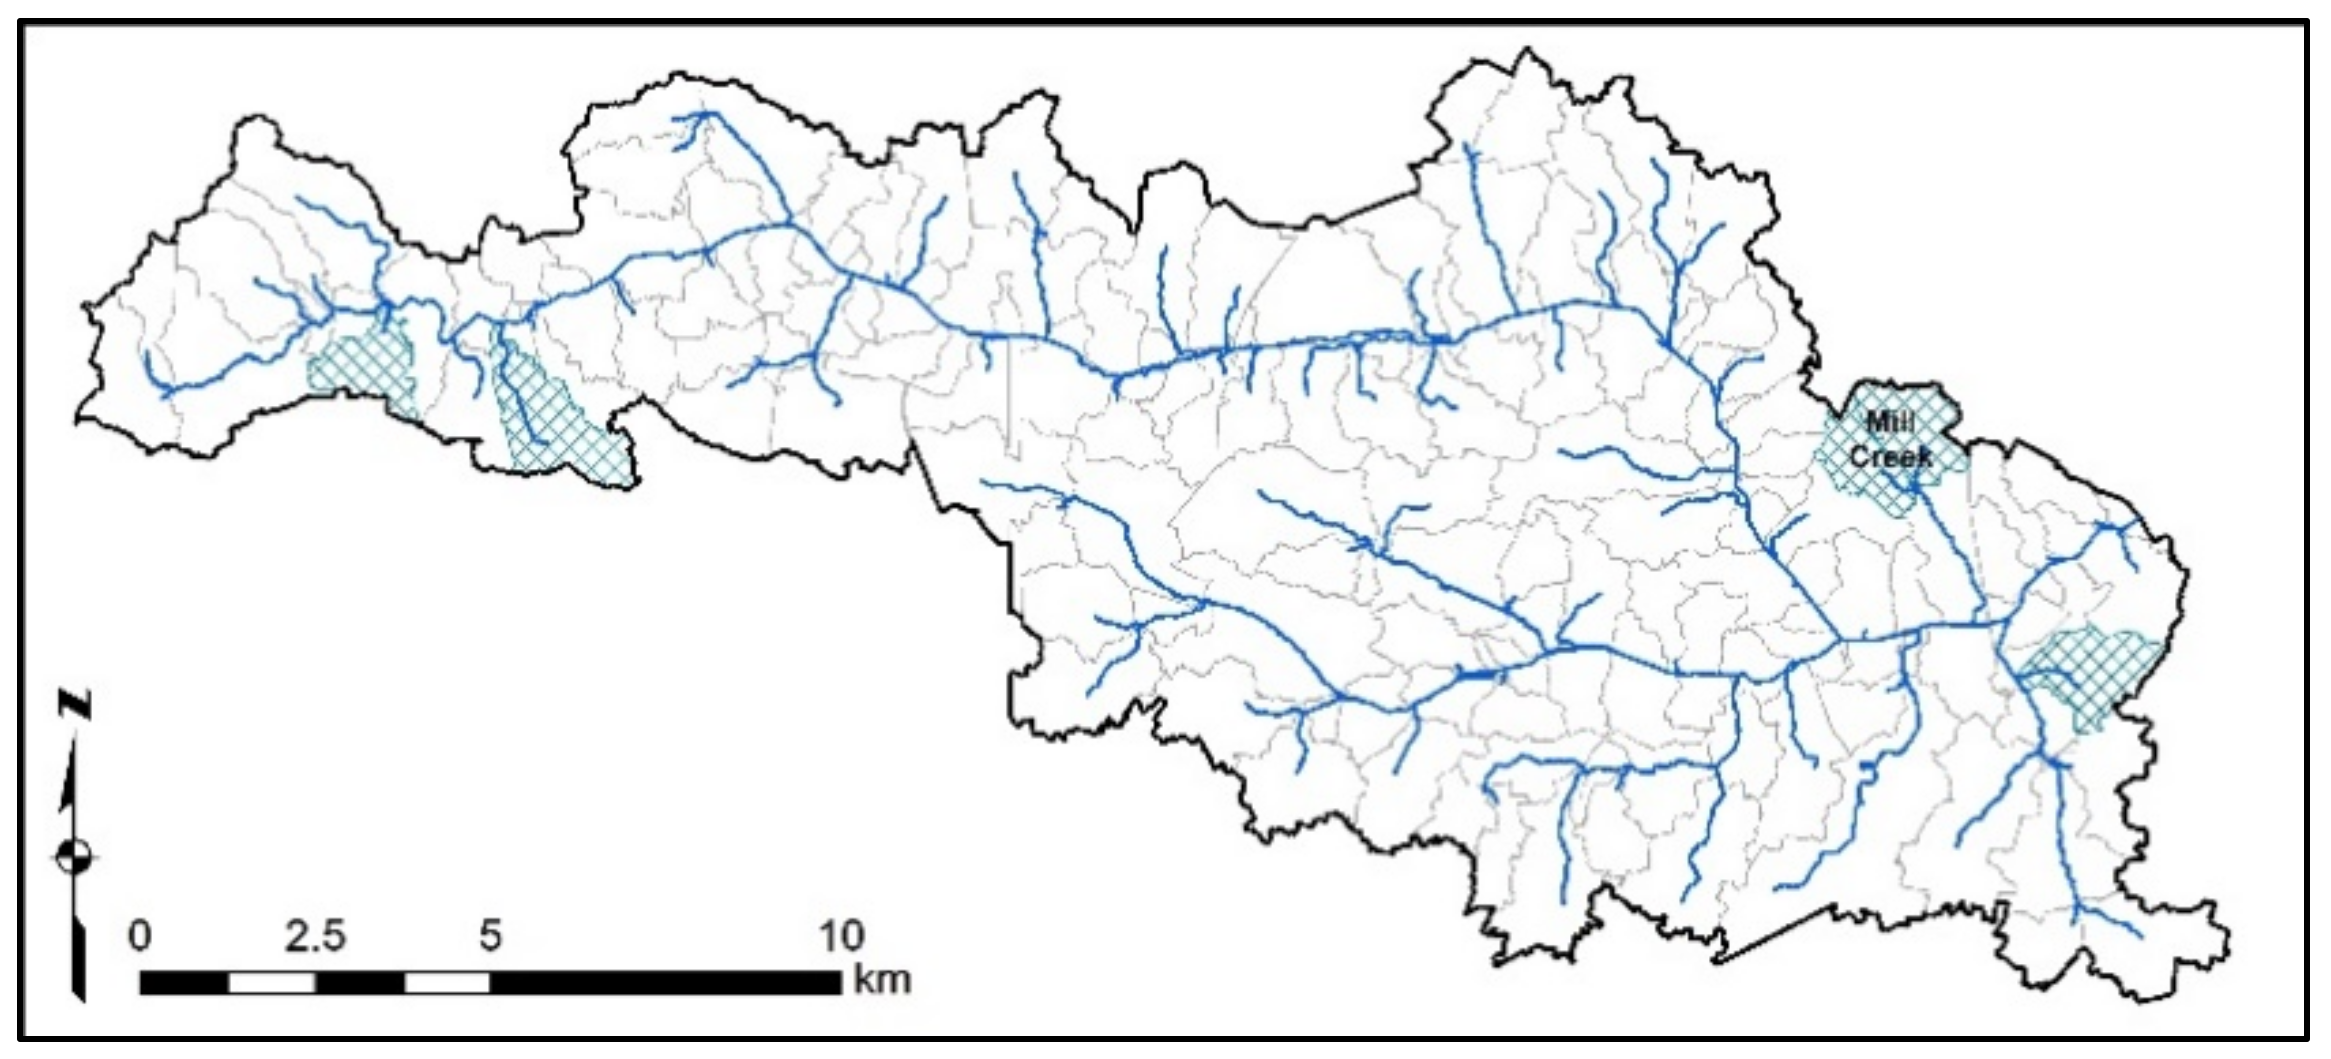
3.7. Peak Flow Reductions for the Middle Neuse Basin

Regression relationships of peak flow reduction relative to the percent of the subwatershed affected by NI implementation were developed by modeling various levels of NI implementation (WET and WF) in the Nahunta Swamp and Bear Creek subwatersheds. The peak discharge reductions and the resulting regression relationships are shown in Figure 12. These relationships were used to estimate the peak flow reduction in other subwatersheds based on the specific NI opportunities identified in each subwatershed.
Because most of the potential area for NI implementation concentrated in the middle to lower third of the basin, the peak flow reductions were greater in the lower (eastern) part of the basin. The peak flow reductions at Smithfield were less than 0.5% for all the scenarios (Table 4). In Goldsboro, the reduction in peak discharge ranged from 2.0% for the WF+WET scenario to 4.4% for the WF+WET+AFF scenario for Hurricane Matthew. At Kinston, the peak flow reduction increased to 2.7% for AFF and to 5.3% for the WF+WET+AFF scenario for Matthew. The slightly greater flow reductions at Kinston were the result of greater potential for WF and WETs in the lower part of the basin. Flow reductions were similar for the 100 year storm (Table 4). The peak flow reductions were evaluated in the Neuse River HEC-RAS model and changes in water surface elevations at three communities—Smithfield, Goldsboro and Kinston—located along the river (see Figure 6) were recorded. No notable lowering of the water surface was reported for Smithfield since peak flow reductions were too small. The flow reductions resulted in an estimated drop in water surface elevation of less than 0.15 m at Goldsboro and Kinston for Hurricane Matthew.

4. Discussion

4.1. Peak Flow Reductions

Little River, which is located in the upper river basin, experienced relatively small reductions in peak flow (~1%) despite the fairly large area of AFF implementation (6% of the overall watershed) when compared to the two subwatersheds that are located in the lower river basin—Bear and Nahunta. This can likely be attributed to the steeper topography and lower permeability soils compared to the two Coastal Plain watersheds. Similarly, Dixon’s [17] modeling of reforestation indicated less change to peak discharge on stream reaches with higher slopes. The limited benefits of afforestation combined with the lack of opportunity for WF and WET in Little River indicate that other more intensively engineered practices (e.g., terracing, dry detention, and repurposing of farm ponds) may be needed to achieve peak flow mitigation in these types of landscapes. The mitigating effect of afforestation could be enhanced by constructing berms around forested areas to temporarily retain runoff on the forest during extreme events, thereby enhancing infiltration and reducing runoff.
Eight temporary detention facilities controlling over half the watershed provided some additional peak flow reduction benefits (6% for Hurricane Matthew). Despite designing the outlet structures strategically for larger storm events, reductions to flooding were much lower than modeled by Ngo et al. [39], who estimated 20% to 79% reductions in the flooded volume of an urban watershed in Korea by optimizing flow retardation in a detention structure. However, the Korean watershed is only a fraction (1.7%) of the size of Little River and it is unclear if the scale of the storm events are comparable.
Bear Creek experienced greater reductions from the NI implementation when compared to the other basins. In addition to more WET and AFF area in the Bear Creek watershed, there are two other unique factors that likely contributed to greater peak discharge reductions. First, the topography and land use of Bear Creek resulted in most of the NI potential being located in the upper part of the watershed, and thus reducing peak runoff rates in this area has a greater impact on peak flow reduction at the outlet. Similarly, Dixon et al.’s [17] highest peak flow reduction rates (up to 19%) for forest restoration were also due to desynchronization, with reductions highest when forest were added to the mid and upper portion of the catchment. Second, the eight large human-made lakes in Bear Creek likely expanded the discharge reductions; NI upstream of the lakes reduced the inflow to the lakes, thereby freeing up their flood storage capacity and further reducing peak discharges. These results suggest that targeting AFF and other NI measures upstream of existing ponds and lakes could potentially enhance the flood control benefits of existing structures.
Despite relatively large peak flow reductions estimated at the small catchment level (20 to 40% see Figure 9) and reasonable reductions at the subwatershed scale (up to 22% see Figure 8), peak flow reductions for the full middle Neuse Basin were substantially less (5.2% to 6.6% at Kinston see Table 4). Similarly, Martinez et al. [40] found lower peak flow reductions at the watershed outlet as a result of increasing wetland area as compared to the reductions at the catchment scale.
WETs resulted in greater peak flow reductions than WF, however, given the greater cost for construction, loss of agricultural land, and possible disruption to the aquatic ecosystem, the small increase in peak discharge reduction gained from WET over WF may not be cost-effective; however, for areas where WF is not possible, WET could provide flood control. Further, WETs could also provide water quality, wildlife habitat [41], and potential irrigation benefits. Ponds could provide the same flood mitigation as WETs, but would provide less water quality benefits. Additionally, without active water-level management, ponds would provide less storage volume for retention and detention of flood waters and ponds that are full pose a greater risk of failure during extreme events. For example, between October 2015 and November 2016, 83 dams (mostly smaller) failed in the Carolinas due to storm events exceeding the design capacity of the dams [42].
Reducing runoff from agricultural cropland during extreme events is a delicate balance between minimizing crop damage and mitigating downstream flooding by retaining runoff on fields. Extended storage of runoff on cropland would have temporary negative effects on crops and possibly soils, but likely no greater long-term effects on soils than saturation during the extreme event. From 1981 to 2016, excessive rainfall reduced US corn yield by up to −34% below expected, which was comparable to the reductions due to extreme drought (−37%) over the same time period [43]. However, retaining runoff on cropland for an extended period would likely increase crop loss; therefore, crop producers would need to be compensated for their losses.

4.2. Spatial Variability of Peak Flow Reductions

Unlike a large flood control structure at the outlet of a watershed, NI flood mitigation measures can be distributed in a watershed; therefore, they can help reduce flooding throughout that watershed. An analysis of the Bear Creek watershed indicated that peak flow reductions and associated WSE reductions as a result of NI implementation were greater in some areas of the upper watershed compared to the outlet. Even though some differences were due to NI spatial variability and density, landscape position, drainage network and channel morphology all likely influence flow and associated flood reductions. Smaller catchments likely experience greater flood reduction benefit from NI as flooding is often controlled by flow overland and through soil in the upper watershed, whereas channel friction, tributary contributions, and interactions with the floodplain will influence peak discharge and timing in the lower portion of a catchment [44]. Flood wave attenuation is also related to channel wetted area (size of the channel), bed roughness and sinuosity [45]. Other studies have reported similar reductions in peak flow as were modeled for Bear Creek by applying forest cover to a large percentage of the total catchment area. Bahremand et al. [46] modeled an average reduction in peak flow of approximately 24% for a 50% increase in forest cover, and Lahmer et al. [47] reported a peak flow reduction as high as 42.3% for conversion of approximately 66% of the total basin area. However, removal of crop production at these levels is unlikely where the crop value and need are high. By applying water farming and wetlands, high reductions can be achieved utilizing less space, especially considering that the wetland footprint is only 1/10th the size of the catchment percentages reported in Figure 9.
Spatially distributed WETs produced the highest peak flow reductions at the outlet of Bear Creek as compared to when WETs were concentrated in either the upper or lower portion of the watershed. At the 25 and 50 year storm events, WETs concentrated in the upper basin provide more reduction than when concentrated in the lower basin. However, the difference was diminished for the 100 year storm event. Similarly, Wheater et al. [16] found that careful placement of land management interventions, including farm ponds, and tree shelter belts and buffer strips significantly reduced the magnitude of peak runoff at both the field and small catchment scale. In contrast, Iacob et al. [18] found that replacing cultivated agricultural land with woodlands in lowland areas resulted in greater peak flow reductions for large storm events (5% exceedance discharge) as compared to afforestation of grassland and other semi-natural habitats.

4.3. Reductions in Flooding

Within the subwatersheds, reductions in peak WSEs did not always directly correspond to changes in discharge due to different cross sectional geometry and the presence of backwater hydraulic conditions. At the basin scale, modest reductions in peak flow would lower water levels along the lower reach of the river by less than 15 cm despite intensive NI implementation affecting 10.5% of the river basin. Substantial reductions in flooding within the primary riverine floodplain (generally defined by the 500 year storm area of inundation) are therefore not likely to be achieved through NI. Optimal locations for NI were identified with this study. Additional wetlands, water farming, and afforestation could be implemented in the river basin, but would involve disproportionately more earthwork and loss of productive cropland, which likely would reduce cost effectiveness.
Whether passively or actively managed outlet control systems are employed, timing of runoff release from NI measures is important to optimize reductions in downstream flooding as desynchronization of peak flows is commonly the driver for peak flow reductions [17,29]. An analysis of WF in the Mill Creek catchment of Nahunta Swamp revealed that water would need to be stored for at least 28 h to allow time for the downstream peak in flow to pass the watershed outlet. Outlet structures would need to be designed to optimize downstream flood mitigation while also preventing undesirable upstream inundation and embankment overtopping [39].

5. Conclusions

The flood mitigation potential of the widespread implementation of NI practices (afforestation, flood control wetland restoration/creation, and water farming) on cropland of the Neuse Basin was estimated by simulating peak discharges in three subwatersheds of the Basin (Little River, Nahunta Swamp, and Bear Creek). Results from the three subwatersheds were extrapolated to other subwatersheds in the Neuse basin to determine the flood reduction benefits at the basin scale. The main findings are:
  • Implementation of the three NI measures resulted in substantial reductions in peak flow (13 to 13.7% for Nahunta Swamp and 21.8 to 24.2% for Bear Creek) for large events (100 year storm and Hurricanes). However, this resulted in a decrease in WSE (i.e., flood stage) of less than 0.3 m on the streams draining these watersheds. Flood reduction in Little River was limited due steeper slopes and less NI potential.
  • High variability in peak flow reduction was produced in relation to the density of NI implementation and substantial localized reductions in peak flow (40–50%) were reported in areas with high-density NI implementation.
  • In terms of flood reduction per acre of measure, wetlands provide the greatest benefits, followed by water farming and then afforestation.
  • Peak flow reductions and associated water surface reductions on the Neuse River were more limited (<0.15 m reduction in WSE) despite 10.5% of the middle Neuse Basin being affected by NI measures.
Overall, results suggest that NI may be highly effective at reducing localized flooding in small-scale catchments during large flood events. As the catchment scale increases, the amount of NI implementation required to produce meaningful flow reductions reaches a scale at which implementation may not be practical or likely. Further research on the effectiveness of NI in reducing damage from more frequently occurring smaller floods is warranted. More feasible approaches that integrate watershed and land-use management in upland areas with land-use planning, engineering measures, flood preparedness, and emergency management in the affected lowland areas as outlined by Calder and Aylward [48] should be considered at the watershed scale. Flooding is the natural way for a river system to discharge the water produced by the occasional large rainfall event and problems only arise when we choose to live and work in flood plain areas, which often forces us to protect against a natural hazard [49]. Moving people and structures out of floodplains is critical especially considering potential increases in flooding due to climate change. Iacob et al. [18] found that the flood mitigation capacity of afforestation was exceeded by the increased flood risk due to climate change.

Author Contributions

Conceptualization, B.A.D., D.E.L. and J.J.K.-F.; data curation, D.E.L., J.J.K.-F. and M.E.B.; formal analysis, D.E.L., J.J.K.-F., M.E.B. and T.M.K.; funding acquisition, B.A.D.; investigation, B.A.D., D.E.L., J.J.K.-F., A.A.F., T.M.K. and M.E.B.; methodology, B.A.D., D.E.L. and J.J.K.-F.; project administration, B.A.D.; supervision, B.A.D. and A.A.F.; validation, D.E.L. and J.J.K.-F.; writing—original draft, D.E.L. and J.J.K.-F.; writing—review and editing, B.A.D., D.E.L. and J.J.K.-F. All authors have read and agreed to the published version of the manuscript.

Funding

This research was funded by the North Carolina Collaboratory, UNC-Chapel Hill; Grant Number RFA 239581.

Institutional Review Board Statement

This study did not involve humans or animals.

Informed Consent Statement

Not Applicable.

Data Availability Statement

Data are available upon reasonable request to the corresponding author.

Acknowledgments

Many thanks to the study advisory group consisting of Fred Cubbage, Todd BenDor, Will McDow, Ted Shear, Michelle Lovejoy, Keith Larick, Krissy Hopkins, Tom Potter, Bryan Evans and Dave Salvesen. Thanks to NC Emergency Management for providing access to existing hydrologic and hydraulic models used in this study.

Conflicts of Interest

The authors declare no conflict of interest. The funders had no role in the design of the study; in the collection, analyses, or interpretation of data; in the writing of the manuscript, or in the decision to publish the results.

References

  1. Jha, A.K.; Bloch, R.; Lamond, J. Cities and Flooding: A Guide to Integrated Urban Flood Risk Management for the 21st Century; World Bank Publications: Washington, DC, USA, 2021. [Google Scholar]
  2. Jonkman, S.N. Global Perspectives on Loss of Human Life Caused by Floods. Nat. Hazards 2005, 34, 151–175. [Google Scholar] [CrossRef]
  3. Wobus, C.; Zheng, P.; Stein, J.; Lay, C.; Mahoney, H.; Lorie, M.; Mills, D.; Spies, R.; Szafranski, B.; Martinich, J.; et al. Projecting Changes in Expected Annual Damages From Riverine Flooding in the United States. Earth Future 2019, 7, 516–527. [Google Scholar] [CrossRef] [PubMed]
  4. Winsemius, H.C.; Aerts, J.C.J.H.; Van Beek, L.P.H.; Bierkens, M.F.P.; Bouwman, A.; Jongman, B.; Kwadijk, J.C.J.; Ligtvoet, W.; Lucas, P.L.; Van Vuuren, D.P.; et al. Global Drivers of Future River Flood Risk. Nat. Clim. Chang. 2016, 6, 381–385 . [Google Scholar] [CrossRef]
  5. Carter, N.T.; Lipiec, E. Flood Risk Reduction From Natural and Nature-Based Features: Army Corps of Engineers Authorities; Congressional Research Service: Washington, DC, USA, 2020. [Google Scholar]
  6. Lieb, D.A.; Casey, M.; Minkoff, M. At Least 1,680 Dams across the US Pose Potential Risk; Associated Press: New York, NY, USA, 2019. [Google Scholar]
  7. Dadson, S.J.; Hall, J.W.; Murgatroyd, A.; Acreman, M.; Bates, P.; Beven, K.; Heathwaite, A.L.; Holden, J.; Holman, I.; Lane, S.N.; et al. A Restatement of the Natural Science Evidence Concerning Catchment-Based ‘Natural’ Flood Management in the UK. Proc. R. Soc. A Math. Phys. Eng. Sci. 2017, 473, 20160706. [Google Scholar] [CrossRef] [Green Version]
  8. Barber, N.J.; Quinn, P.F. Mitigating Diffuse Water Pollution from Agriculture Using Soft-Engineered Runoff Attenuation Features. Area 2012, 44, 454–462. [Google Scholar] [CrossRef]
  9. Collentine, D.; Futter, M. Realising the Potential of Natural Water Retention Measures in Catchment Flood Management: Trade-Offs and Matching Interests. J. Flood Risk Manag. 2016, 11, 76–84. [Google Scholar] [CrossRef]
  10. Metcalfe, P.; Beven, K.; Lamb, R. A Modelling Framework for Evaluation of the Hydrological Impacts of Nature-Based Approaches to Flood Risk Management, with Application to in-Channel Interventions across a 29-km2 Scale Catchment in the United Kingdom. Hydrol. Process 2017, 31, 1734–1748. [Google Scholar] [CrossRef] [Green Version]
  11. Lane, S.N. Natural Flood Management. WIREs Water 2017, 4, e1211. [Google Scholar] [CrossRef] [Green Version]
  12. Bosch, J.M.; Hewlett, J.D. A Review of Catchment Experiments to Determine the Effect of Vegetation Changes on Water Yield and Evapotranspiration. J. Hydrol. 1982, 55, 3–23. [Google Scholar] [CrossRef]
  13. Farley, K.A.; Jobbagy, E.G.; Jackson, R.B. Effects of Afforestation on Water Yield: A Global Synthesis with Implications for Policy. Glob. Chang. Biol. 2005, 11, 1565–1576. [Google Scholar] [CrossRef]
  14. Jackson, B.M.; Wheater, H.S.; Mcintyre, N.R.; Chell, J.; Francis, O.J.; Frogbrook, Z.; Marshall, M.; Reynolds, B.; Solloway, I. The Impact of Upland Land Management on Flooding: Insights from a Multiscale Experimental and Modelling Programme. J. Flood Risk Manag. 2008, 1, 71–80. [Google Scholar] [CrossRef]
  15. Yu, P.; Wang, Y.; Coles, N.; Xiong, W.; Xu, L. Simulation of Runoff Changes Caused by Cropland to Forest Conversion in the Upper Yangtze River Region, SW China. PLoS ONE 2015, 10, e0132395. [Google Scholar] [CrossRef]
  16. Wheater, H.; Reynolds, B.; Mcintyre, N.; Marshall, M.; Jackson, B.; Frogbrook, Z.; Solloway, I.; Francis, O.; Chell, J.; Flood Risk Management Research Consortium. Impacts of Upland Land Management on Flood Risk: Multi-Scale Modeling Methodology and Results from the Pontbren Experiment; University of Manchester: Manchester, UK, 2008. [Google Scholar]
  17. Dixon, S.J.; Sear, D.A.; Odoni, N.A.; Sykes, T.; Lane, S.N. The Effects of River Restoration on Catchment Scale Flood Risk and Flood Hydrology. Earth Surf. Process. Landf. 2016, 41, 997–1008. [Google Scholar] [CrossRef]
  18. Iacob, O.; Brown, I.; Rowan, J. Natural Flood Management, Land Use and Climate Change Trade-Offs: The Case of Tarland Catchment, Scotland. Hydrol. Sci. J. 2017, 62, 1931–1948. [Google Scholar] [CrossRef] [Green Version]
  19. Cooper, M.M.D.; Patil, S.D.; Nisbet, T.R.; Thomas, H.; Smith, A.R.; McDonald, M.A. Role of Forested Land for Natural Flood Management in the UK: A Review. WIREs Water 2021, 8, e1541. [Google Scholar] [CrossRef]
  20. SFWMD. The Water Farming Pilot Projects Final Report: An Evaluation of Water Farming as a Means for Providing Water Storage/Retention and Improving Water Quality in the Indian River Lagoon/Saint Lucie River Watershed; South Florida Water Managemetn District: West Palm Beach, FL, USA, 2018. [Google Scholar]
  21. Dillaha, T.A. Role of Best Management Practices in Restoring the Health of the Chesapeake Bay. In Perspectives on the Chesapeake Bay; Chesapeake Research Consortium: Gloucester Point, VA, USA, 1990; pp. 57–81. [Google Scholar]
  22. Baker, J.; Johnson, H. Evaluating the Effectiveness of BMPs from Field Studies. In Agricultural Management and Water Quality; Schaller, F.W., Bailey, G.W., Eds.; Iowa State University Press: Ames, IA, USA, 1983. [Google Scholar]
  23. Schuman, G.E.; Spomer, R.G.; Piest, R.F. Phosphorus Losses from Four Agricultural Watersheds on Missouri Valley Loess. Soil Sci. Soc. Am. J. 1973, 37, 424–427. [Google Scholar] [CrossRef]
  24. Javaheri, A.; Babbar-Sebens, M. On Comparison of Peak Flow Reductions, Flood Inundation Maps, and Velocity Maps in Evaluating Effects of Restored Wetlands on Channel Flooding. Ecol. Eng. 2014, 73, 132–145. [Google Scholar] [CrossRef]
  25. Yang, W.; Wang, X.; Liu, Y.; Gabor, S.; Boychuk, L.; Badiou, P. Simulated Environmental Effects of Wetland Restoration Scenarios in a Typical Canadian Prairie Watershed. Wetl. Ecol. Manag. 2009, 18, 269–279. [Google Scholar] [CrossRef]
  26. Wang, X.; Yang, W.; Melesse, A. Using Hydrologic Equivalent Wetland Concept Within SWAT to Estimate Streamflow in Watersheds with Numerous Wetlands. Trans. ASABE 2008, 51, 55–72. [Google Scholar] [CrossRef]
  27. Kalcic, M.; Chaubey, I.; Frankenberger, J.; Kladivko, E. A Geospatial Approach to Targeting Constructed Wetlands for Nitrate Removal in Agricultural Watersheds. Appl. Eng. Agric. 2012, 28, 347–357. [Google Scholar] [CrossRef]
  28. Nicholson, A.R.; O’Donnell, G.M.; Wilkinson, M.E.; Quinn, P.F. The Potential of Runoff Attenuation Features as a Natural Flood Management Approach. J. Flood Risk Manag. 2019, 13, e12565. [Google Scholar] [CrossRef] [Green Version]
  29. Blanc, J.; Wright, G.; Arthur, S. Natural Flood Management (NFM) Knowledge System: Part 2—The Effect of NFM Features on the Desynchronising of Flood Peaks at a Catchment Scale; Heriot Watt University: Edinburgh, UK, 2012. [Google Scholar]
  30. Cooper, R. Hurricane Florence Recovery Recommendations; State of North Carolina Office: Raleigh, NC, USA, 2018. [Google Scholar]
  31. Multi-Resolution Land Characteristics (MRLC) Consortium. The National Land Cover Database (NLCD). 2019. Available online: https://www.mrlc.gov/ (accessed on 1 February 2020).
  32. USACE. HEC-HMS Hydrologic Modeling System; US Army Corps of Engineers: Davis, CA, USA, 2017. [Google Scholar]
  33. USACE. HEC-GeoRAS; US Army Corps of Engineers: Davis, CA, USA, 2018. [Google Scholar]
  34. North Carolina Emergency Management. QL2/QL1 LiDAR Collection. 2018; Database of LiDAR Derived Digital Elevation Models. Available online: https://sdd.nc.gov/ (accessed on 1 February 2020).
  35. Natural Resource Conservation Service (NRCS); United State Department of Agriculture (USDA). SSURGO Soils Database. Available online: https://www.nrcs.usda.gov/wps/portal/nrcs/detail/soils/survey/?cid=nrcs142p2_053627 (accessed on 1 February 2020).
  36. USACE. HEC-RAS River Analysis System User’s Manual Version 5.0; US Army Corps of Engineers, Hydraulic Engineering Center: Davis, CA, USA, 2016. [Google Scholar]
  37. NCFMP. North Carolina Flood Risk Information System; North Carolina Floodplain Mapping Program: Raliegh, NC, USA, 2020. Available online: https://fris.nc.gov (accessed on 1 February 2020).
  38. North Carolina Emergency Management. Neuse River Basin Flood Analysis and Mitigation Strategies Study; North Carolina Emergency Management: Raleigh, NC, USA, 2018. Available online: https://www.rebuild.nc.gov/resiliency/river-basin-studies (accessed on 21 March 2022).
  39. Ngo, T.T.; Yoo, D.G.; Lee, Y.S.; Kim, J.H. Optimization of Upstream Detention Reservoir Facilities for Downstream Flood Mitigation in Urban Areas. Water 2016, 8, 290. [Google Scholar] [CrossRef] [Green Version]
  40. Martinez-Martinez, E.; Nejadhashemi, A.P.; Woznicki, S.; Love, B.J. Modeling the Hydrological Significance of Wetland Restoration Scenarios. J. Environ. Manag. 2014, 133, 121–134. [Google Scholar] [CrossRef]
  41. Knight, R.L.; Clarke, J.R., Jr.; Bastian, R.K. Surface Flow (SF) Treatment Wetlands as a Habitat for Wildlife and Humans. Water Sci. Technol. 2001, 44, 27–37. [Google Scholar] [CrossRef]
  42. Dalesio, E.P. North Carolina No. 2 In Risky Dams Where Failure Could Kill. U.S. News & World Report, 10 November 2019. [Google Scholar]
  43. Li, Y.; Guan, K.; Schnitkey, G.D.; DeLucia, E.; Peng, B. Excessive Rainfall Leads to Maize Yield Loss of a Comparable Magnitude to Extreme Drought in the United States. Glob. Chang. Biol. 2019, 25, 2325–2337. [Google Scholar] [CrossRef] [Green Version]
  44. Acreman, M.; Holden, J. How Wetlands Affect Floods. Wetlands 2013, 33, 773–786. [Google Scholar] [CrossRef] [Green Version]
  45. Rameshwaran, P.; Willetts, B. Conveyance Prediction for Meandering Two-Stage Channel Flows. Proc. ICE-Water Marit. Energy 1999, 136, 153–166. [Google Scholar] [CrossRef]
  46. Bahremand, A.; De Smedt, F.; Corluy, J.; Liu, Y.B.; Poorova, J.; Velcicka, L.; Kunikova, E. WetSpa Model Application for Assessing Reforestation Impacts on Floods in Margecany–Hornad Watershed, Slovakia. Water Resour. Manag. 2007, 21, 1373–1391. [Google Scholar] [CrossRef]
  47. Lahmer, W.; Pfützner, B.; Ströbl, B. Possible Impacts of Climate and Land Use Changes on the Water Balance of Semi-arid German River Basins. In Proceedings of the 19th European Regional ICID Conference on Sustainable Use of Land and Water, Brno and Prague, Czech Republic, 4–8 June 2001; pp. 4–8. [Google Scholar]
  48. Calder, I.R.; Aylward, B. Forest and Floods: Moving to an Evidence-Based Approach to Watershed and Integrated Flood Management. Water Int. 2006, 31, 87–99. [Google Scholar] [CrossRef]
  49. Institution of Civil Engineers. Learning to Live with Rivers. In Final Report of the Institution of Civil Engineer’s Presidential Commission to Review the Technical Aspects of Flood Risk Management in England and Wales; ICE: London, UK, 2001. [Google Scholar]
Figure 1. Study watersheds of the Neuse River Basin.
Water 14 01479 g001
Figure 2. Flood Storage wetland concept design schematic.
Water 14 01479 g002
Figure 3. Physical and HEC-HMS representation of WF and WET.
Water 14 01479 g003
Figure 4. HEC-HMS subbasins in Nahunta Swamp where runoff retained by WF was released.
Water 14 01479 g004
Figure 5. Drainage areas for TDs in Little River Watershed.
Water 14 01479 g005
Figure 6. Level of NI opportunity for AFF, WF and WETs within the middle Neuse River Basin study area. The locations of three communities—Smithfield, Goldsboro and Kinston—situated along the river are also identified.
Water 14 01479 g006
Figure 7. Hydrograph comparisons for modeled and observed peak flows for calibration of each HEC-HMS subwatershed model.
Water 14 01479 g007
Figure 8. Effect of mitigation measures on peak discharge at the outlet of Bear Creek (A), Nahunta Swamp (B) and Little River (C). Hurricane refers to Hurricane Matthew for Nahunta Swamp and Little River and Hurricane Floyd for Bear Creek.
Water 14 01479 g008
Figure 9. Peak flow reduction percentages and WSE declines for the 100 year event at multiple watershed catchment locations throughout the Bear Creek subwatershed as a result of implementing NI. The catchment area, percent of catchment that is affected by each NI measure (AFF, WF, WET) and the total of all NI, the peak flow (Qp) reduction and associated water surface elevation (WSE) reduction for the 100 year storm are also reported. Note: Wetland percentages represent the portion of the catchment controlled by the wetland feature.
Water 14 01479 g009
Figure 10. Peak flow reductions for Bear Creek resulting from varying the location of the density and placement of wetlands in the watershed.
Water 14 01479 g010
Figure 11. Discharge for Mill Creek for three WF release times (9 October 2016 00:00, 9 October 2016 4:00, and 9 October 2016 12:00). The time to peak at the Nahunta Swamp outlet is also indicated.
Water 14 01479 g011
Figure 12. Relationship between WF and WET implementation and modeled peak flow reduction for Bear Creek and Nahunta Swamp.
Water 14 01479 g012
Table 1. Rainfall for Storm Events Simulated in HEC-HMS.
Rainfall EventStorm Rainfall Depth (mm)
Nahunta SwampBear CreekLittle River
Matthew/Floyd2441 13102 22311 1
SCS II 25 year178185163
SCS II 50 year193217183
SCS II 100 year221254206
SCS II 500 year343361249
1 Average cumulative rainfall for Hurricane Matthew as estimated by NC SCO. 2 Cumulative rainfall for Hurricane Floyd from NC SCO gage at Clinton, NC, USA.
Table 2. The area and percentage of the watershed identified for AFF, the number of WF sites identified, the drainage area controlled by the WFs and the associated percentage of the watershed; the number of WETs, their total size, the cumulative drainage area for all WETs and the associated percentage of the watershed; the number, storage volume, watershed area and associated percentage of the watershed identified for TD (Little River only).
WatershedAFFWFWETTD
Area ha%no.Ha 1%noArea haDrainage Ha 2%noStorage ha-m 3Area ha%
Little River9426.5---10222201.582181759452.2
Nahunta Swamp3581.85310145.164245243412.2----
Bear Creek160910.6438075.666323328021.5----
1 Cumulative area controlled by WF. 2 Cumulative drainage area for all WETs. 3 Cumulative storage volume for the SCS 500 year storm.
Table 3. Area and Percentage of Neuse Basin study area where opportunity for NI measures were identified.
AFFWFWETNI Total
Total Area of Opportunity (ha) 39,2704260209045,620
% of Middle Neuse Basin9.1%1.0%0.5%10.5%
Table 4. Effect of mitigation measures on peak discharge at three communities located along the Neuse River. Peak Discharge in m3/s and the percentage reduction reported in parenthesis.
Return Interval StormExistingAFFWF+WETWF+WET+AFF
SmithfieldGoldsboroKinstonSmithfieldGoldsboroKinstonSmithfieldGoldsboroKinstonSmithfieldGoldsboroKinston
50 year423907643422 (0.3)884 (2.6)622 (3.3)423 (0.0)900 (0.8)629 (2.1)422 (0.3)876 (3.5)609 (5.3)
100 year4991141804497 (0.3)1116 (2.2)781 (2.9)499 (0.0)1132 (0.7)789 (1.9)497 (0.3)1103 (3.3)763 (5.2)
500 year85523621598853 (0.2)2314 (2.0)1566 (2.0)855 (0.0)2247 (4.9)1503 (6.0)853 (0.2)2228 (5.6)1493 (6.6)
Hurricane Matthew48514911075483
(0.4)
1451
(2.7)
1046
(2.7)
485
(0.0)
1461
(2.0)
1042
(3.1)
483
(0.3)
1426
(4.4)
1018
(5.3)
Publisher’s Note: MDPI stays neutral with regard to jurisdictional claims in published maps and institutional affiliations.

