
Effect of Climate Change and Anthropogenic Activities on Streamflow Indicators in a Tropical River Basin in Southern China

Abstract
:1. Introduction
2. Materials and Methods
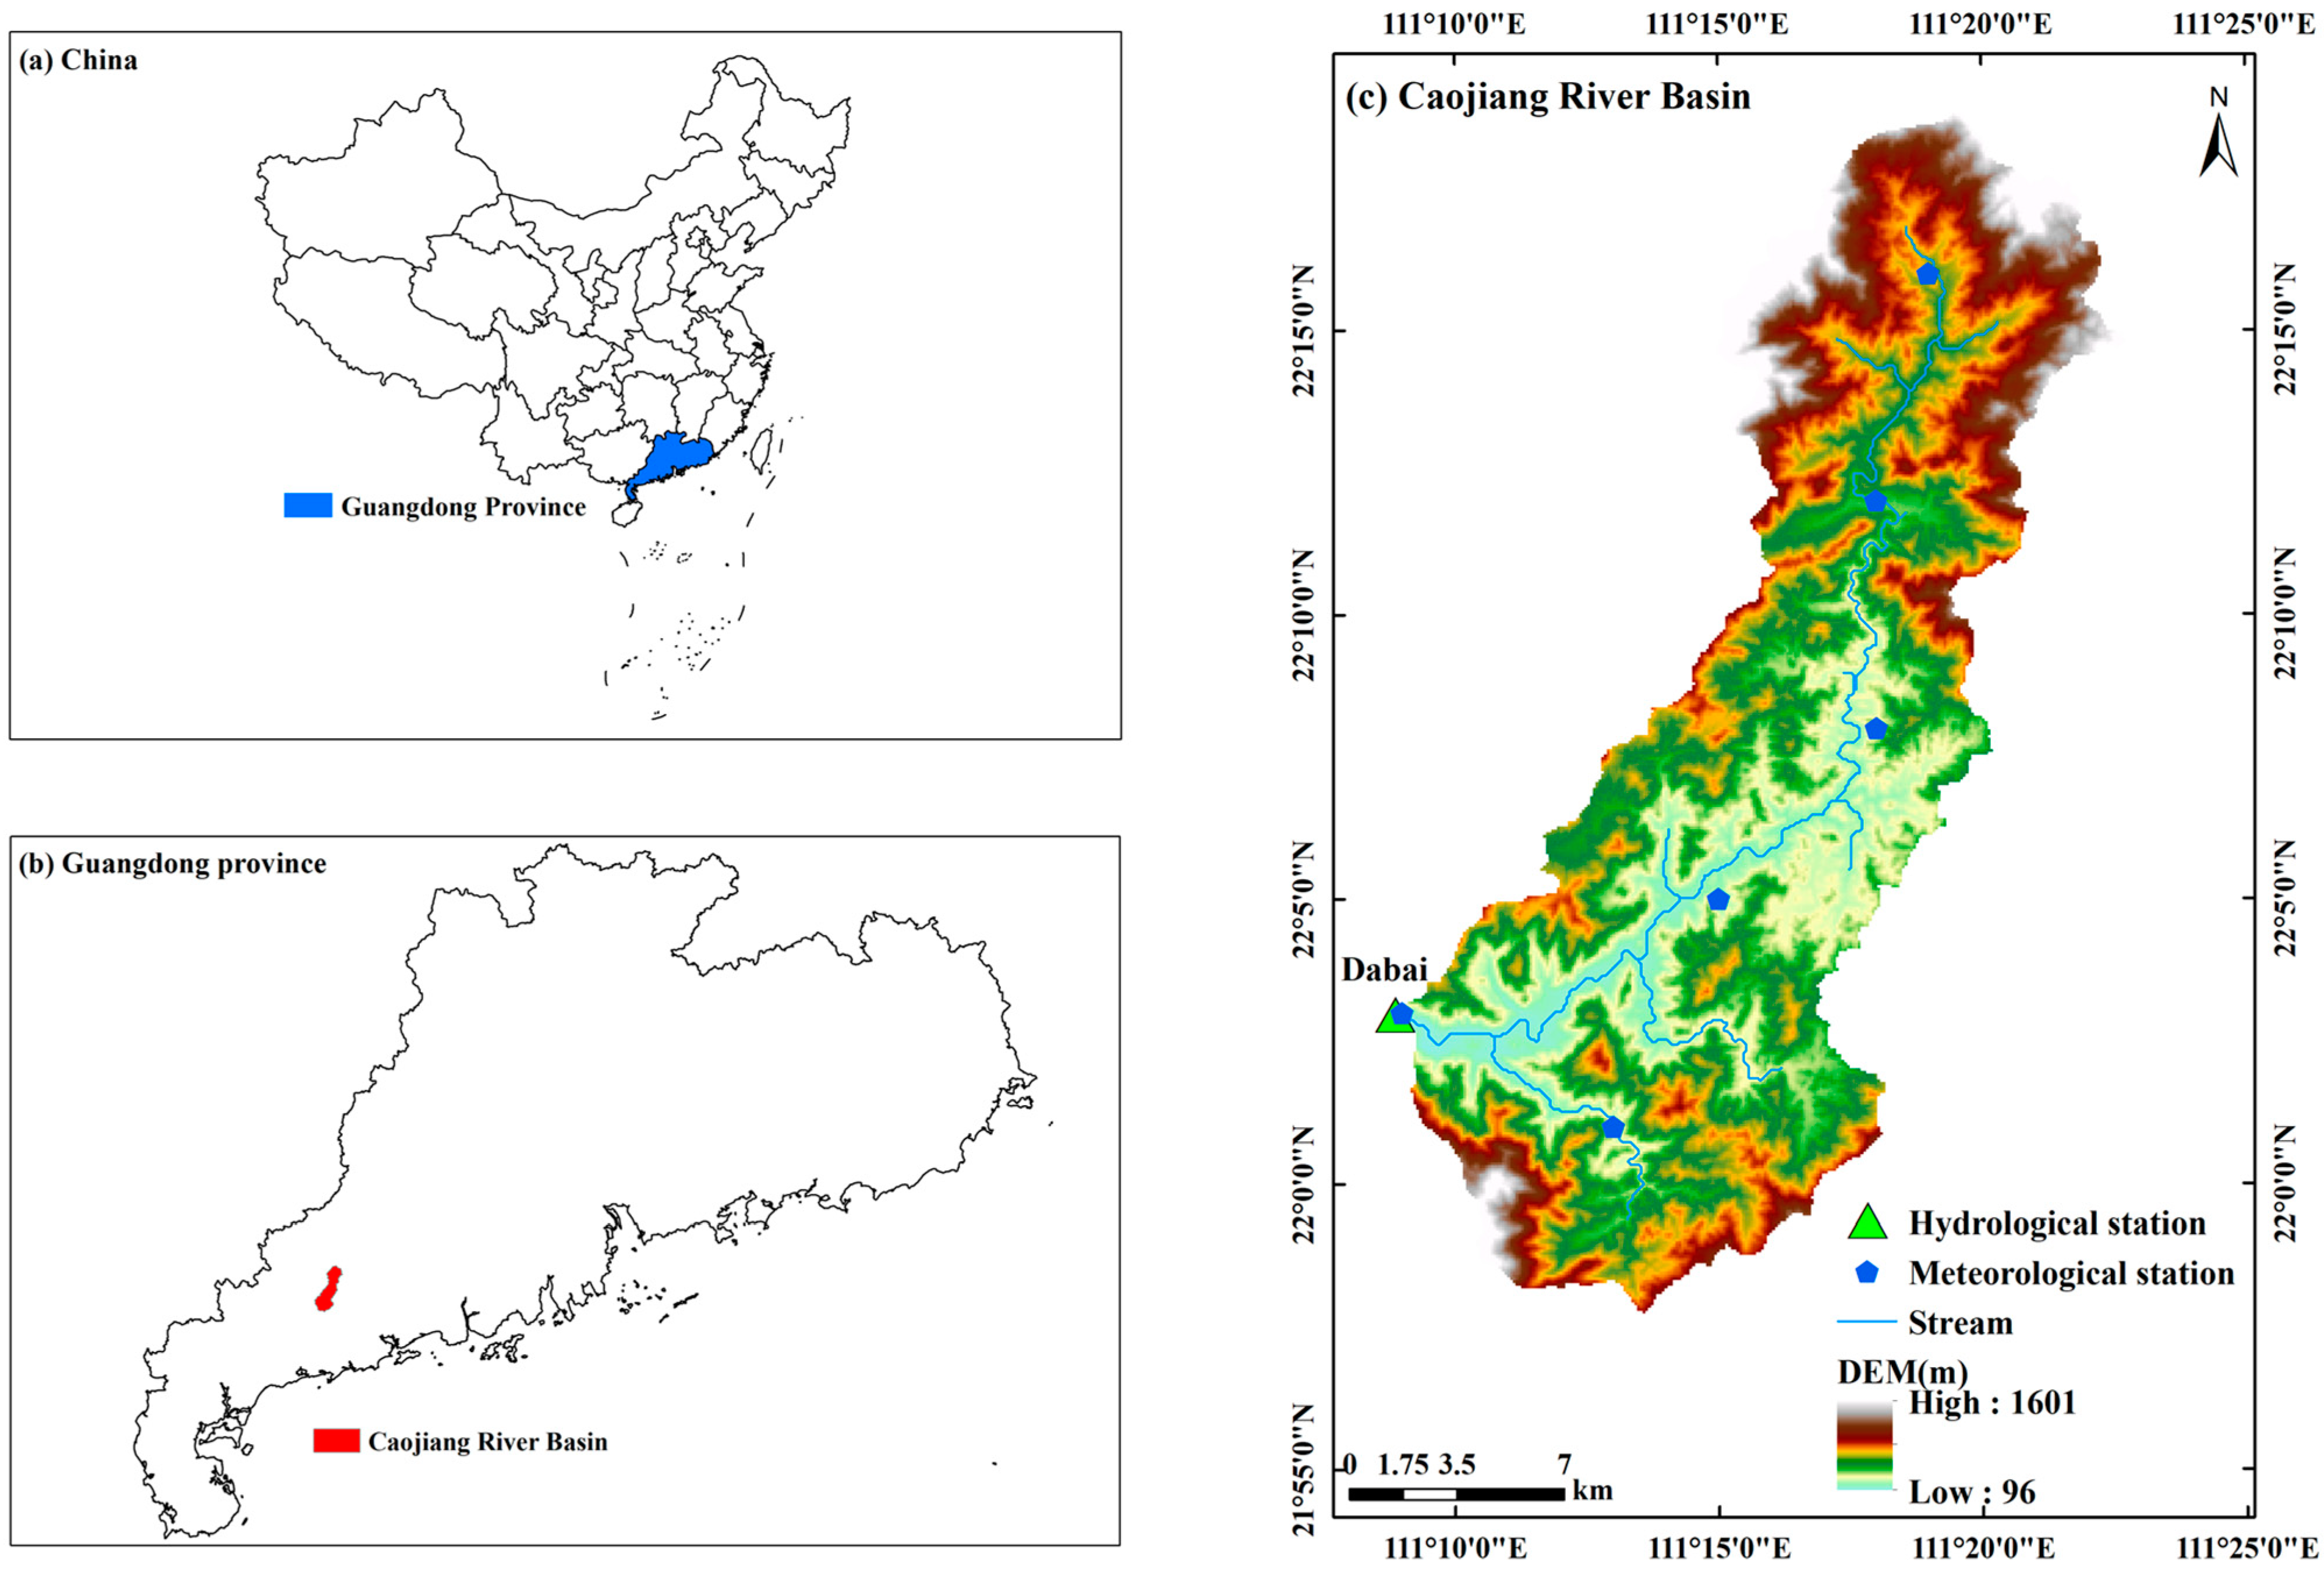
2.1. Study Area
2.2. Data Collection
2.3. Methodology
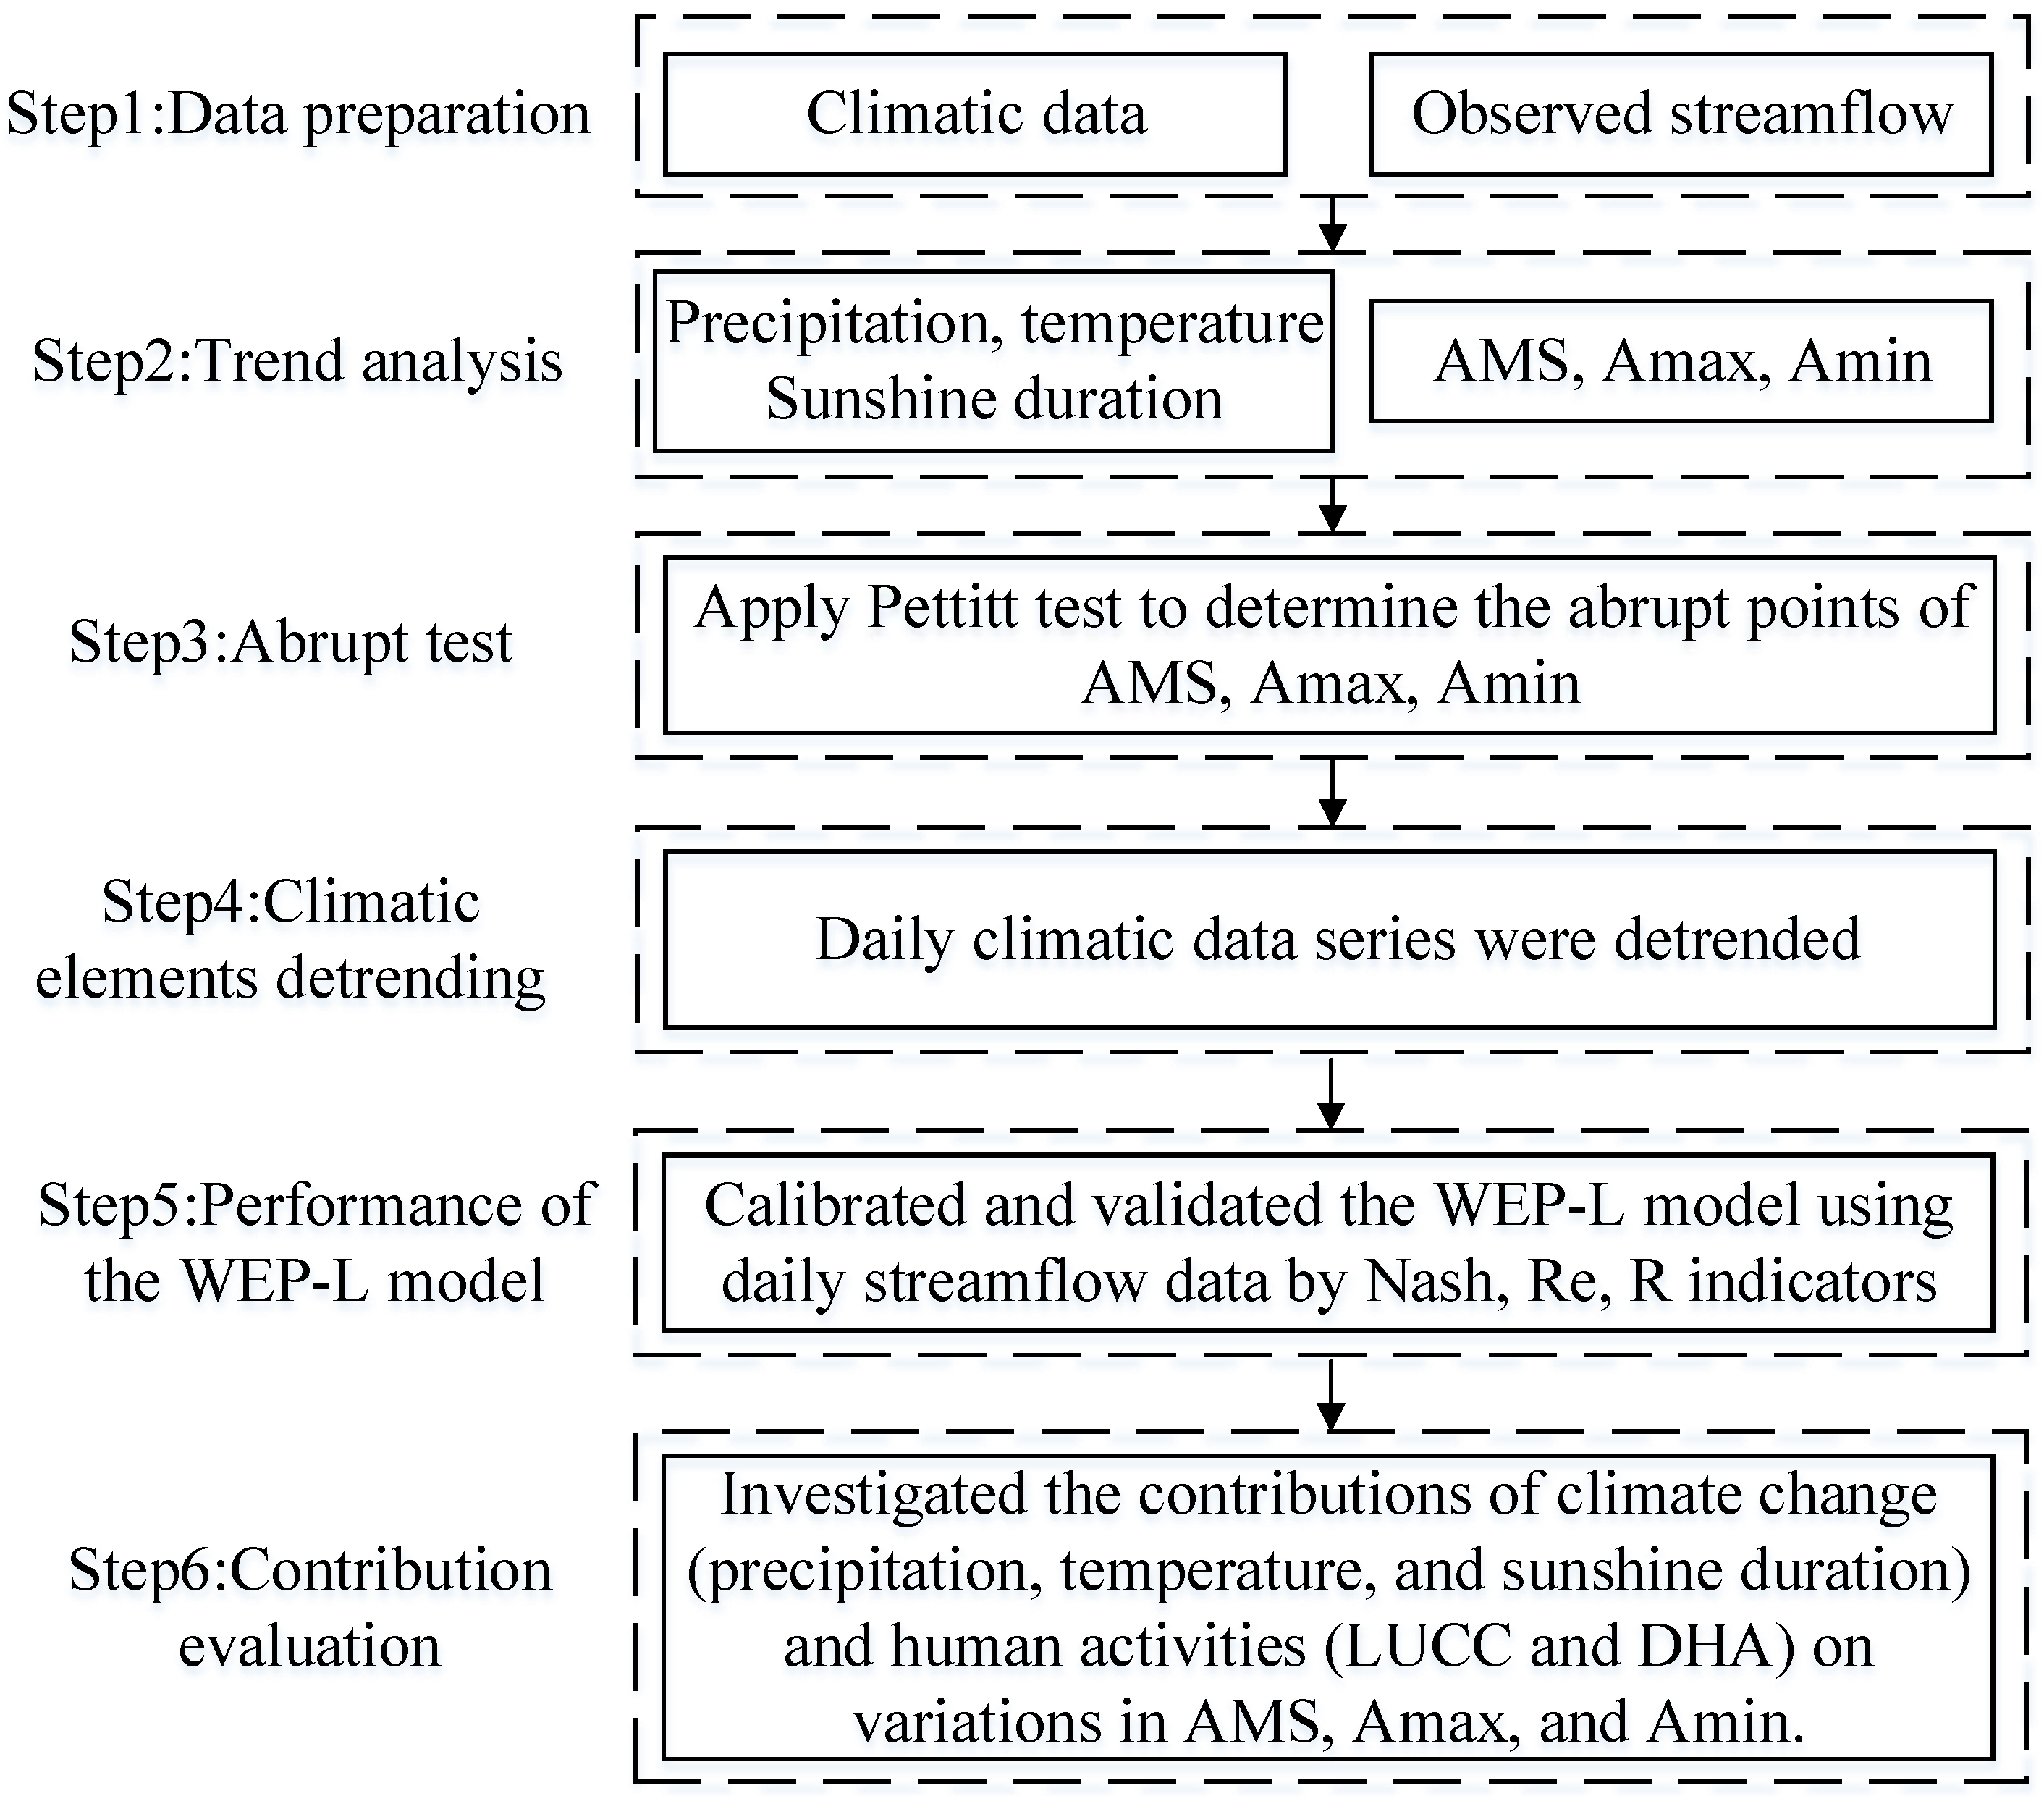
2.3.1. Trend Analysis and Abrupt Test
2.3.2. Hydrological Model
2.3.3. Simulation Scenarios
2.3.4. Contribution Evaluation
3. Results
3.1. Changes in Climatic Elements and Streamflow
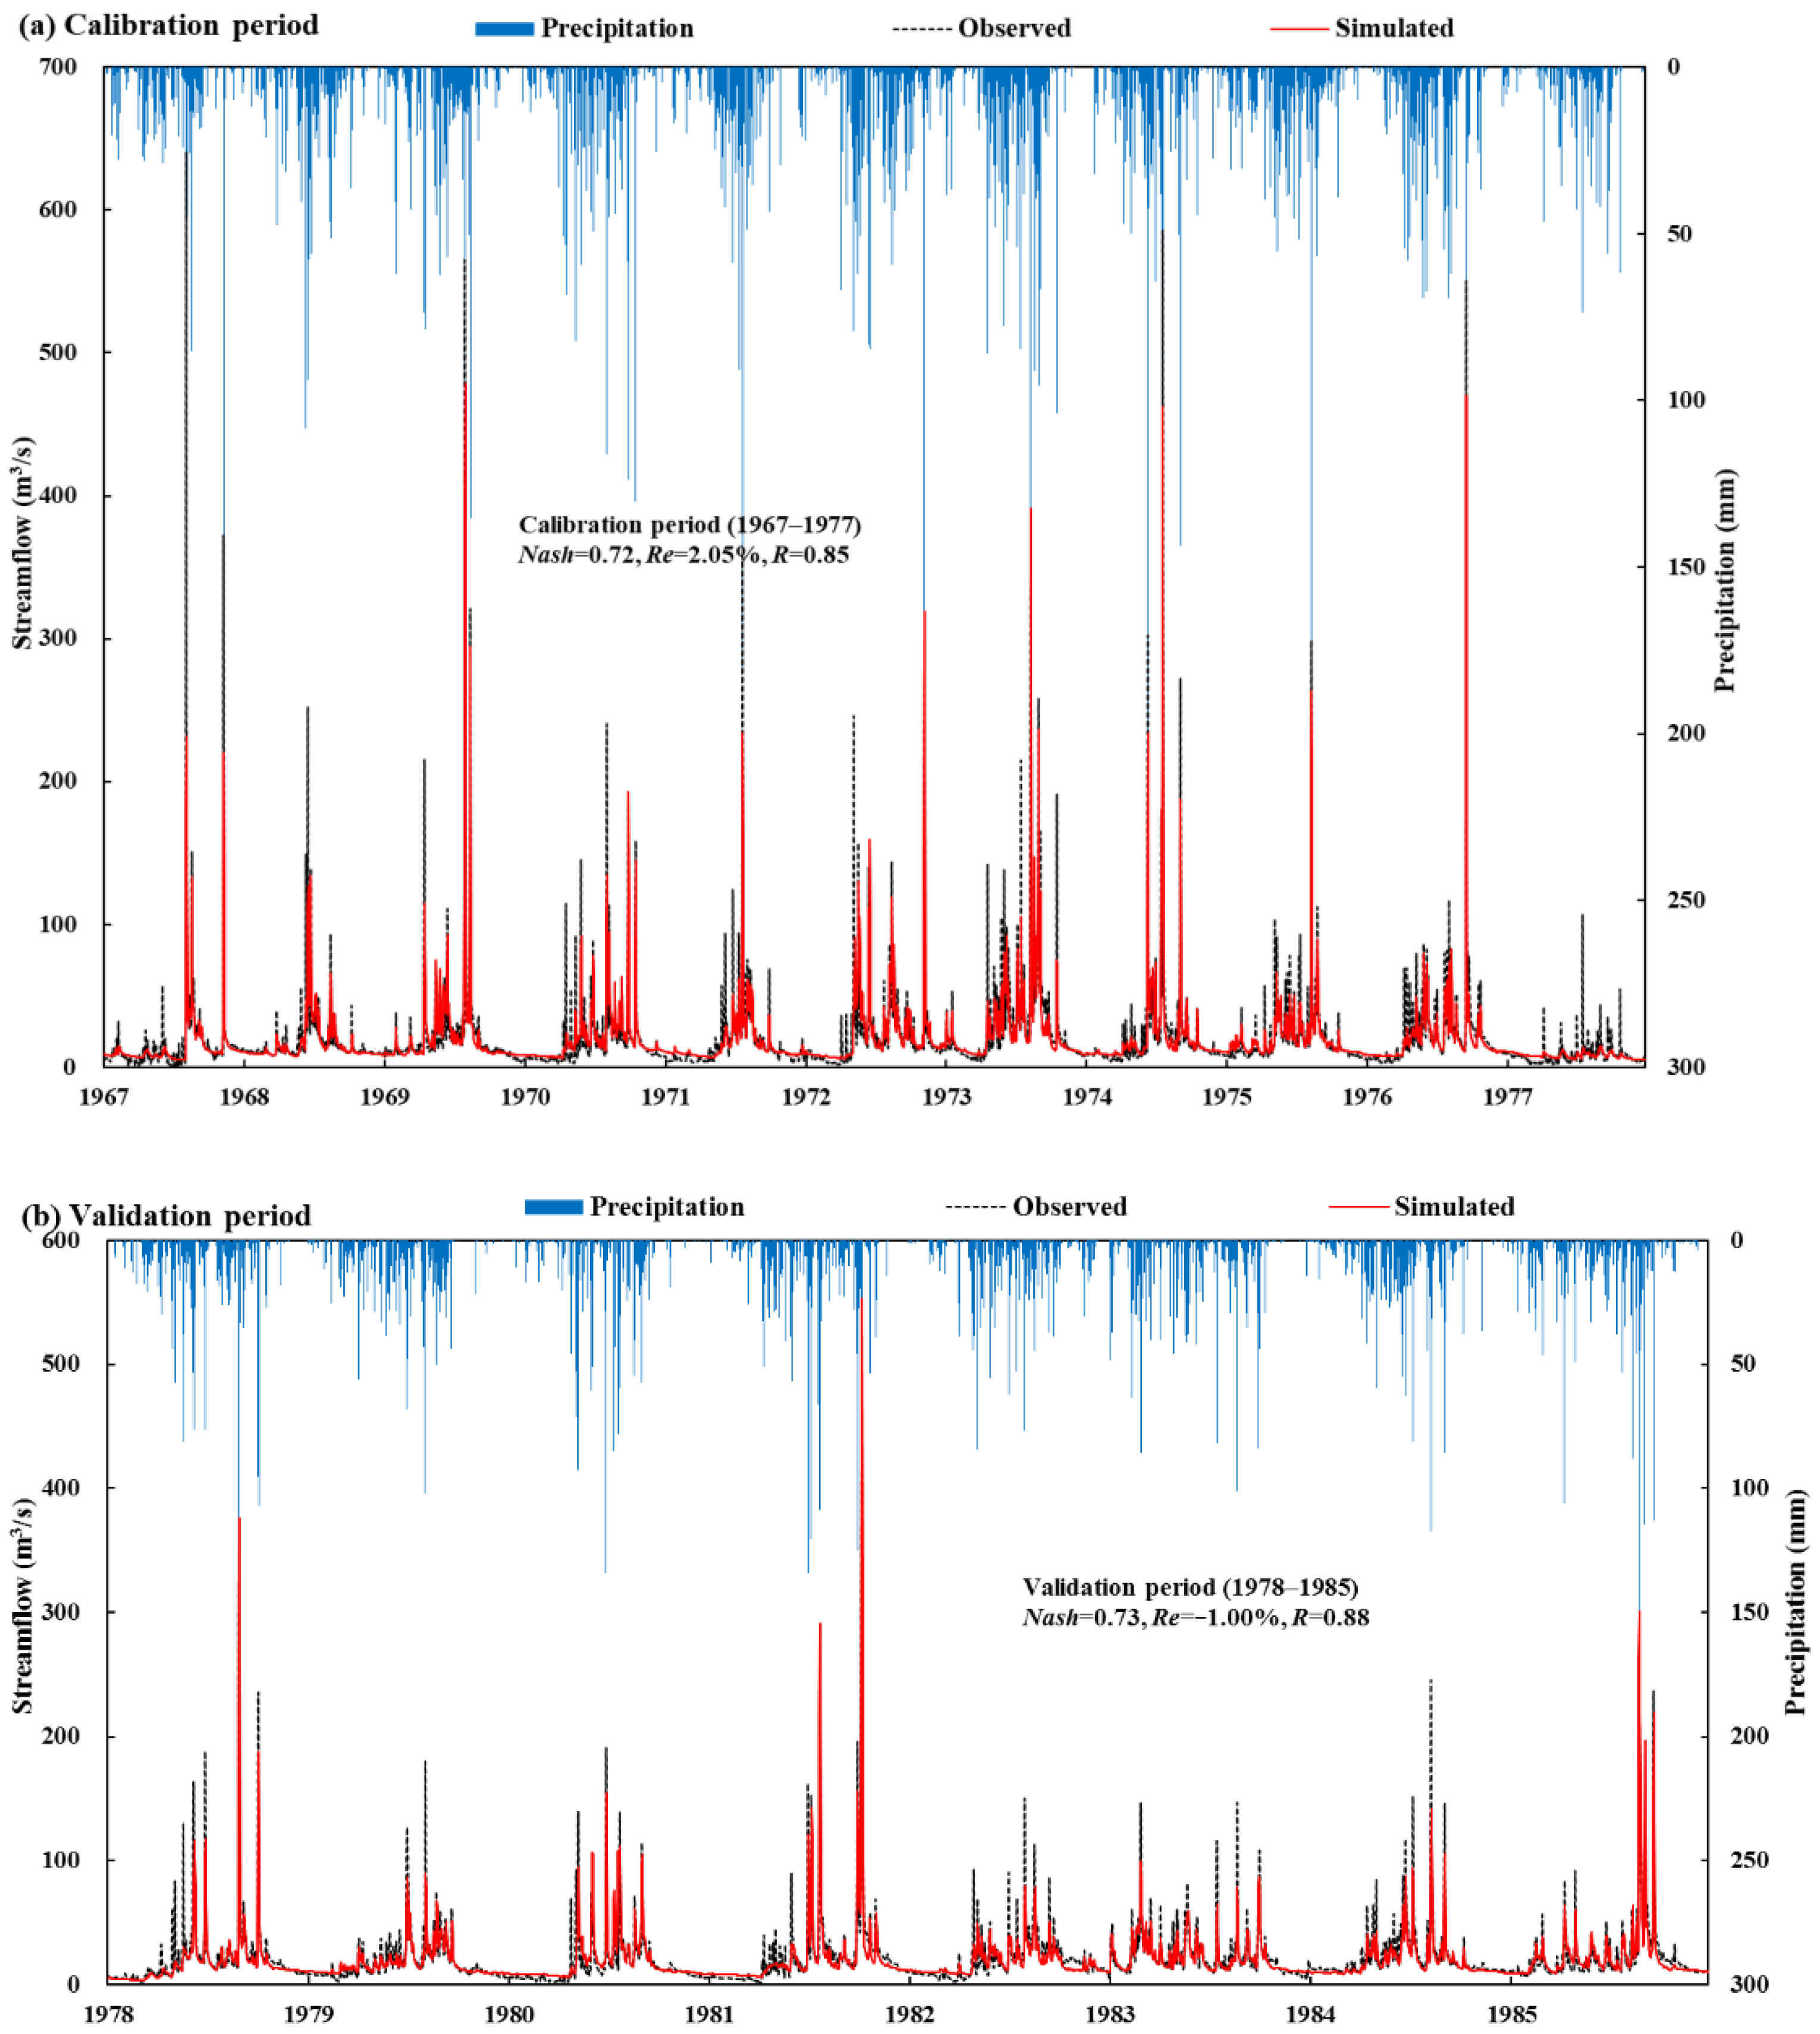
3.2. Performance of the WEP–L Model
3.3. Contribution of Individual Factors to Streamflow Variation
4. Discussion
4.1. Impacts of Climate Change
4.2. Anthropogenic-Related Impacts
5. Conclusions
- (1)
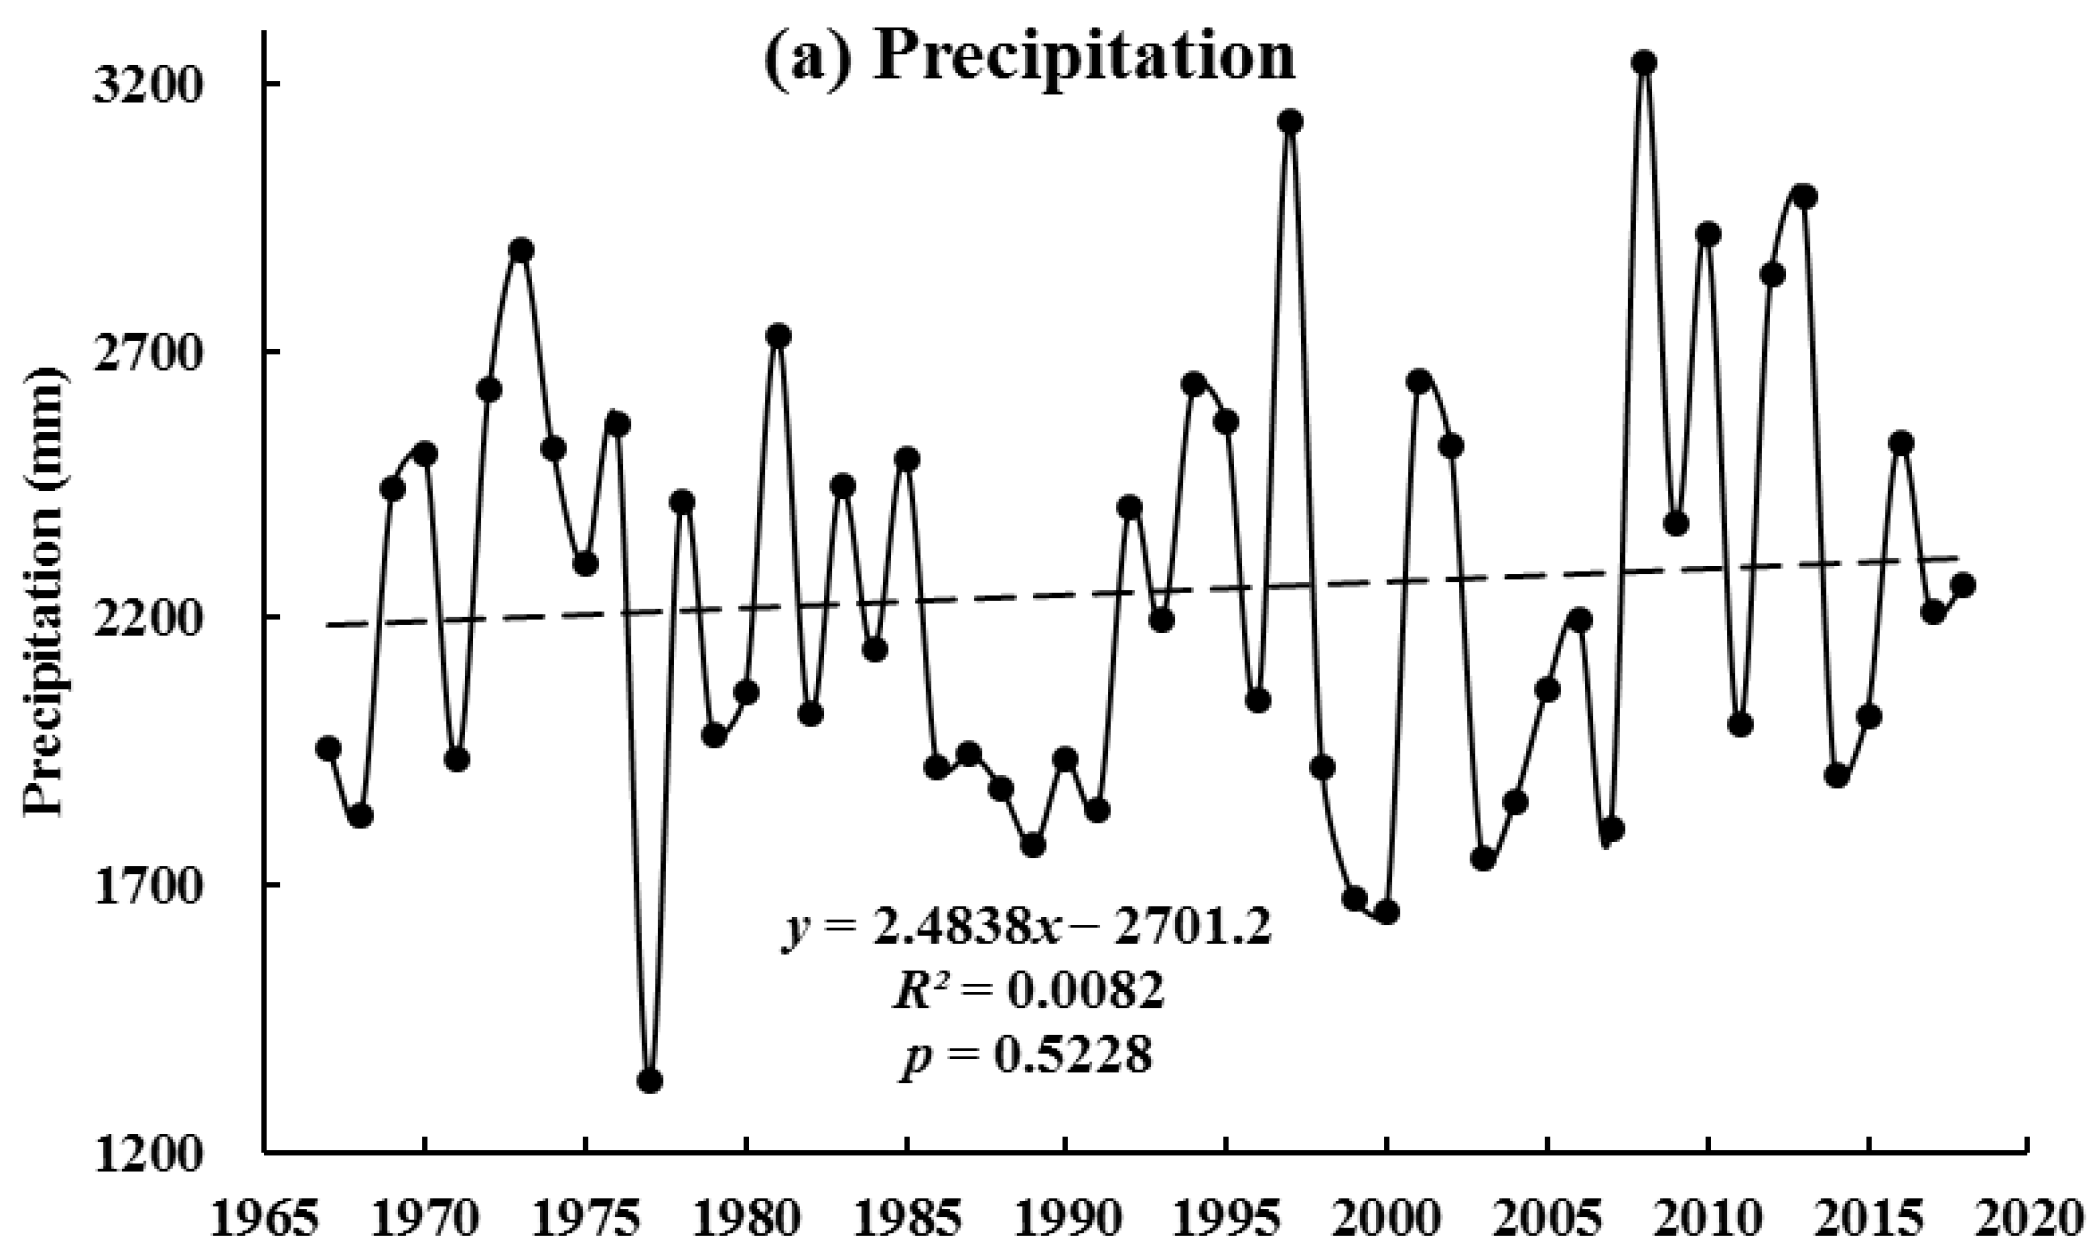
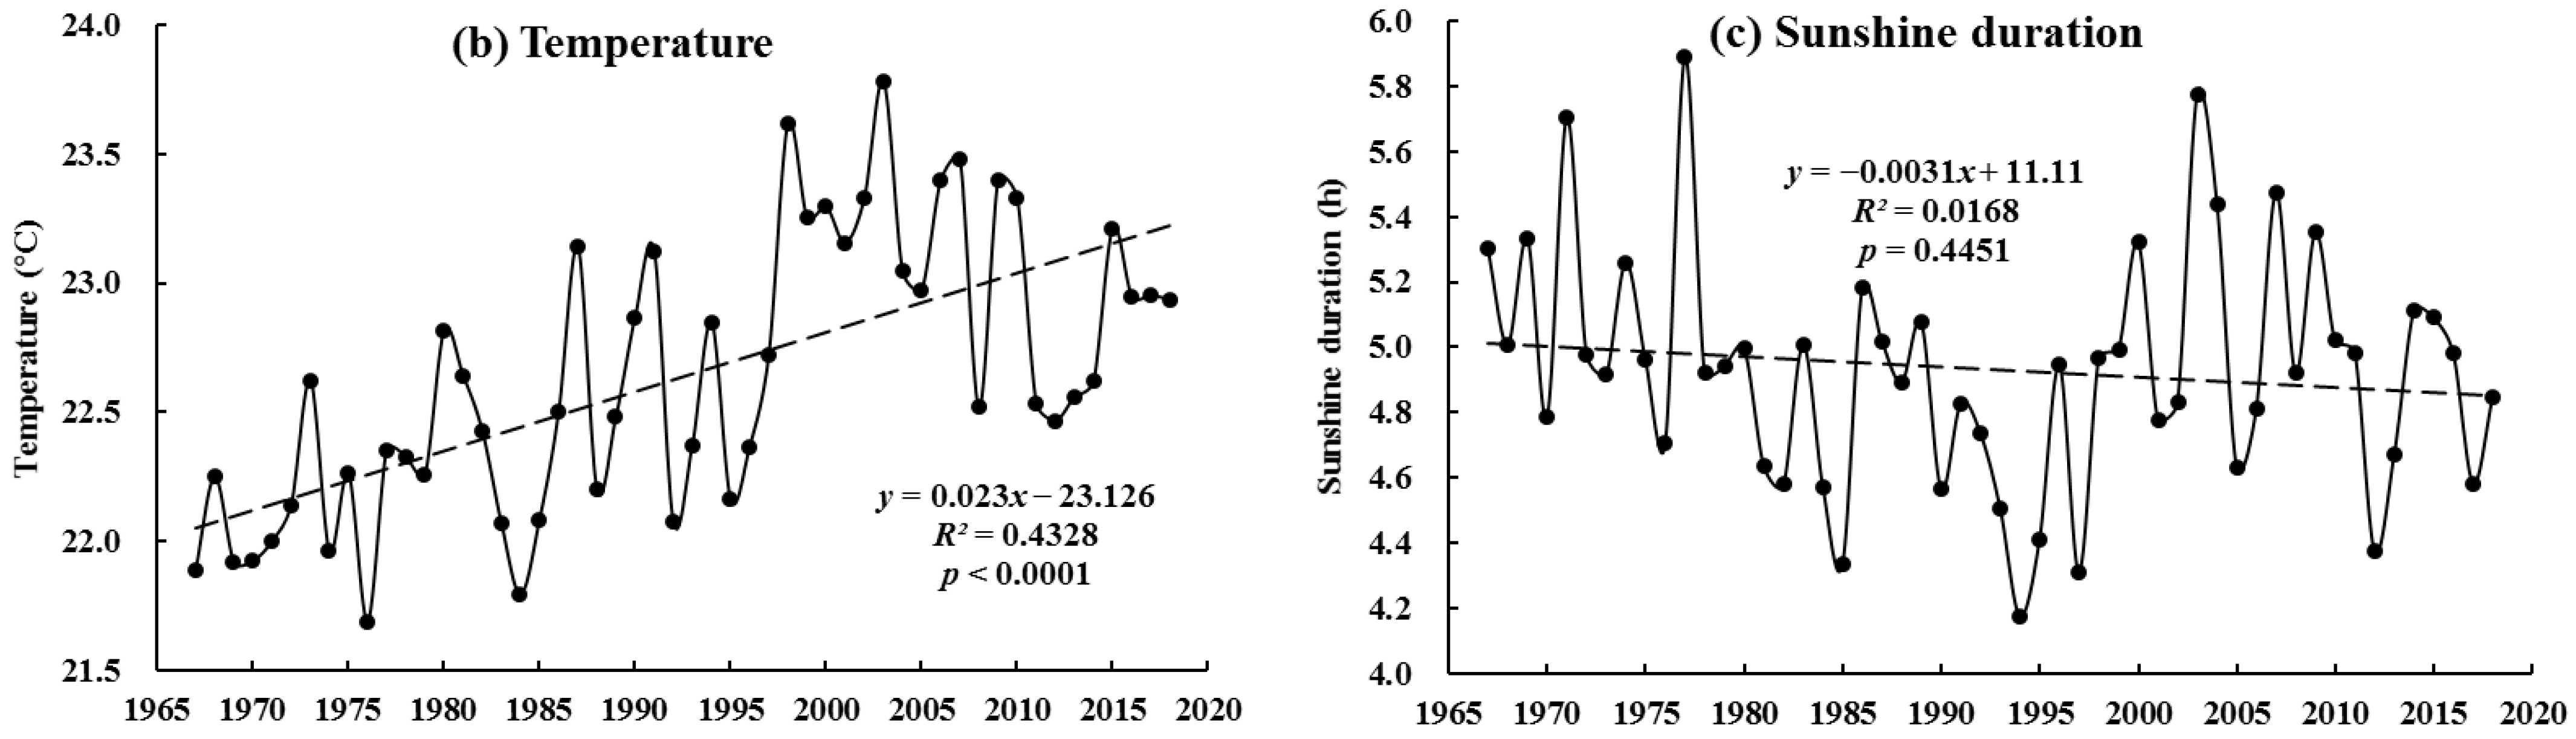
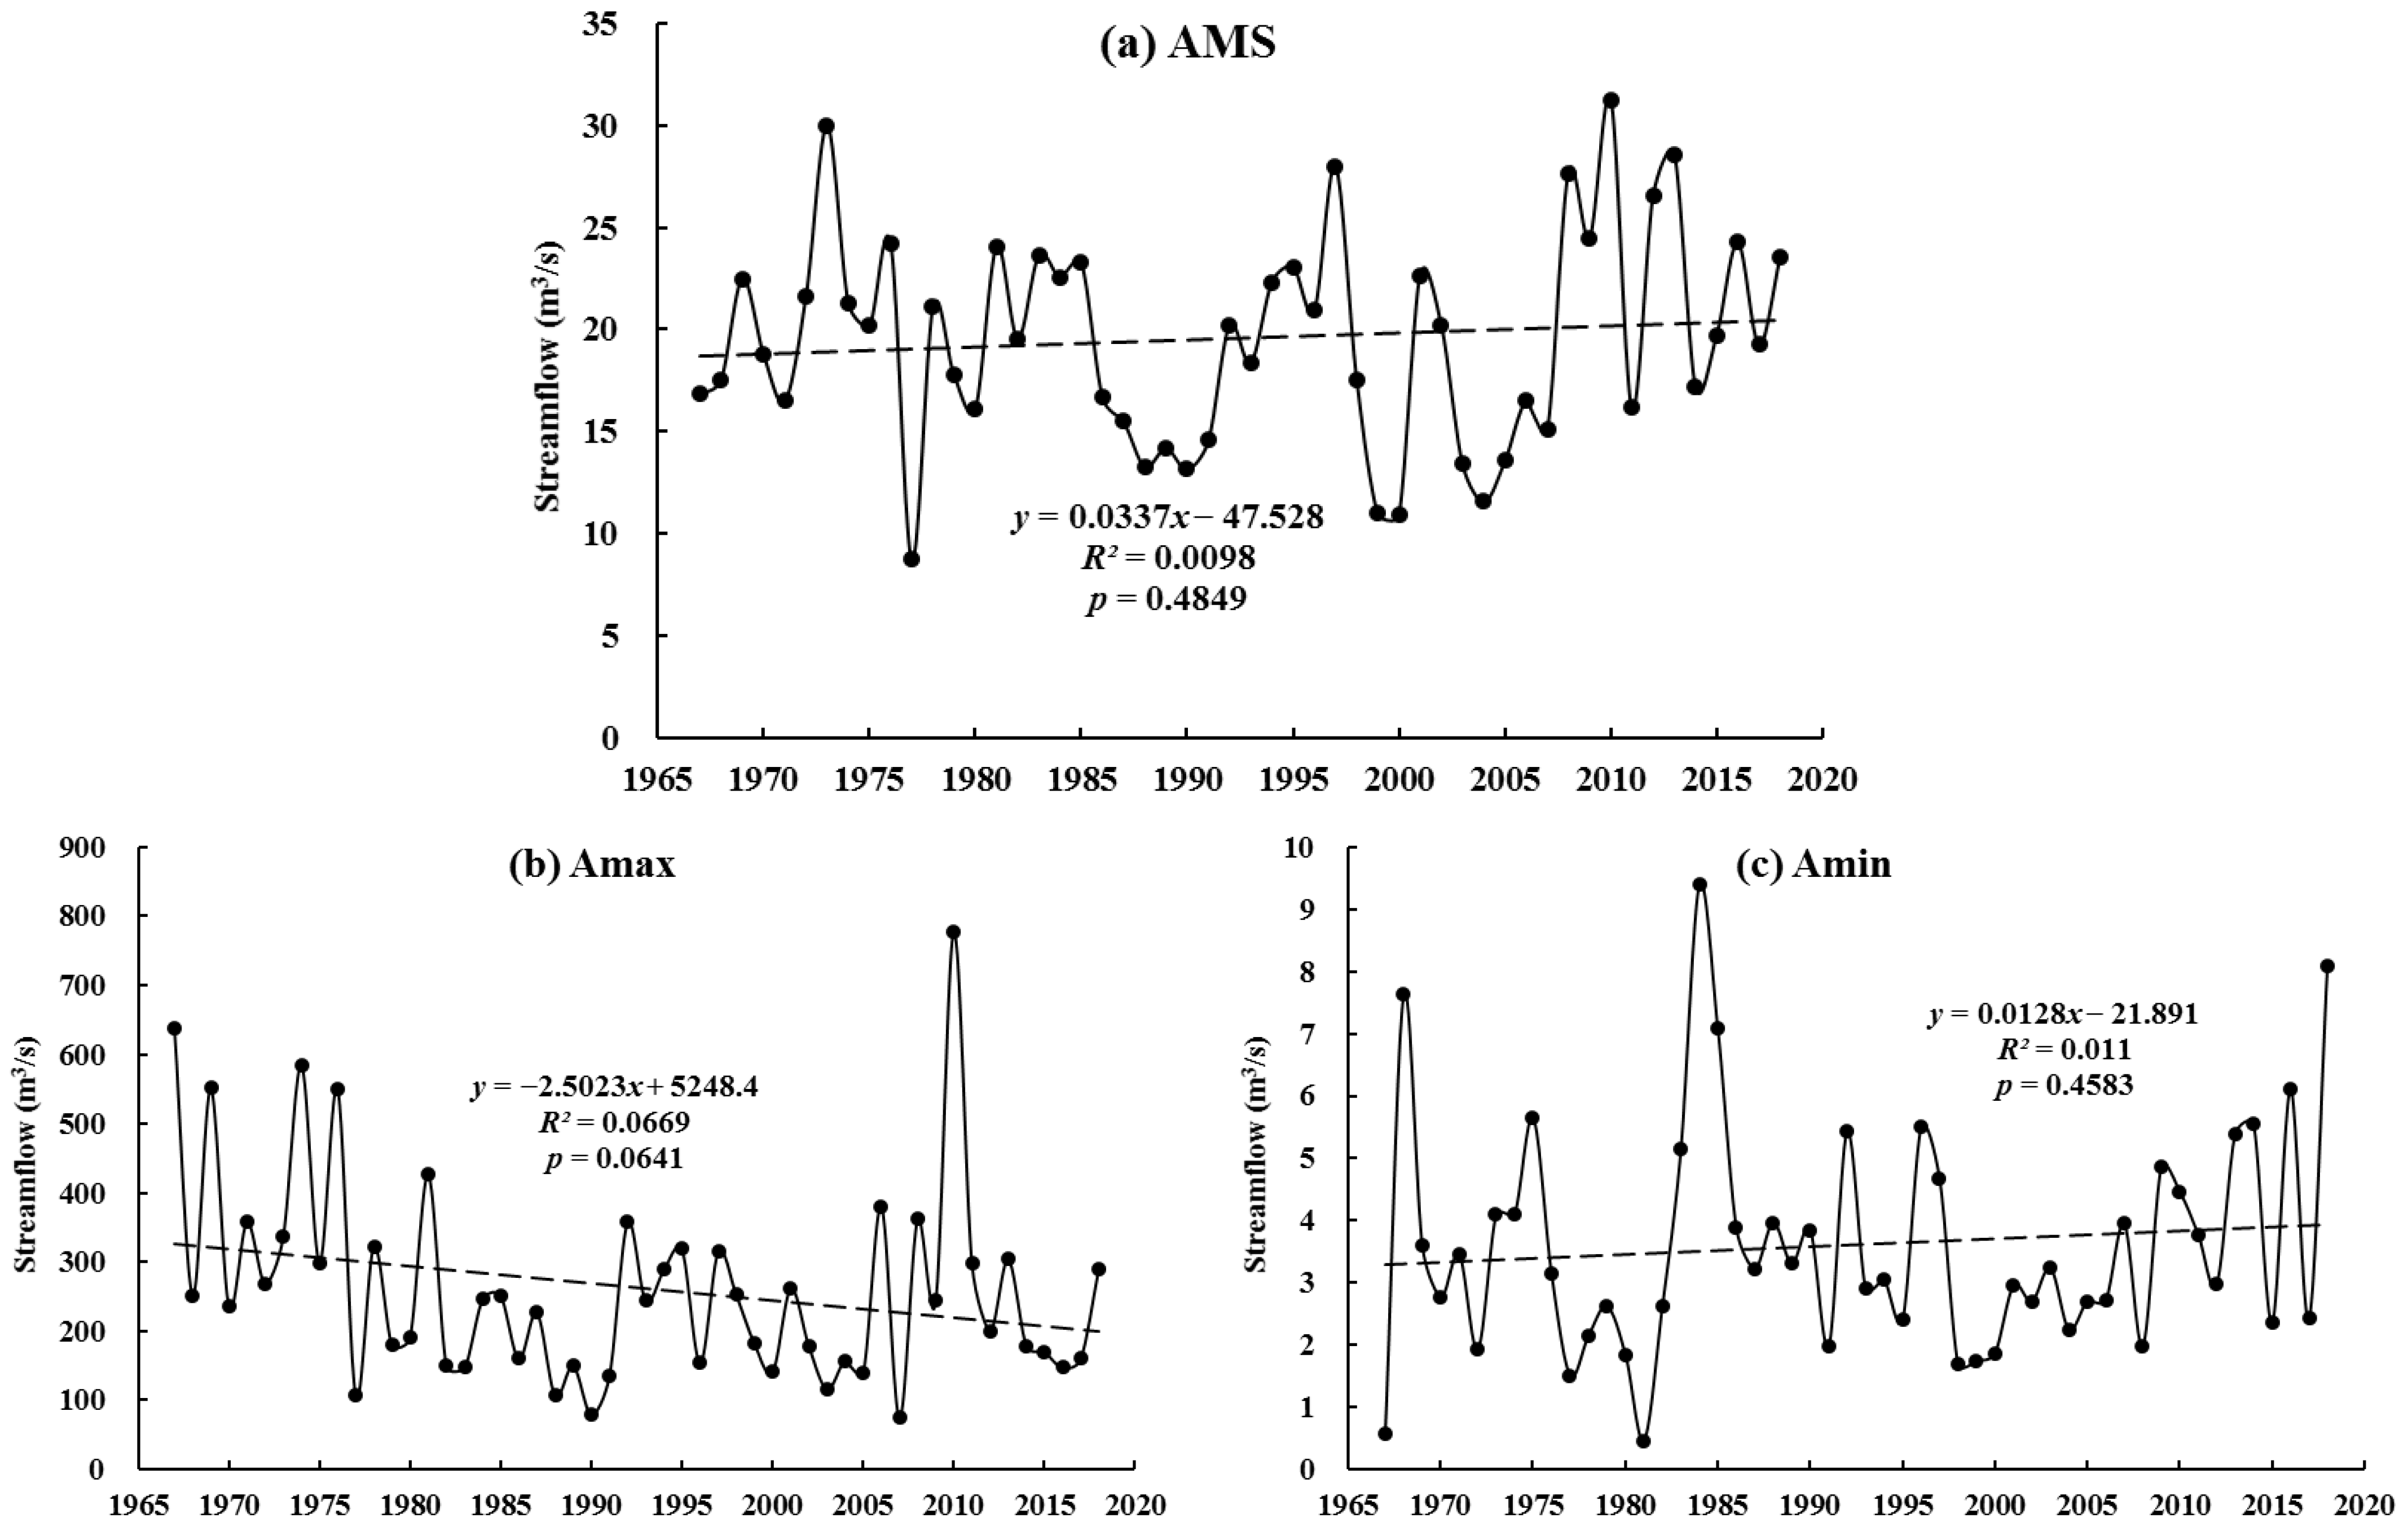
- Precipitation increased slightly at a rate of 24.8 mm/decade while temperature increased significantly at a rate of 0.23 °C/decade, and sunshine duration decreased at a rate of −0.03 h/decade. AMS and Amin increased by 0.34 and 0.13 m3/s/decade, respectively, while Amax decreased at a rate of −25.02 m3/s/decade during this period (1967 to 2018).
- (2)
- Human activities reduced AMS and Amax more than climate change factors. Specifically, human activities increased Amin more than climate change reduced Amin. Anthropogenic activities play a major role in the variations of all three streamflow indicators.
- (3)
- DHAs were the primary cause of changes in the three streamflow indictors, followed by precipitation, while the contribution rates of temperature, sunshine duration, and LUCC were much lower.
Author Contributions
Funding
Institutional Review Board Statement
Informed Consent Statement
Data Availability Statement
Conflicts of Interest
References
- Dey, P.; Mishra, A. Separating the impacts of climate change and human activities on streamflow: A review of methodologies and critical assumptions. J. Hydrol. 2017, 548, 278–290. [Google Scholar] [CrossRef]
- Xin, Z.; Li, Y.; Zhang, L.; Ding, W.; Ye, L.; Wu, J.; Zhang, C. Quantifying the relative contribution of climate and human impacts on seasonal streamflow. J. Hydrol. 2019, 574, 936–945. [Google Scholar] [CrossRef]
- Xu, F.; Jia, Y.; Niu, C.; Liu, J.; Hao, C. Changes in Annual, Seasonal and Monthly Climate and Its Impacts on Runoff in the Hutuo River Basin, China. Water 2018, 10, 278. [Google Scholar] [CrossRef] [Green Version]
- He, Y.; Hu, Y.; Song, J.; Jiang, X. Variation of runoff between southern and northern China and their attribution in the Qinling Mountains, China. Ecol. Eng. 2021, 171, 106374. [Google Scholar] [CrossRef]
- Li, Y.; Liu, C.; Yu, W.; Tian, D.; Bai, P. Response of streamflow to environmental changes: A Budyko-type analysis based on 144 river basins over China. Sci. Total Environ. 2019, 664, 824–833. [Google Scholar] [CrossRef] [PubMed]
- Gudmundsson, L.; Boulange, J.; Do, H.X.; Gosling, S.N.; Grillakis, M.G.; Koutroulis, A.G.; Leonard, M.; Liu, J.; Schmied, H.M.; Papadimitriou, L.; et al. Globally observed trends in mean and extreme river flow attributed to climate change. Science 2021, 371, 1159–1162. [Google Scholar] [CrossRef] [PubMed]
- Luan, J.; Zhang, Y.; Ma, N.; Tian, J.; Li, X.; Liu, D. Evaluating the uncertainty of eight approaches for separating the impacts of climate change and human activities on streamflow. J. Hydrol. 2021, 601, 126605. [Google Scholar] [CrossRef]
- Kazemi, H.; Hashemi, H.; Maghsood, F.F.; Hosseini, S.H.; Sarukkalige, R.; Jamali, S.; Berndtsson, R. Climate vs. Human Impact: Quantitative and Qualitative Assessment of Streamflow Variation. Water 2021, 13, 2404. [Google Scholar] [CrossRef]
- AghaKouchak, A.; Feldman, D.; Hoerling, M.; Huxman, T.; Lund, J. Water and climate: Recognize anthropogenic drought. Nature 2015, 524, 409–411. [Google Scholar] [CrossRef] [Green Version]
- Michalak, A.M. Study role of climate change in extreme threats to water quality. Nature 2016, 535, 349–350. [Google Scholar] [CrossRef]
- Zhang, M.; Wei, X. Deforestation, forestation, and water supply. Science 2021, 371, 990–991. [Google Scholar] [CrossRef]
- Xie, Z.; Mu, X.; Gao, P.; Wu, C.; Qiu, D. Impacts of Climate and Anthropogenic Activities on Streamflow Regimes in the Beiluo River, China. Water 2021, 13, 2892. [Google Scholar] [CrossRef]
- Young, D.; Zégre, N.; Edwards, P.; Fernandez, R. Assessing streamflow sensitivity of forested headwater catchments to disturbance and climate change in the central Appalachian Mountains region, USA. Sci. Total Environ. 2019, 694, 133382. [Google Scholar] [CrossRef]
- Yang, H.; Xiong, L.; Xiong, B.; Zhang, Q.; Xu, C.-Y. Separating runoff change by the improved Budyko complementary relationship considering effects of both climate change and human activities on basin characteristics. J. Hydrol. 2020, 591, 125330. [Google Scholar] [CrossRef]
- Sun, W.; Song, X.; Zhang, Y.; Chiew, F.; Post, D.; Zheng, H.; Song, S. Coal Mining Impacts on Baseflow Detected Using Paired Catchments. Water Resour. Res. 2020, 56, e2019WR025770. [Google Scholar] [CrossRef]
- Zeng, F.; Ma, M.-G.; Di, D.-R.; Shi, W.-Y. Separating the Impacts of Climate Change and Human Activities on Runoff: A Review of Method and Application. Water 2020, 12, 2201. [Google Scholar] [CrossRef]
- Wang, S.; Wang, Y.; Ran, L.; Su, T. Climatic and anthropogenic impacts on runoff changes in the Songhua River basin over the last 56 years (1955–2010), Northeastern China. Catena 2015, 127, 258–269. [Google Scholar] [CrossRef]
- Zhang, L.; Nan, Z.; Wang, W.; Ren, D.; Zhao, Y.; Wu, X. Separating climate change and human contributions to variations in streamflow and its components using eight time-trend methods. Hydrol. Process. 2019, 33, 383–394. [Google Scholar] [CrossRef]
- Li, Z.; Huang, S.; Liu, D.; Leng, G.; Zhou, S.; Huang, Q. Assessing the effects of climate change and human activities on runoff variations from a seasonal perspective. Stoch. Environ. Res. Risk Assess. 2020, 34, 575–592. [Google Scholar] [CrossRef]
- Zhai, R.; Tao, F. Contributions of climate change and human activities to runoff change in seven typical catchments across China. Sci. Total Environ. 2017, 605–606, 219–229. [Google Scholar] [CrossRef] [PubMed]
- Ji, L.; Duan, K. What is the main driving force of hydrological cycle variations in the semiarid and semi-humid Weihe River Basin, China? Sci. Total Environ. 2019, 684, 254–264. [Google Scholar] [CrossRef] [PubMed]
- Wu, L.; Zhang, X.; Hao, F.; Wu, Y.; Li, C.; Xu, Y. Evaluating the contributions of climate change and human activities to runoff in typical semi-arid area, China. J. Hydrol. 2020, 590, 125555. [Google Scholar] [CrossRef]
- Zhang, H.; Meng, C.; Wang, Y.; Wang, Y.; Li, M. Comprehensive evaluation of the effects of climate change and land use and land cover change variables on runoff and sediment discharge. Sci. Total Environ. 2020, 702, 134401. [Google Scholar] [CrossRef] [PubMed]
- Huo, J.; Liu, C.; Yu, X.; Jia, G.; Chen, L. Effects of watershed char and climate variables on annual runoff in different climatic zones in China. Sci. Total Environ. 2021, 754, 142157. [Google Scholar] [CrossRef]
- Yang, Q.; Luo, S.; Wu, H.; Wang, G.; Han, D.; Lü, H.; Shao, J. Attribution Analysis for Runoff Change on Multiple Scales in a Humid Subtropical Basin Dominated by Forest, East China. Forests 2019, 10, 184. [Google Scholar] [CrossRef] [Green Version]
- Konapala, G.; Mishra, A.K.; Wada, Y.; Mann, M.E. Climate change will affect global water availability through compounding changes in seasonal precipitation and evaporation. Nat. Commun. 2020, 11, 3044. [Google Scholar] [CrossRef]
- Wu, Y.; Fang, H.; Huang, L.; Ouyang, W. Changing runoff due to temperature and precipitation variations in the dammed Jinsha River. J. Hydrol. 2020, 582, 124500. [Google Scholar] [CrossRef]
- Yang, W.; Jin, F.; Si, Y.; Li, Z. Runoff change controlled by combined effects of multiple environmental factors in a headwater catchment with cold and arid climate in northwest China. Sci. Total Environ. 2021, 756, 143995. [Google Scholar] [CrossRef]
- Wang, D.; Hejazi, M. Quantifying the relative contribution of the climate and direct human impacts on mean annual streamflow in the contiguous United States. Water Resour. Res. 2011, 47, 411. [Google Scholar] [CrossRef] [Green Version]
- Patterson, L.A.; Lutz, B.; Doyle, M.W. Climate and direct human contributions to changes in mean annual streamflow in the South Atlantic, USA. Water Resour. Res. 2013, 49, 7278–7291. [Google Scholar] [CrossRef]
- Xu, X.; Yang, D.; Yang, H.; Lei, H. Attribution analysis based on the Budyko hypothesis for detecting the dominant cause of runoff decline in Haihe basin. J. Hydrol. 2014, 510, 530–540. [Google Scholar] [CrossRef]
- Wang, X.; He, K.; Dong, Z. Effects of climate change and human activities on runoff in the Beichuan River Basin in the northeastern Tibetan Plateau, China. Catena 2019, 176, 81–93. [Google Scholar] [CrossRef]
- Hou, J.; Ye, A.; You, J.; Ma, F.; Duan, Q. An estimate of human and natural contributions to changes in water resources in the upper reaches of the Minjiang River. Sci. Total Environ. 2018, 635, 901–912. [Google Scholar] [CrossRef] [PubMed]
- Han, Z.; Long, D.; Fang, Y.; Hou, A.; Hong, Y. Impacts of climate change and human activities on the flow regime of the dammed Lancang River in Southwest China. J. Hydrol. 2019, 570, 96–105. [Google Scholar] [CrossRef]
- Zhou, X.; Yang, Y.; Sheng, Z.; Zhang, Y. Reconstructed natural runoff helps to quantify the relationship between upstream water use and downstream water scarcity in China’s river basins. Hydrol. Earth Syst. Sci. 2019, 23, 2491–2505. [Google Scholar] [CrossRef] [Green Version]
- Huang, Z.; Yuan, X.; Liu, X. The key drivers for the changes in global water scarcity: Water withdrawal versus water availability. J. Hydrol. 2021, 601, 126658. [Google Scholar] [CrossRef]
- Liang, W.; Bai, D.; Wang, F.; Fu, B.; Yan, J.; Wang, S.; Yang, Y.; Long, D.; Feng, M. Quantifying the impacts of climate change and ecological restoration on streamflow changes based on a Budyko hydrological model in China’s Loess Plateau. Water Resour. Res. 2015, 51, 6500–6519. [Google Scholar] [CrossRef]
- Chang, J.; Zhang, H.; Wang, Y.; Zhu, Y. Assessing the impact of climate variability and human activities on streamflow variation. Hydrol. Earth Syst. Sci. 2016, 20, 1547–1560. [Google Scholar] [CrossRef] [Green Version]
- Wang, D.; Yu, X.; Jia, G.; Wang, H. Sensitivity analysis of runoff to climate variability and land-use changes in the Haihe Basin mountainous area of north China. Agric. Ecosyst. Environ. 2019, 269, 193–203. [Google Scholar] [CrossRef]
- Li, H.; Shi, C.; Sun, P.; Zhang, Y.; Collins, A.L. Attribution of runoff changes in the main tributaries of the middle Yellow River, China, based on the Budyko model with a time-varying parameter. Catena 2021, 206, 105557. [Google Scholar] [CrossRef]
- Bai, P.; Liu, X.; Liang, K.; Liu, C. Investigation of changes in the annual maximum flood in the Yellow River basin, China. Quat. Int. 2016, 392, 168–177. [Google Scholar] [CrossRef]
- Wang, W.; Zhang, Y.; Tang, Q. Impact assessment of climate change and human activities on streamflow signatures in the Yellow River Basin using the Budyko hypothesis and derived differential equation. J. Hydrol. 2020, 591, 125460. [Google Scholar] [CrossRef]
- Mann, H. Non-parametric test against trend. Econometrika 1945, 13, 245–259. [Google Scholar] [CrossRef]
- Kendall, M.G. Rank Correlation Measures; Charles Griffin: London, UK, 1975. [Google Scholar]
- Pettitt, A.N. A Non-Parametric Approach to the Change-Point Problem. J. R. Stat. Soc. Ser. C (Appl. Stat.) 1979, 28, 126–135. [Google Scholar] [CrossRef]
- Jia, Y.; Wang, H.; Zhou, Z.; Qiu, Y.; Luo, X.; Wang, J.; Yan, D.; Qin, D. Development of the WEP-L distributed hydrological model and dynamic assessment of water resources in the Yellow River basin. J. Hydrol. 2006, 331, 606–629. [Google Scholar] [CrossRef]
- Jia, Y.; Ding, X.; Wang, H.; Zhou, Z.; Qiu, Y.; Niu, C. Attribution of water resources evolution in the highly water-stressed Hai River Basin of China. Water Resour. Res. 2012, 48, W02513. [Google Scholar] [CrossRef]
- Xu, F.; Jia, Y.; Peng, H.; Niu, C.; Liu, J.; Hao, C.; Huang, G. Vertical zonality of the water cycle and the impact of land-use change on runoff in the Qingshui River Basin of Wutai Mountain, China. Hydrol. Sci. J. 2019, 64, 2080–2092. [Google Scholar] [CrossRef]
- Xu, F.; Jia, Y.; Niu, C.; Sobkowiak, L.; Zhao, L. Evaluating spatial differences in the contributions of climate variability and human activity to runoff change in the Haihe River basin. Hydrol. Sci. J. 2021, 66, 2060–2073. [Google Scholar] [CrossRef]
- Zhou, X.; Huang, G.; Piwowar, J.; Fan, Y.; Wang, X.; Li, Z.; Cheng, G. Hydrologic Impacts of Ensemble-RCM-Projected Climate Changes in the Athabasca River Basin, Canada. J. Hydrometeorol. 2018, 19, 1953–1971. [Google Scholar] [CrossRef] [Green Version]
- Liu, J.; Zhou, Z.; Yan, Z.; Gong, J.; Jia, L.; Xu, C.Y.; Wang, H. A new approach to separating the impacts of climate change and multiple human activities on water cycle processes based on a distributed hydrological model. J. Hydrol. 2019, 578, 124096. [Google Scholar] [CrossRef]
- Xu, F.; Zhao, L.; Jia, Y.; Niu, C.; Liu, X.; Liu, H. Evaluation of water conservation function of Beijiang River basin in Nanling Mountains, China, based on WEP-L model. Ecol. Indic. 2021, 134, 108383. [Google Scholar] [CrossRef]
- Tong, S.; Li, X.; Zhang, J.; Bao, Y.; Bao, Y.; Na, L.; Si, A. Spatial and temporal variability in extreme temperature and precipitation events in Inner Mongolia (China) during 1960–2017. Sci. Total Environ. 2019, 649, 75–89. [Google Scholar] [CrossRef] [PubMed]


| Scenario | Precipitation | Temperature | Sunshine Duration | LUCC during | Streamflow | Objectives |
|---|---|---|---|---|---|---|
| S1 | Real | Real | Real | 1980 | Simulated by WEP–L | Analyze the effects of climate change |
| S2 | Detrended | Real | Real | 1980 | Simulated by WEP–L | Analyze the effects of precipitation |
| S3 | Real | Detrended | Real | 1980 | Simulated by WEP–L | Analyze the effects of temperature |
| S4 | Real | Real | Detrended | 1980 | Simulated by WEP–L | Analyze the effects of sunshine duration |
| S5 | Real | Real | Real | 2014 | Simulated by WEP–L | Analyze the effects of LUCC |
| AMS | Amax | Amin | |||||||
|---|---|---|---|---|---|---|---|---|---|
| 1967–1985 | 1986–2018 | Chang Rate (%) | 1967–1981 | 1982–2018 | Chang Rate (%) | 1967–1982 | 1983–2018 | Chang Rate (%) | |
| Streamflow (m3/s) | 20.3 | 19.1 | −5.86 | 353.6 | 225.6 | −36.19 | 3.0 | 3.9 | 28.82 |
| AAP (mm) | 2273.9 | 2232.8 | −1.81 | 2273.1 | 2237.5 | −1.56 | 2257.4 | 2243.5 | −0.62 |
| AAT (°C) | 22.18 | 22.90 | 3.24 | 22.20 | 22.81 | 2.74 | 22.22 | 22.82 | 2.72 |
| AASD (h) | 4.99 | 4.90 | −1.88 | 5.09 | 4.87 | −4.35 | 5.06 | 4.88 | −3.59 |
| Factors | AMS | Amax | Amin | ||||
|---|---|---|---|---|---|---|---|
| ΔS (m3/s) | Contribution | ΔS (m3/s) | Contribution | ΔS (m3/s) | Contribution | ||
| CC | Precipitation | −0.57 | 47.88% | −42.77 | 33.42% | −0.53 | −60.82% |
| Temperature | −0.02 | 1.95% | −0.48 | 0.37% | −0.01 | −0.79% | |
| Sunshine duration | 0.04 | −3.72% | 0.61 | −0.48% | 0.02 | 2.42% | |
| Total | −0.55 | 46.11% | −42.63 | 33.32% | −0.51 | −59.19% | |
| HA | LUCC | 0.03 | −2.56% | 0.63 | −0.50% | 0.01 | 0.74% |
| DHA | −0.67 | 56.45% | −85.97 | 67.18% | 1.37 | 158.45% | |
| Streamflow | ATP | RX1 Day | RX5 Day | AMT | AMSD |
|---|---|---|---|---|---|
| AMS | 0.91 ** | 0.54 ** | 0.57 ** | −0.20 | −0.45 ** |
| Amax | 0.50 ** | 0.57 ** | 0.79 ** | −0.31 * | −0.03 |
| Amin | 0.12 | 0.08 | −0.02 | −0.22 | −0.16 |
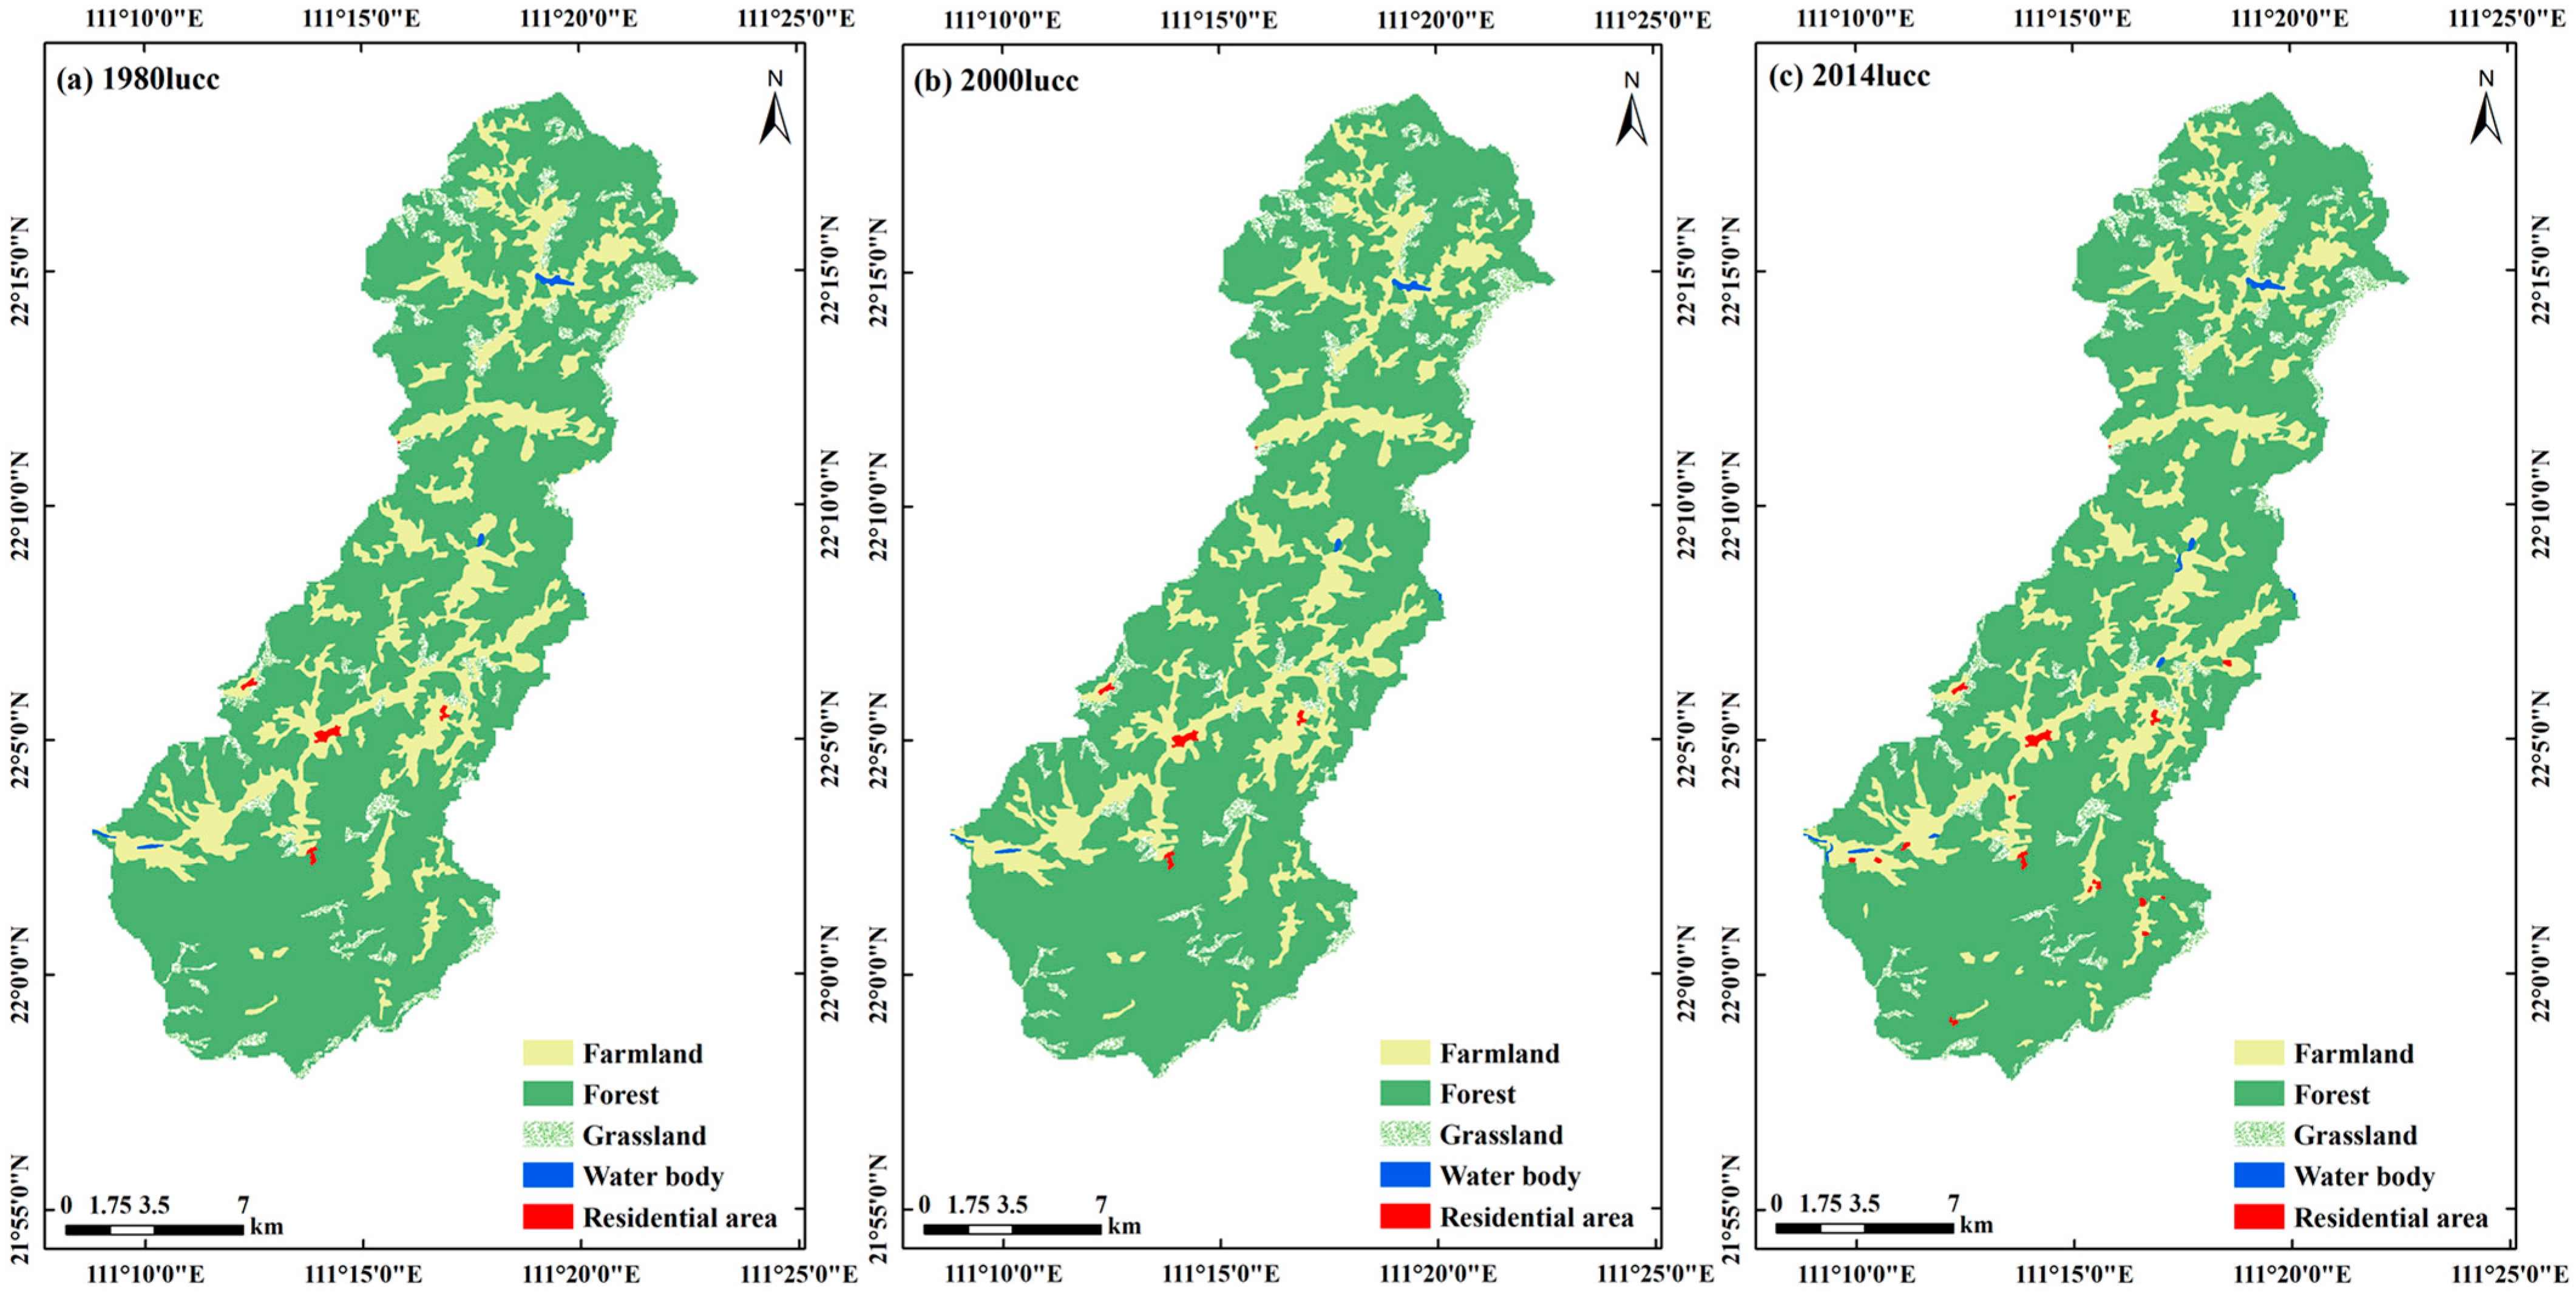
| LUCC | 1980 (km2) | 2000 (km2) | 2014 (km2) | 1980–2000 Change Rate | 1980–2014 Change Rate |
|---|---|---|---|---|---|
| Farmland | 71.15 | 71.12 | 70.95 | −0.04% | −0.28% |
| Forest | 294.47 | 295.47 | 294.38 | 0.34% | −0.03% |
| Grassland | 25.35 | 24.37 | 24.70 | −3.89% | −2.58% |
| Water body | 0.70 | 0.72 | 1.02 | 1.93% | 45.33% |
| Residential area | 0.81 | 0.81 | 1.44 | −0.18% | 77.75% |
Publisher’s Note: MDPI stays neutral with regard to jurisdictional claims in published maps and institutional affiliations. |
© 2022 by the authors. Licensee MDPI, Basel, Switzerland. This article is an open access article distributed under the terms and conditions of the Creative Commons Attribution (CC BY) license (https://creativecommons.org/licenses/by/4.0/).
Share and Cite
Xu, F.; Zhao, L.; Niu, C.; Qiu, Y. Effect of Climate Change and Anthropogenic Activities on Streamflow Indicators in a Tropical River Basin in Southern China. Water 2022, 14, 304. https://doi.org/10.3390/w14030304
Xu F, Zhao L, Niu C, Qiu Y. Effect of Climate Change and Anthropogenic Activities on Streamflow Indicators in a Tropical River Basin in Southern China. Water. 2022; 14(3):304. https://doi.org/10.3390/w14030304
Chicago/Turabian StyleXu, Fei, Lingling Zhao, Cunwen Niu, and Yaqin Qiu. 2022. "Effect of Climate Change and Anthropogenic Activities on Streamflow Indicators in a Tropical River Basin in Southern China" Water 14, no. 3: 304. https://doi.org/10.3390/w14030304
APA StyleXu, F., Zhao, L., Niu, C., & Qiu, Y. (2022). Effect of Climate Change and Anthropogenic Activities on Streamflow Indicators in a Tropical River Basin in Southern China. Water, 14(3), 304. https://doi.org/10.3390/w14030304