Abstract
Due to climate change, freshwater supply will be limited at many locations around the globe. Rainwater harvesting (RWH) has emerged as an alternative and sustainable freshwater source. In this study, the impacts of climate change on water saving as well as the reliability of a RWH system are investigated using data from eight Australian capital cities. Both historical and projected rainfall data were incorporated into a daily water balance model to evaluate the performance of a RWH system in relation to its reliability, water savings and scarcity. Indoor (toilet and laundry), outdoor (irrigation) and combined (indoor plus outdoor) water demands were considered for a 5 m3 tank size. It has been found that in the future period, the water savings and reliability of a RWH system will reduce slightly across the selected cities. Different capital cities of Australia will experience different level of performance for a RWH system depending on their locations, water uses and seasons. The findings of this study will be useful to water authorities and policy makers to plan for a sustainable RWH system under changing climate conditions.
1. Introduction
Since the 1980s, population expansion, socioeconomic development, and changing water use patterns have all contributed to an annual increase in global water consumption of about 1%. Water resource availability, on the other hand, is declining due to water contamination caused by rapid urbanisation and industrialisation. According to the reports from the United Nations [1], the global population is expected to grow from 9.8 billion in 2050 to 11.2 billion in 2100. The rising water demand of this huge population would make naturally limited water resources scarcer. Currently, over 2 billion people live in countries with high water shortages, and approximately 4 billion live in countries with severe water scarcity for at least one month of the year. If appropriate adaptation measures are not taken to strengthen water supply systems, stress levels will continue to rise as demand for water rises and the consequences of climate change worsen [2,3,4].
According to the sixth assessment report of the Intergovernmental Panel on Climate Change (IPCC), global surface temperatures will continue to rise until at least the mid-century under all emission scenarios. Global warming is expected to exacerbate the global water cycle, including its variability [5]. Climate change, on the other hand, should be considered when developing and managing water supply systems in order to ensure water security and improve resilience in the face of changing environments [6,7,8]. In recent years, several alternative water sources, such as rainwater harvesting (RWH), grey water reuse, and wastewater recycling, have received increased attention in order to meet rising water demand. RWH is the collection and storage of rainwater from rooftops or other impervious surfaces for later use in drinking, outdoor irrigation, and non-potable indoor uses such as toilet flushing [9].
Several studies were conducted on possible climate change impacts on RWH systems. Musayev et al. [10], for example, examined data from 41 countries to assess the feasibility of RWH systems in improving domestic water security under various climate change scenarios. It was discovered that climate change had minimal impact on the feasibility of a RWH system. In the face of climate change, they created design curves to assist designers in determining the best roof and tank sizes at a given site. Kahinda et al. [11] developed a model to calculate the optimal RWH tank size and assess water security under various scenarios, both with and without climate change in South Africa. The ideal RWH tank volume in the four quaternary catchments (QCs) studied was 0.5 m3, with the humid QC, as predicted, offering the highest water security of about 30%. Based on future rainfall data (derived from six GCMs), the ranges of water security attained by a 0.5 m3 RWH tank were 10–15% in the arid QC, 15–20% in both the semi-arid and dry sub humid QCs, and 30–40% in the humid QC. It was suggested that appropriate adaptation measures be implemented to mitigate the effects of climate change on water security in several areas of South Africa.
Kisakye et al. [12] evaluated the impact of climate change on reliability of the RWH system for Kabarole district of Uganda, using six global circulation models (GCMs). Using 20 years of historical daily rainfall data and future data for 2025–2055, and 2060–2090 periods, a daily water balance model was used to assess the performance of a RWH system. This study used Ugandan weather seasons, which included the two rainy seasons of March, April, and May (MAM) and September, October, and November (SON), as well as the two dry seasons of June, July, and August (JJA) and December, January, and February (DJF). The SON season was found to have increased reliability, whereas the MAM season had the greatest decrease in reliability, corresponding to a 27% decrease in water security from the observed condition. For dry seasons, the majority of the models predicted a slight decrease in reliability and water security. Water security was predicted to be reduced by 1–8% with a 0.5 m3 tank capacity during the DJF seasons of 2025–2055 and 2060–2090. As a result, in order to maintain 80% system reliability in the face of climate change, more harvesting area and tank capacity would be required.
Haque et al. [13] investigated the effects of climate change on the performance of a domestic RWH system in Sydney and found that potential water savings are going to be reduced in future. It was reported that the performance of a RWH system is more likely to be affected in dry season as compared to wet season. Under future climate change scenarios, Imteaz et al. [14] investigated the possible effect on spatial variability of rainwater savings in Sydney city. Projected rainfall data for two separate future periods (2020–2039 and 2080–2099) were used to assess future water savings potentials of a RWH system for five distinct locations in Sydney. Water savings and reliabilities were predicted to decline in the majority of the analysed cases, both in the near (2020–2039) and far (2080–2099) futures, relative to the current average scenario. However, both water savings and reliabilities were expected to be increased in the distant future as compared to the near future scenario. Additionally, it was predicted that the city’s spatial variabilities would increase for both in the near and distant future.
Jing et al. [7] created a computational tool to assess the water-saving efficiency and financial feasibility of RWH systems in eight cities spanning four different climatic regions of China. To evaluate the viability of a RWH system, stormwater capture efficiency, water-saving efficiency, and time reliability were assessed. They found that RWH efficiency was dependent on storage capacity, spatial variability of rainfall, and rainwater demand scenarios. In general, RWH systems with larger storage capacities, lower water demand scenarios and locations in more humid regions can achieve higher water-saving efficiency and reliability, whereas higher stormwater capture efficiency is linked with higher water demand scenarios, larger storage capacity, and low rainfall. Other studies, such as Lo et al. [15] for Sri Lanka, Mehrabadi et al. [16] for Iran, Toosi et al. [17] for Iran, and Zhang et al. [18] for China, have highlighted the effects of climate change on current and future RWH systems.
Alamdari et al. [19] investigated the effects of climate change on RWH reliability in 17 different locations across the United States for both historical (1971–1998) and future (1971–2010) periods (2041–2068). The study’s dual goals were to look into the impact of climate change on the RWH system in terms of water supply and runoff reduction. The efficiency of RWH systems for runoff capture was expected to decline in the eastern, northern, and southern United States. RWH systems, on the other hand, were predicted to become less effective for water delivery in the majority of areas across the western, southern, and central United States. The study’s findings suggest that, as a result of climate change, some RWH systems designed for current conditions may be less effective in the future.
Gwodźiej-Mazur et al. [20] studied the influence of long-term climate change on RWH potential for meeting non-potable demands in a four-person Polish household. The long-term monthly water-saving efficiency trends were examined from 1970 to 2019. This pattern provided comprehensive data on long-term variations in RWH potential in 19 major Polish cities. Efficiency increases in the winter and decreases in the summer, according to 24 significant monthly trends. The statistical significance of yearly and monthly changes in RWH efficiency varies across cities studied, indicating that precipitation is not the only factor influencing its effectiveness. Precipitation timing is also critical.
From the above literature review, it is seen that there have been few studies on the impacts of climate change on RWH systems in Australia that have covered multiple locations. As a result, the motivation for this study is to generate new knowledge on the climate adaptability of RWH systems in Australia’s capital cities, where the majority of Australians live. The remainder of the paper is organised as follows. Section 2 presents the study area and data used in the analysis. Section 3 describes the methodology adopted, which is followed by the results, discussion, and conclusion.
2. Study Area and Data
This study focuses on Australia, which has a land area of 7.69 million km2. With low average annual rainfall throughout most of the continent, rainfall in Australia is highly unpredictable. The coasts and ranges of the north, east, and south-west receive moderate to heavy rainfall, while the rest of the country is quite dry. Since Australia has a high spatial rainfall variability, eight different locations were chosen. These are the capital cities (Adelaide, Brisbane, Canberra, Darwin, Hobart, Perth, Melbourne, and Sydney) as shown in Figure 1. Table 1 shows the selected rainfall stations, historical and future data periods, average annual rainfall for both historical and future periods, and average annual rainfall changes from 2022 to 2039 in comparison to the historical rainfall average for all selected stations. The daily rainfall data for the historical period at the selected locations were obtained from the Australian Bureau of Meteorology (BOM) covering 75 years. The average annual rainfall over the selected locations ranges from 510 to 1573 mm/year, with an average of 826 mm/year. The Australian Government’s NARCliM project provided projected future rainfall data for the selected sites. The projected rainfall data was used in this study for an 18-year period, from 2022 to 2039. The global climate model of the Commonwealth Scientific and Industrial Research Organization was used to generate the downscaled future rainfall data (CSIRO Mk.3). The climate projections from NARCliM were simulated from 4 global climate models (GCMs). Thereafter, those GCM projections were downscaled using three regional climate models (RCMs). The 4 GCMs used were: (i) MIROC3.2, (ii) ECHAM5, (iii) CCCMA and (iv) CSIRO Mk3.0 and the RCM used was the Weather Research and Forecasting (WRF) model. A total of 12 model ensembles were simulated by running the combination of 3 physical configurations of WRF model (essentially 3 RCMs) with each of 4 GCMs. For example, CSIRO Mk3.0 +WRF R1 for R1, CSIRO Mk3.0 +WRF R2 for R2 and CSIRO Mk3.0 +WRF R3 for R3. Climate projection data can be downloaded for free from the Climate Data Portal: https://climatedata.environment.nsw.gov.au/ (accessed on 2 October 2022).
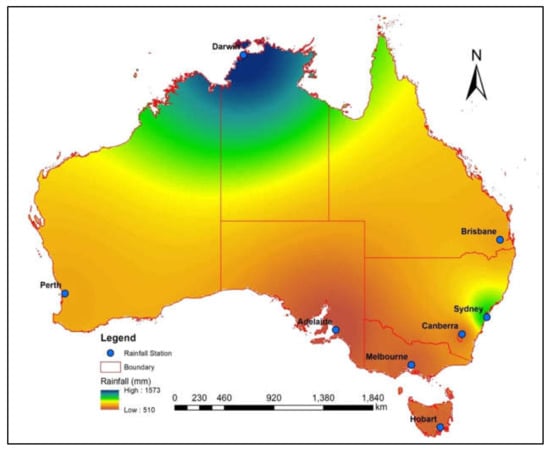
Figure 1.
Location of the selected rainfall stations and spatial distribution of mean annual rainfall considering historical data.

Table 1.
Average annual rainfall changes at eight different locations.
3. Methodology
In Python, a daily water balance model was created to assess the climate change impacts on the RWH system, taking into account factors such as rainwater tank size, observed and future daily rainfall, losses, daily water demand, and tank spillage. A behavioural-type model (yield-after-spillage) was used to build the model [21,22]. The model consists of various input parameters like indoor and outdoor water demand, tank size, runoff coefficient and first flush. Further this model works on a daily time step, hence, it provides daily calculation of parameters such as inflow, outflow, spillage, irrigation requirements, storage level after outflow, demand met and water savings as per water balance principle. The model’s primary input data were daily rainfall for both historical and future periods. All of the analyses were done for a 5 m3 rainwater tank with indoor (toilet and laundry (TLD)) and outdoor (irrigation) water uses. The reason for choosing a 5 m3 tank is that it has been recommended as the best tank size in several Australian studies [23,24,25,26]. Figure 2 depicts a flow chart of the methodology used to estimate the percent change in rainfall data, reliability, water savings, and water security parameters of a RWH system.
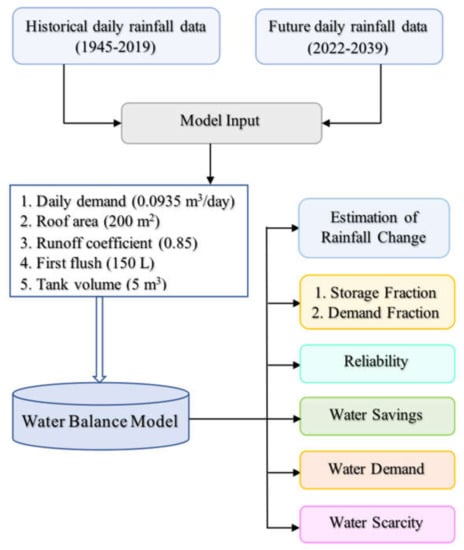
Figure 2.
Flowchart showing the adopted methodology to evaluate the performance of a RWH system.
3.1. Rainfall Change Detection
The most significant climatological variable in climate change-related water balance modelling of a RWH system is projected daily rainfall. To understand possible changes, a comparison of the simulated rainfall values with the historical values is made by the following equation:
3.2. Non-Dimensional Design Parameters
Following the approach of Palla et al. [27], two non-dimensional parameters, the demand fraction and the storage fraction, are used to compare the optimum sizing of the RWH system across different capital cities (2011). The demand fraction (D/Q) is the proportion of annual water demand D (L3) to annual inflow Q. (L3). The storage fraction (S/Q) is defined as the ratio of the RWH system’s storage capacity S (L3) to the annual inflow Q. (L3).
3.3. Reliability and Water Savings
The reliability of a RWH system is defined as the ratio of the total number of days in a year when harvested rainwater meets water demand and the total number of simulated days. The equation for estimating reliability is as follows:
where R is the RWH system’s reliability (%), T is the total number of days when the intended water demand is not met, and P is the simulation period’s total number of days. As a result, P − T represents the total number of days where the intended water demand was met.
3.4. Water Demand
Each study location considered a hypothesised new development with a single household of four occupants. The site area was 450 m2, with roof, irrigation, and impervious areas of 200 m2, 150 m2, and 100 m2, respectively. Roof area = 200 m2, first flush = 150 L, TLD demand = 0.0935 m3/day, and runoff coefficient (RC) = 0.85 were used as input data values.
Total demand for indoor and outdoor uses is made up of toilet flushing and laundry, as well as irrigation demand. The following is the demand for toilet flushing and laundry:
- Toilet: 6 L/flush, fully flushed three times per day per person, for a total of 18 L/person/day.
- Laundry: Washing machine 50 L/wash, resulting in 21.5 L/day at 0.43 washes/day.
For an example, four persons in a house visiting toilet three times a day per person on average will have a total demand for toilet flushing and laundry of: (4 × 3 × 6) + (0.43 × 50) = 0.0935 m3/day.
- Outdoor Irrigation at a depth of 10 mm, multiplied by the irrigation area (150 m2 × 10 mm = 1.5 m3/session).
3.5. Water Scarcity
The ratio of the total number of days when the rainwater tank is empty to the total number of simulated days is used to calculate water scarcity for a RWH system. The following equation is used to estimate water scarcity:
4. Results and Discussion
4.1. Changes in Future Rainfall
Figure 3 illustrates the percent changes in average annual rainfall for the three climate models, Mk.3 (R1, R2 and R3). According to the three models, Perth and Sydney will experience the highest average annual rainfall reduction ranging from 14.52% to 42.55%, whereas Brisbane and Canberra will experience an increase in average annual rainfall (58.35% to 114.94%). These results clearly show that Australia’s rainfall regime will change in near future in a very different way across the capital cities. Most of the negative changes in average annual rainfall are seen at five locations for R2 (Adelaide, Darwin, Perth and Sydney). In contrast, R3 shows a higher average annual rainfall for all the cities except Perth and Sydney.
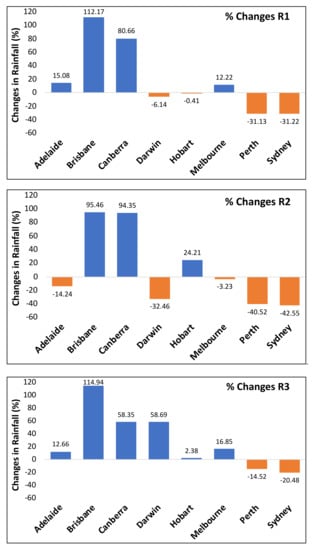
Figure 3.
Plots showing percent changes in average annual rainfall values for R1, R2, and R3 in comparison to the historical rainfall.
Figure 4 shows the percentage changes in average annual rainy days between the future period (2022–2039) and the historical data. It is found that the average annual number of rainy days is expected to increase for all the cities, with Perth having the lowest increase (201 days/year for R1, 122 days/year for R2 and 207 days/year for R3), and Brisbane having the greatest increase (261 days/year for R1, 203 days/year for R2 and 250 days/year for R3). Brisbane, Melbourne, Canberra and Hobart show the highest increase in average annual number of rainy days in future period as compared to the historical values.
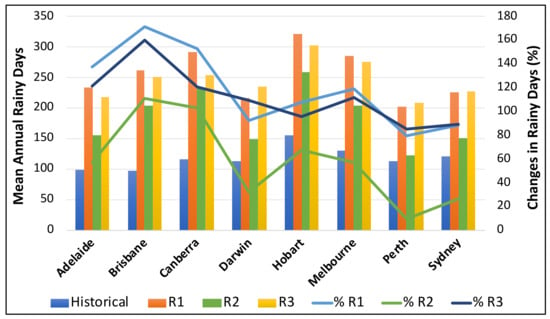
Figure 4.
Average annual number of rainy days and percentage changes between the future period (2022–2039) and historical data.
The percentage changes in the average number of dry days between future period (2022–2039) and historical data are shown in Figure 5. For the future period, Perth has the highest number of average annual dry days (164 days/year for R1, 243 days/year for R2 and 158 days/year for R3), while Hobart has the lowest number of average annual dry days (44 days/year for R1, 106 days/year for R2 and 63 days/year for R3). The average annual number of dry days will reduce in the future period by 55% for R1, 27% for R2, and 52% for R3 (considering all the sites) in comparison to the historical period.
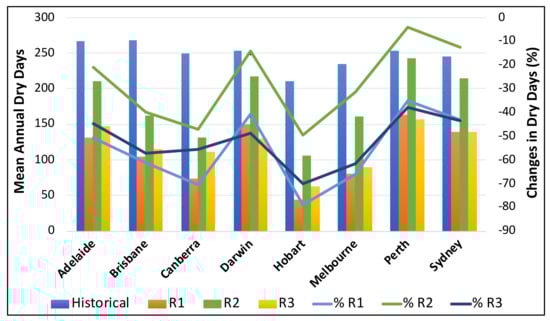
Figure 5.
Average annual dry days and percentage changes between the future period (2022–2039) and historical data.
4.2. Non-Dimensionless Parameters
The demand fraction (D/Q) values for all the eight locations for both the historical and future periods for TLD, irrigation and combined uses are shown in Figure 6. For TLD use, the demand fraction value ranges from 0.99–1.46, with Darwin (1.34 for historical, 1.42 for R1, 1.46 for R2, and 1.18 for R3) having the highest value, while Hobart (1.01 for historical, 0.99 for R1, 0.99 for R2, and 0.99 for R3) has the lowest ones. For projected future data (R1, R2, R3), there is a sharp increase in demand fraction values for R1 and R2 models except for Brisbane, Canberra and Melbourne. Demand fraction values are notably higher for all the locations except Hobart and Melbourne (0.99). For irrigation use, the demand fraction values range from 3.77–10.43, which is quite high compared to TLD use. This is due to high irrigation water demand. Darwin (10.43 for historical, 12.40 for R1, 24.80 for R2, and 8.62 for R3) has the highest value, while Hobart (3.86 for historical, 0 for R1, 1.24 for R2, and 0 for R3) has the lowest. A similar pattern can be seen for combined use, Darwin (6.97 for historical, 4.26 for R1, 8.83 for R2, and 2.84 for R3) has the highest values while Hobart (3.35 for historical, 0.90 for R1, 0.90 for R2, and 0.92 for R3) has the lowest ones.
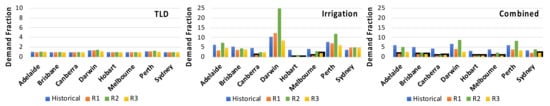
Figure 6.
Demand fraction values for all the 8 locations for both the historical and future periods (TLD, irrigation and combined use).
Figure 7 depicts the storage fraction (S/Q) values for all eight selected locations for both the historical and future periods for TLD, irrigation, and combined use. The storage fraction (S/Q) for TLD use ranges from 0.15–0.21, 0.08–18 for irrigation use, and 0.06–0.16 for combined use. According to Figure 7, Darwin has the highest storage fraction values for TLD (0.20 for historical, 0.21 for R1, 0.21 for R2 and 0.17 for R3) and combined use (0.11 for historical, 0.15 for R1, 0.16 for R2 and 0.13 for R3), while Hobart (0.13 for historical, 17.86 for R1, 2.32 for R2 and 17.86 for R3) and Melbourne (0.10 for historical, 17.86 for R1, 0.20 for R2 and 5.40 for R3) have the highest values. Palla et al. [27] found that storage capacity in Italy ranges from 0.01 to 3.98, and our storage fraction values mostly fall within that range. All three projected climate models R1, R2, and R3 show a significant increase in storage fraction values for RWH systems for future periods.
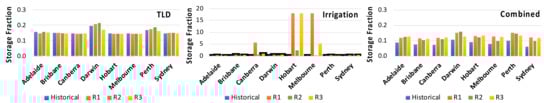
Figure 7.
Storage fraction for all eight locations for both the historical and future period for TLD, irrigation and combined uses.
4.3. Reliability
Figure 8 depicts the reliability values for historical and future data, as well as the percentage changes for TLD, irrigation, and combined use. For TLD use, the historical reliability values for all eight locations range from 73% (Darwin) to 99% (Sydney). This is consistent with the findings of Hajani et al. [28] who investigated RWH system performance in peri-urban areas of Greater Sydney and discovered that a 5 m3 tank had TLD demand reliability values ranging from 96% to 99%, depending on the location. Bashar et al. [29] demonstrated that the reliability of a RWH system varies with water demands and tank sizes across six major cities in Bangladesh, which is consistent with the findings of this study. Imteaz et al. [30] demonstrated that even with a very large tank, 100% reliability cannot be achieved for a relatively small roof size (100 m2). We discovered, like Imteaz et al. [30], that 100% reliability is not possible for a small roof area. However, in our study, increasing the roof area to 200 m2 allowed us to achieve 100% reliability in some locations.
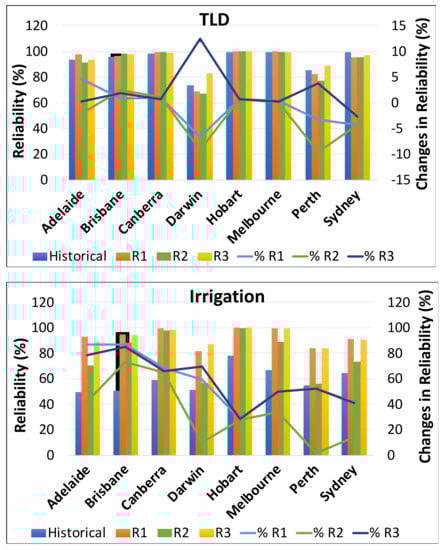
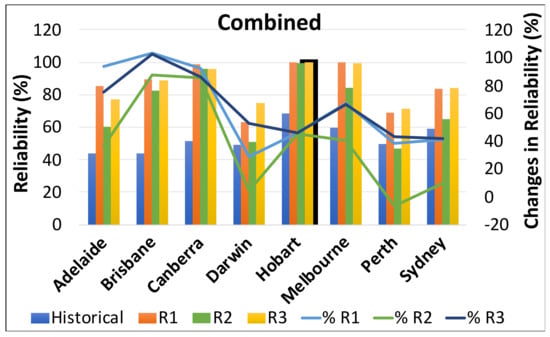
Figure 8.
Reliability values and percent changes between the historical data and future period (TLD, irrigation and combined use).
For future period (TLD use), reliability values vary from 68% (Darwin) to 99% (Canberra, Hobart and Melbourne) for R1, 67% (Darwin) to 99% (Canberra, Hobart and Melbourne) for R2 and 83% (Darwin) to 99% (Hobart and Melbourne) for R3. The percentage change in reliability is expected to reduce by 6% for Darwin, 3% for Perth and 4% for Sydney. However, it is likely to increase by less than 1% for Brisbane, Hobart and Melbourne. Only Adelaide and Canberra show more than 1% positive change in reliability in the future. For R2, the reliability is expected to reduce by 2% for Adelaide, 9% for Darwin, 9% for Perth and 4% for Sydney. Brisbane and Canberra show a minor positive change of 2% and 1%, respectively, while Hobart and Melbourne show very minimal change i.e., less than 1%. For R3 however, this change is quite the opposite compared to R1 and R2, and it shows positive change for all the locations except Sydney (−2%). The more likely reduction in reliability percentage is due to reduction in future annual rainfall in those regions. Reliability will be highly impacted by future rainfall variability across Australia.
For irrigation use, reliability is quite low as compared to TLD use; in most cases, this is due to high irrigation water demand. For historical data, the reliability values vary from 49% (Adelaide) to 78% (Hobart). For the future period, it varies from 81% (Darwin) to 100% (Hobart) for R1, 55% (Darwin) to 99% (Hobart) for R2 and 83% (Perth) to 100% (Hobart) for R3. For all three models, there is a positive trend among all the eight locations, which means percent change in reliability is expected to increase in future ranging from 28% (Hobart) to 87% (Brisbane) for R1, 1% (Perth) to 73% (Brisbane) for R2 and 28% (Hobart) to 85% (Brisbane) for R3. Khan et al. [31] examined the RWH system viability in terms of reliability and water savings for whole of Australia. The findings revealed that reliability is significantly high (80–100%) for TLD use, but it drops below 50% for most locations across Australia for combined use; the findings of this study mostly agree with Khan et al. [31].
Figure 9 depicts the relationship between reliability and roof area for historical and future rainfall data for three water demand scenarios: TLD, irrigation, and combined use. The figure clearly shows that reliability is significantly dependent on roof size, and reliability increases with increasing roof size for all locations except Darwin and Perth. Preeti et al. [24] investigated the reliability–roof area relationship for a four-person household scenario in Sydney and discovered that reliability is significantly dependent on roof size; this study found a similar result. Figure 9 shows that irrigation reliability values will remain very similar across the selected eight locations in the future for all three climate change scenarios (R1, R2, and R3).
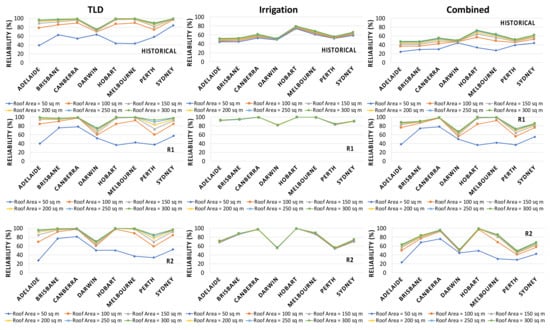
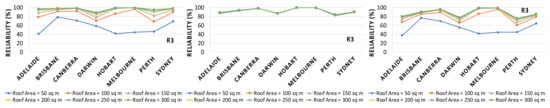
Figure 9.
Reliability–roof area relationships for both the historical and future periods (TLD, irrigation and combined use).
4.4. Water Savings
Figure 10 illustrates the average annual water savings and percent changes for TLD, irrigation, and combined use over the past and future periods. Water savings for outdoor demand for a 5 m3 tank size are much lower than for indoor demand, because outdoor demand is approximately 16 times greater than indoor demand. For historical data, the mean annual water savings range from 25 m3 (Darwin) to 34 m3 (Sydney), with a mean value of 31 m3 for all locations. Water savings for future periods range from 23 m3 (Darwin) to 34 m3 (Hobart) for R1, 23 m3 (Darwin) to 34 m3 (Hobart) for R2, and 28 m3 (Darwin) to 34 m3 (Hobart) for R3. The average annual water savings for irrigation use range from 27 m3 (Darwin) to 65 m3 (Sydney), with the mean value for all locations being 48 m3. Water savings for Hobart and Melbourne are minimal for all three climate models in the future, while Adelaide, Perth, and Sydney have the greatest water savings of any location. Water savings for TLD are expected to fall in the future for all three models, ranging from 2% to 4% for R1, 1% to 9% for R2, and 2% for R3. These findings are very similar to those of Haque et al. [13], who used the “CSIRO Mk.3” model to assess the effects of climate change on RWH at five locations in the Greater Sydney region. It was observed that for a 5 m3 tank size, expected water savings ranged from 1% to 11% for TLD use, 1% to 19% for irrigation use, and 1% to 25% for combined use. It should be noted that the current study and the results of Haque et al. [13] used different historical data and climate models. Imteaz et al. [14] used a daily water balance model to investigate the potential for water savings by RWH systems over two distinct time periods in five different Sydney locations. Water savings were found to be decreasing in the majority of the considered cases, for both the near (2020–2039) and distant (2080–2099) future cases, when compared to the current average scenario. Our findings agree with those of Imteaz et al. [14]. The combined water savings for all eight locations range from 31% to 53% for R1, 21% to 42% for R2, and 27% to 52% for R3.
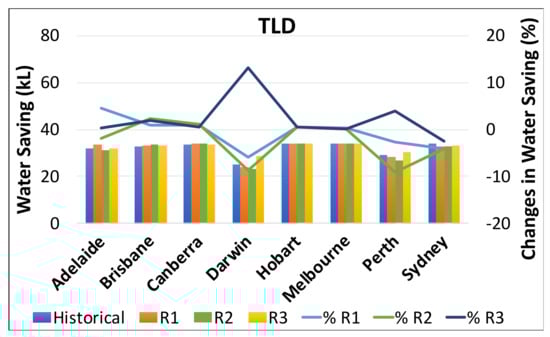
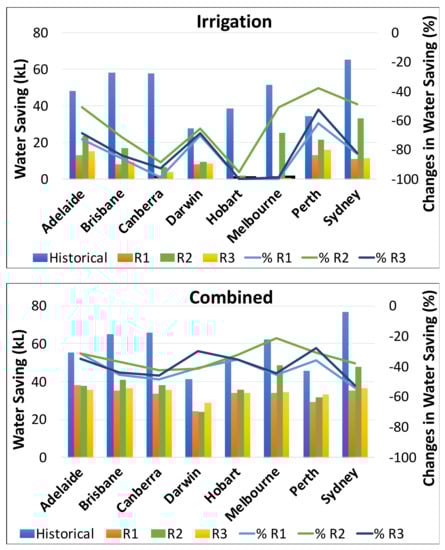
Figure 10.
Average annual water savings and percent changes pattern for both the historical and future period for TLD, irrigation and combined uses.
Figure 11 shows the water saving–roof area relationships for TLD, irrigation and combined use for both the historical and future period. For TLD use, Adelaide has the lowest water savings for a 50 m2 roof size, whereas Sydney has the highest water savings among all the locations. Except for 50 m2 roof size, the amount of water saved is directly proportional to roof size, and it increases with the roof size for all the locations except Darwin and Perth.
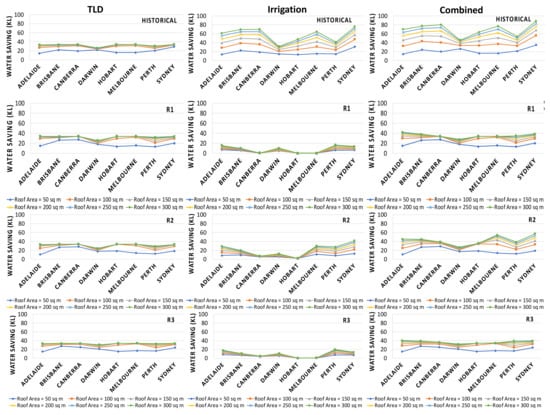
Figure 11.
Average annual water saving–roof area relationships for both the historical and future period for TLD, irrigation and combined uses.
For irrigation use, for the historical period, average water savings considering all the locations are 17 m3, 31 m3, 40 m3, 48 m3, 53 m3 and 57 m3 for 50 m2, 100 m2, 150 m2, 200 m2, 250 m2 and 300 m2 roof areas, respectively. However, for model R1, it is reduced to 3 m3, 4 m3, 5 m3, 6 m3, 7 m3 and 8 m3 for 50 m2, 100 m2, 150 m2, 200 m2, 250 m2 and 300 m2 roof area, respectively. Similar results are seen for R2 and R3, in which water savings are expected to decrease for all the locations. Water savings for R1 and R3 are almost negligible in Hobart and Melbourne, which may be due to the irregular distributions of rainfall within a year. For combined use, water savings are expected to increase in the future as compared to irrigation use. This is consistent with the findings of Mehrabadi et al. [16], who evaluated RWH efficiency for non-potable water demand in three Iranian climate conditions (mediterranean, humid, and arid). The study included typical residential buildings with roof areas of 60 m2, 120 m2, 180 m2, and 240 m2 and an average of four residents in each house. It was found that the RWH system can meet at least 75% of non-potable water demand for a maximum of 70% of the time in humid climates, 40% of the time in Mediterranean climates, and 23% of the time in arid climates.
4.5. Monthly Water Demand
Figure 12 shows the number of days in a month (on average) when 100% water demand is met for TLD, irrigation and combined use for Darwin and Sydney. We have used only these two capital cities for monthly analysis as they represent quite different results. For Darwin, water demand is barely met during July to September, which is mostly winter season. For TLD use, water demand is satisfied only for 5, 2 and 8 days in each of the three months for the historical period used, while for the projected period, water demand was met for less than 10 days for the R1, R2 and R3 cases. This can be due to the fact that there is not much rain in these months in Darwin. However, for Sydney, the average number of days in a month when water demand being met is quite high for December i.e., 30 days for historical and 29 days for projected period. From July to September, number of days vary from 25 to 29 for future period.
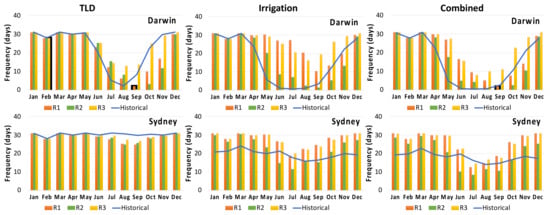
Figure 12.
Charts showing number of days when monthly water demand is met for 5 m3 rainwater tank for TLD, irrigation and combined uses.
For irrigation use, number of days in a month when water demand is satisfied is quite low for Darwin throughout the winter months from June to September for the historical period. For the future period, number of days for R1 grows by 1 to 26 days in June, 0 to 27 days in July, 1 to 20 days in August and 3 to 10 days in September. The number of days for R3 increases from 1 to 8 days in June, 0 to 7 days in July, 1 to 3 days in August and 3 to 1 days in September. For R2, the number of days is increasing but quite low as compared to R1 and R3. Overall, the number of days when water demand is satisfied show an increase in future. A similar pattern is observed for combined use.
However, for Sydney, the number of days when water demand is met is quite high throughout the year for TLD use. However, for irrigation use, water demand is quite low for July to September months as compared to TLD use. In comparison to the historical period, the number of days for R1 will increase from 17 to 18 days in July, 15 to 22 days in August, and 16 to 24 days in September. The number of days for R3 increases from 17 to 20 days in July, 15 to 22 days in August and 16 to 23 days in September in the future. For R2, the number of days decreases from 17 to 11 days in July and 16 to 15 days in September. Average number of days in a year when water demand is satisfied are 19 days for the historical period, 28 days for R1, 22 days for R2 and 27 days for R3. While for combined use, it is reduced to 18 days for historical period, 25 days for R1, 19 days for R2 and 25 days for R3. It is clearly evident that during winter months (June-August), water demand is not met for most of the days in a month, which can be due to low rainfall during these months. However, water supply is increasing in the future due to more rainfall in these months.
Figure 13 depicts the percentage change in average monthly rainfall for the future period compared to the historical period. The majority of positive changes occur in the first three months for all locations, while the majority of negative changes occur in the last eight months for all locations except Brisbane, Canberra, and Darwin. Except for Darwin, almost every location shows a negative trend during the winter months of May–July. This trend suggests that RWH will be more useful, particularly during the summer months. However, in order to effectively use the harvested rainwater, the system must be capable of capturing enough rainfall during the wet season (December–April). Sydney is the only city among all locations that shows a negative change throughout the year for all three scenarios (R1, R2, and R3). When compared to other months, December–March results have the most positive rainfall changes.
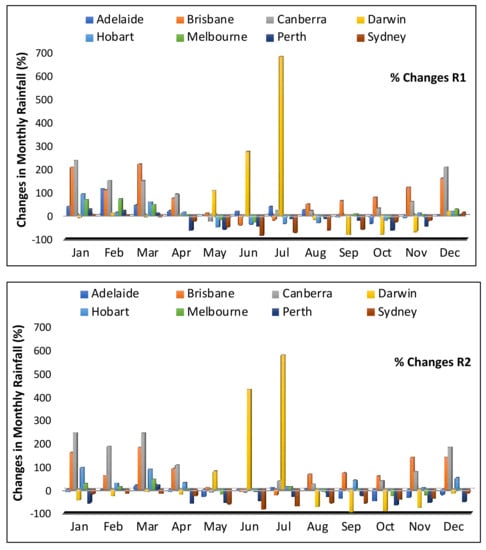
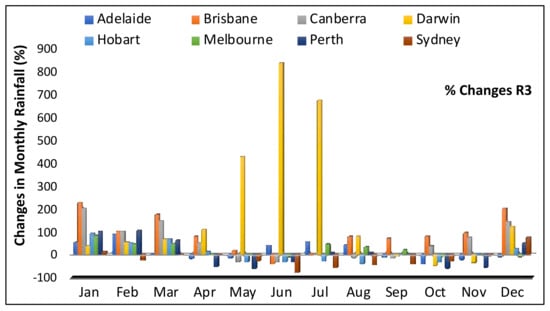
Figure 13.
Changes in monthly average rainfall at the eight Australian capital cities from 2022–2039 in comparison to the historical rainfall average.
4.6. Water Scarcity
Figure 14 depicts monthly water scarcity for all of the cities selected for TLD, irrigation, and combined uses for both the historical and future periods. Climate change effects on the RWH system can be seen in terms of the percentage change in water scarcity for each location in relation to different climate models (R1, R2 and R3). Water scarcity is used to evaluate the performance of a RWH system. A higher water scarcity value indicates that the system is unable to meet the projected water demand; a lower water scarcity value, on the other hand, indicates that the system is performing well. This study examines the water scarcity for various cities in relation to projected future rainfall values from the model output in order to detect potential future changes in the standard RWH system’s water scarcity. Figure 14 shows that Darwin has the highest water scarcity values during the second half of the year (June–November) for all four scenarios for TLD usage (historical, R1, R2 and R3). From December to May, Adelaide and Perth have the most water scarcity. During the months of June to October, however, Brisbane, Canberra, and Sydney experience little water scarcity. Hobart and Melbourne are the only cities that will face 1% water scarcity throughout the year in the future. Overall, water scarcity is decreasing in future for majority of the locations.
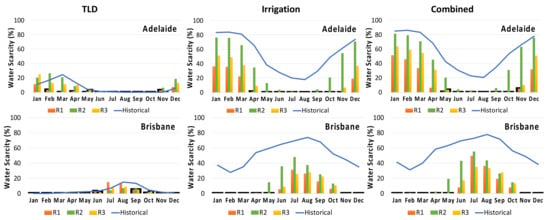
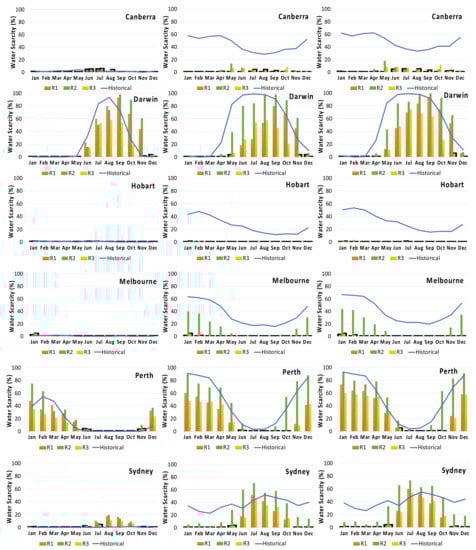
Figure 14.
Water scarcity for all eight selected locations for both the historical and future period for TLD, irrigation and combined uses.
Water scarcity is quite high for both historical and future periods for irrigation and combined usage when compared to TLD use. This could be due to increased irrigation water demand. Most locations are expected to have less water scarcity in the future, with the exception of Darwin, Perth, and Sydney, which have a slight increase in water scarcity for R3. This denotes that there will be more rainfall in the future than there is now. This is consistent with the findings of Lo et al. [15], who examined rainfall patterns in Colombo on daily, monthly, seasonal, and annual time scales. The analysis of Colombo’s future rainfall data reveals that several extreme weather events with very heavy rainfall are likely in the future. These major events, however, may not occur very frequently. The majority of the GCMs used in this study predict increased rainfall in the future. The non-residential RWH system will be more affected than the residential RWH system. Similar to Lo et al. [15], it was discovered that there would be more rainfall in the future. In comparison to the historical period, Hobart will not face water scarcity in the future. From June to October, Brisbane, Darwin, and Sydney face severe water shortages. During November–May, however, Adelaide and Perth face the worst water scarcity.
Table 2, Table 3 and Table 4 show the results for dry, wet, and average years (based on annual total rainfall), reliability, and water savings of the RWH system for TLD and irrigation use for both historical and future periods. This study was conducted for a 5 m3 rainwater tank for indoor and outdoor use. According to Table 2, for the driest years, reliability ranged from 59% to 99%, and water savings ranged from 21 to 34 m3. While reliability for the future period ranges from 61% to 100% for R1, 55% to 100% for R2, and 78% to 100% for R3. Similarly, water savings for R1 range from 21 to 34 m3, for R2 from 19 to 34 m3, and for R3 from 27 to 34 m3. Brisbane has the lowest reliability (59%) of the eight selected locations, while Sydney has the highest reliability (99%). In the case of irrigation, reliability ranges from 39% to 78%, with water savings ranging from 21 to 52 m3. Reliability for the future period ranges from 76% to 100% for R1, 46% to 100% for R2, and 81% to 100% for R3.
Table 2.
Summary of dry year rainfall, reliability and water savings for all the eight cities for both the historical and future period (TLD and irrigation use).
Table 3.
Summary of average year rainfall, reliability and water savings for all the eight cities for both the historical and future period (TLD and irrigation use).
Table 4.
Summary of wet year rainfall, reliability and water savings for all the eight cities for both the historical and future period (TLD and irrigation use).
For an average year, as shown in Table 3, reliability ranges from 69 to 95%, and water savings range from 24 to 33 m3. Reliability for the future period ranges from 80 to 100% for R1, 56 to 100% for R2, and 75 to 100% for R3. Canberra has the highest reliability (95%), while Perth has the lowest (69%). In the case of irrigation, reliability ranges from 30% to 69%, with water savings ranging from 15 to 92 m3. Reliability for the future period ranges from 82% to 100% for R1, 48% to 100% for R2, and 88% to 100% for R3.
For a wet year, Darwin has the lowest reliability (81%) for the historical period, while Canberra, Melbourne, and Sydney have the highest (100%) reliability. For the future period, Perth (84%), Perth (76%), and Darwin (74%), respectively, have the lowest reliability for R1, R2, and R3, whereas Sydney has the highest reliability of 100% for R1, R2, and R3. In the case of irrigation, reliability ranges from 54% to 91%, with water savings ranging from 23 to 79 m3. Reliability for the future period ranges from 86% to 100% for R1, 60% to 100% for R2, and 89% to 100% for R3.
5. Conclusions
The performance of a RWH system under changing climate conditions is investigated in this paper for Australia’s eight capital cities. Historical rainfall data from 1945 to 2019 are used, as well as projected rainfall data for three climate change scenarios (R1, R2, and R3) from 2022 to 2039. Three water demand cases are considered, TLD, irrigation and TLD plus irrigation (combined). According to the three climatic models, Perth and Sydney will experience the highest average annual rainfall reduction ranging from 14.5% to 42.5%, whereas Brisbane and Canberra will experience an increase in average annual rainfall (58.3% to 114.9%). Brisbane, Melbourne, Canberra and Hobart show the highest increase in the average annual number of rainy days in future period (2022–2039) as compared to the historical values. The reliability of a RWH system (for TLD water use) shows little change between historical and future periods for all the eight locations and for all the three climatic change scenarios. For TLD use, water savings are expected to decrease in the future (2022–2039) for all three models ranging from 2% to 4% for R1, 1% to 9% for R2 and 2% for R3. For different water uses, RWH performance varies quite differently across the eight selected locations for both the historical and projected future rainfall data. It should be noted that the performances of a RWH system for the future period as found in this study are expected to vary if different climate change scenarios are realised. It should be noted that there are errors in the projected daily rainfall data. To assess the impacts of these errors, three different future rainfalls (R1, R2 and R3) are adopted to estimate water savings, reliability and other outputs for the given RWH system. To carry out a detail uncertainty analysis, advanced technique such as Monte Carlo simulation or other methods can be adopted. The results of this study can be used to select an appropriate tank size to cater for the future climate at different capital cities of Australia, and hence it could be a useful water management guide to water authorities across Australia.
Author Contributions
P.P. wrote Python codes to carry out the formal data analysis and prepared the first draft of the paper. K.H. enhanced writing and assisted in interpretation of results and A.R. proposed the conceptual framework of the paper, checked the results and enhanced the writing of the paper. All authors have read and agreed to the published version of the manuscript.
Funding
This research did not receive any specific grant from funding agencies in the public, commercial, or not-for-profit sectors.
Institutional Review Board Statement
Not applicable.
Informed Consent Statement
Not applicable.
Data Availability Statement
The rainfall data used can be obtained from Australian Bureau of Meteorology.
Acknowledgments
The authors express their sincere thanks to the Australian Bureau of Meteorology for providing rainfall data for this study.
Conflicts of Interest
The authors declare that they do not have any conflict of interest.
References
- Leaving No One Behind. The United Nations World Water Development Report. 2019. Available online: https://www.unwater.org/publications/world-water-development-report-2019/ (accessed on 18 March 2019).
- Adham, A.; Wesseling, J.G.; Abed, R.; Riksen, M.; Ouessar, M.; Ritsema, C.J. Assessing the impact of climate change on rainwater harvesting in the Oum Zessar watershed in Southeastern Tunisia. Agric. Water Manag. 2019, 221, 131–140. [Google Scholar] [CrossRef]
- Kahinda, J.M.; Taigbenu, A.E. Rainwater harvesting in South Africa: Challenges and opportunities. Phys. Chem. Earth Parts A/B/C 2011, 36, 968–976. [Google Scholar] [CrossRef]
- Kisakye, V.; Van der Bruggen, B. Effects of climate change on water savings and water security from rainwater harvesting systems. Resour. Conserv. Recycl. 2018, 138, 49–63. [Google Scholar] [CrossRef]
- Ayt Ougougdal, H.; Yacoubi Khebiza, M.; Messouli, M.; Lachir, A. Assessment of future water demand and supply under IPCC climate change and socio-economic scenarios, using a combination of models in Ourika Watershed, High Atlas, Morocco. Water 2020, 12, 1751. [Google Scholar] [CrossRef]
- Eroksuz, E.; Rahman, A. Rainwater tanks in multi-unit buildings: A case study for three Australian cities. Resour. Conserv. Recycl. 2010, 54, 1449–1452. [Google Scholar] [CrossRef]
- Jing, X.; Zhang, S.; Zhang, J.; Wang, Y.; Wang, Y. Assessing efficiency and economic viability of rainwater harvesting systems for meeting non-potable water demands in four climatic zones of China. Resour. Conserv. Recycl. 2017, 126, 74–85. [Google Scholar] [CrossRef]
- Silva, A.S.; Ghisi, E. Uncertainty analysis of daily potable water demand on the performance evaluation of rainwater harvesting systems in residential buildings. J. Environ. Manag. 2016, 180, 82–93. [Google Scholar] [CrossRef]
- Aladenola, O.; Cashman, A.; Brown, D. Impact of El Niño and climate change on rainwater harvesting in a Caribbean State. Water Resour. Manag. 2016, 30, 3459–3473. [Google Scholar] [CrossRef]
- Musayev, S.; Burgess, E.; Mellor, J. A global performance assessment of rainwater harvesting under climate change. Resour. Conserv. Recycl. 2018, 132, 62–70. [Google Scholar] [CrossRef]
- Kahinda, J.M.; Taigbenu, A.E.; Boroto, R.J. Domestic rainwater harvesting as an adaptation measure to climate change in South Africa. Phys. Chem. Earth Parts A/B/C 2010, 35, 742–751. [Google Scholar] [CrossRef]
- Kisakye, V.; Akurut, M.; Van der Bruggen, B. Effect of climate change on reliability of rainwater harvesting systems for Kabarole District, Uganda. Water 2018, 10, 71. [Google Scholar] [CrossRef]
- Haque, M.M.; Rahman, A.; Samali, B. Evaluation of climate change impacts on rainwater harvesting. J. Clean. Prod. 2016, 137, 60–69. [Google Scholar] [CrossRef]
- Imteaz, M.A.; Moniruzzaman, M. Potential impacts of climate change on future rainwater tank outcomes: A case study for Sydney. J. Clean. Prod. 2020, 273, 123095. [Google Scholar] [CrossRef]
- Lo, K.F.A.; Koralegedara, S.B. Effects of climate change on urban rainwater harvesting in Colombo city, Sri Lanka. Environments 2015, 2, 105–124. [Google Scholar] [CrossRef]
- Mehrabadi, M.H.R.; Saghafian, B.; Fashi, F.H. Assessment of residential rainwater harvesting efficiency for meeting non-potable water demands in three climate conditions. Resour. Conserv. Recycl. 2013, 73, 86–93. [Google Scholar] [CrossRef]
- Toosi, A.S.; Danesh, S.; Tousi, E.G.; Doulabian, S. Annual and seasonal reliability of urban rainwater harvesting system under climate change. Sustain. Cities Soc. 2020, 63, 102427. [Google Scholar] [CrossRef]
- Zhang, S.; Zhang, J.; Yue, T.; Jing, X. Impacts of climate change on urban rainwater harvesting systems. Sci. Total Environ. 2019, 665, 262–274. [Google Scholar] [CrossRef]
- Alamdari, N.; Sample, D.J.; Liu, J.; Ross, A. Assessing climate change impacts on the reliability of rainwater harvesting systems. Resour. Conserv. Recycl. 2018, 132, 178–189. [Google Scholar] [CrossRef]
- Gwoździej-Mazur, J.; Jadwiszczak, P.; Kaźmierczak, B.; Kózka, K.; Struk-Sokołowska, J.; Wartalska, K.; Wdowikowski, M. The impact of climate change on rainwater harvesting in households in Poland. Appl. Water Sci. 2022, 12, 15. [Google Scholar] [CrossRef]
- Fewkes, A.; Butler, D. Simulating the performance of rainwater collection and reuse systems using behavioural models. Build. Serv. Eng. Res. Technol. 2000, 21, 99–106. [Google Scholar] [CrossRef]
- Alim, M.A.; Rahman, A.; Tao, Z.; Samali, B.; Khan, M.M.; Shirin, S. Feasibility analysis of a small-scale rainwater harvesting system for drinking water production at Werrington, New South Wales, Australia. J. Clean. Prod. 2020, 270, 122437. [Google Scholar] [CrossRef]
- Rahman, A.; Keane, J.; Imteaz, M.A. Rainwater harvesting in Greater Sydney: Water savings, reliability and economic benefits. Resour. Conserv. Recycl. 2012, 61, 16–21. [Google Scholar] [CrossRef]
- Preeti, P.; Rahman, A. A Case Study on Reliability, Water Demand and Economic Analysis of Rainwater Harvesting in Australian Capital Cities. Water 2021, 13, 2606. [Google Scholar] [CrossRef]
- Imteaz, M.A.; Ahsan, A.; Naser, J.; Rahman, A. Reliability analysis of rainwater tanks in Melbourne using daily water balance model. Resour. Conserv. Recycl. 2011, 56, 80–86. [Google Scholar] [CrossRef]
- Hajani, E.; Rahman, A. Rainwater utilization from roof catchments in arid regions: A case study for Australia. J. Arid Environ 2014, 111, 35–41. [Google Scholar] [CrossRef]
- Palla, A.; Gnecco, I.; Lanza, L.G. Non-dimensional design parameters and performance assessment of rainwater harvesting systems. J. Hydrol. 2011, 401, 65–76. [Google Scholar] [CrossRef]
- Hajani, E.; Rahman, A. Reliability and cost analysis of a rainwater harvesting system in peri-urban regions of Greater Sydney, Australia. Water 2014, 6, 945–960. [Google Scholar] [CrossRef]
- Bashar, M.Z.I.; Karim, M.R.; Imteaz, M.A. Reliability and economic analysis of urban rainwater harvesting: A comparative study within six major cities of Bangladesh. Resour. Conserv. Recycl. 2018, 133, 146–154. [Google Scholar] [CrossRef]
- Imteaz, M.A.; Ahsan, A.; Shanableh, A. Reliability analysis of rainwater tanks using daily water balance model: Variations within a large city. Resour. Conserv. Recycl. 2013, 77, 37–43. [Google Scholar] [CrossRef]
- Khan, Z.; Alim, M.A.; Rahman, M.M.; Rahman, A. A continental scale evaluation of rainwater harvesting in Australia. Resour. Conserv. Recycl. 2021, 167, 105378. [Google Scholar] [CrossRef]
Publisher’s Note: MDPI stays neutral with regard to jurisdictional claims in published maps and institutional affiliations. |
© 2022 by the authors. Licensee MDPI, Basel, Switzerland. This article is an open access article distributed under the terms and conditions of the Creative Commons Attribution (CC BY) license (https://creativecommons.org/licenses/by/4.0/).